The Cube's Toolbox
Every Process Intelligence project runs in its own cube: a container that holds the project's data and a toolbox of process intelligence tools. The screens use those tools, the mindzie agent inside the project uses them to write reports, and your own agent can use them from outside. This page says what is in the toolbox and who can reach what.
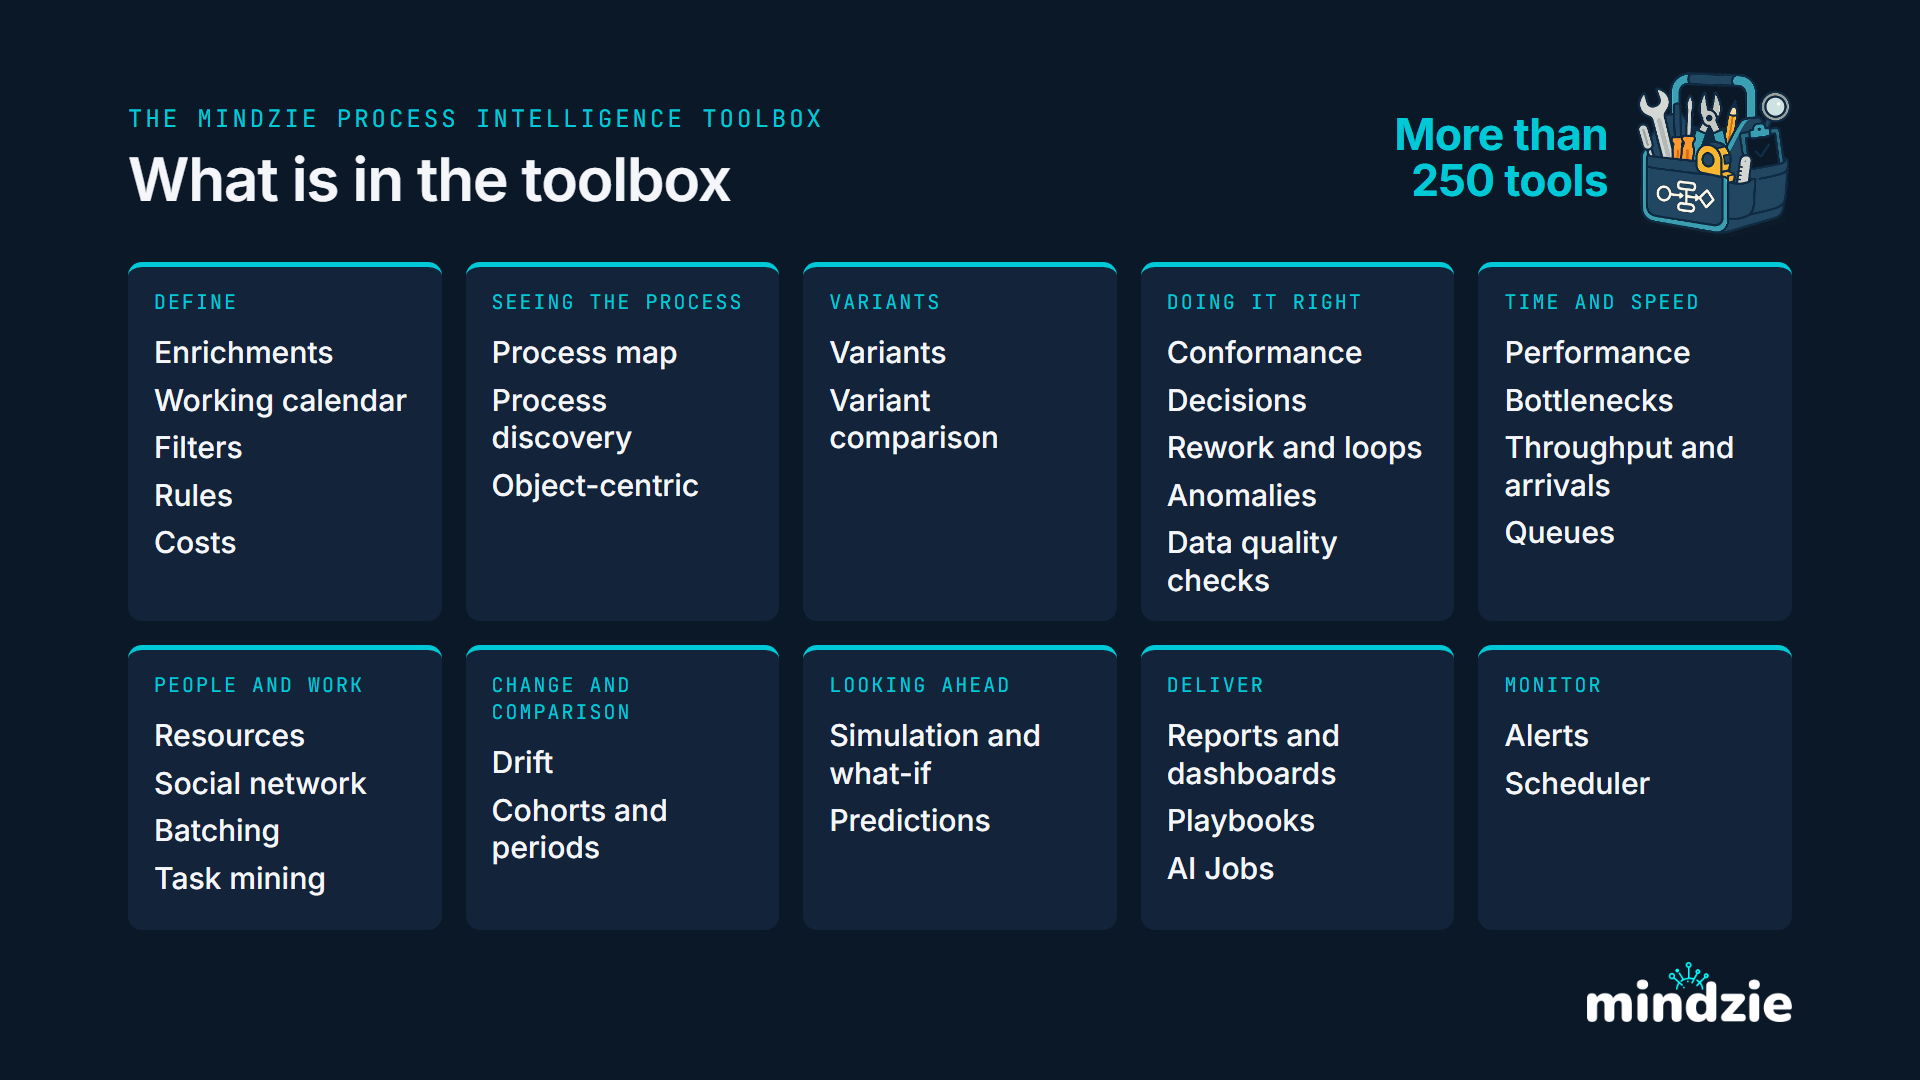
The count
403 tools, counted from the code rather than by hand.
One tool is one named thing a caller asks for and gets an answer from, or a change made by: a call on the project's API such as log.query or filters.create, or a function of the analysis libraries the project offers to a script. The same read reached two ways counts once. Not counted: the shapes the tools return, the data-analysis libraries that are not mindzie's own, the screens, and the report cards, which are prompts rather than tools.
| Where the tools are | Tools |
|---|---|
| Calls on the project's API, which your agent makes directly | 103 |
| Further reads on the project, from inside a script | 28 |
| Functions of the mindzie analysis libraries, from inside a script | 272 |
| All | 403 |
The ten groups
| Group | What it covers | Tools |
|---|---|---|
| Define | Loading data, the schema, event logs, enrichments, the working calendar, filters, rules and costs | 112 |
| Seeing the process | The process map, process discovery, the object-centric views, and the plain reads of the log they are drawn from | 64 |
| Variants | The paths cases take, and comparing one path with another | 7 |
| Doing it right | Conformance, decisions, rework and loops, anomalies, and data quality checks | 64 |
| Time and speed | Performance, bottlenecks, throughput and arrivals, and queues | 30 |
| People and work | Resources, the social network, batching and task mining | 5 |
| Change and comparison | Drift, and comparing cohorts and periods | 17 |
| Looking ahead | Simulation and what-if | 2 |
| Deliver | Reports and dashboards, playbooks and AI jobs: everything that turns an answer into something handed over | 102 |
| Monitor | Alerts and the scheduler | 0 |
Two groups are smaller than the picture suggests. Monitor has no tool yet: the picture names the group, and nothing is offered in it today. Looking ahead holds simulation and what-if; the Predictions screen is there for a person, but predictions are not yet offered to an agent as a tool.
Who can reach what
| Who | How | What they reach |
|---|---|---|
| A person | The project's screens | 83 of the tools have a screen where a person does the same thing - most of them in Define, where the settings you make on a screen are also calls an agent can make |
| Your own agent, from outside | The mz command line tool, with a key |
The 103 API calls directly. Every other tool by sending a short Python script that runs inside the project, where the data is: mz run for a quick run, or a job that publishes a report |
| The mindzie agent, inside | The same calls, and the scripts it writes | Everything in the toolbox - it is the agent that writes your reports |
So every tool is reachable from outside: the API calls directly, and the rest from a script your agent sends. Your Own Reports and JSON shows one such script.
| Group | API calls an agent makes directly | Tools with a screen |
|---|---|---|
| Define | 69 | 67 |
| Seeing the process | 10 | 3 |
| Variants | 2 | 2 |
| Doing it right | 0 | 3 |
| Time and speed | 0 | 0 |
| People and work | 0 | 0 |
| Change and comparison | 0 | 0 |
| Looking ahead | 0 | 0 |
| Deliver | 22 | 8 |
| Monitor | 0 | 0 |
Where a group shows no API calls, its tools are reached from a script - which is also how the mindzie agent reaches them when it writes a report. A tool is counted as having a screen only where the screen and the tool are one and the same in the code, so a 0 does not mean the group has no screen: Performance, for one, shows time and speed to a person.
The toolbox and the process context graph
The process context graph is built from these tools: 20 of them feed at least one part of it - the reads of the log, the directly-follows map, the variants, process discovery, decision mining and rule mining. The parts that are a reading of the data rather than a count, such as which endings count as a success, are the AI's judgement and say so.
The graph is a chosen set of what the toolbox can answer, not all of it. Anything else the toolbox answers, you can put in a report and a JSON file of your own: see Your Own Reports and JSON.
Next
- Connect Your Own Agent and Get the Process Context Graph - reach the toolbox from outside, step by step.
- Driving a Project from Your Own Agent - hand a project to your own agent.