Performance
Performance shows how long cases take and where the time goes: the waits between steps, the steps that are waited for the longest, and the work that is done more than once. Every figure says which cases it was measured over, so you can check it.
How to read it
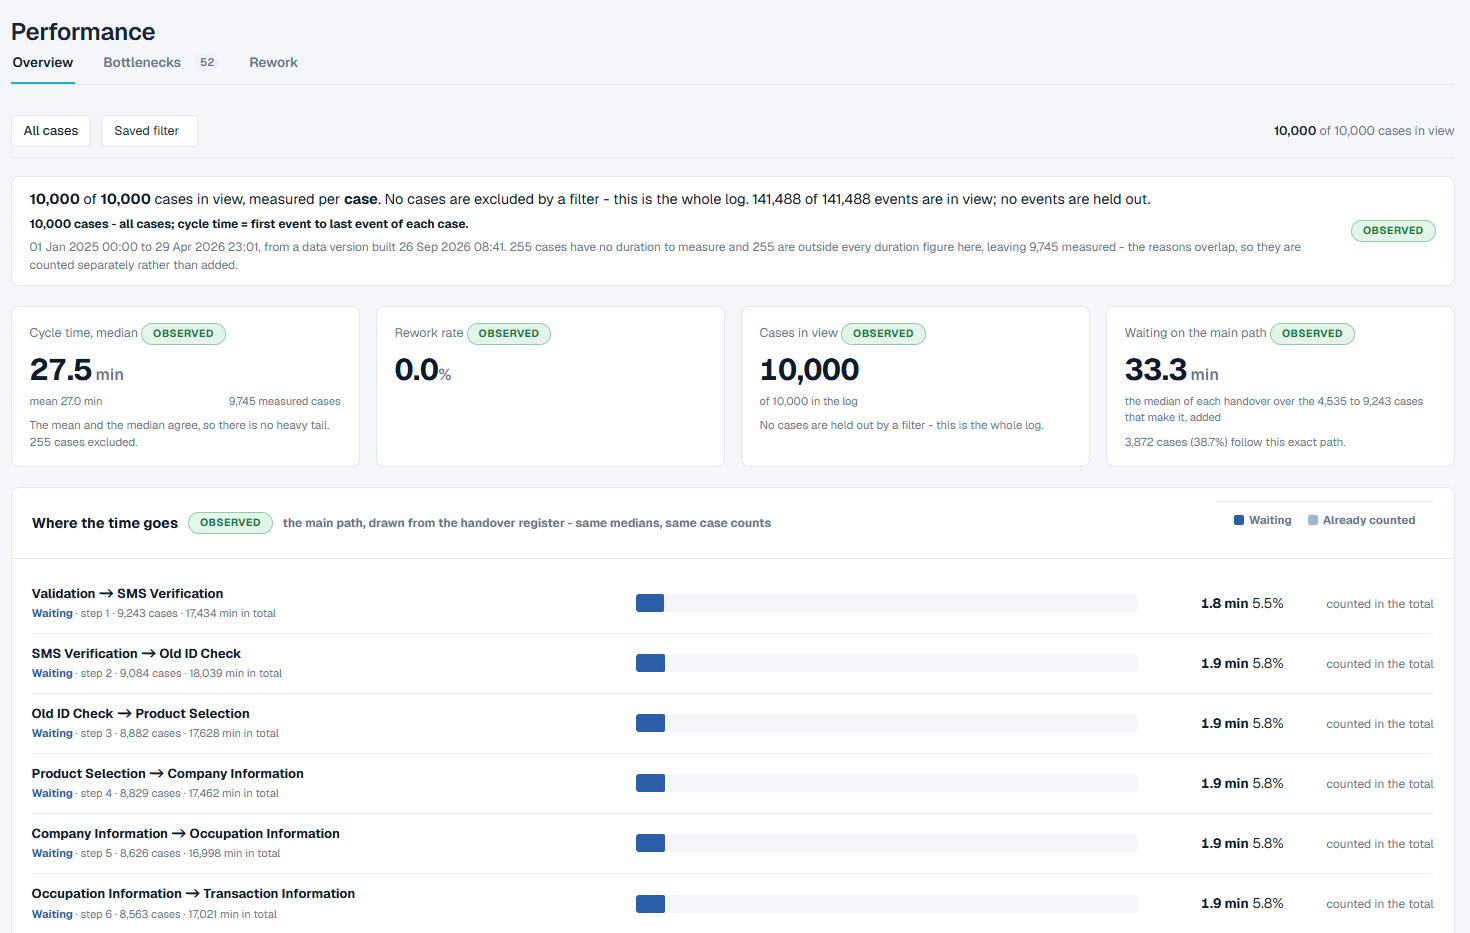
The top of the screen
- Three tabs: Overview, Bottlenecks and Rework. The number beside Bottlenecks is how many handoffs it lists; the number beside Rework is how many steps repeat, and is left off when none do.
- The filter bar says which cases are in view. All cases means nothing is filtered. Saved filter opens the filters saved on Filters. The count at the right is how many of the log's cases are in view.
What is being measured
The box under the filter bar says, in words, what every figure below it is measured over:
- how many cases are in view out of the cases in the log, and what one case is;
- how many events are in view, and how many a filter holds out;
- which cases are in view (a saved filter by name, or all cases), and that a cycle time is the time from a case's first event to its last;
- the dates of the first and last event, and when the data was built;
- how many cases have no duration to measure - a single event, or a first and last event at the same moment - and how many are measured.
The chip on each card
Each card carries a chip that says what kind of figure it is. Hover over the chip to read what it means. Observed means the figure is worked out from the log alone, with no setting and no assumption, so it is always shown. A card whose figures need a value set for the project, such as a target, is not shown at all until that value exists (see Not measured on this project).
The Overview tab
| Card | What it shows |
|---|---|
| Cycle time, median | The median time from first event to last, with the mean and how many cases were measured. A line under it says whether a few very long cases pull the mean up. |
| Rework rate | The share of cases in view that repeat at least one step. |
| Cases in view | How many cases are in view, out of the cases in the log. |
| Waiting on the main path | The waiting along the most common path through the process. It adds up the median wait of each handoff on that path, and says how many cases follow that exact path. |
| Where the time goes | The most common path, one row per handoff. Each row gives its step number, how many cases make it, its total wait, its median wait and its share of the path's waiting. Handoffs that hold no measurable wait are folded away at the bottom. |
| The handoffs that hold the time | The two handoffs with the most waiting in total. Each gives how many cases make it, the total wait, its share of all the waiting in view, and the median gap. |
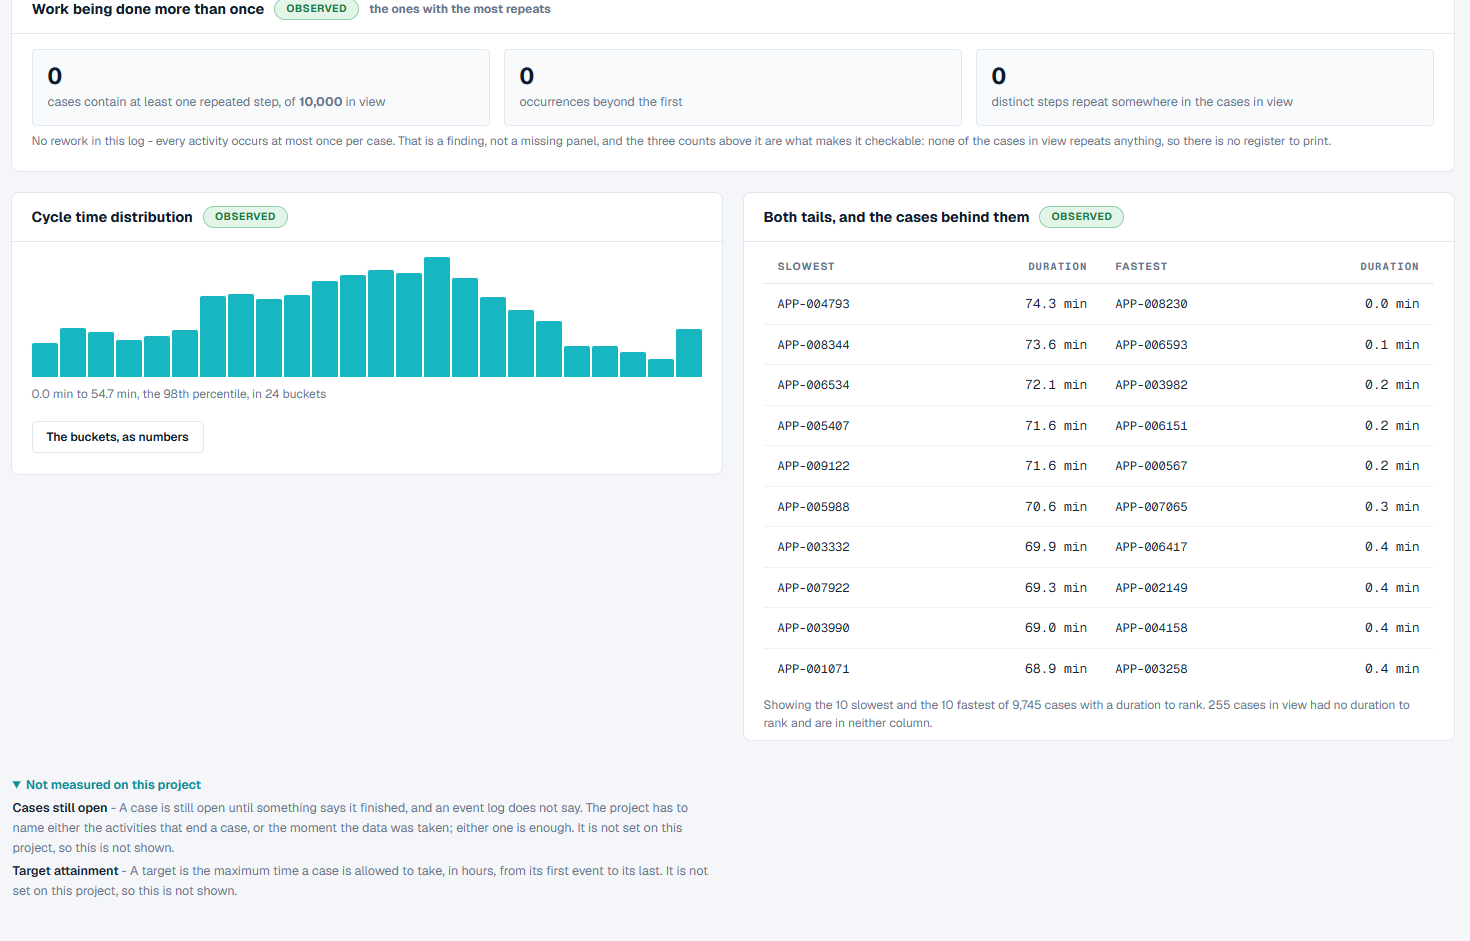
| Work being done more than once | How many cases repeat at least one step, how many extra occurrences there are, and how many different steps repeat, with the three steps that repeat most. |
| Cycle time distribution | A histogram of case durations, up to the 98th percentile. The buckets, as numbers opens the same thing as a table. |
| Both tails, and the cases behind them | The ten slowest and the ten fastest cases side by side, with their durations. |
Durations are shown in a unit that suits the log - minutes, hours or days.
Not measured on this project
At the bottom of the Overview, Not measured on this project lists every card that is not shown, and why. Two cards need a setting for the project:
- Target attainment - how many cases finish within a target. It needs a target: the longest a case is allowed to take, in hours, from its first event to its last.
- Cases still open - how many cases have not finished yet. These are left out of every duration, because a case still running has not taken its full time. It needs a completion rule: the activities that end a case, or the moment the data was taken.
The Bottlenecks tab
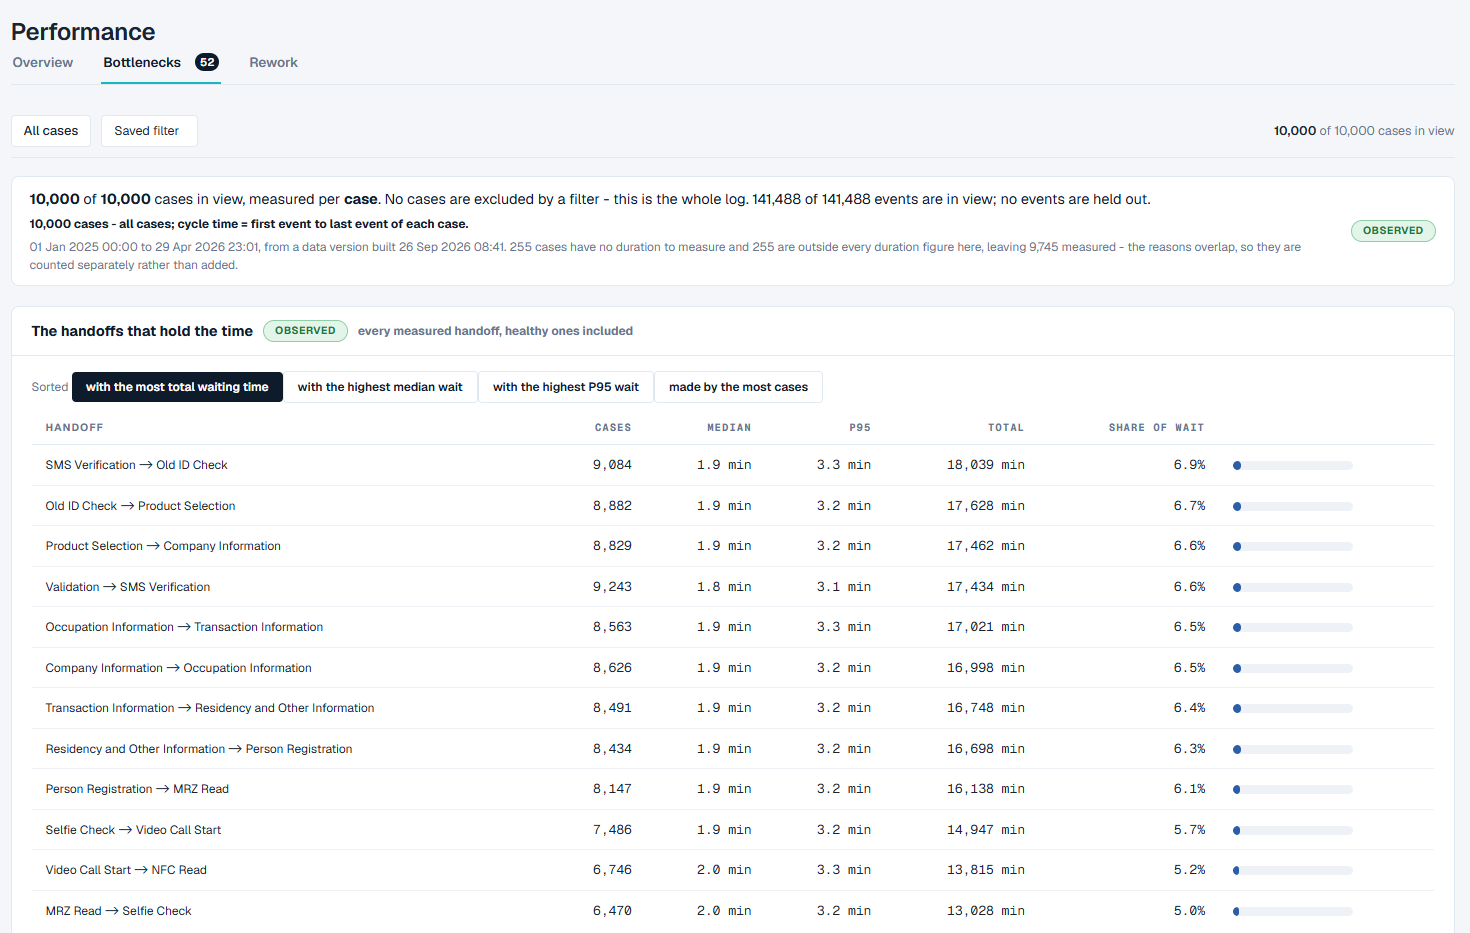
Two tables:
- The handoffs that hold the time - every handoff from one step to the next, healthy ones included, with how many cases make it, the median and 95th-percentile (P95) wait, the total wait and its share of all the waiting.
- Bottleneck register - the same waiting, gathered by the step that was waited for, with how often it happens, the median and 90th-percentile (P90) wait, and its share of all the waiting.
Each table can be sorted with the buttons beside Sorted - for example with the most total waiting time or with the highest median wait.
The Rework tab
Work being done more than once lists every step that runs more than once in a case: how many cases repeat it, how many extra occurrences there are, and its share of all the repeats. If no step repeats, the tab says so: that is a finding about your log, not a missing panel.
What you can do
Measure only some of the cases
- Click Saved filter in the filter bar.
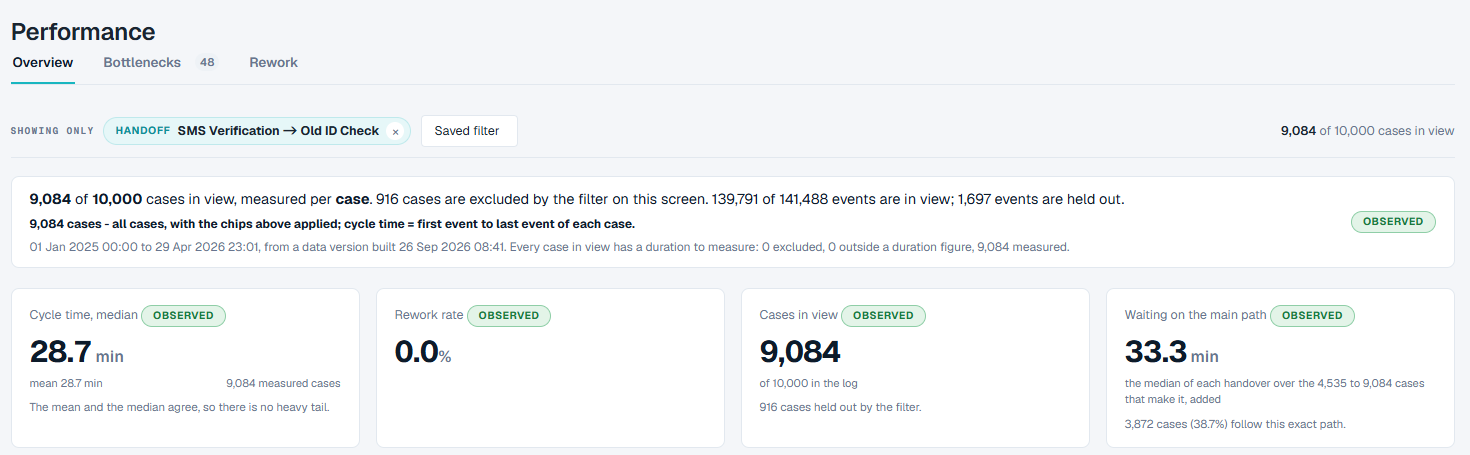
- Pick a filter. Every figure is measured again over those cases, and the box at the top says which filter is on.
- To go back to every case, open Saved filter and pick None.
Look at the cases behind a slow handoff
- On the Overview, find the handoff under The handoffs that hold the time.
- Click Filter to this handoff. The screen now measures only the cases that make that handoff, and the filter bar shows it under Showing only.
- Click the x on the handoff to go back to all cases.
Look at one step that is waited for
- Open the Bottlenecks tab.
- Click a row in Bottleneck register. The screen now measures only the cases that contain that step. Take it to beside the filter opens the same cases on the map or the variants.
See every handoff or every repeated step
- Click See the whole register on the Overview card, or open the Bottlenecks or Rework tab.
Open a single case
- Click a case under Both tails, and the cases behind them.
Good to know
- Every figure has its base. The box at the top is the base every share on the screen is taken from. A report that picked different cases, or measured between two other steps, will give a different number - and each says which cases it used.
- Cases with no duration are counted, not dropped. A case with a single event, or with its first and last event at the same moment, cannot have a duration. It is left out of every duration figure, and the box at the top says how many there are.
- Waiting on the main path is not the median cycle time. It adds up the median of each handoff on the most common path, and describes only the cases that follow that exact path.
- Target attainment and Cases still open need project settings. Until a target and a completion rule are set for the project, the two cards are listed under Not measured on this project, with no figure of any kind in their place. They cannot be set from a screen in this version.
- A saved filter that no longer exists. If the filter you last used here has since been deleted, the screen measures all cases and says so.