Getting the Process Context Graph
The process context graph is one JSON document that describes how your process actually runs, built from your project's event log: what a case is, how cases start and end, the steps and the hand-offs between them, the paths cases take, the points where they split and the rules that explain the split, what goes wrong, how long things take, and who does what. Every part says how much data it rests on.
"Process context graph" is a name the market uses with no standard behind it. This is what mindzie means by it: a default we define, made from things the project can already answer, put in one document with a fixed shape so that an agent can load it and a person can check it. The project can answer a great deal more than the graph holds; Your Own Reports and JSON is about that.
Two kinds of agent meet over the graph. The agent inside - the mindzie agent that runs in the project - builds it, when the Process Context Graph report is run. An agent outside - your own coding agent, working from your machine - asks the project for it in one call. Connect Your Own Agent and Get the Process Context Graph takes you through it from nothing, with the picture of how the two fit together.
What it is for
- An agent loads it before it works on your process, so that it knows the real step names, the normal path, the decision points and the exceptions, without discovering them one question at a time.
- A person checks it. The same content is written out as a report on the Reports screen, with a process map, a decision table for every explained decision, and the evidence beside every statement. The report's tables and the JSON are written from the same data, so the two cannot say different things.
It is a description and only a description. It recommends nothing, and it does not say what anybody is allowed to do.
Get it in two steps
Step 1 - Run the Process Context Graph report once
On the screen: open the project's Reports screen, click Create report on the Process Context Graph card, then click Start. See Reports.
From your own agent: with the project started and your data loaded, the agent finds the card and starts it:
mz reports cards
mz jobs create-agent --card process-context-graph
mz jobs run --slug process-context-graph
mz jobs status --slug process-context-graph
mz jobs create-agent --card answers the job's slug, which the next two commands take; on a project where the card has never run it is process-context-graph. The run is an AI job: it uses your project's AI credits. When it finishes, the report publishes itself on the Reports screen like any other.
Expect to wait. On a log of 1.6 million events and about 250,000 cases the run took 45 minutes, so plan for up to an hour on a log that size. mz jobs status says running until the moment it says done; there is no progress in between. Jobs in a project run one at a time, so anything else started meanwhile waits for it.
Running it again later publishes the next version of the same report. The earlier version, and its JSON, stay exactly as they were.
Step 2 - Fetch the graph in one call
mz reports context-graph > process-context-graph.json
That writes the project's current process context graph to the file as JSON: the newest published document that names the shape mindzie.process-context-graph. Nothing is computed again and no AI is used - the call reads the report that is already published. The same document is the file process-context-graph.json that the card's report carries, so mz reports attachment --slug process-context-graph --name process-context-graph.json returns exactly the same bytes.
If the report has never been run in this project, the call refuses and names the commands that make one (Step 1). It never starts the run by itself, because that would spend your AI credits without being asked.
Every step, from downloading the tool to checking the file against the definition, is on Connect Your Own Agent and Get the Process Context Graph.
What a real one looks like
The graph below was made by the Process Context Graph card on a real purchase-to-pay log: 1,593,532 events in 251,658 cases, one case per purchase order item. Its JSON is about 300 KB and holds 44 steps, 188 hand-offs, 16 variants, 25 decision points, 48 sequence rules, 48 exceptions, 4 escalations, 25 policies, 20 assumptions and 7 open questions. It passes the definition at the end of this page.
Drawn as a picture
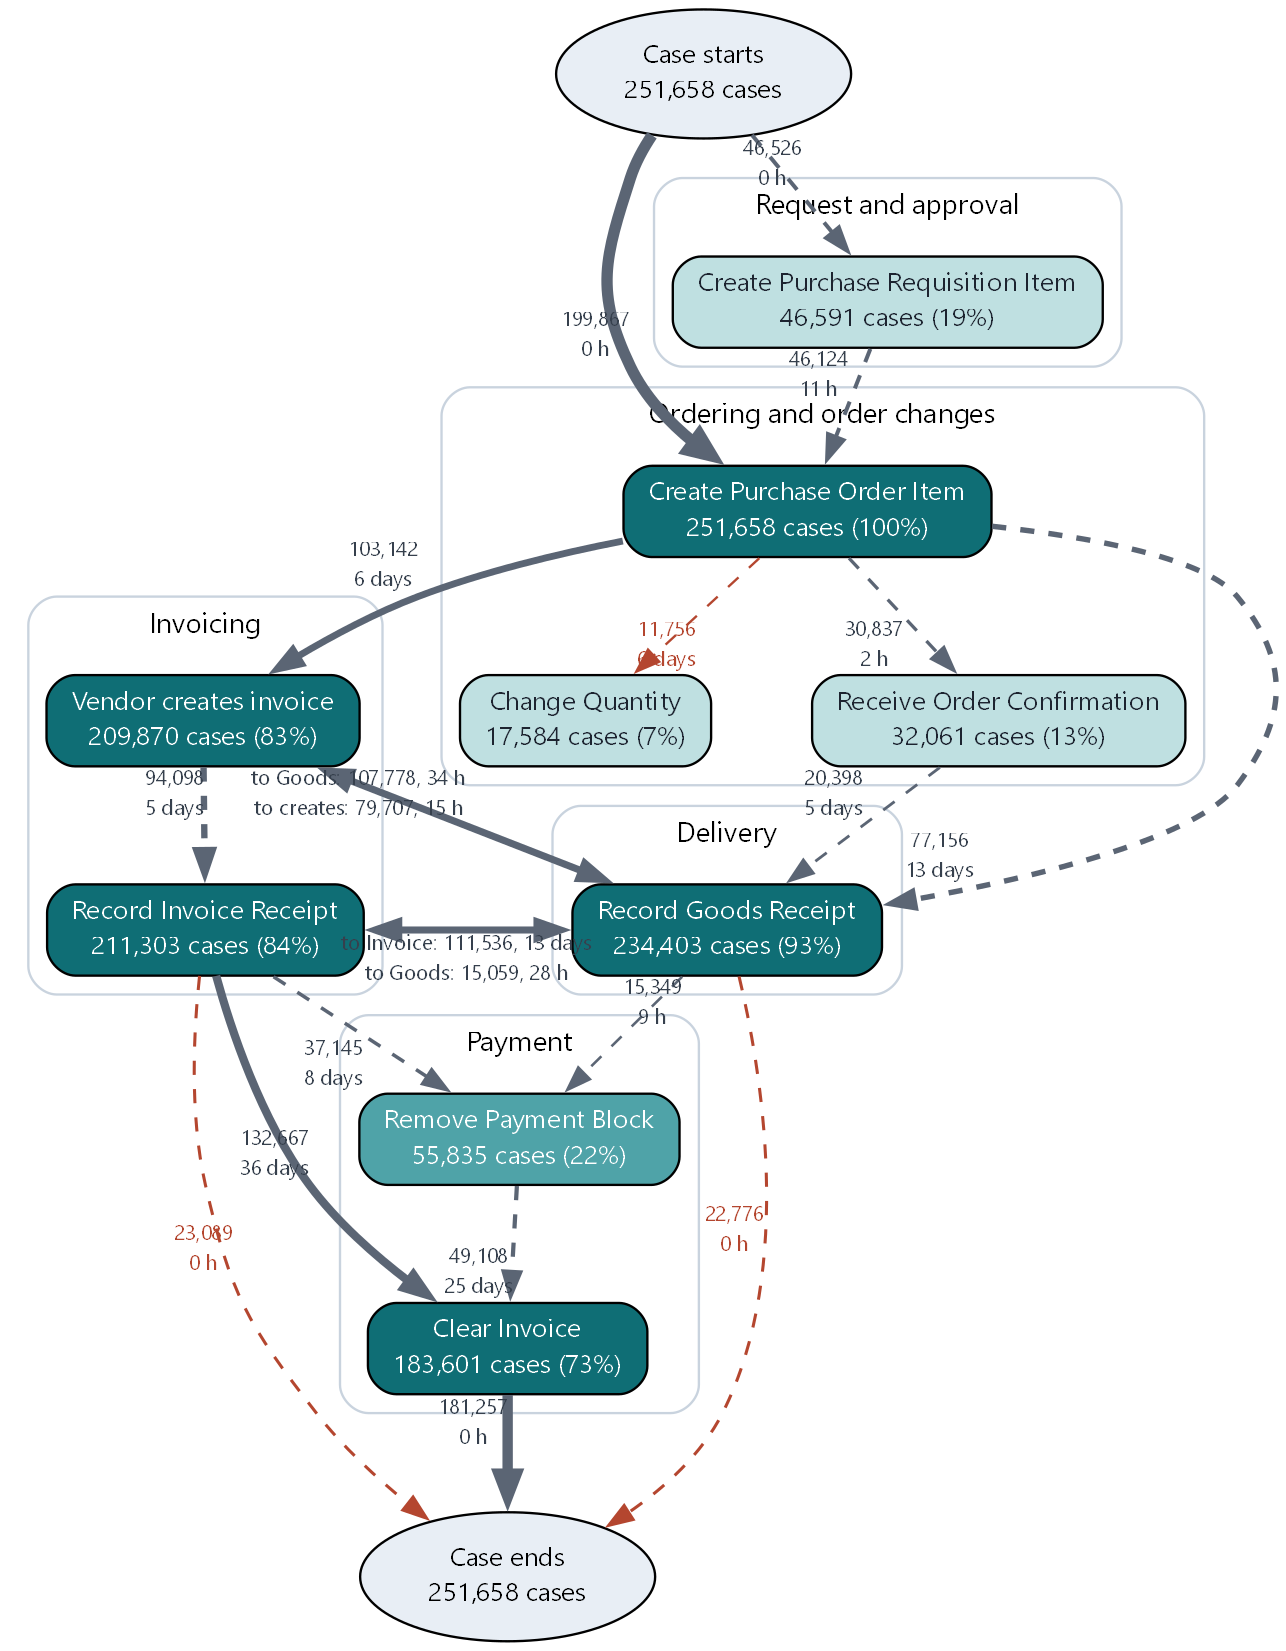
This picture is drawn straight from the JSON, by a short script, to show what is in it. It shows the steps and the busiest hand-offs - each taken by at least 4 percent of cases - in the graph's own stages, with how many cases take each hand-off and the typical wait. Thick lines are the main flow, dashed lines other paths, and red dashed lines what the graph marks as exceptions. Read off it: 72 percent of items end with Clear Invoice, and the longest typical wait is from the invoice receipt to clearing it, 36 days.
The JSON, shortened
As the agent received it, with most lists cut to one entry and 14 of the 22 parts left out, as the last line says. Every claim carries its evidence: how many cases, out of how many, how it was measured, and how strong it is.
{
  "schema": "mindzie.process-context-graph",
  "schema_version": "1.0",
  "source": {
    "data_version": "v0001",
    "log_digest": "4804d5916fc0",
    "case_notion": "one purchase order line item (purchase order number plus item number)",
    "cases": 251658,
    "events": 1593532,
    "period_start": "2015-03-08",
    "period_end": "2020-04-09",
    "time_basis": "clock"
  },
  "success_criteria": [
    {
      "id": "sc:cleared",
      "statement": "The item is paid: the case ends with Clear Invoice.",
      "test": "last event of the case is Clear Invoice",
      "share_met": 0.7203,
      "evidence": {
        "cases": 181257,
        "of_cases": 251658,
        "share": 0.7203,
        "strength": "counted",
        "method": "direct count of cases whose last event is Clear Invoice"
      }
    }
  ],
  "outcomes": [
    {
      "id": "out:clear-invoice",
      "end_activity": "Clear Invoice",
      "kind": "success",
      "cases": 181257,
      "share": 0.7203
    },
    {
      "id": "out:record-invoice-receipt",
      "end_activity": "Record Invoice Receipt",
      "kind": "open",
      "cases": 23089,
      "share": 0.0917
    }
  ],
  "edges": [
    {
      "id": "edge:record-invoice-receipt>clear-invoice",
      "from": "act:record-invoice-receipt",
      "to": "act:clear-invoice",
      "kind": "normal",
      "cases": 132667,
      "share_of_from": 0.6575,
      "median_wait_hours": 865.617,
      "slow_wait_hours": 2479.663,
      "evidence": {
        "cases": 132667,
        "of_cases": 211303,
        "share": 0.6279,
        "strength": "counted",
        "method": "cases with this hand-off at least once, out of cases with the first step; shares of the first step count every visit"
      }
    }
  ],
  "decisions": [
    {
      "id": "dec:block-purchase-order-item",
      "at": "act:block-purchase-order-item",
      "branches": [
        {
          "to": "end",
          "cases": 163,
          "share": 0.3417
        },
        {
          "to": "act:delete-purchase-order-item",
          "cases": 131,
          "share": 0.2746
        },
        {
          "to": "act:reactivate-purchase-order-item",
          "cases": 111,
          "share": 0.2327
        },
        {
          "to": "act:change-quantity",
          "cases": 72,
          "share": 0.1509
        }
      ],
      "baseline_share": 0.3417,
      "rules": [
        {
          "id": "rule:block-purchase-order-item-1",
          "when": [
            "Spend area is not Trading & End Products",
            "Order value (EUR) is above 502.5 and up to 2884.5"
          ],
          "then": "act:delete-purchase-order-item",
          "cases": 113,
          "holds": 0.708,
          "evidence": {
            "cases": 80,
            "of_cases": 113,
            "share": 0.708,
            "strength": "weak",
            "method": "rule fitted by a decision tree on the hand-offs counted here; share is how often the next step matched"
          }
        }
      ],
      "explained": true,
      "evidence": {
        "cases": 477,
        "of_cases": 499,
        "share": 0.6688,
        "strength": "weak",
        "method": "first visit of the step in each case; rules score 67% against 34% for always guessing the commonest next step; explained needs at least 10 points more"
      }
    }
  ],
  "policies": [
    {
      "id": "pol:create-purchase-order-item-record-goods-receipt-within-30-days",
      "kind": "service_level",
      "statement": "Possible service level, inferred: Create Purchase Order Item -> Record Goods Receipt within 30 days (88% of 74,809 cases finish inside it; 8.1% finish in the quarter of the limit just inside it, 4.0% just outside)",
      "threshold_hours": 720.0,
      "share_met": 0.8839,
      "evidence": {
        "cases": 66126,
        "of_cases": 74809,
        "share": 0.8839,
        "strength": "hypothesis",
        "method": "share of positive waits at or under the limit; a limit counts when at least half of the waits meet it and twice as many fall in the quarter just inside it as just outside it"
      }
    }
  ],
  "...": "and 14 more parts"
}
The parts
| Part | What it holds |
|---|---|
source |
Which data the graph was built from: the data version, which log was read, what a case is, the cases, events and period, working or clock time |
process |
What one case represents, and what the process appears to be for |
success_criteria |
How a successful case is recognised, and the share of cases that meets each test |
outcomes |
Every way a case ends, with its cases and share |
stages |
The stages a case moves through, and the activities in each |
nodes |
One entry per activity, plus the start and the end: cases, events, repeats, the typical time to the next step, roles |
edges |
One entry per hand-off: cases, share, the typical wait and the wait of the slowest cases |
variants |
The main path, the allowed variations, and the exception paths with at least one case in a hundred |
model |
A process model discovered from the paths, and the share of cases it accepts |
decisions |
Each point where cases split: the branches, and the if-then rules that explain the split, if any do |
sequence_rules |
Ordering rules that almost always hold, with the share of cases where each holds |
exceptions |
Repeated, skipped and out-of-order steps, rare activities and failed endings |
escalations |
Steps that appear mainly after a long wait or a failed attempt |
policies |
Time limits most cases stay inside, and the share that meets each |
roles |
Which roles do which activities, when the log records who did the work |
object_types, object_relations |
The kinds of object and how they relate, for an object-centric log |
evidence_levels |
The five strength labels, each defined once |
assumptions, open_questions |
What was decided before the work started, what could not be measured, and what a reader should look into |
Counts are whole numbers, shares are fractions from 0 to 1, and times are in hours. Every part is present in every graph; a list with nothing to say is empty rather than missing, and no value is ever null.
Some parts are counted by code - a second run on the same data gives the same number. Others are a reading of the data: what a case represents, which endings count as a success, where the stages are. The report says which is which.
How far to trust each part
Every part that makes a claim carries one evidence object - how many cases it rests on, how many it could apply to, the share where it holds, how it was measured - and a strength label:
| Label | Meaning |
|---|---|
counted |
A direct count from the log |
strong |
Holds in at least 95 percent of the cases it applies to, and rests on at least 100 cases |
moderate |
Holds in at least 80 percent, and rests on at least 30 cases |
weak |
Anything less |
hypothesis |
Read from activity names or timing, not tested as a rule |
Read the strength first: counted is a fact about the log; hypothesis is an idea worth checking.
The full definition
The shape is fixed and versioned. This is version 1.0, and a document that passes once passes forever; any change to the fields is a new version with its own schema file.
Download mindzie.process-context-graph-1.0.schema.json
The schema file is the whole shape, as a JSON Schema (draft-07) any validator reads. Every graph is checked against it when its report is published: a report whose graph does not have the shape is not published, and the reason names the part and what is wrong.
Next
- Connect Your Own Agent and Get the Process Context Graph - every step from downloading the tool to a checked JSON file.
- Your Own Reports and JSON - go beyond the default with reports and JSON files of your own, reached the same way.
- The Cube's Toolbox - the tools the graph is built from, and the rest of them.
- Driving a Project from Your Own Agent - mint a key and hand a project to your own agent.