Conformance
Conformance answers one question: does the process run the way it is meant to? It checks every case in view against two things - a process diagram, and the rules you wrote on Rules - and shows where cases leave them and how many do.
How to read it
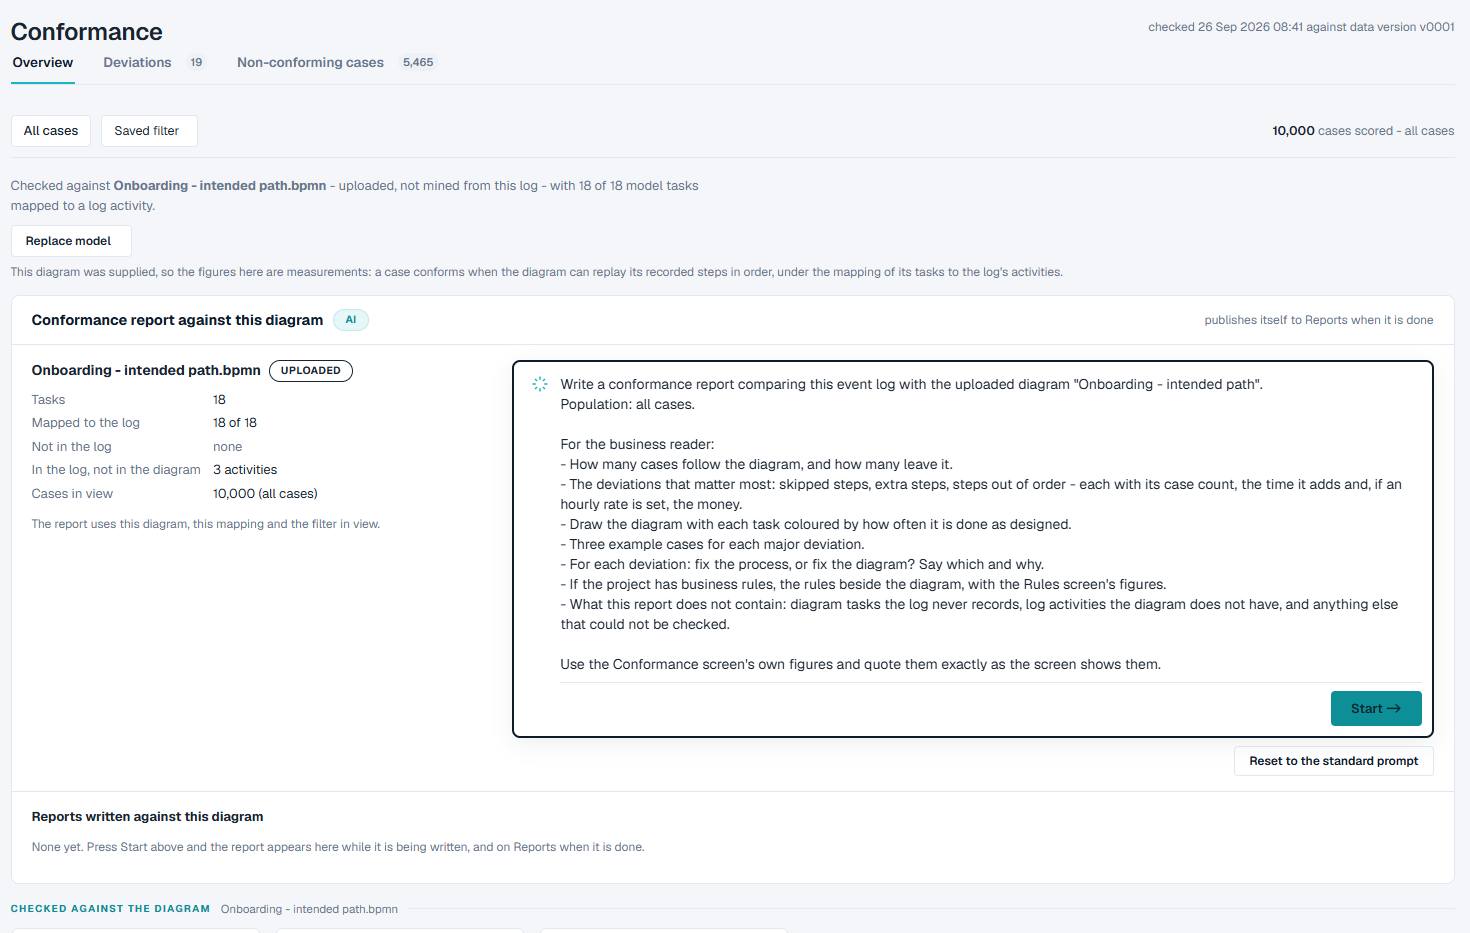
The top of the screen
- checked ... against data version ..., at the top right, says when the figures were worked out and on which version of the data.
- Three tabs: Overview, Deviations and Non-conforming cases. The number beside a tab is how many rows it holds.
- The filter bar says which cases are checked. All cases means nothing is filtered. Saved filter opens the filters saved on Filters. The count at the right says how many cases were scored, and with a saved filter on, how many events are in view and how many are held out.
Checked against
The first line says what the cases are compared with:
- Mined from this log - a diagram drawn from your own data. This is where every project starts.
- Uploaded, not mined from this log - a BPMN diagram you gave it, the way your business says the process should run. The line also says how many of the diagram's tasks are mapped to an activity in the log.
The button under the line is Compare against your own BPMN model, or Replace model once you have uploaded one. See What you can do.
One plain line under the button says how to read the figures. For a diagram drawn from the log, it warns that such a diagram cannot flag a deviation in its own log. For an uploaded diagram, it says a case conforms when the diagram can replay its recorded steps in order.
Conformance report
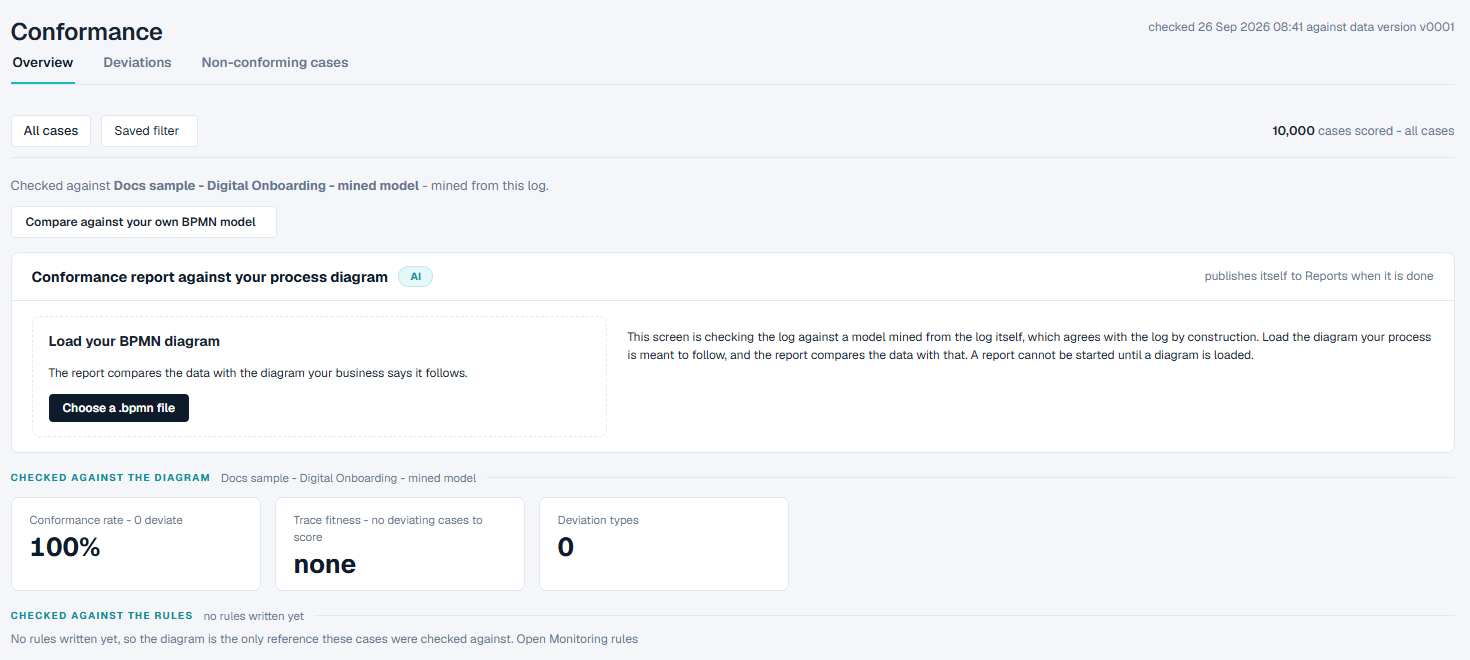
Under that line is a card for a conformance report written by AI. The report needs a diagram of yours to compare with:
- Before you upload a diagram, the card says Load your BPMN diagram, explains that a diagram drawn from the log agrees with the log, and offers Choose a .bpmn file instead of Start.
- With a diagram uploaded, the card shows the diagram's name, its number of tasks, how many are Mapped to the log, which are Not in the log, how many activities are In the log, not in the diagram, and the Cases in view. Beside it, the ask box already holds the standard question, and Start runs it. Underneath, Reports written against this diagram lists the reports already written, or says None yet.
Checked against the diagram
| Figure | What it means |
|---|---|
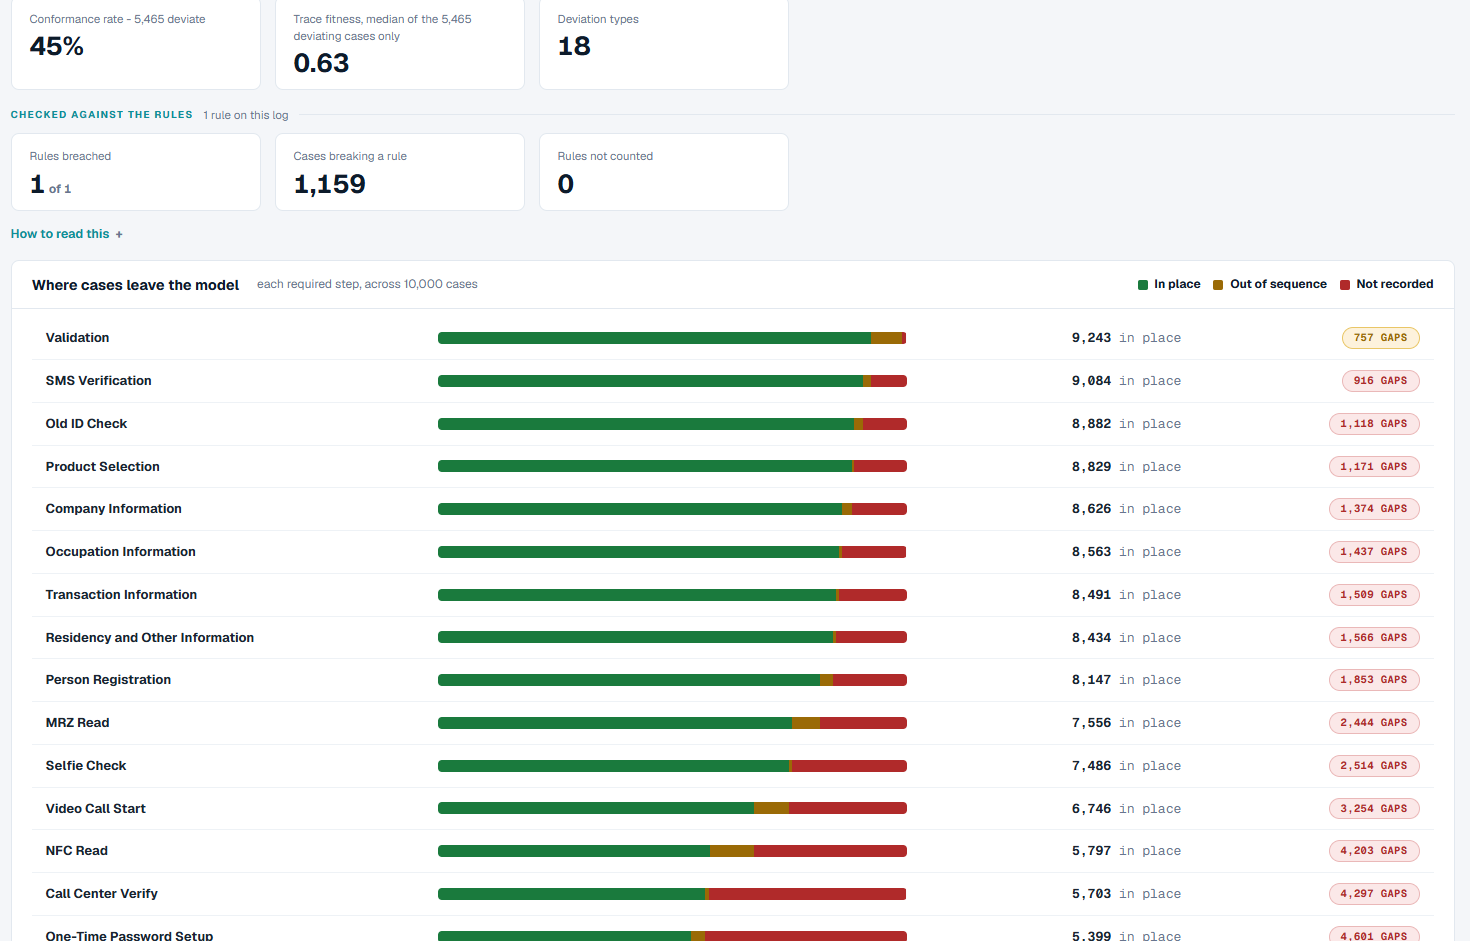
| Conformance rate | The share of cases that follow the diagram. The label says how many deviate. |
| Trace fitness | How close the deviating cases come to the diagram, from 0 to 1, where 1 is a perfect fit. It is the median of the deviating cases only; a case that follows the diagram is not scored. With no deviating case it reads none. |
| Deviation types | How many different ways cases leave the diagram. |
Checked against the rules
The heading says how many rules this log has. Where at least one rule could be counted:
| Figure | What it means |
|---|---|
| Rules breached | How many rules at least one case breaks, out of the rules counted. |
| Cases breaking a rule | How many cases break at least one rule. |
| Rules not counted | Rules that could not be checked on this log. When there are any, a Rules not counted card names each one with the reason. |
With no rules yet, one line says so - the diagram is then the only thing the cases were checked against - with a link to the Rules screen.
Where cases leave the model
One row for each step the diagram requires on every run. The bar splits the cases three ways: In place (green), Out of sequence (amber) and Not recorded (red). The figure at the right is how many cases have the step in place, and the chip counts the gaps, or says no gaps.
If every step of the diagram sits on a branch that some runs may skip, no step is required on every run, and the card says so instead of drawing the table. This is what you see with a diagram drawn from the log.
The deviations that matter, and the rule results
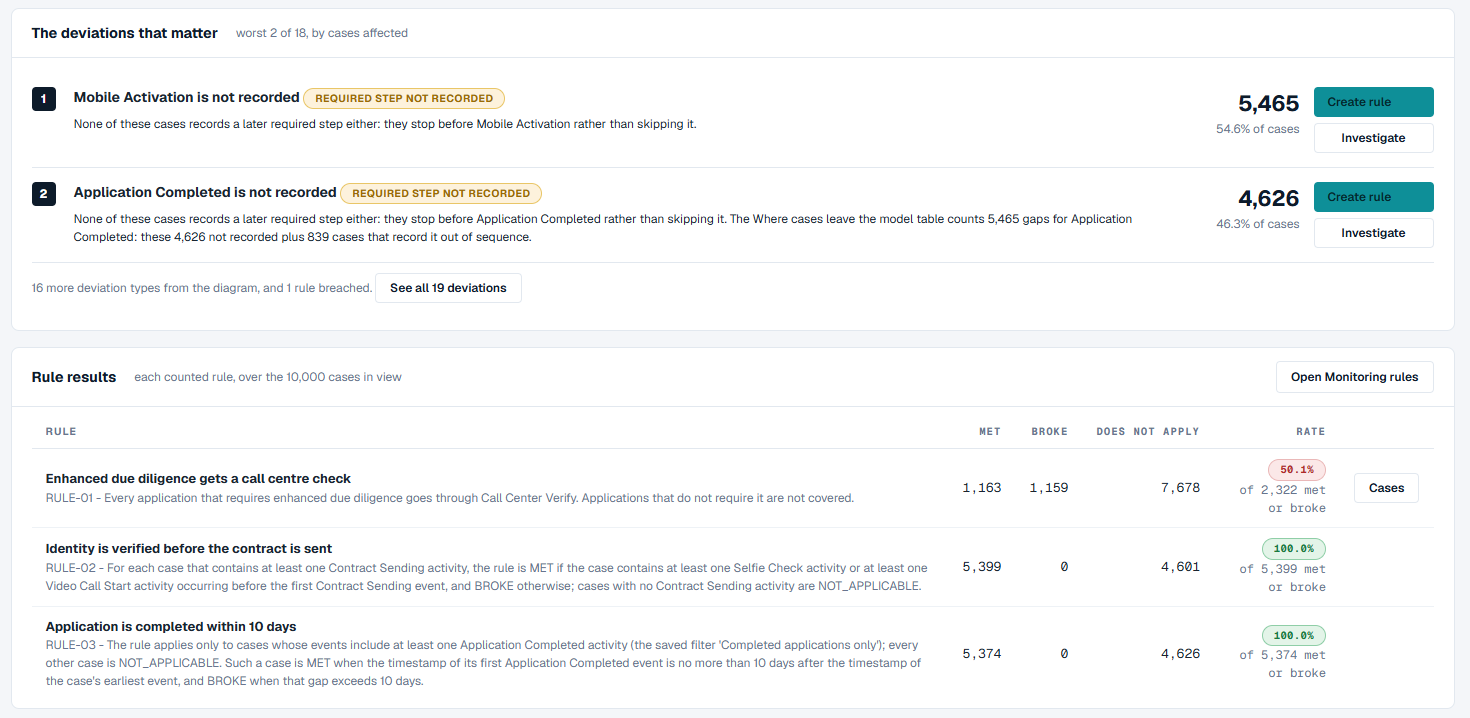
The deviations that matter shows the two deviations that affect the most cases, each with a short explanation, how many cases it affects and their share. A line below says how many more there are, with See all ... deviations to open the Deviations tab.
Rule results has one row per counted rule:
| Column | What it means |
|---|---|
| Met | Cases the rule applies to that keep it. |
| Broke | Cases the rule applies to that break it. |
| Does not apply | Cases the rule says nothing about. |
| Rate | Met, as a share of the cases that met or broke the rule. If no case met or broke it, it reads no rate. |
The Deviations tab
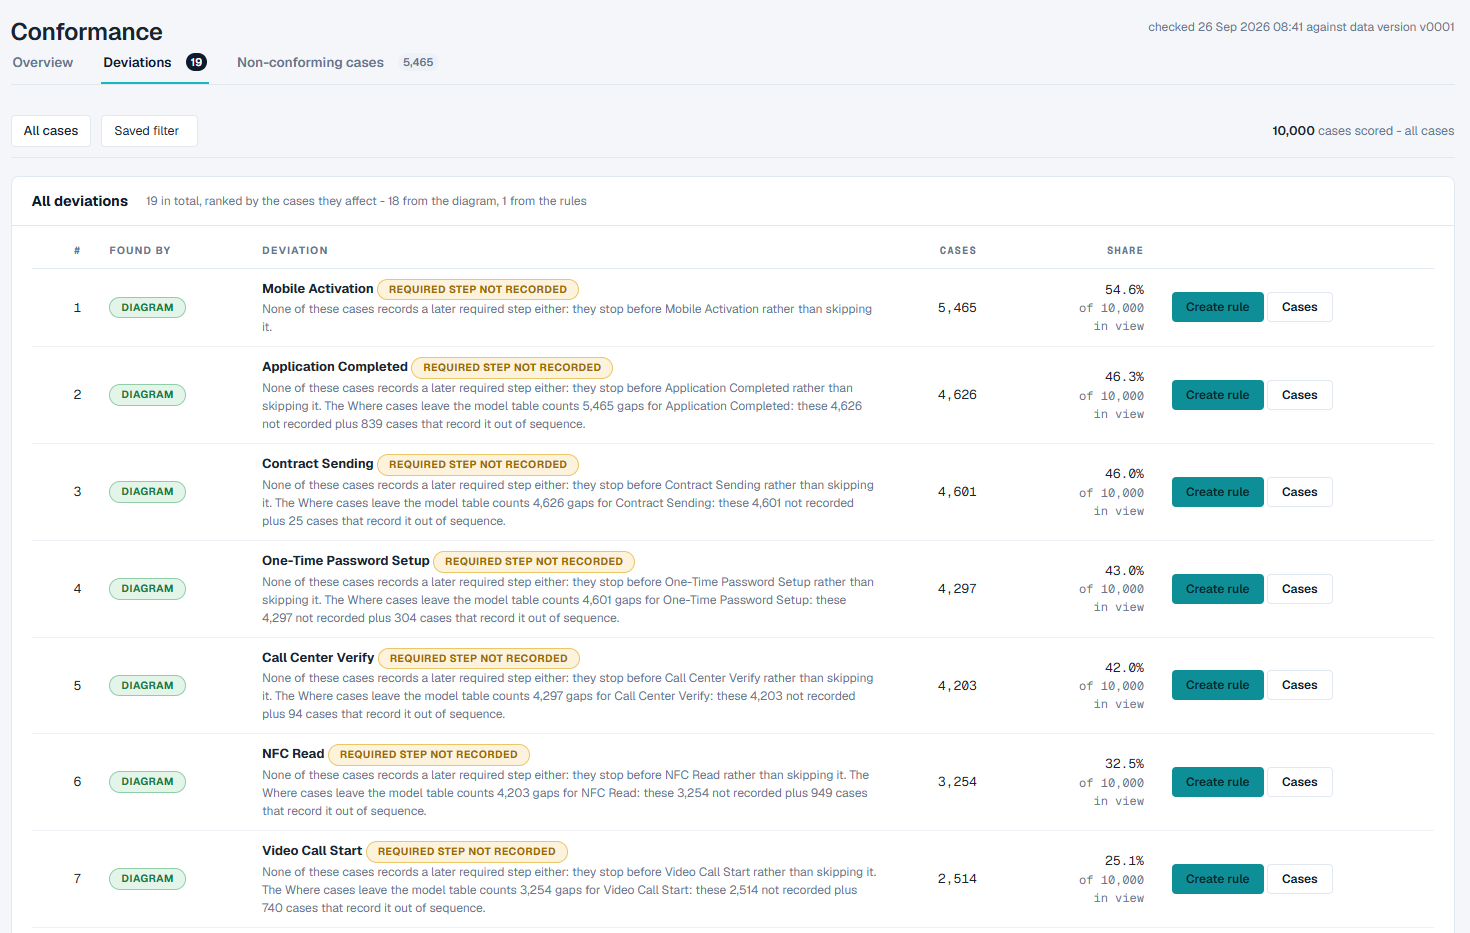
Every deviation from both checks in one list, ranked by how many cases it affects. Found by says which check found it: Diagram or Rule. Share says what it is a share of - the cases in view for a diagram deviation, and the cases that met or broke the rule for a rule.
The Non-conforming cases tab
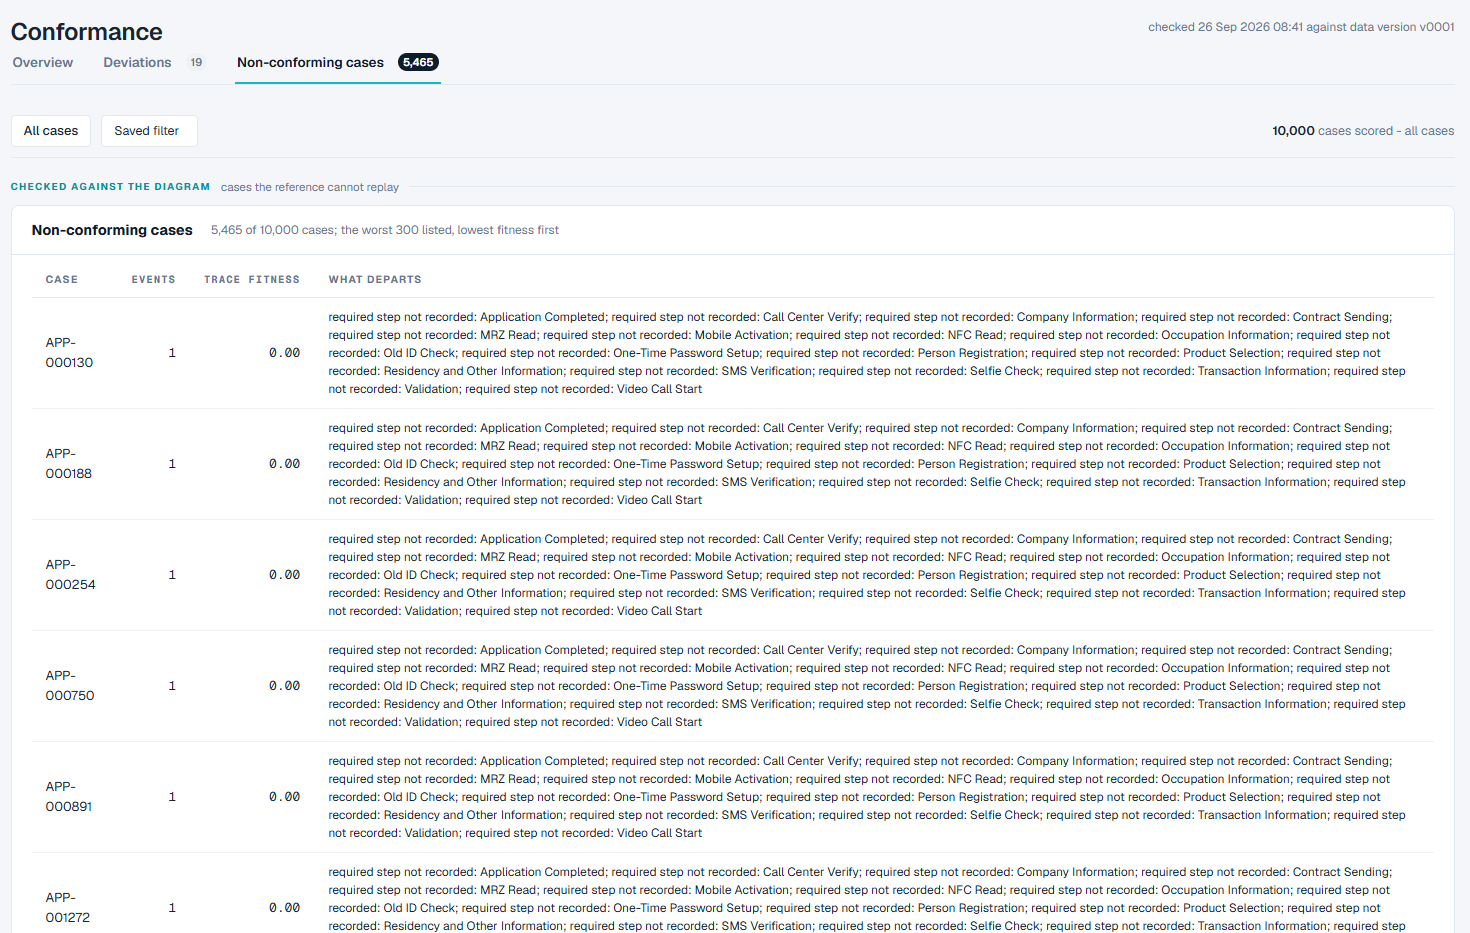
Two lists, one per check:
- Non-conforming cases - the cases the diagram cannot follow, lowest trace fitness first, with their number of events and what departs. The worst 300 are listed.
- Cases breaking a rule - the cases that break the most rules first, with which rules they break.
A case can be in both lists, so the two counts are not added together. Click a case to open it.
What you can do
Check only some of the cases
- Click Saved filter in the filter bar.
- Pick a filter. Every figure on the screen is worked out again for those cases.
- To go back to every case, open Saved filter again and pick None.
See the cases behind a deviation
- On the Overview, click Investigate beside one of the deviations that matter. On the Deviations tab, click Cases on its row.
- The cases appear under the list: how many there are, and the first 40 with their events, duration and case details.
For a rule, Cases takes you to the Non-conforming cases tab, and Open rule to the Rules screen.
Turn a deviation into a rule
- Click Create rule beside a deviation found by the diagram.
- A new rule opens on the Rules screen. Write it and save it there - see Rules.
From then on the rule is counted here.
Compare against your own diagram
- Click Compare against your own BPMN model (or Replace model).
- Under Or upload your own BPMN 2.0 file, choose your diagram and click Upload and use it. The file name must end in
.bpmn, and may hold only letters, digits, spaces and. _ ( ) -. A diagram saved as.xmlis refused: rename it to.bpmnfirst. - The diagram's tasks are matched to the log's activities by name, and every figure is worked out again against it. A line at the top confirms the upload: "Uploaded ... and made it the reference."
To go back to the diagram drawn from the log, click Replace model, choose The model this product mined from the log, and click Use this reference.
Write a conformance report
- Upload your diagram (above).
- Read the standard question in the box, and change it if you want to ask something else. Reset to the standard prompt puts the standard question back.
- Click Start. Nothing runs until you do.
- The report appears under Reports written against this diagram while it is being written, and is published to Reports when it is done.
Good to know
A diagram drawn from your own log finds nothing. It was drawn to fit the log, so every case follows it: the rate reads 100% and there are no deviations. The screen says this is not a finding about your process. To learn whether the process runs the way it should, upload the diagram your business says it follows, or write rules.
Tasks are matched to activities by name. The screen has no control to change how a diagram's tasks match the log's activities. The report card shows how many tasks are Mapped to the log and which are Not in the log. If a task is not matched, give it the exact name of the activity in your diagram tool, save the diagram, and upload it again. Or go back to the diagram drawn from the log.
Rules are written on Rules and counted here. Conformance does not create or change a rule; it counts, for every case, whether the case keeps it.
Two checks, two sets of figures. A diagram and a rule are different kinds of statement, so each keeps its own figures and says what its share is taken from. Do not add them together.
If the diagram cannot be read. If the uploaded diagram is no longer in the project, or cannot be read, the screen shows no figures and says why. The filter bar and Replace model are still there: upload the diagram again, or go back to the diagram drawn from the log.
A saved filter that no longer exists. If the filter you last used here has since been deleted, the screen checks all cases and says so.