Your First Project
This walk-through takes you from an event log file to a published report. It uses a flat event log - one row per event - because that is the most common starting point. Allow about fifteen minutes, most of it waiting for the project to start and the report to be written.
You need: a CSV or Excel file with one row per event, and at least three columns: which case the event belongs to, what happened, and when.
1. Open Process Intelligence
- Sign in to mindzieStudio and choose your tenant.
- On the welcome screen, find the Process Intelligence card and click Open.
You land on the projects page, which lists every project you can open.
2. Create a project
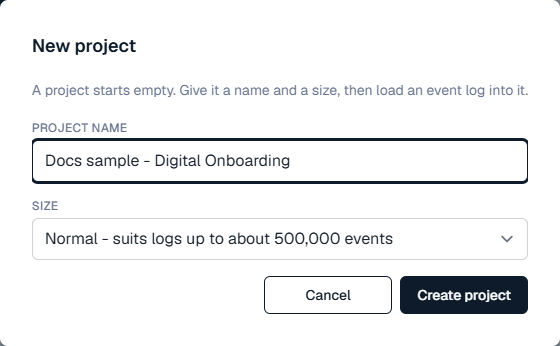
Click New project.
Type a Project name. The name is required.
Choose a Size:
- Normal suits logs up to about 500,000 events.
- Large is for bigger logs.
The size cannot be changed once the project is created, so choose with your data in mind.
Click Create project.
The project prepares its workspace, which usually takes a little over a minute, and then starts by itself. While it starts you see three steps tick off: starting the workspace, loading the event log, and opening the project. When it is ready, the project opens.
3. Load your file
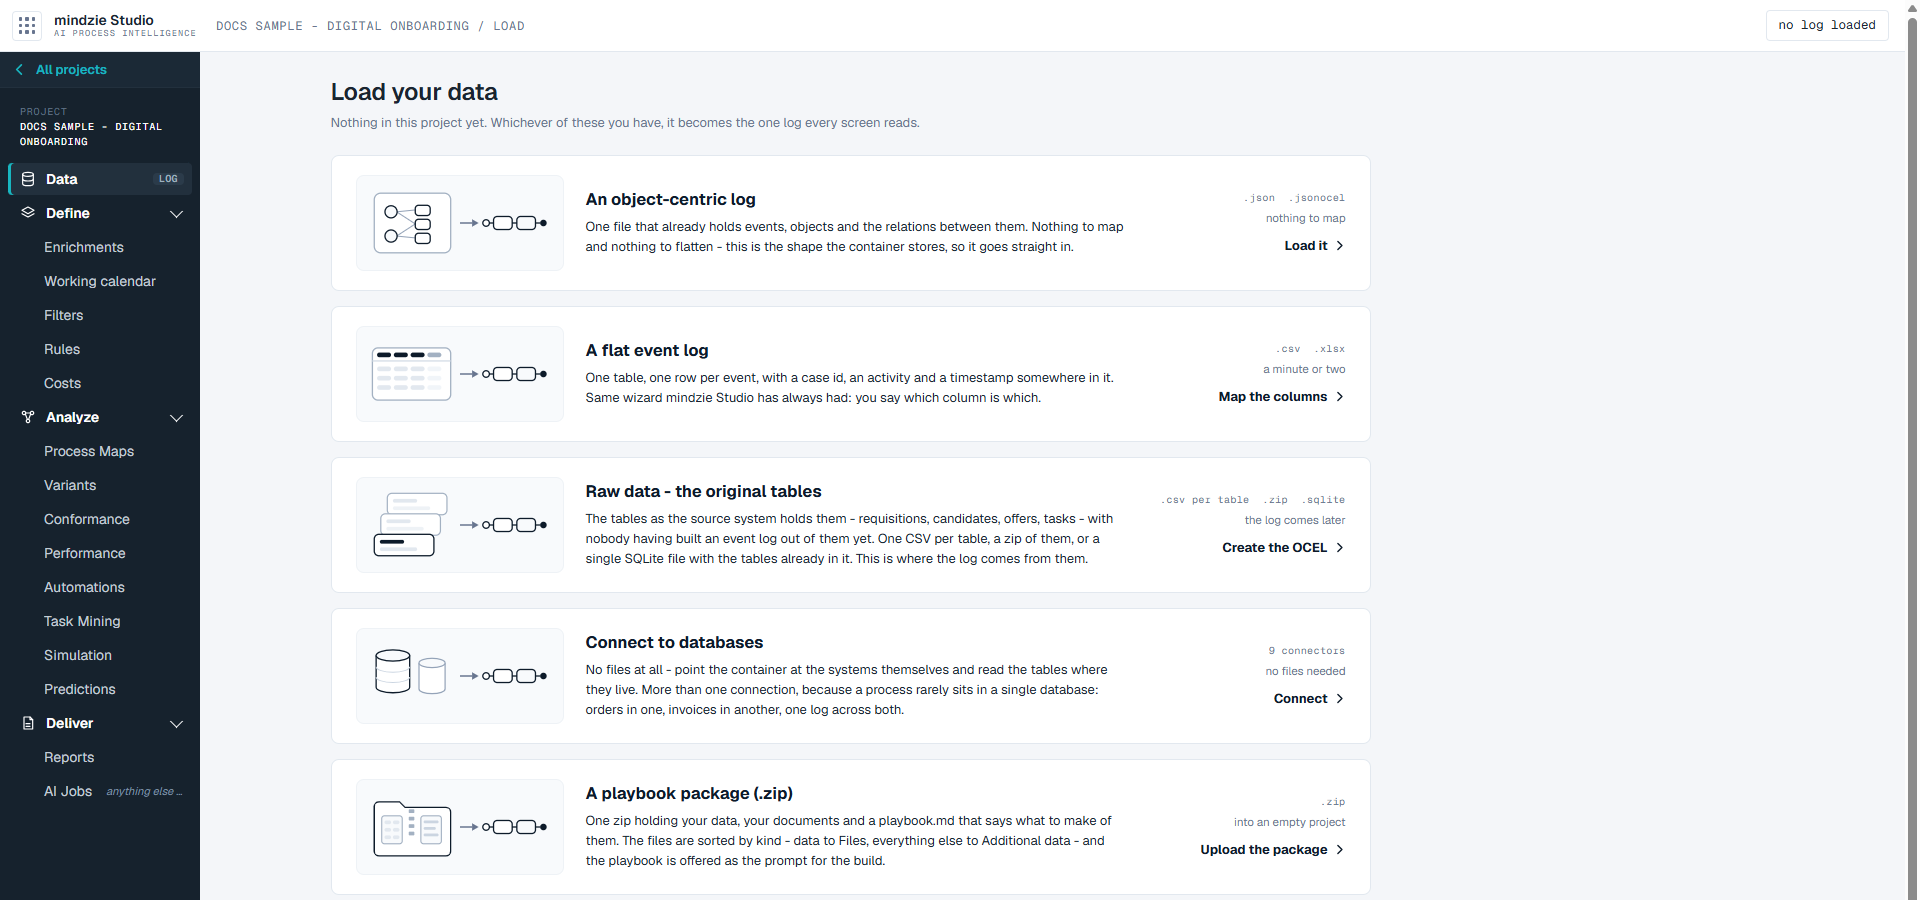
A new project is empty, so it opens on Load your data, which offers five ways to bring data in: an object-centric log, a flat event log, the original tables from your system, a connection to your databases, or a playbook package. A project holds one set of data; to load different data, create a new project.
For this walk-through:
Click the A flat event log card.
Drop your file anywhere on the page, or click Choose files. A file can be up to 2 GB.
The file is read as it arrives, and the page shows what it found: the delimiter, the encoding, whether there is a header row, and the columns. Nothing is written into the project yet. Discard everything throws the file away and leaves the project as it was.
Click Next - map the columns.
4. Map the columns
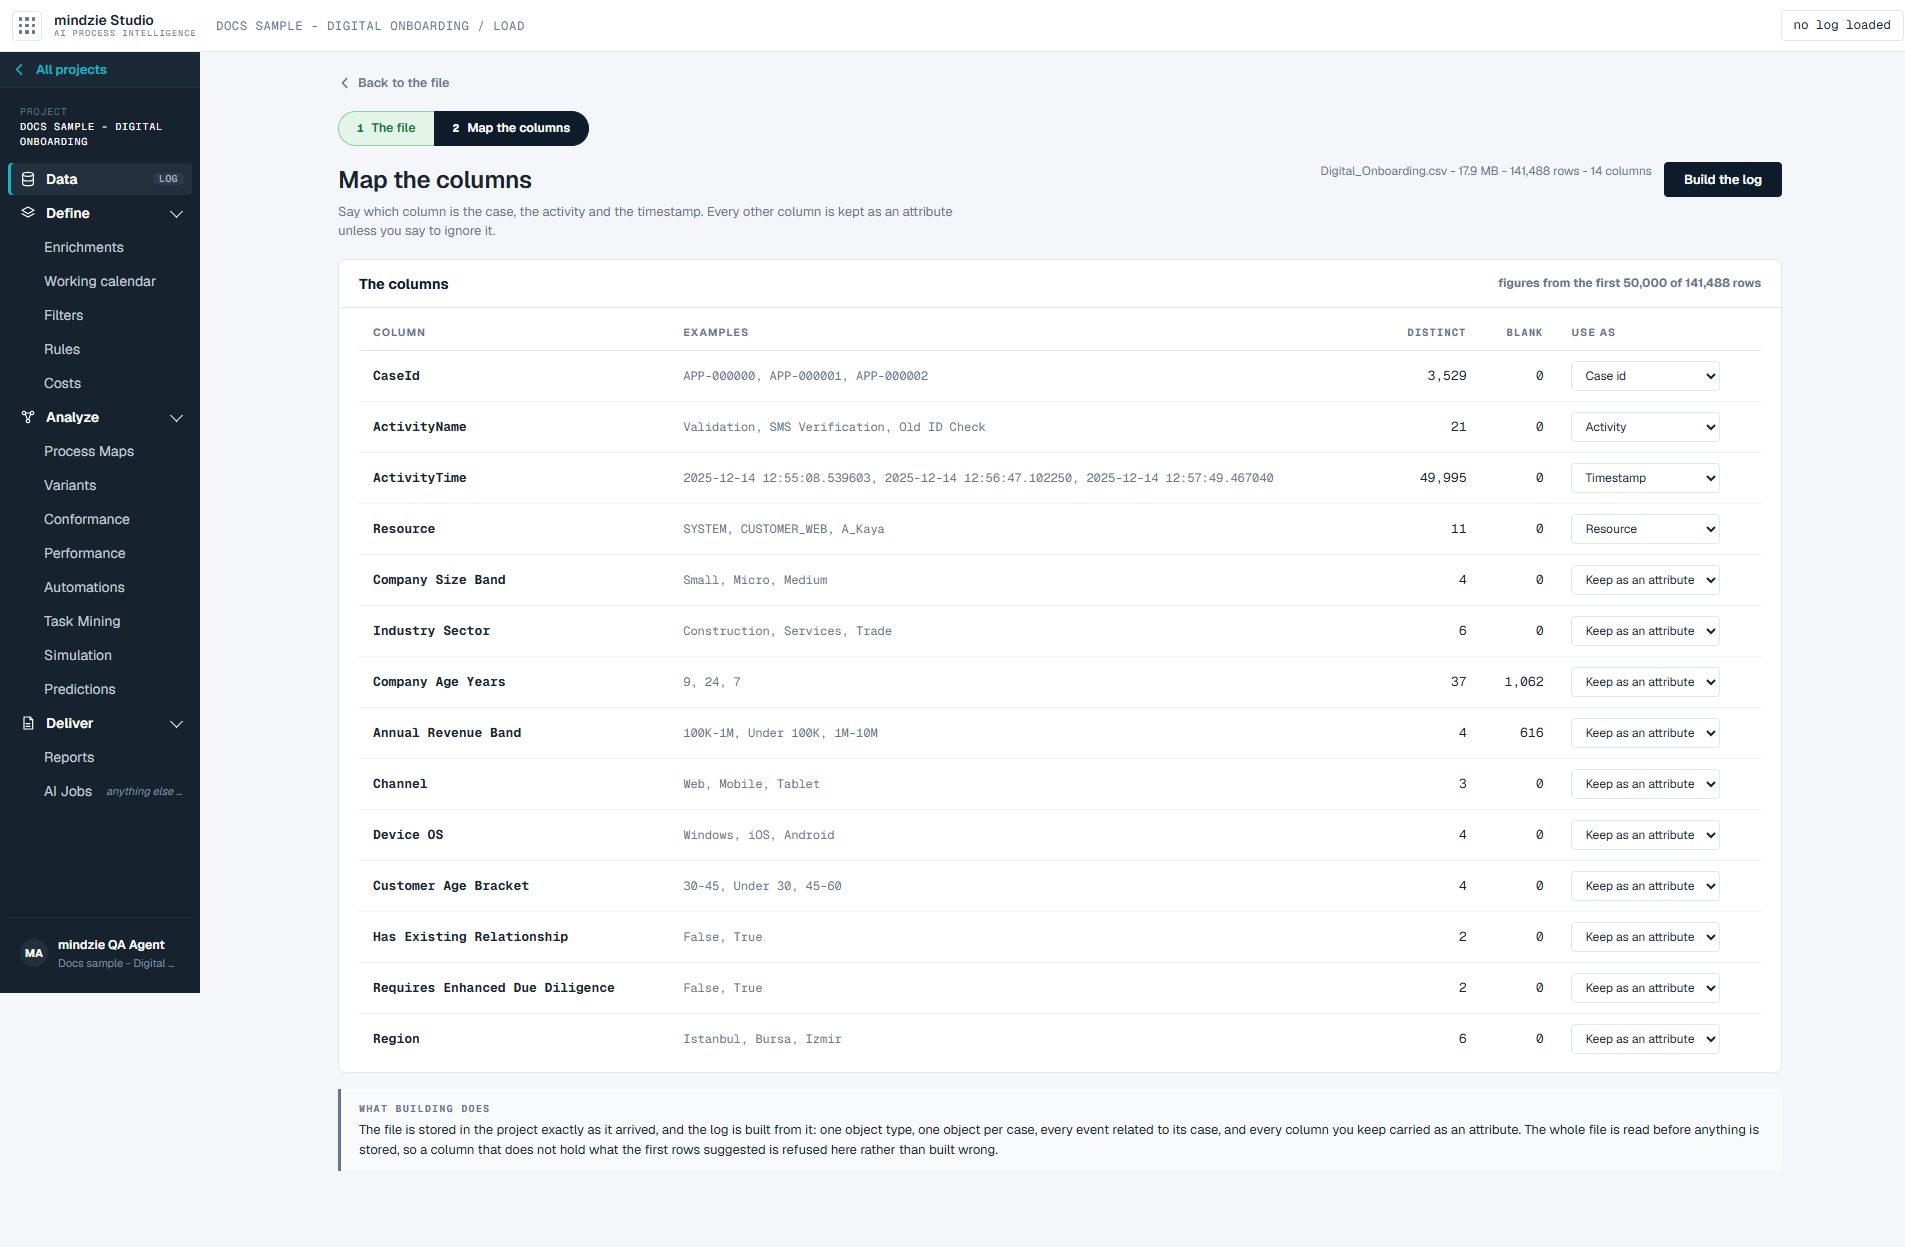
The columns table lists every column with examples, how many distinct values it has and how many rows are blank. The figures come from the first 50,000 rows.
In Use as, the page has already filled in what it reads each column to be. Check each one, and change it where it is wrong:
| Use as | Meaning |
|---|---|
| Case id | Which case the event belongs to. Required. |
| Activity | What happened. Required. |
| Timestamp | When it happened. Required. |
| Resource | Who or what did it - a person, a team or a system. |
| Keep as an attribute | Carried along, so you can filter and group by it later. |
| Ignore | Left out of the log. |
Two things the page may ask:
- Which sheet holds the events? - for an Excel workbook with more than one sheet.
- How are the dates written? - when every date in the file could be read either day first or month first. If the file settles it (a date like 25/03 can only be day first), the page tells you and does not ask.
A column where every value is different is not offered as the case id, because then every event would be its own case.
Click Build the log. The whole file is read before anything is stored, so a column that does not hold what the first rows suggested is refused here, with the reason, rather than loaded wrong. A row with no time is left out of the log, and the build tells you how many there were.
5. Look at your process
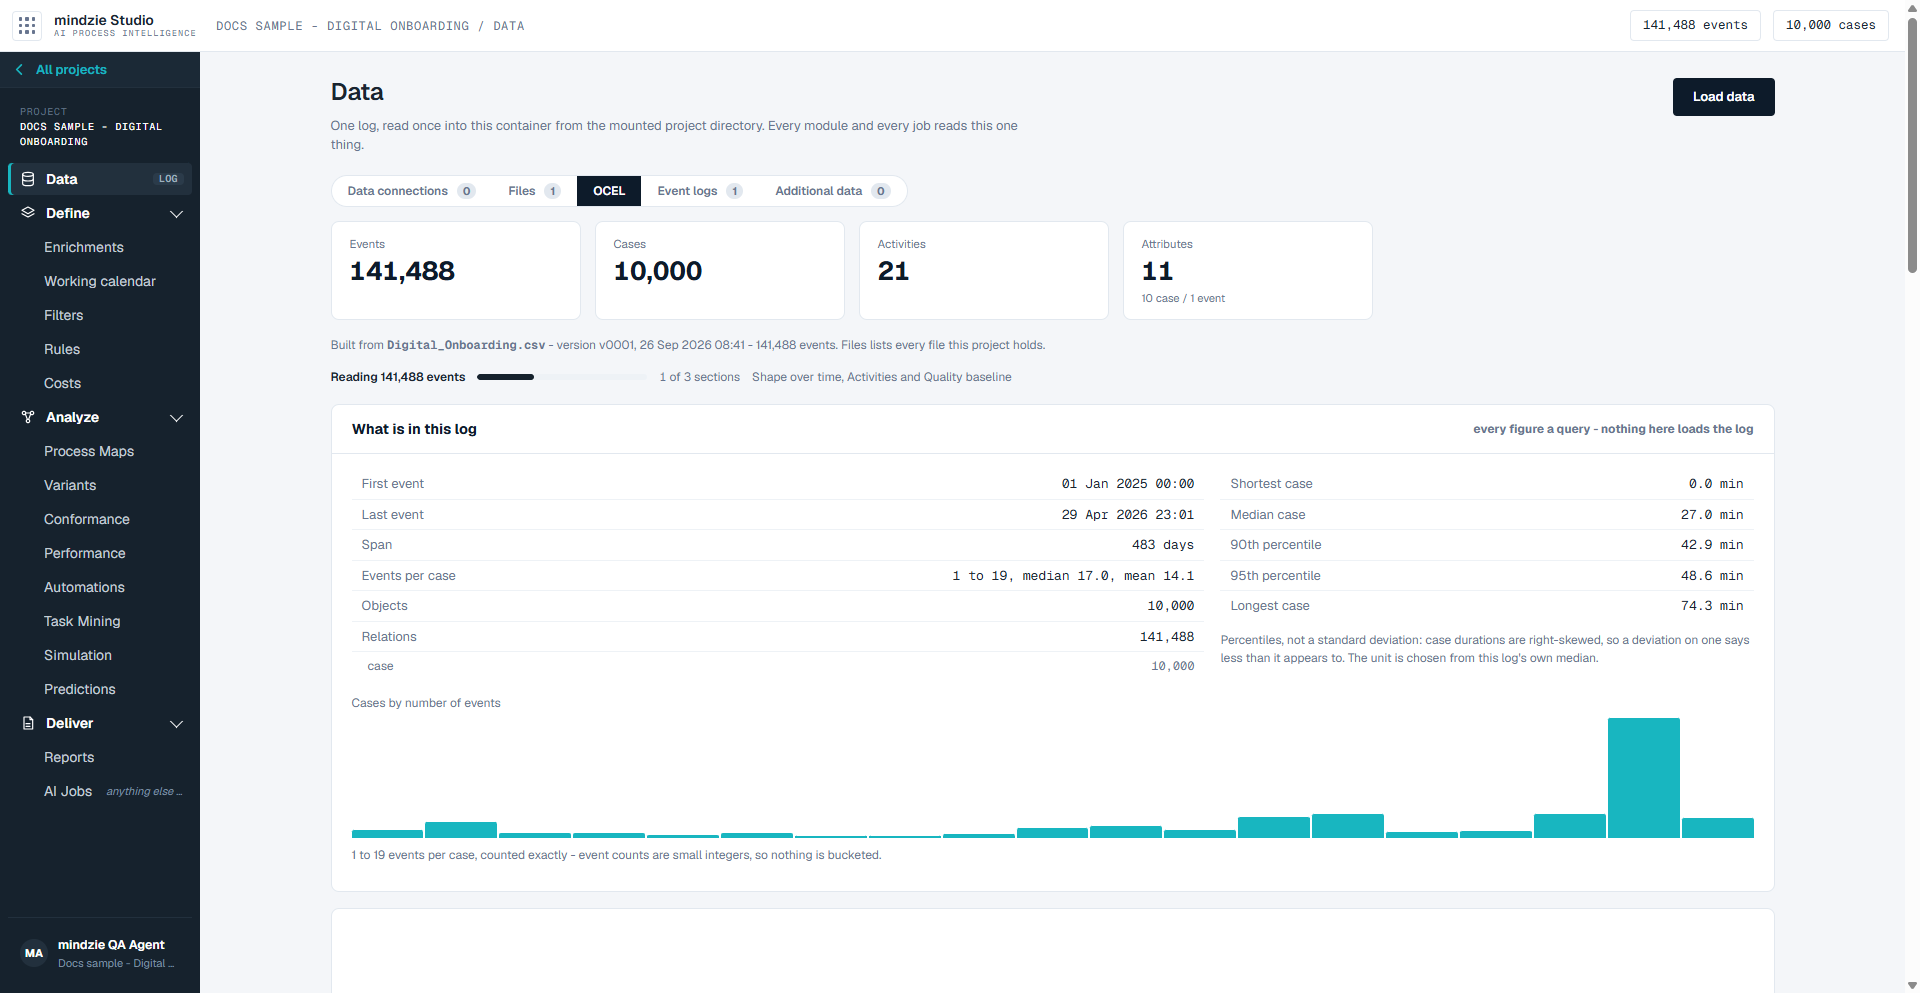
When the build finishes, the project opens on Data. A line under the figures names the file the log was built from, and the bar across the top now shows how many events and cases the log holds. For a file of about 140,000 events, the build takes under a minute.
From here, try:
- Process Maps in the Analyze group, to see the process drawn from your data.
- Performance, to see how long cases take and where they wait.
6. Ask for a report
Click Reports in the Deliver group.
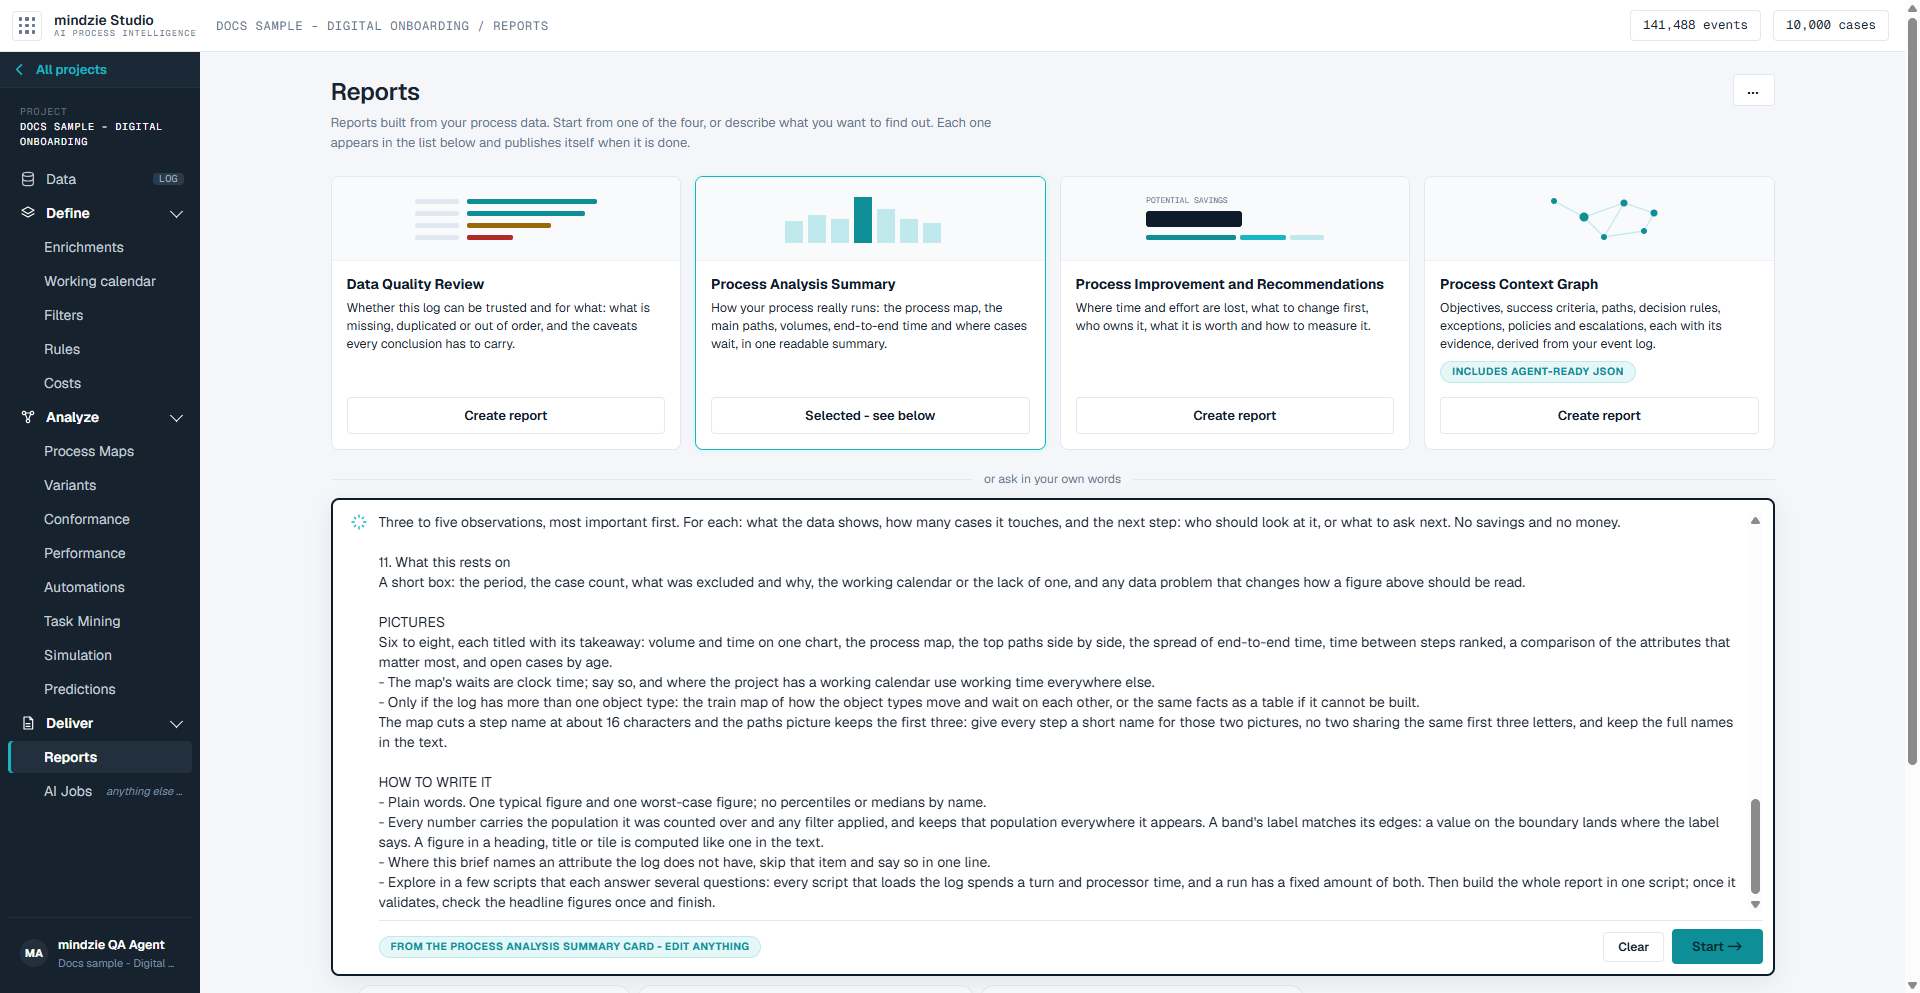
Choose one of the four standard reports and click its Create report button:
- Data Quality Review - whether the log can be trusted and for what.
- Process Analysis Summary - how the process really runs, in one readable summary.
- Process Improvement and Recommendations - where time and effort are lost, and what to change first.
- Process Context Graph - the objectives, paths, decision rules and exceptions, each with its evidence.
The report's brief appears in the box below the cards. You can edit any of it. Or skip the cards and type what you want to find out in your own words.
Click Start.
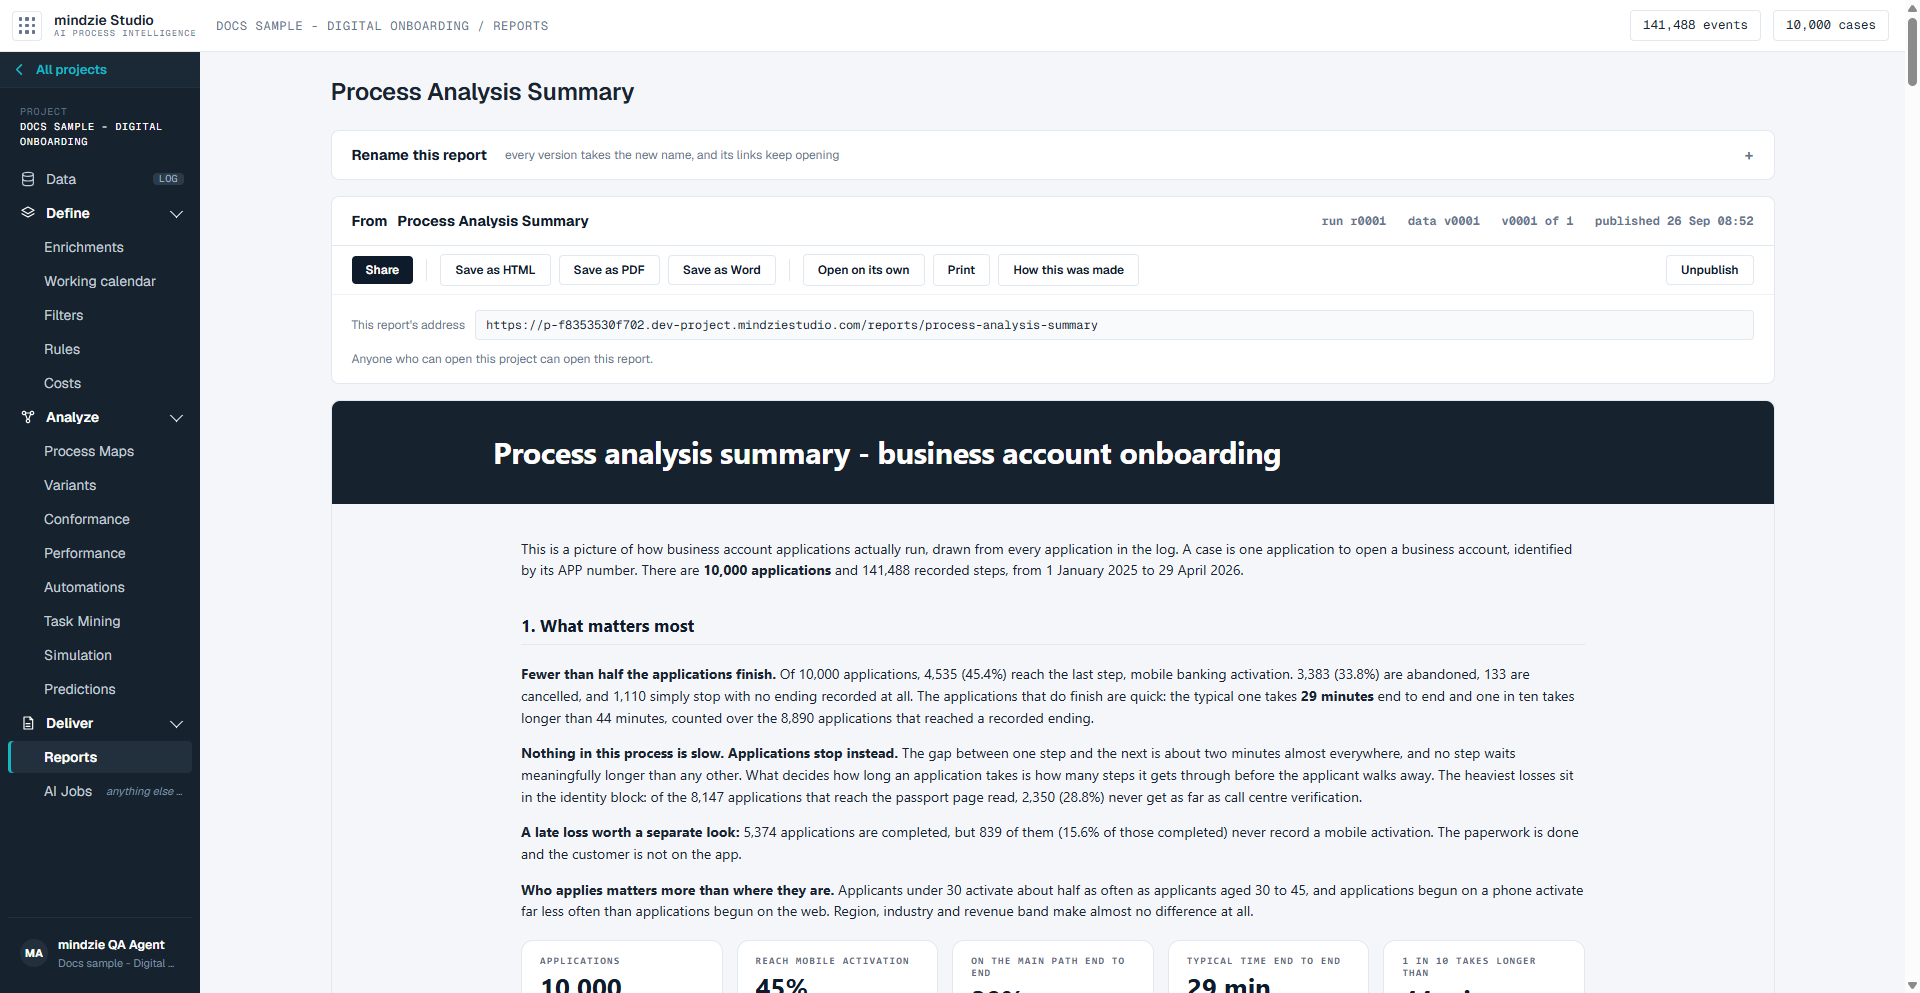
The report appears under Reports in this project with the state Writing. Watch shows its progress, and Stop cancels it. Writing one takes several minutes, and it publishes itself when it is done. Then click Open to read it. From there you can share it or save it as HTML, PDF or Word, and How this was made shows the method behind its numbers.
7. Stop the project
When you have finished, go back to the projects page (All projects, at the top of the menu) and click Stop on your project. A stopped project costs nothing, and nothing is lost: your data, rules and reports are all there when you start it again.
If you forget, the project stops itself after it has not been used for a while. Your administrator sets how long that is.
Where to go next
- The Projects Page - everything you can do with a project from the list.
- Finding Your Way in a Project - the header, the menu, and how to get back out.