Process Performance Matrix
Overview#
The calculator shows the conformance versus performance categories as a matrix.
Common Uses#
To analyze the frequency and relationship between selected performance and conformance issues.
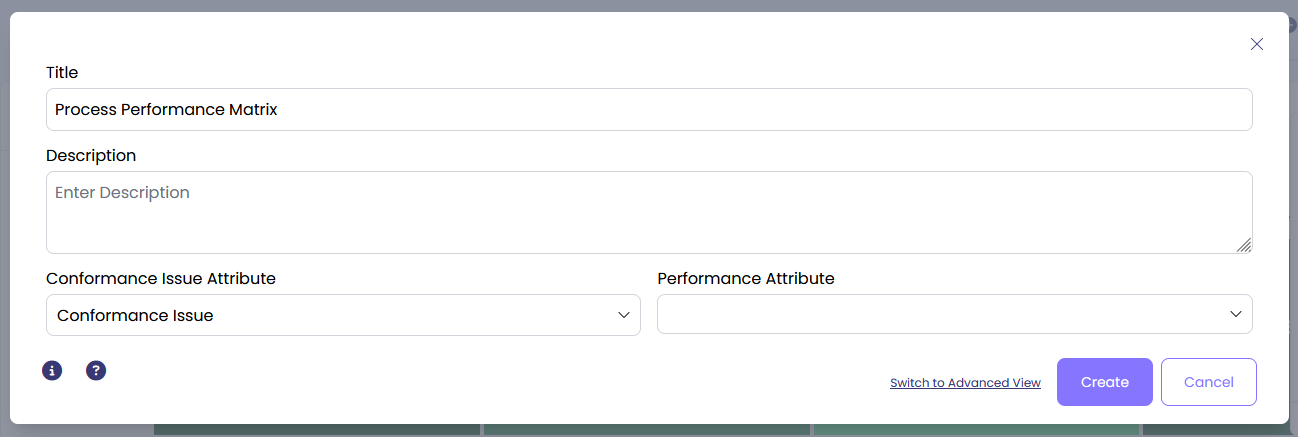
Settings#
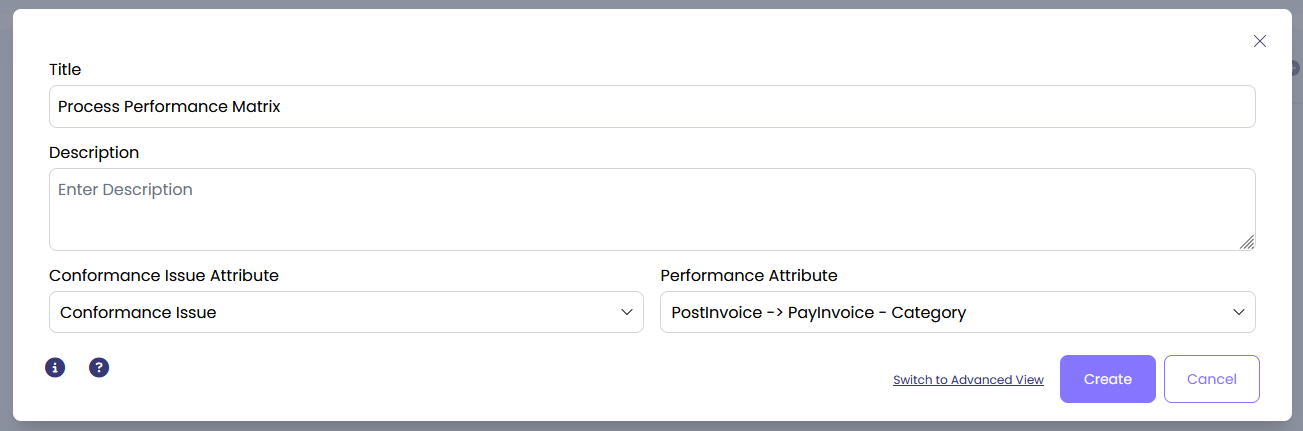
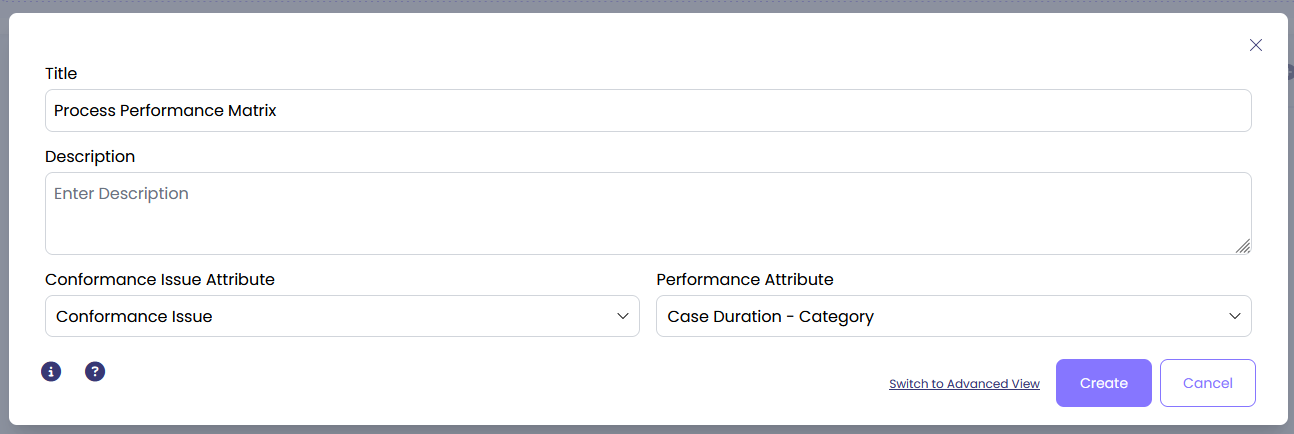
Conformance Issue Attribute:Select any Boolean case attribute which represents a conformance issue (e.g., whether an activity was repeated or skipped). To set up ‘Conformance Issue’ attribute, refer to ourConformance Enrichment Documents.Performance Attribute:Select the attribute which you wish to be representative of performance, it could be any categorical attribute (for instance, case duration split into categories).
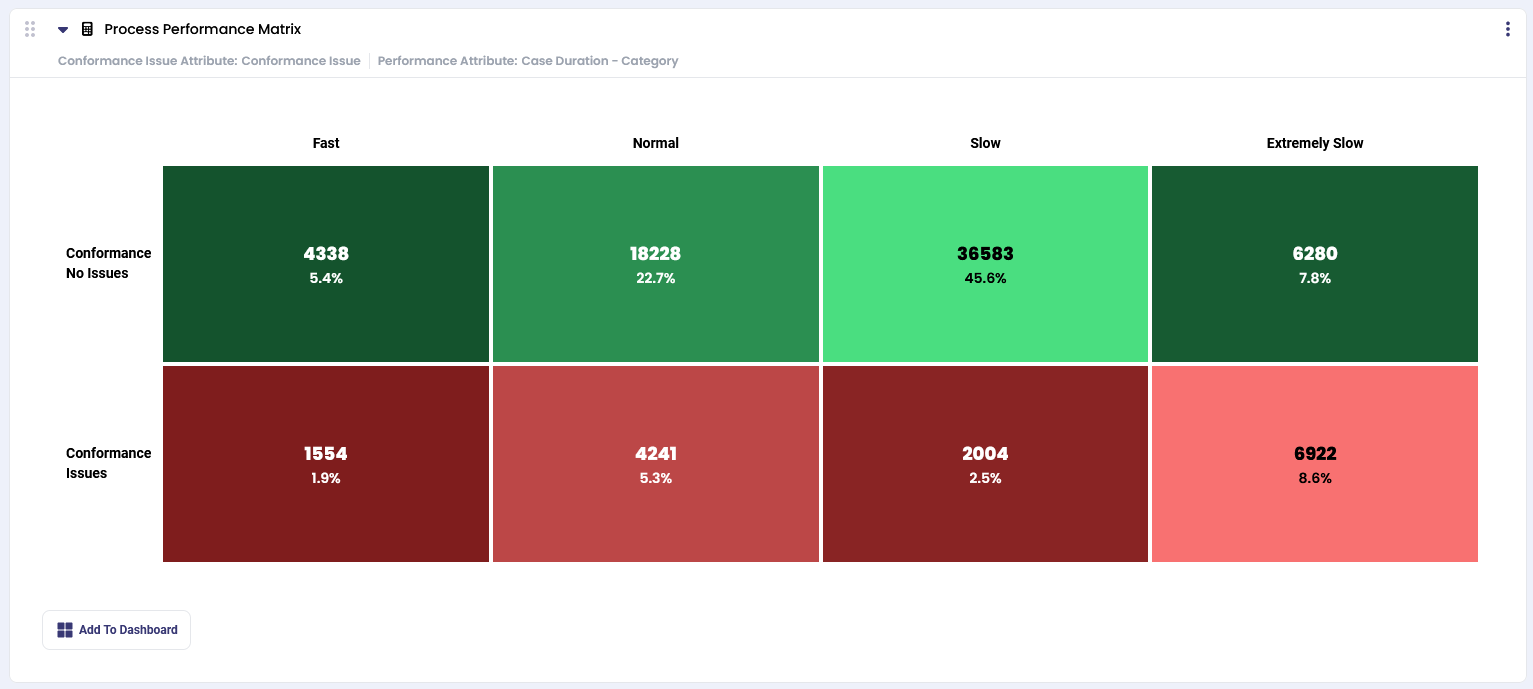
Example 1#
Let’s analyze the number of conformance issues associated with case duration categories.
The output is a process performance matrix.
Green blocks show the number and percentage of cases with no conformance issues, while red blocks show the number and percentage of cases with conformance issues per each case duration category.
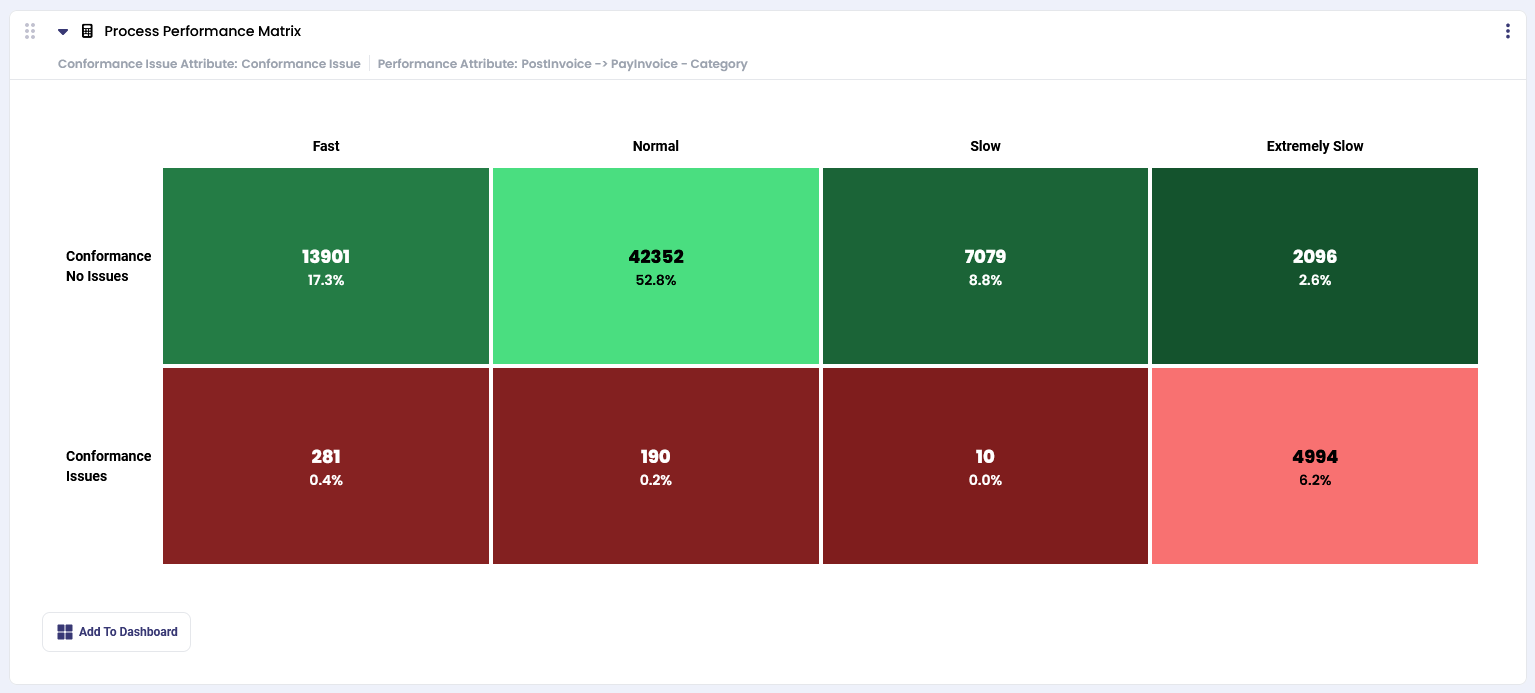
Example 2#
Let’s analyze the number of conformance issues associated with ‘Post to Pay’ duration categories.
The output is a process performance matrix.
Still stuck? How can we help?
Name:*Email:Message:
This documentation is part of the mindzie Studio process mining platform.