Process Map
Overview
The Process Map is mindzie Studio's core visualization tool that creates interactive flowcharts of your business processes. It transforms raw event log data into clear, visual representations showing how work actually flows through your organization, helping you identify inefficiencies and optimization opportunities.
Common Uses
- Process Visualization: Create clear visual representations of complex business processes
- Variant Analysis: Explore different process paths and identify the most common flows
- Bottleneck Identification: Spot activities that slow down your process
- Compliance Monitoring: Identify deviations from standard process flows
- Performance Analysis: Understand timing and frequency patterns across activities
- Process Improvement: Use insights to optimize workflows and reduce cycle times
Settings
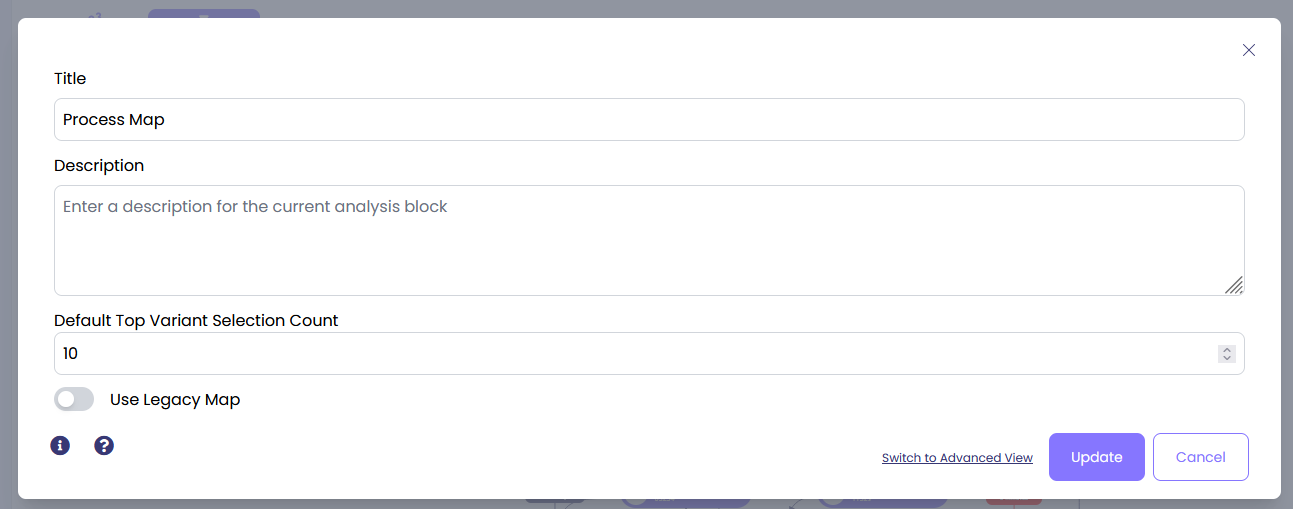
By default, the calculator selects top 5 variants from your log and visualizes them. To change this number, click on three dots in the upper right corner of the calculator and click ‘Edit’.
Edit the ‘Default Top Variant Selection Count’ to the preferred number.
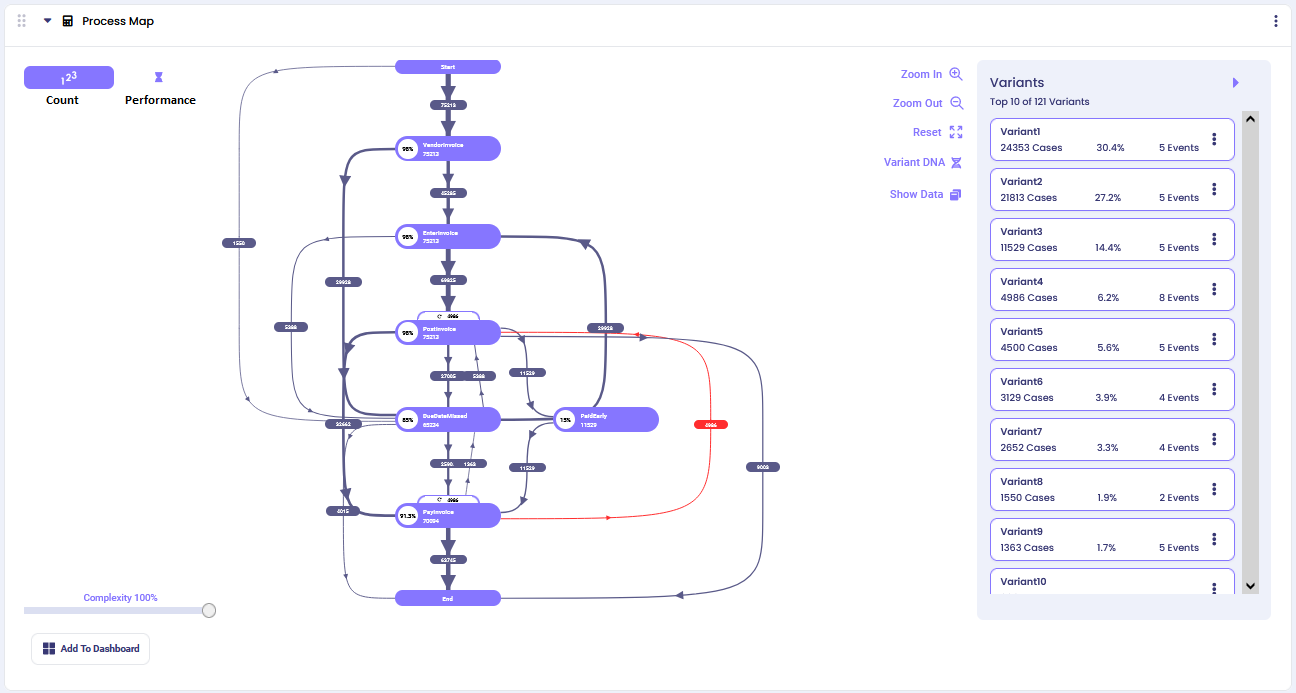
Count View (default)
By default, you will see a process map that shows the flow of the Top 5 variants in your log. Here we adjusted it to Top 10 to provide more comprehensive process insights:
The Count View displays the frequency of each process path, helping you understand which routes through your process are most common.
Process Shapes
Purple Ovals (Activities): Represent specific activities in your process
- The percentage shows what portion of all cases performed this activity
- The number shows the total count of cases that performed this activity
Arrows (Process Flow): Show the directional flow from one activity to another
- The number on each arrow represents how many cases took this specific path
- Thicker lines indicate more cases followed this route
- Red arrows highlight unusual or non-standard process flows that may indicate exceptions or problems
Process Complexity
Use the complexity slider to manage visual clarity when your process map becomes too complex with many paths between activities.
- Higher complexity percentage: Shows only the most frequent paths (cleaner view)
- Lower complexity percentage: Reveals more infrequent paths between activities (detailed view)
This helps you focus on either the main process flows or dive deep into edge cases and exceptions.
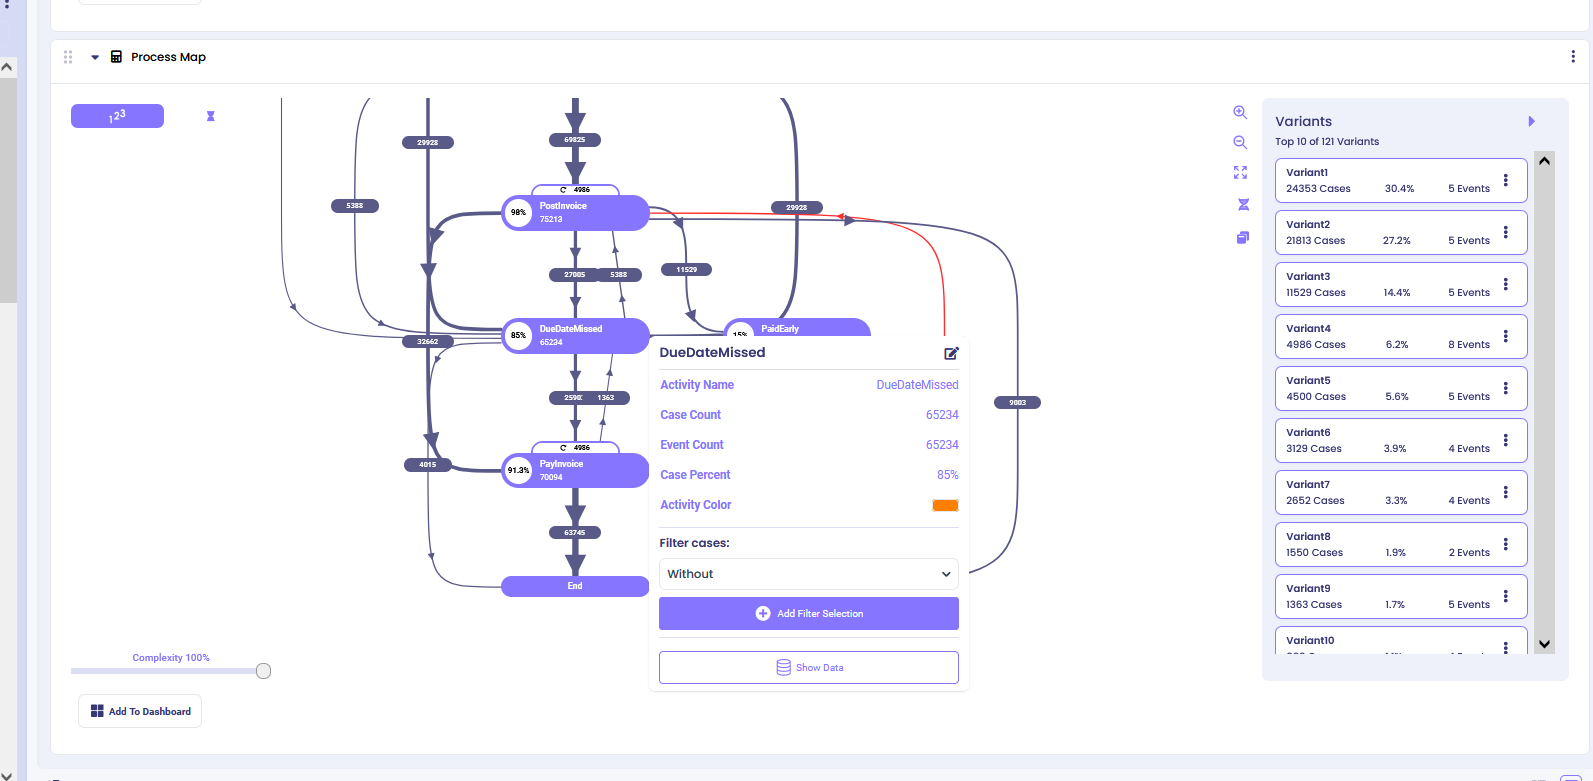
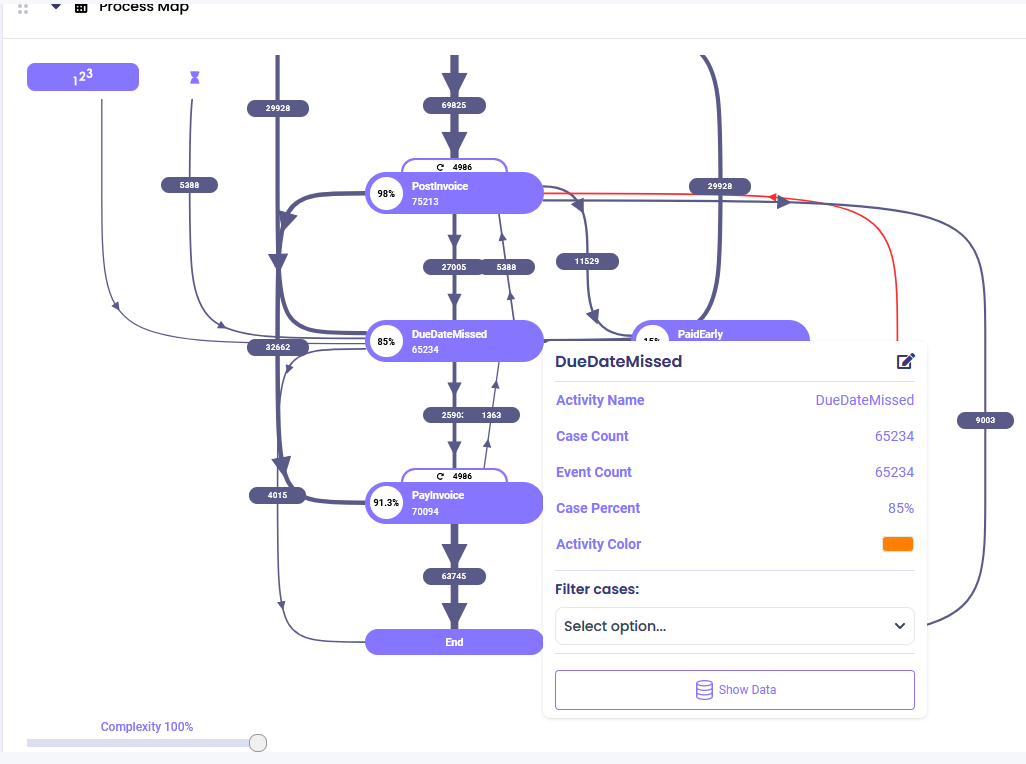
Process Details
Click on any activity oval to see detailed information about that specific activity, including:
- Case count and percentage
- Incoming and outgoing flows
- Performance metrics
- Filter options
Example: Clicking on 'Due Date Missed' activity shows comprehensive details about this step in your process.
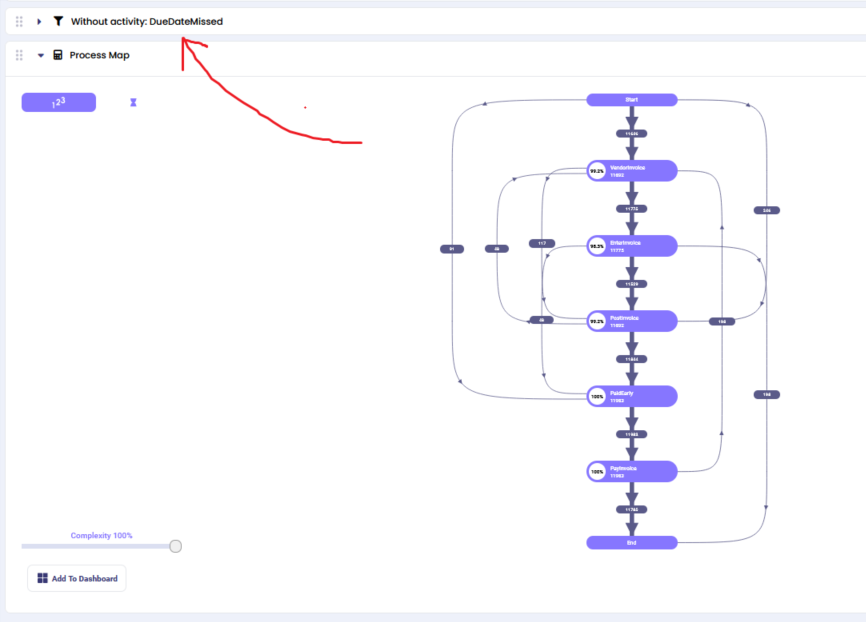
Interactive Filtering: From the activity details, you can create focused process maps by applying filters:
- "without": Show process map excluding cases with this activity
- "starts with": Show process map for cases beginning with this activity
- "ends with": Show process map for cases ending with this activity
The selected filter automatically adds a filter block before the Process Map calculator in your analysis chain.
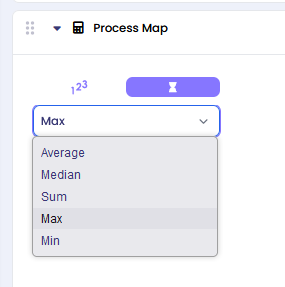
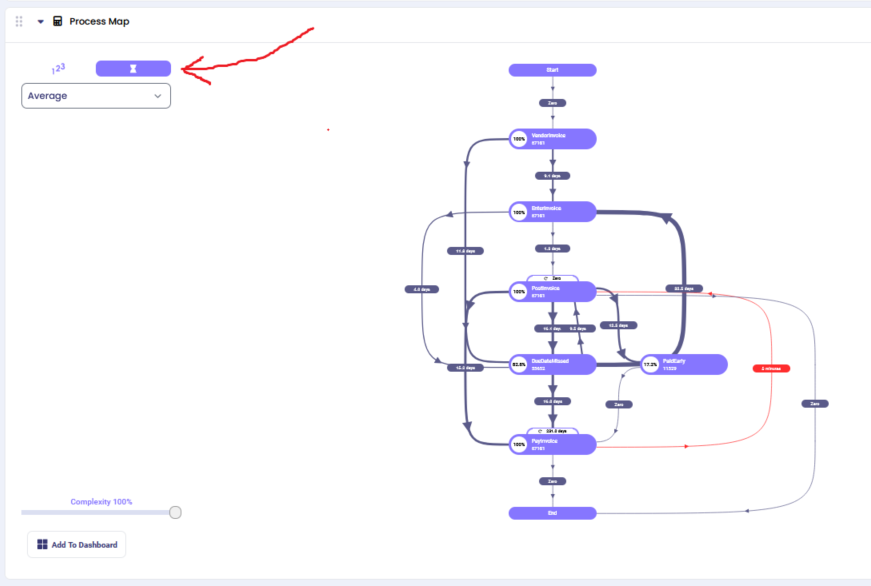
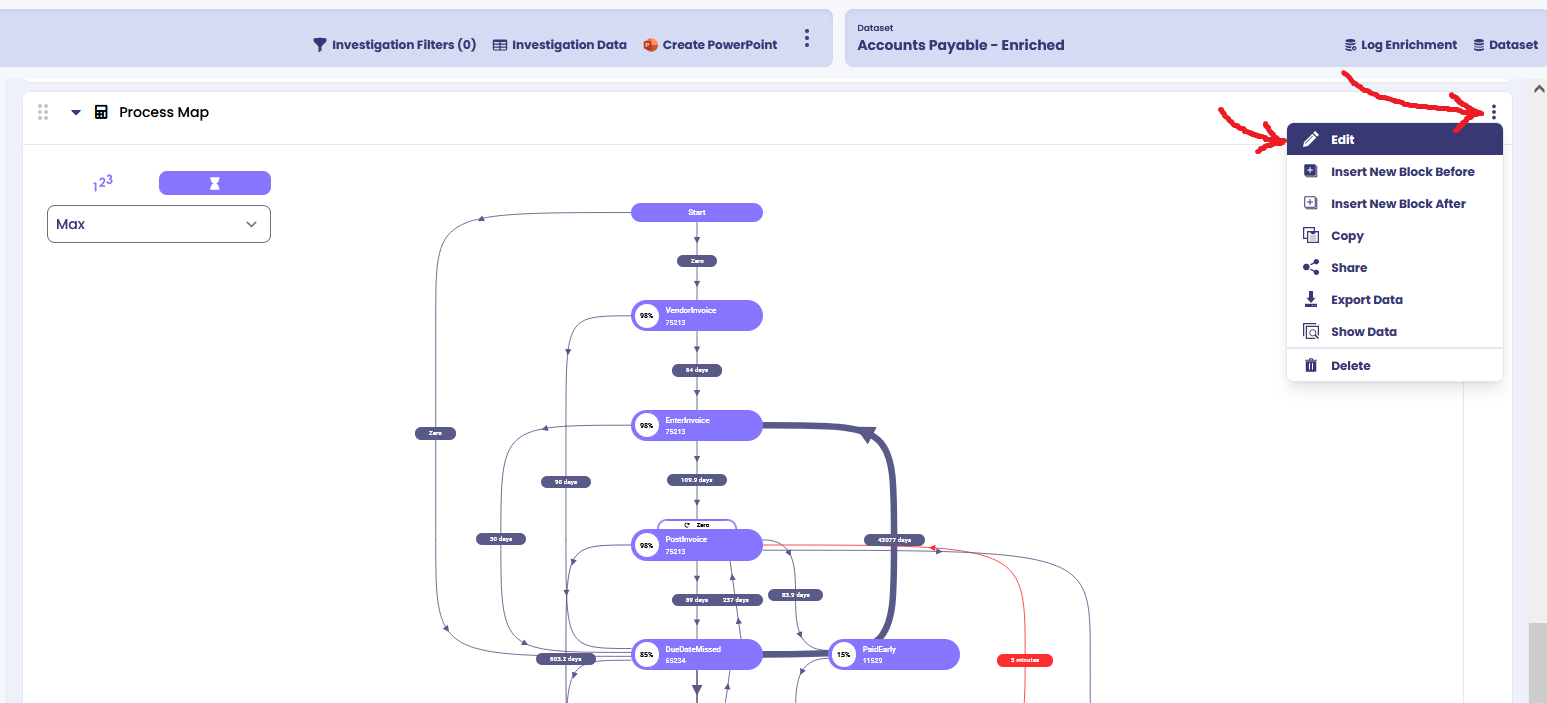
Performance View
Switch from Count View to Performance View by clicking the performance icon in the top-left corner. This transforms your process map to show timing metrics instead of case frequencies.
Performance Metrics Available:
- Average Duration: Shows mean time between activities
- Minimum Duration: Displays fastest completion times
- Maximum Duration: Reveals longest completion times
- Median Duration: Shows typical timing performance
Time Units: The system automatically selects appropriate time units (minutes, hours, days, weeks) based on your data scale.
Use Cases for Performance View:
- Identify timing bottlenecks in your process
- Find activities that consistently take longer than expected
- Compare performance across different process paths
- Monitor SLA compliance for time-sensitive processes
You can switch between different performance metrics using the dropdown menu to gain various timing perspectives on your process flow.
Still stuck? How can we help?
Name:*Email:Message:
This documentation is part of the mindzie Studio process mining platform.