Conformance Analysis
Overview
Conformance Analysis lets you define what your process should look like and then automatically check how well your actual cases follow that process. It answers the question: "Are my cases running the way they are supposed to?"
You do this by walking through your process variants, accepting the ones that are correct and rejecting the ones that are not. For rejected variants, you can document why they deviate from the expected process -- with optional AI assistance to help write the explanation. mindzie then builds a process model from your accepted variants and scores every other variant against it.
The result is a documented process where:
- Good variants define what the process SHOULD look like (the reference model)
- Bad variants explain what can go WRONG and why (the deviation catalog)
- Everything else is automatically classified against the model
Getting Started
- Navigate to Conformance in the top menu
- Select a dataset from the dropdown in the top-right corner
- Triage your variants from top to bottom (most frequent first):
- Click the checkmark to mark a variant as Good (one click, no friction)
- Click the X to mark a variant as Bad -- a note row automatically expands
- For bad variants, document the deviation: type a reason or click the sparkle button to have AI generate one
- Click Build & Check Conformance to build a process model and run conformance checking
- Review the results: each variant gets a fitness score and is classified as either "Fits" or "Fails"
- Optionally adjust the Threshold slider to control how strict the conformance check is
- Click Save Model to persist your conformance model and deviation notes for use in enrichments
How It Works
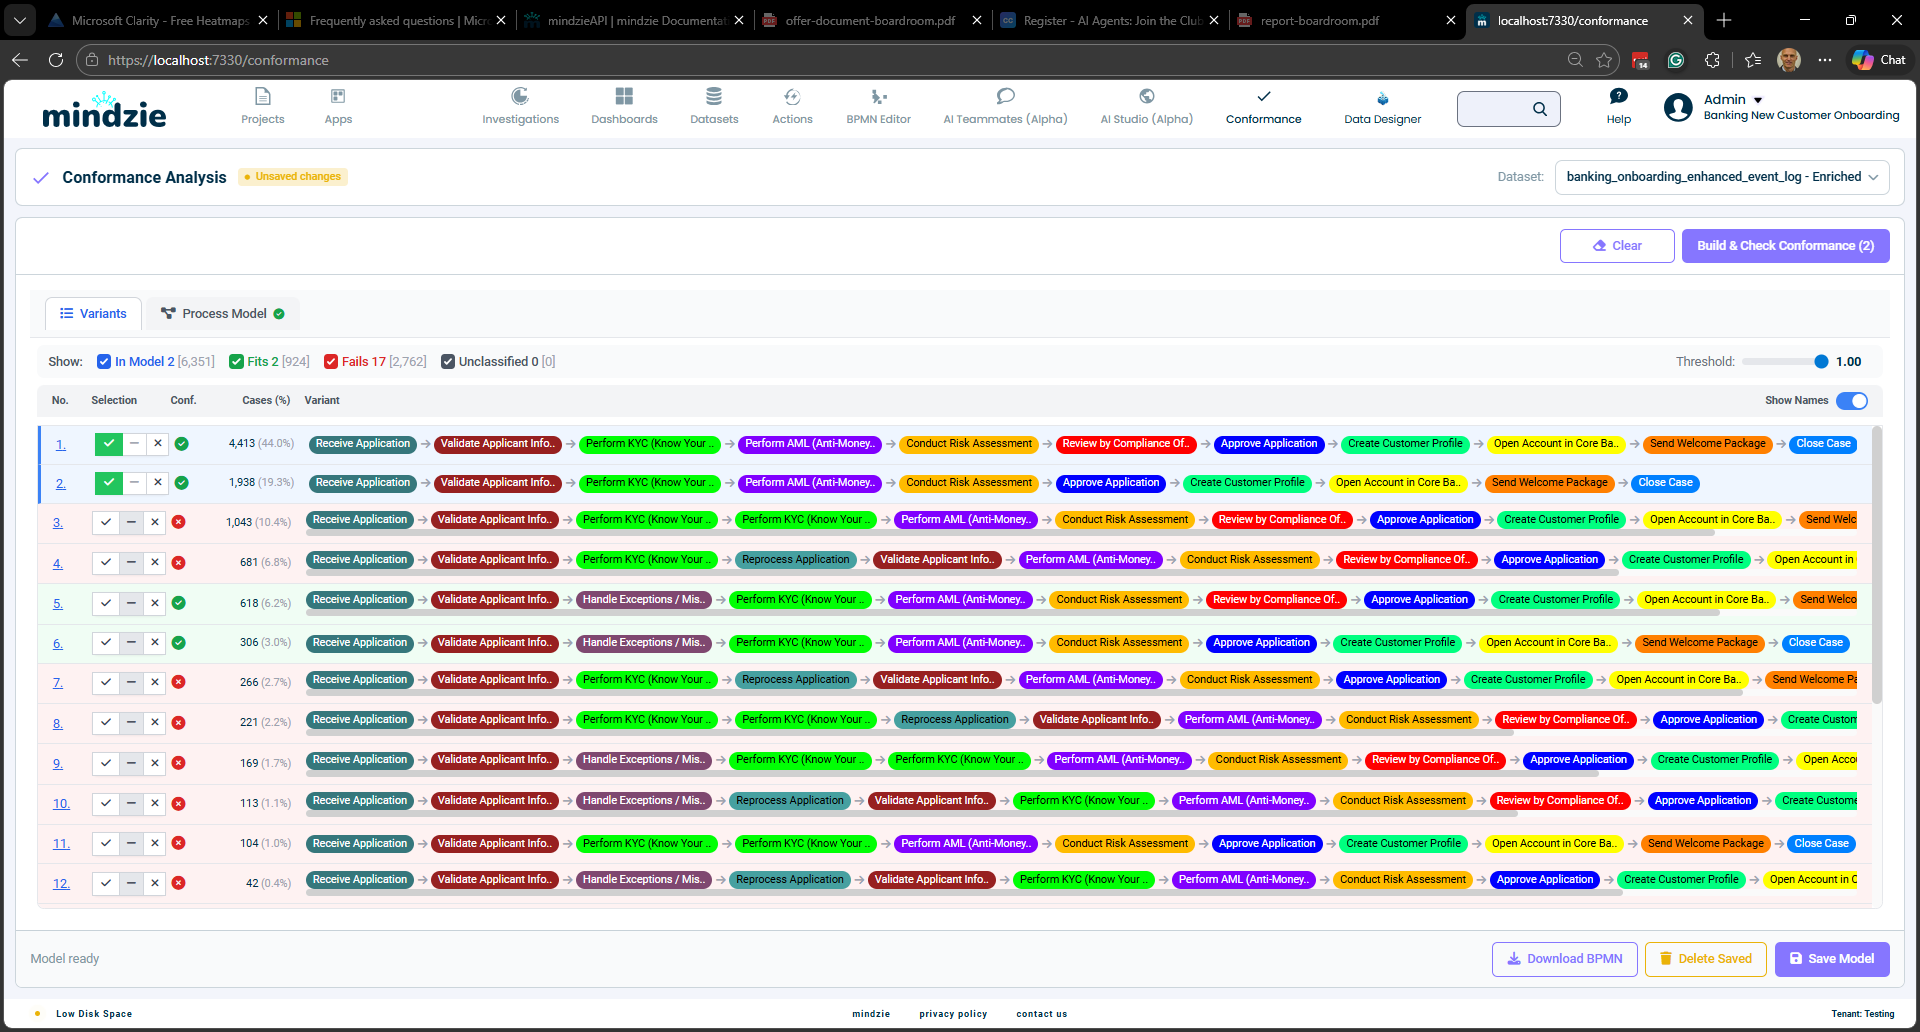
Step 1: Triage Your Variants
The Variants tab shows all process variants in your dataset, sorted by frequency (most common first). Each row represents a unique sequence of activities, with colored activity labels showing the process flow.
Walk through the list from top to bottom. For each variant, click one of three buttons:
- Good (checkmark) -- This variant represents a correct process execution. One click, no further input needed.
- Bad (X) -- This variant is a known anomaly. When you click X, a note row automatically expands below the variant where you can document why it deviates.
- Unclassified (dash) -- Let the system decide based on conformance. This is the default state.
You can also override a variant that was auto-classified by clicking its selection buttons.
Documenting Deviations
When you mark a variant as Bad, an inline note row appears directly below it. This row contains:
- A text area where you can type the reason this variant deviates from the expected process
- A sparkle button (if AI is configured for your tenant) that generates a deviation description automatically
The AI examines your accepted good variants and compares them against the rejected variant to identify what is different -- missing activities, extra steps, wrong order, or repeated activities. The generated description is placed in the text area where you can accept it as-is or edit it before saving.
Notes are optional. You can mark a variant as Bad without providing a reason, but documenting deviations creates a valuable catalog of known process issues that can be used for reporting, training, and continuous improvement.
To collapse a note row without removing the note, click the collapse arrow on the right side of the note row. Variants with saved notes show a small note icon even when collapsed.
Step 2: Build the Process Model
When you click Build & Check Conformance, mindzie performs two operations:
Process Discovery - mindzie analyzes the selected good variants and discovers a structured process model that captures all valid execution paths. The model identifies:
- The sequence of activities
- Decision points where the process can take different paths (XOR gateways)
- Parallel paths where activities can happen simultaneously (AND gateways)
- Optional activities that may be skipped
- Loops where activities repeat
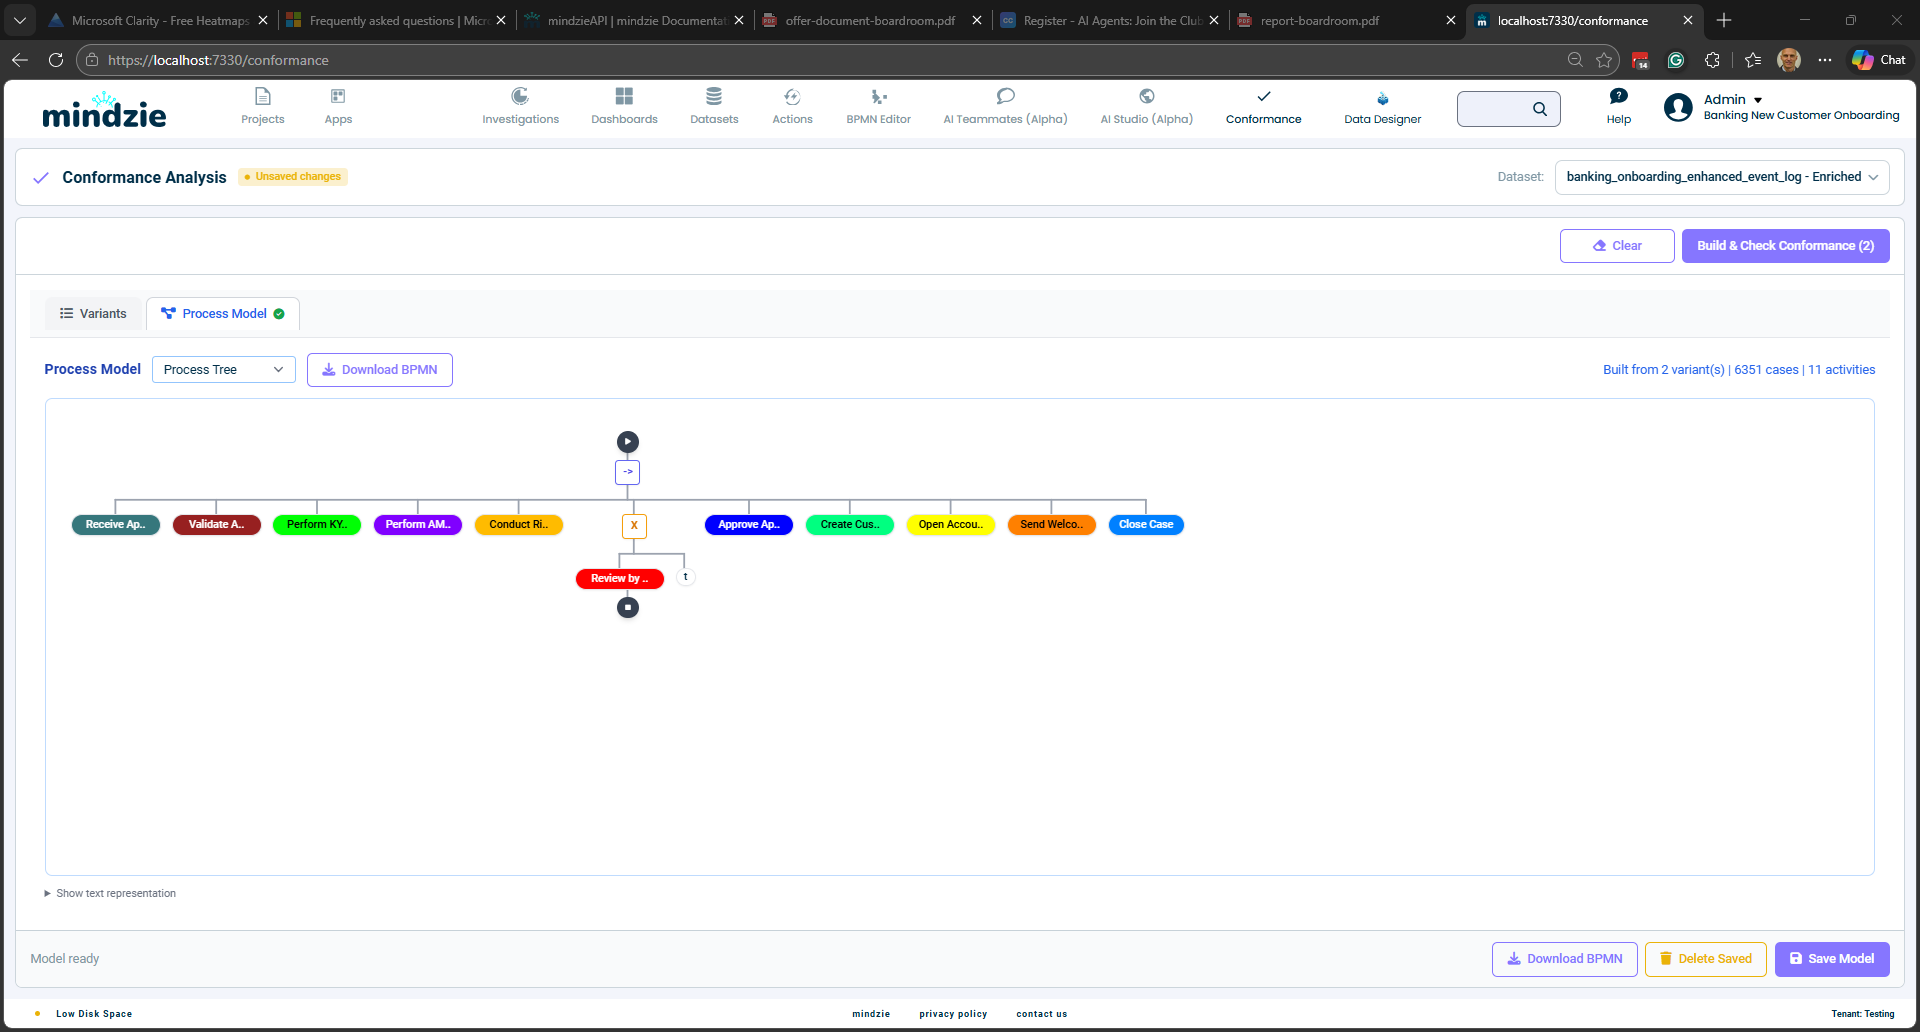
The discovered model is displayed in two formats:
Process Tree - A hierarchical view showing the structure of the process with operators (sequence, choice, parallel, loop) and activity nodes.
BPMN Diagram - A standard Business Process Model and Notation diagram showing the process flow with start/end events, activity boxes, and gateway diamonds.
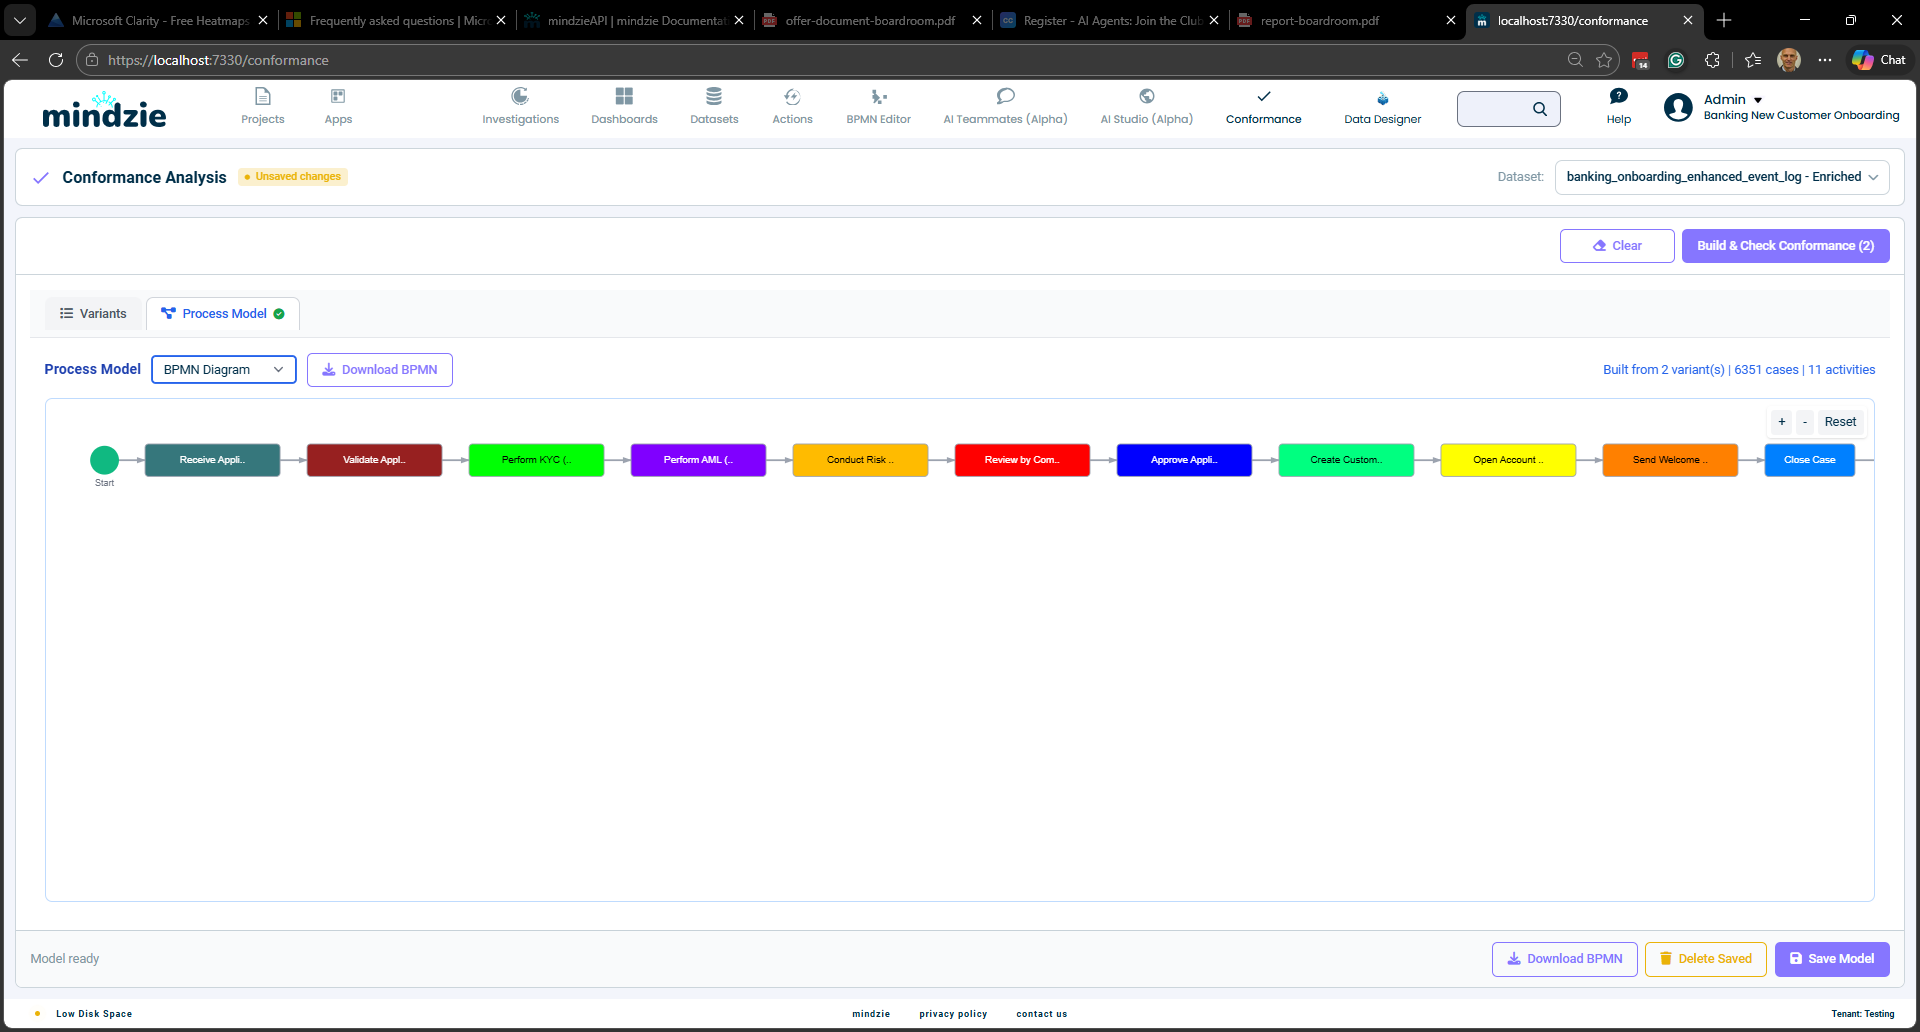
You can switch between these views using the Process Model dropdown. You can also download the BPMN as an XML file using the Download BPMN button.
Step 3: Check Conformance
After the model is built, mindzie converts it into a Petri net (a mathematical model of the process) and uses token replay to check each variant against the model.
Token replay works by simulating the execution of each case through the Petri net:
- A token is placed at the start of the process
- For each activity in the case, the system tries to move the token through the corresponding transition in the model
- If the transition can fire normally, the case is conforming at that step
- If the transition cannot fire (the activity is out of order or unexpected), a conformance violation is recorded
- After all activities, the system checks whether the token reached the end of the process
This simulation produces four key measurements:
| Measurement | What It Means |
|---|---|
| Consumed tokens | Total tokens used during replay (activities that executed) |
| Produced tokens | Total tokens created during replay (transitions that fired) |
| Missing tokens | Tokens that had to be artificially added because the model was not in the right state |
| Remaining tokens | Tokens left over after replay that should not be there |
Fitness Score
The fitness score is a value between 0.0 and 1.0 that quantifies how well a variant conforms to the model:
Fitness = 0.5 x (1 - missing/consumed) + 0.5 x (1 - remaining/produced)
- 1.0 = Perfect conformance. The variant follows the model exactly.
- 0.8 = Good conformance. Minor deviations from the model.
- 0.5 = Poor conformance. Significant deviations.
- 0.0 = No conformance. The variant does not follow the model at all.
How Deviations Reduce Fitness
Missing tokens occur when the case does something the model does not expect at that point:
- An activity happens out of order
- An activity is skipped and the next activity cannot fire
Remaining tokens occur when the case does not complete the expected process:
- The case ends before reaching the final state
- A branch of a parallel process is not completed
Unmapped activities occur when the case contains activities that do not exist in the model at all:
- An extra step was performed that is not part of any good variant
- Each unmapped activity reduces the fitness proportionally to the trace length
A variant is considered fully fit only when it has zero missing tokens, zero remaining tokens, and zero unmapped activities.
Threshold
The Threshold slider (0.0 to 1.0) controls how strict the conformance check is:
- At 1.0 (strictest): Only variants that perfectly match the model are classified as "Fits"
- At 0.95 (recommended): Variants with very minor deviations still pass
- At 0.8: Variants with moderate deviations pass
- At 0.5: Only variants with major deviations fail
Effect on Classification
After conformance checking, the system classifies each variant:
| Filter | Color | Meaning |
|---|---|---|
| In Model | Blue | Variants you explicitly selected as good |
| Fits | Green | Unselected variants that meet the fitness threshold |
| Fails | Red | Unselected variants that do not meet the fitness threshold |
| Unclassified | Gray | Variants that have not been checked yet |
Use the filter checkboxes at the top to show or hide each category.
Can Non-Selected Variants Pass at Threshold 1.0?
Yes. If an unselected variant follows a path that is perfectly valid in the process model (every activity exists, every transition fires correctly, and the final state is reached), it will receive a fitness score of 1.0 and be classified as "Fits". This is intentional -- the model represents all valid paths, not just the exact variants you selected.
For example, if you select two variants with different branches (A then B, or A then C), the model creates a choice gateway. Any other variant that follows one of those branches exactly will also score 1.0.
Auto-Classification of New Variants
When you save a conformance model and it is applied as an enrichment, new cases that arrive later are automatically classified:
- Cases whose variant matches a previously selected good variant are classified as Good
- Cases whose variant matches a previously selected bad variant are classified as Anomaly
- Cases with new, unseen variants are auto-classified by running token replay against the saved model
- If the fitness score meets the threshold: classified as Good (source: AutoConformance)
- If the fitness score is below the threshold: classified as Anomaly (source: AutoConformance)
This means your conformance rules continue to work as new data flows in, without needing to manually re-classify every new variant.
Saving and Using the Model
Save Model
Click Save Model to persist the conformance model. This saves:
- Your variant selections (good/bad/overridden)
- Your deviation notes for bad variants
- The discovered process model (BPMN and Petri net)
- The fitness threshold setting
The saved model is stored as an enrichment operator on the dataset, meaning it runs automatically when the dataset is refreshed.
Enrichment Output
When the conformance model runs as an enrichment, it adds five columns to your case data:
| Column | Type | Values |
|---|---|---|
| Is Variant Anomaly | Boolean | Yes / No |
| Variant Classification | Text | "Good" or "Anomaly" |
| Variant Fitness Score | Percentage | 0% to 100% |
| Classification Source | Text | "Explicit", "UserOverride", or "AutoConformance" |
| Deviation Reason | Text | Description of why the variant deviates (from your notes) |
The Deviation Reason column is populated from the notes you wrote (or AI generated) when marking variants as Bad. For variants that were explicitly rejected with a documented reason, the exact note text appears in this column. For auto-classified anomalies, this column is empty unless you later add a note.
These columns can be used in filters, calculators, and dashboards to analyze conformance across your process. The Deviation Reason column is particularly useful for building dashboards that show the most common types of process deviations.
Download BPMN
Click Download BPMN to export the process model as a standard BPMN 2.0 XML file. This file can be opened in any BPMN-compatible tool for further analysis or documentation.
Workflow Example
Here is a typical workflow for setting up conformance analysis:
- Load your dataset and navigate to the Conformance page
- Start from the top of the variant list -- variants are sorted by frequency, so the most important paths appear first
- Triage each variant:
- For correct process paths: click the checkmark (one click, done)
- For known anomalies: click X, then document why using the note row
- For variants you are unsure about: leave unclassified and let the model decide
- Use AI to help document deviations -- click the sparkle button to generate a description comparing the rejected variant against your accepted good variants
- Click Build & Check Conformance to generate the model and classify all remaining variants
- Switch to the Process Model tab to review the discovered BPMN diagram
- Adjust the threshold if needed based on your tolerance for deviations
- Review the results: use filters to focus on failing variants and understand why they deviate
- Click Save Model to save the conformance model, deviation notes, and enable automatic classification on future data refreshes
- Build dashboards using the enrichment columns (including Deviation Reason) to track conformance metrics over time
AI-Assisted Deviation Descriptions
When AI is configured for your tenant, the sparkle button appears next to the note text area for bad variants. Clicking it sends the following context to the AI:
- All variants you have marked as Good (the expected process paths)
- The specific variant you marked as Bad (the deviation)
The AI compares them and produces a 1-2 sentence explanation identifying:
- Extra activities -- steps that do not appear in any good variant
- Missing activities -- steps in good variants that are absent
- Wrong order -- steps that appear in a different sequence
- Repeated activities -- steps that occur more than expected
The AI suggestion is placed in the text area. You can accept it as-is, edit it to be more specific, or replace it entirely with your own text. AI is fully optional -- if it is not configured for your tenant, the sparkle button does not appear, and you can always type notes manually.
Tips
- Start with a few good variants: Selecting too many variants creates an overly permissive model. Start with 1-3 variants that represent the core happy path.
- Work top-to-bottom: Variants are sorted by frequency. Classifying the most common paths first gives you the best coverage with the least effort.
- Document deviations as you go: Writing a note when you mark a variant as Bad takes seconds but creates lasting documentation. Use AI to speed this up.
- Use the Process Tree view to understand the structure of the discovered model, especially decision points and optional activities.
- Set the threshold to 0.95 initially: A threshold of 1.0 is very strict and may flag variants with trivial differences. Start at 0.95 and adjust based on your results.
- Check the Classification Source column: This tells you whether a classification was from your explicit selection, an override, or auto-classification. Use it to audit how new variants are being handled.
- Use the Deviation Reason column in dashboards: Build reports showing the most common deviation reasons to prioritize process improvement efforts.
- Combine with other enrichments: Use the "Is Variant Anomaly" column as input for other analysis, such as root cause analysis on anomalous cases or trend analysis of conformance over time.