Working with Investigations and Analysis Notebooks
Overview
In mindzie Studio, investigations serve as organizational folders that contain your analysis work. Each investigation groups related analyses together, making it easy to organize your process mining insights by business function, dashboard, or specific area of focus.
This tutorial explains how to create investigations, understand their folder structure, and build analysis notebooks that will ultimately populate your dashboards with meaningful KPIs and metrics.
What are Investigations?
Think of investigations as folders within mindzie Studio that help you organize your analytical work. When you create an investigation, you're creating a container that can hold multiple analyses, each focused on a specific metric, insight, or aspect of your process.
Best Practice: Align your investigation names with your dashboard names. For example, if you have a "Process Overview" dashboard, create a "Process Overview" investigation. This naming convention makes it simple for users to understand the relationship between investigations and the dashboards they populate.
Understanding the Investigation Workflow
The typical workflow for working with investigations follows this pattern:
- Create dashboard structure - Set up empty dashboards for your different user roles (executive, operations, compliance, etc.)
- Create investigations - Create investigation folders aligned with each dashboard
- Build analyses - Within each investigation, create analyses for specific metrics and KPIs
- Populate dashboards - Publish your analyses to the appropriate dashboards for end users
This front-to-back approach ensures your entire project structure is organized before you start building complex metrics.
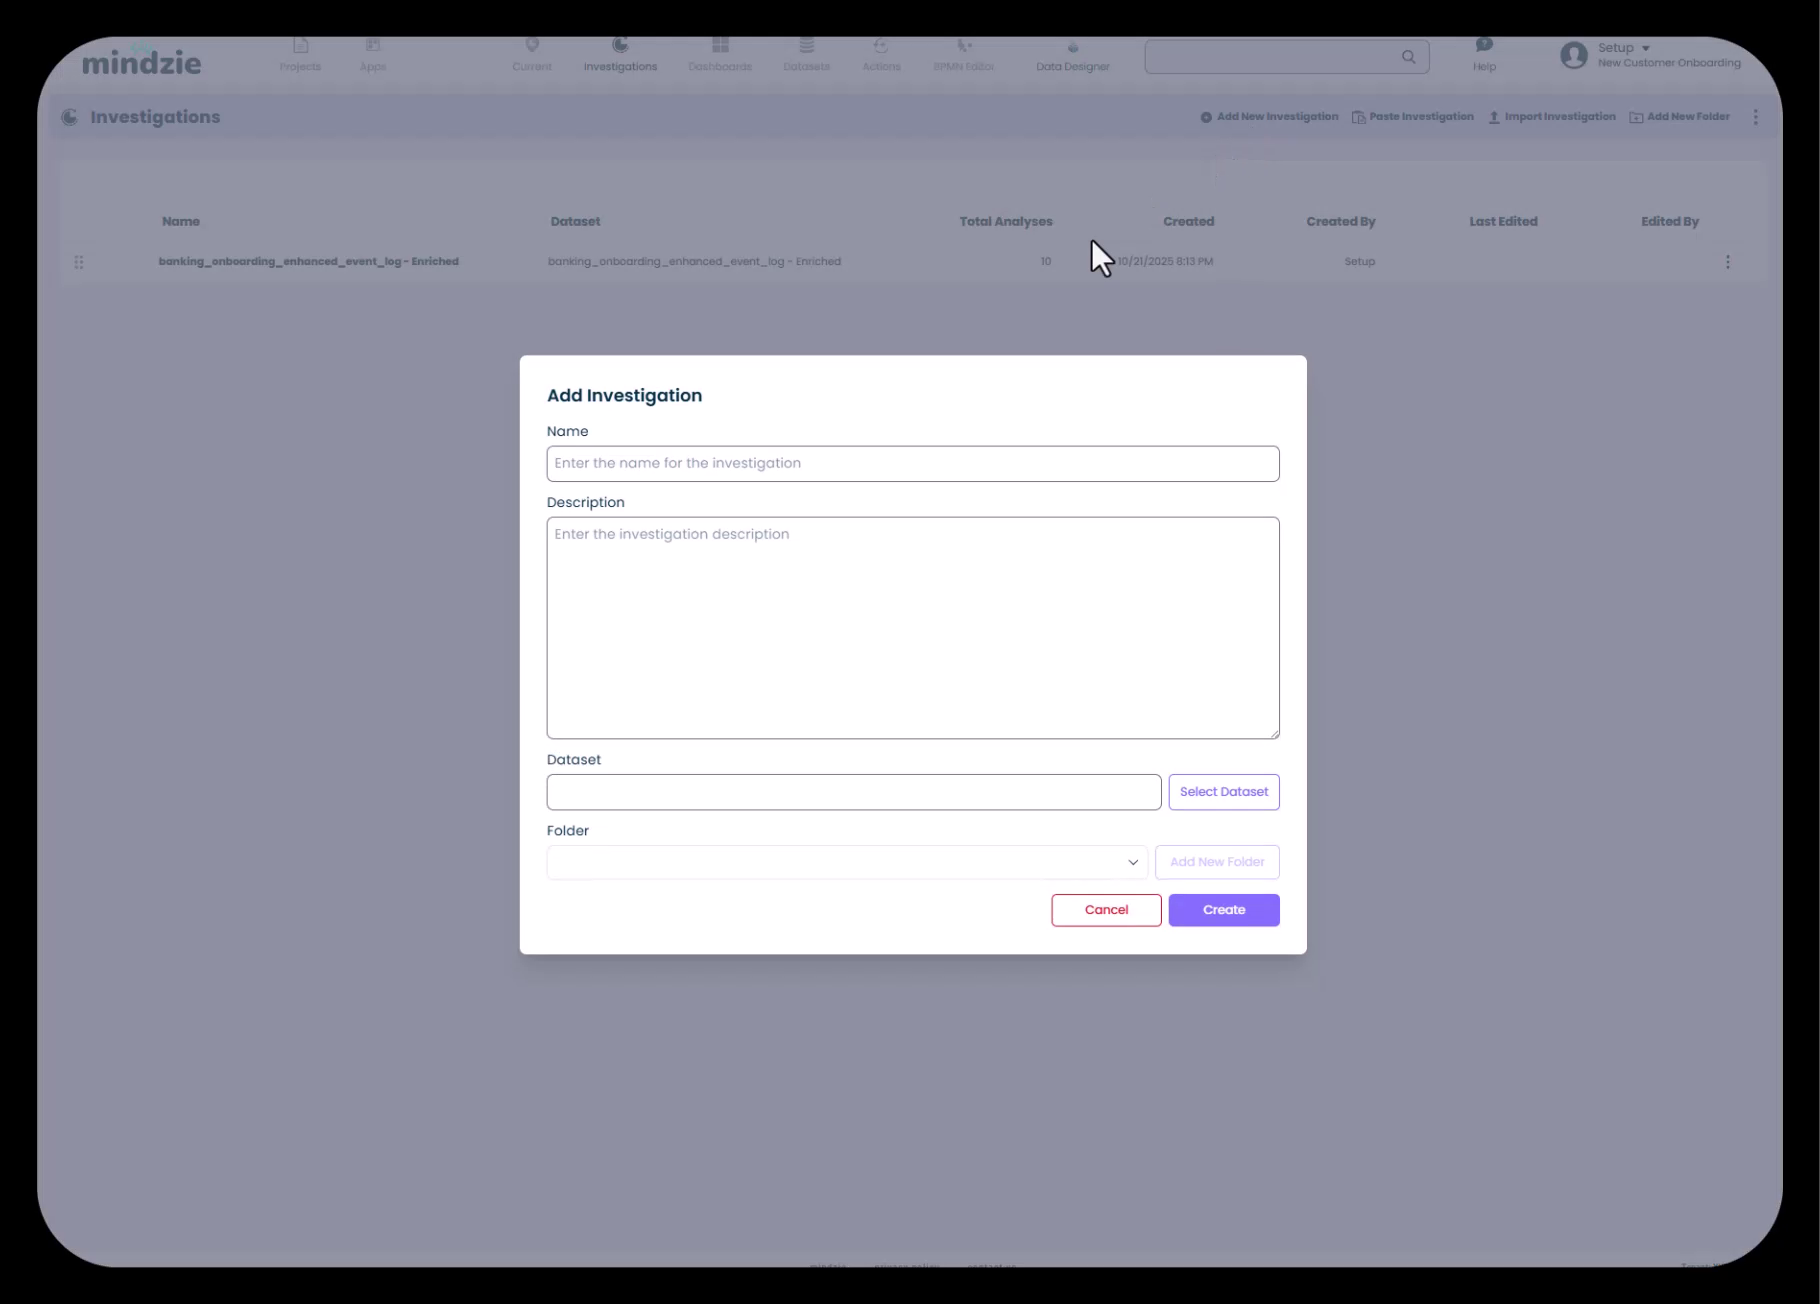
Creating an Investigation
To create a new investigation:
- Navigate to the Investigations section in the top navigation bar
- Click Add New Investigation
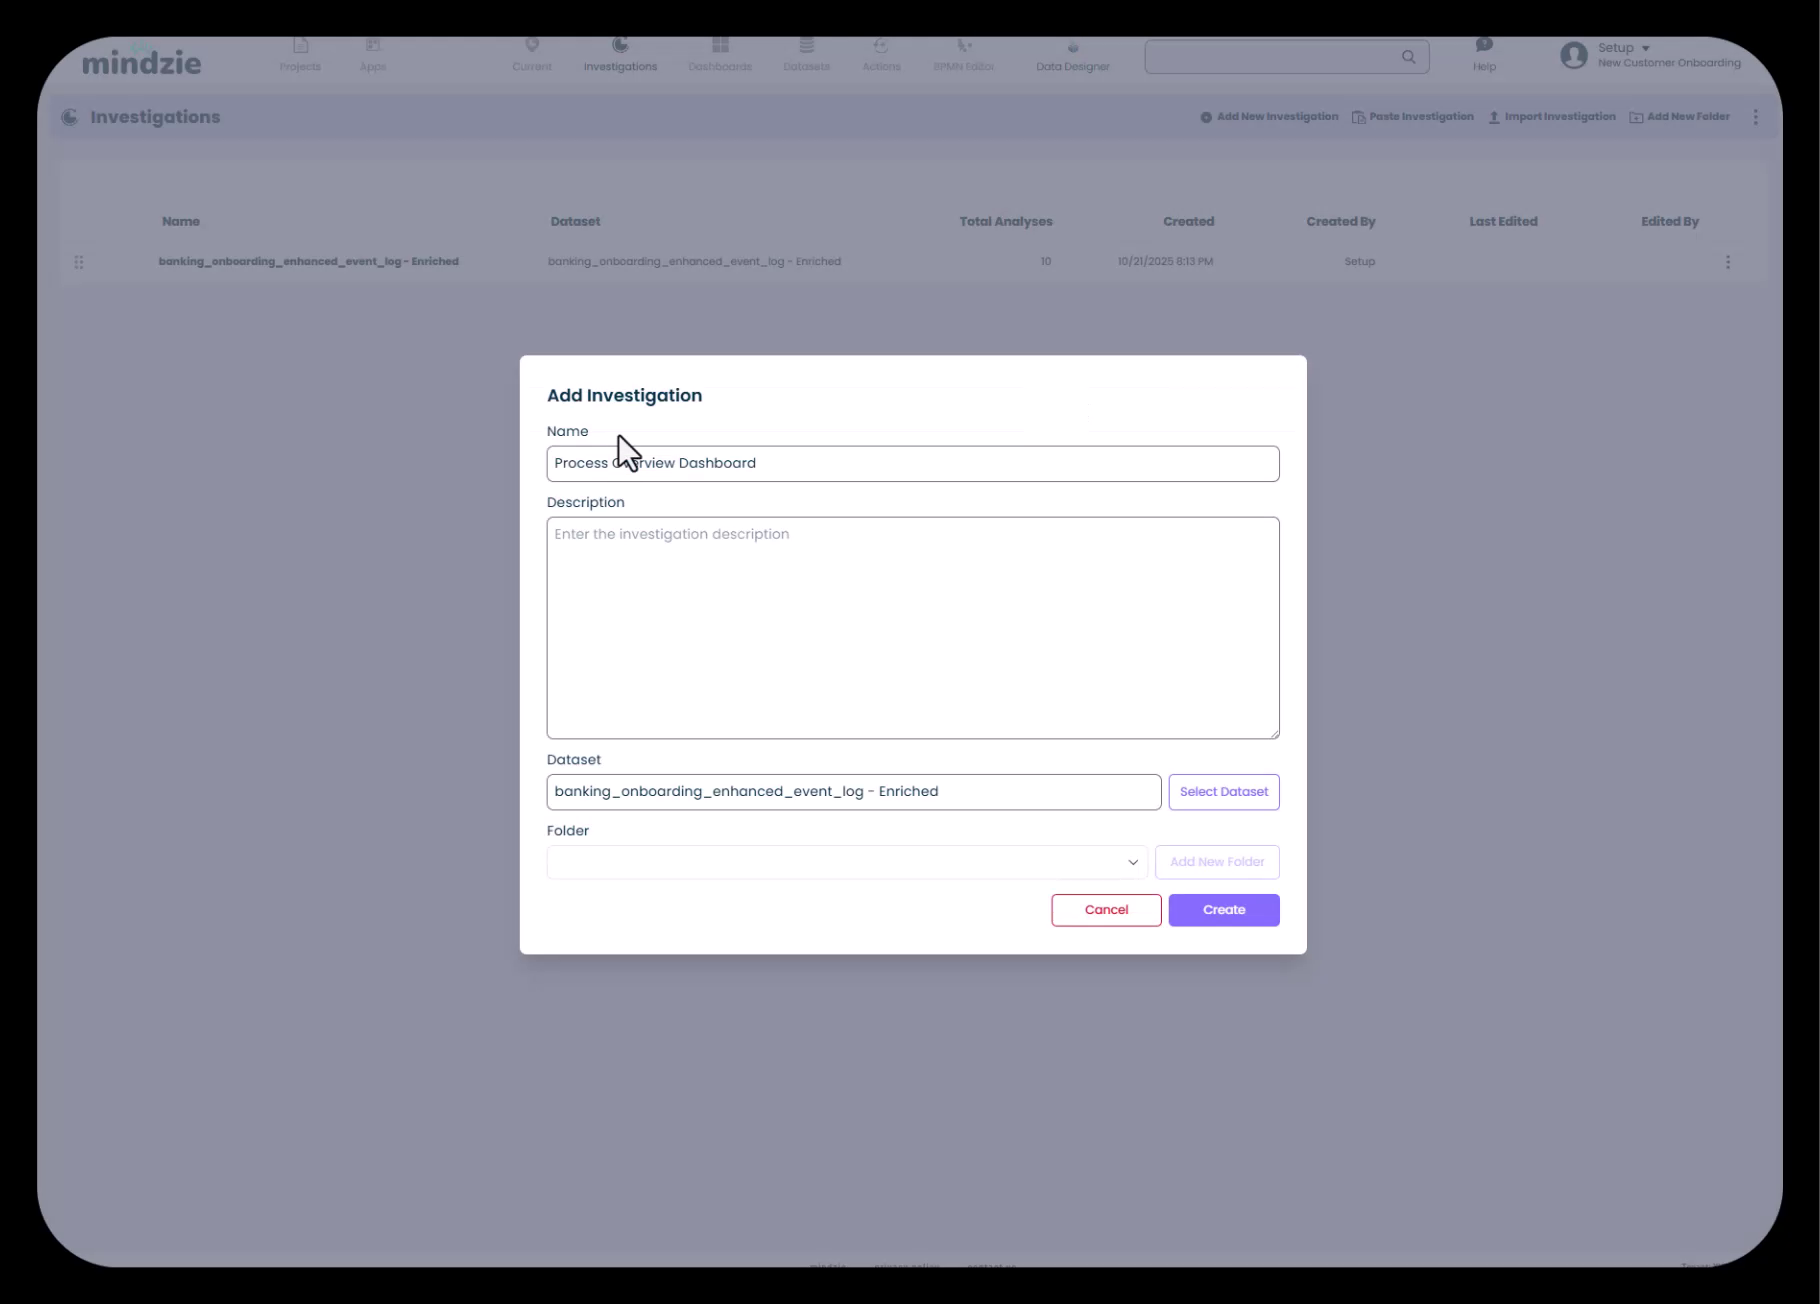
- In the dialog that appears, provide:
- Name: Give your investigation a descriptive name (ideally matching a dashboard name)
- Description: Add details about what this investigation focuses on
- Dataset: Select which dataset this investigation will analyze
- Folder: Optionally organize investigations into folders
Selecting the Dataset
When creating an investigation, you'll need to select which dataset to analyze. Remember that mindzie Studio maintains two datasets:
- Original dataset: Your raw event log data as uploaded
- Enriched dataset: The enhanced dataset created by mindzie's data pipeline with performance metrics, conformance rules, and other calculated attributes
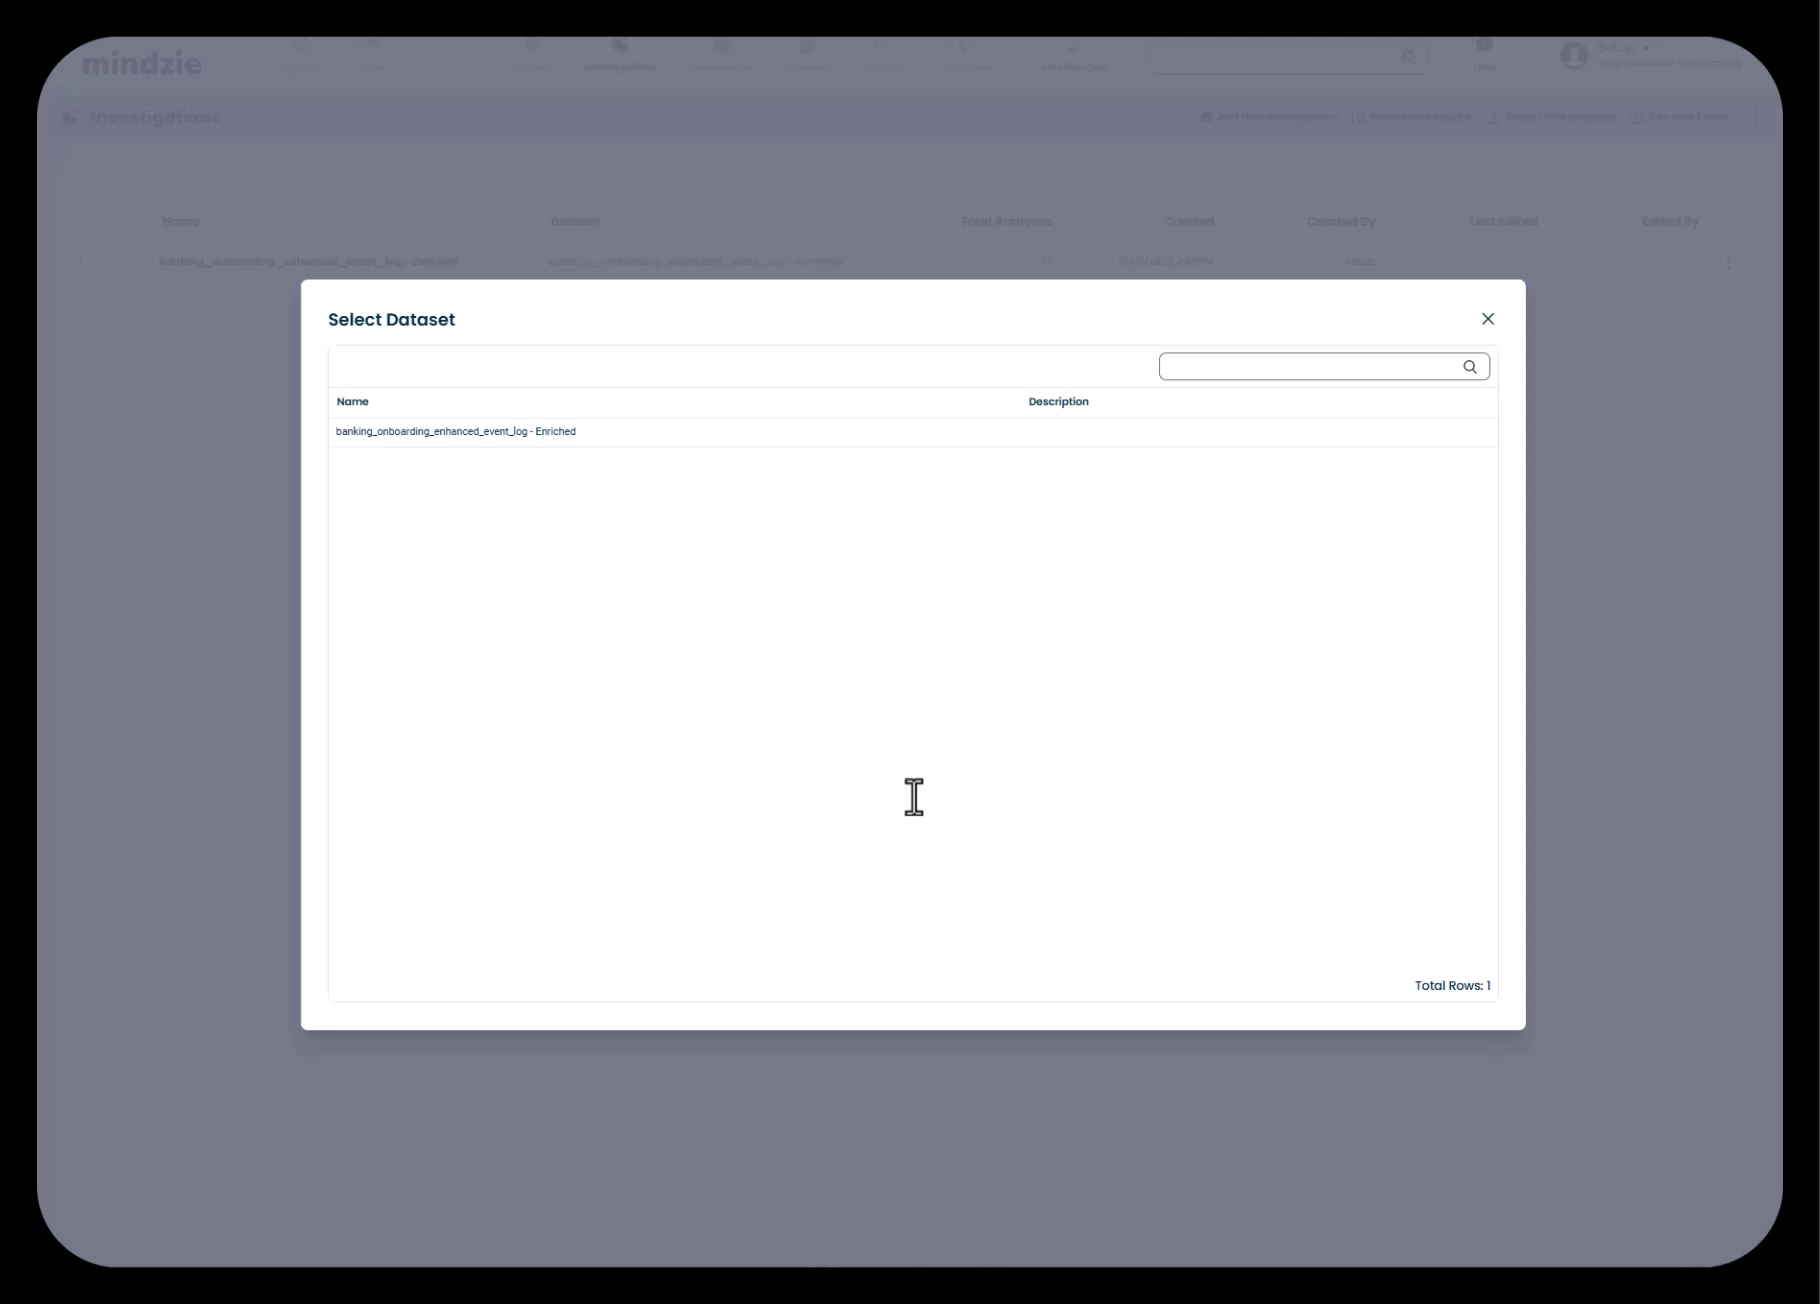
For most analyses, you'll want to select the enriched dataset because it contains all the performance metrics and calculated attributes that enable powerful analysis.
Understanding the Investigation Structure
Once created, your investigation appears in the investigations list. If data was recently uploaded, mindzie may have already created a default investigation with pre-built analyses to give you a head start.
You can delete or modify these default investigations to align with your specific dashboard structure. The goal is to create a clean, organized structure that makes sense for your end users.
Creating Analysis Notebooks
Within each investigation, you can create multiple analysis notebooks. Each notebook focuses on a specific metric or insight you want to explore.
Types of Analysis You Can Create
When you click to create a new analysis, mindzie Studio offers several options:
- Notebook Analysis - A blank notebook where you build custom analyses using filters and calculators
- Process Map Analysis - Pre-configured to display the process flow
- Variant DNA Analysis - Focused on analyzing process variants
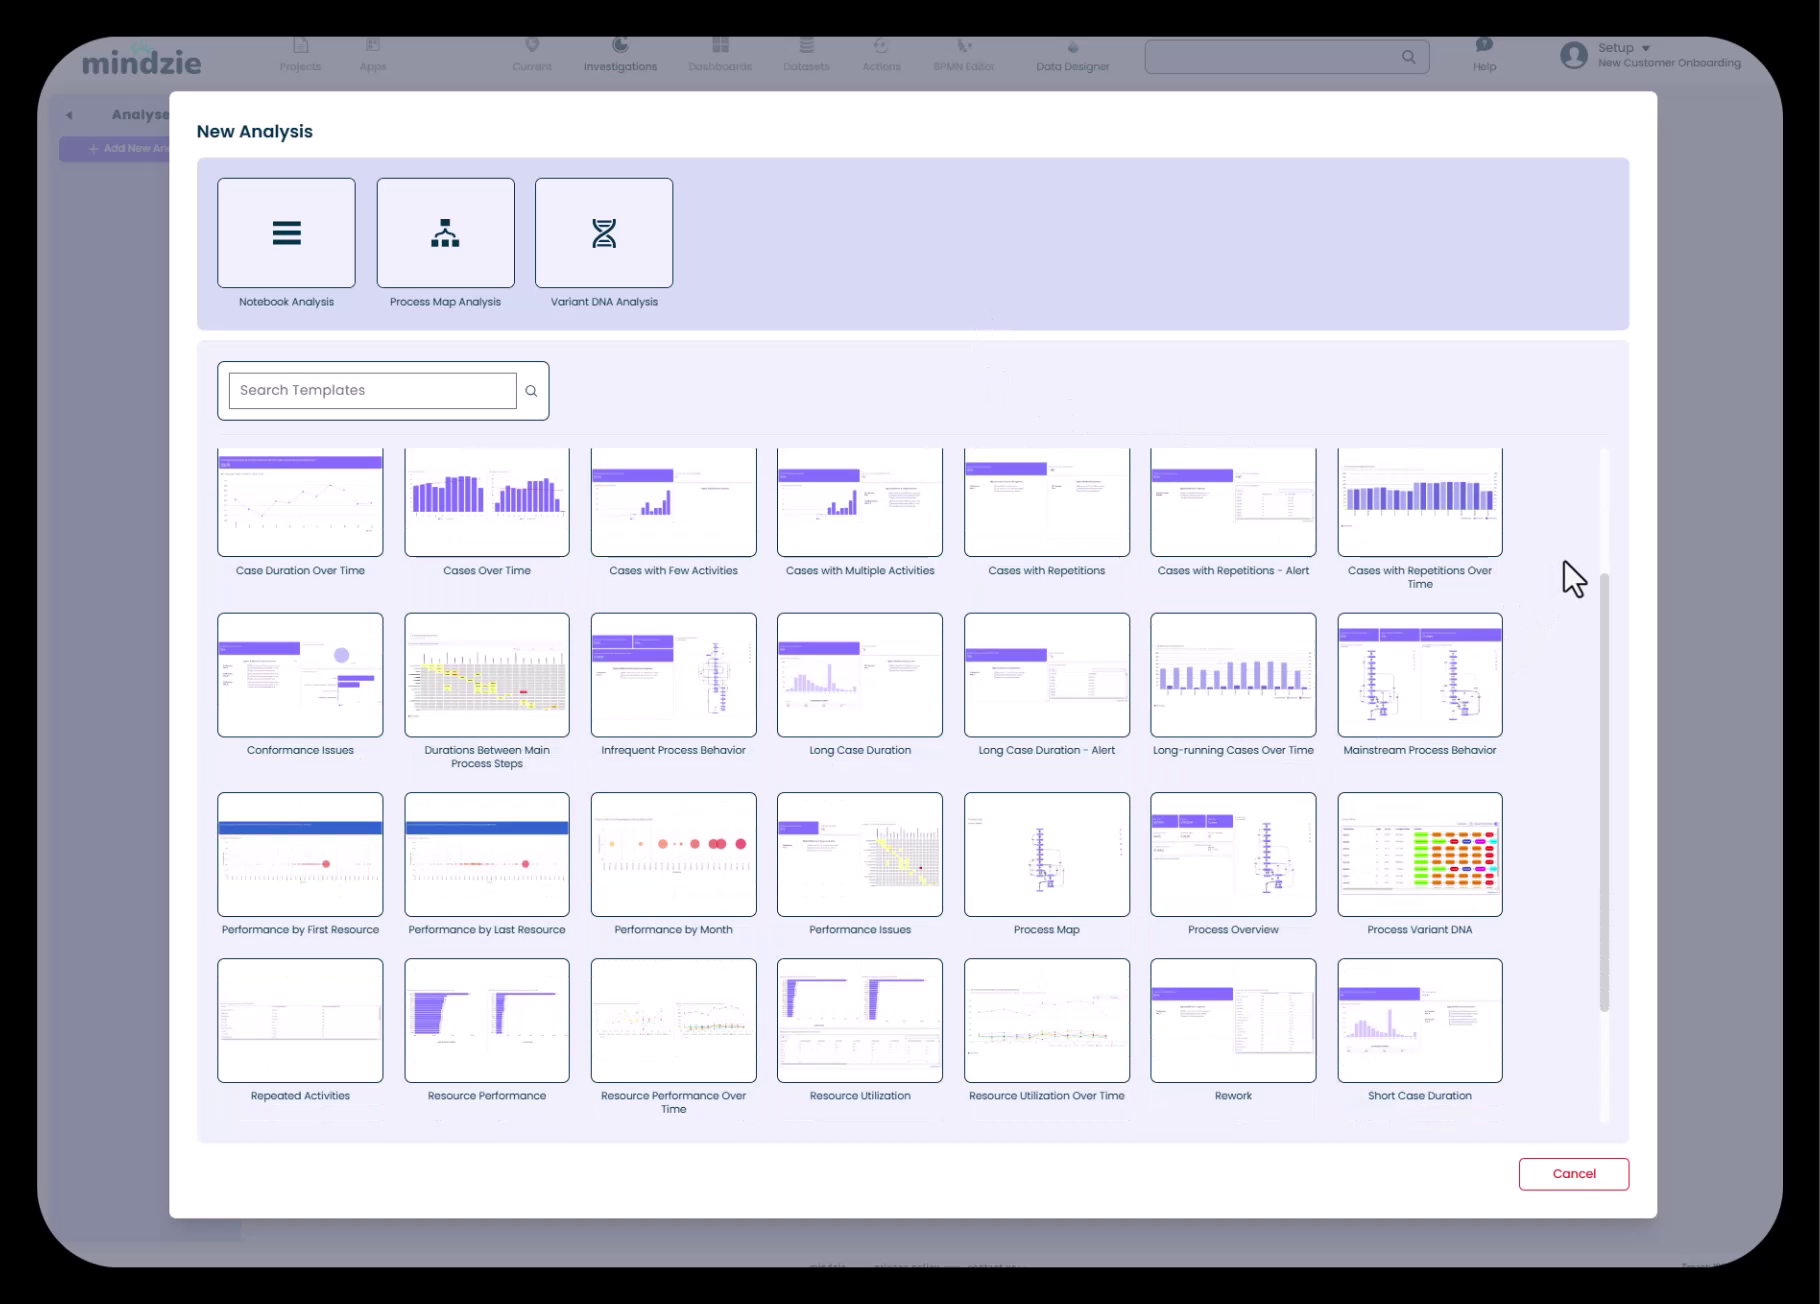
Using Analysis Templates
mindzie Studio provides a gallery of analysis templates that give you a head start on common analyses:
- Case Duration Over Time
- Cases Over Time
- Cases with Few Activities
- Cases with Multiple Activities
- Conformance Issues
- Durations Between Main Process Steps
- Performance by Resource
- Process Map
- Process Overview
- And many more...
These templates are shortcuts that set up common analyses with pre-configured filters and calculators. However, you can also create everything from scratch using a blank notebook.
Creating a Blank Analysis
To create a blank analysis notebook:
- Click Add New within your investigation
- Select Notebook Analysis (the blank notebook option)
- Enter a name that describes the metric you're investigating (e.g., "Average Onboarding Duration")
- Click Create
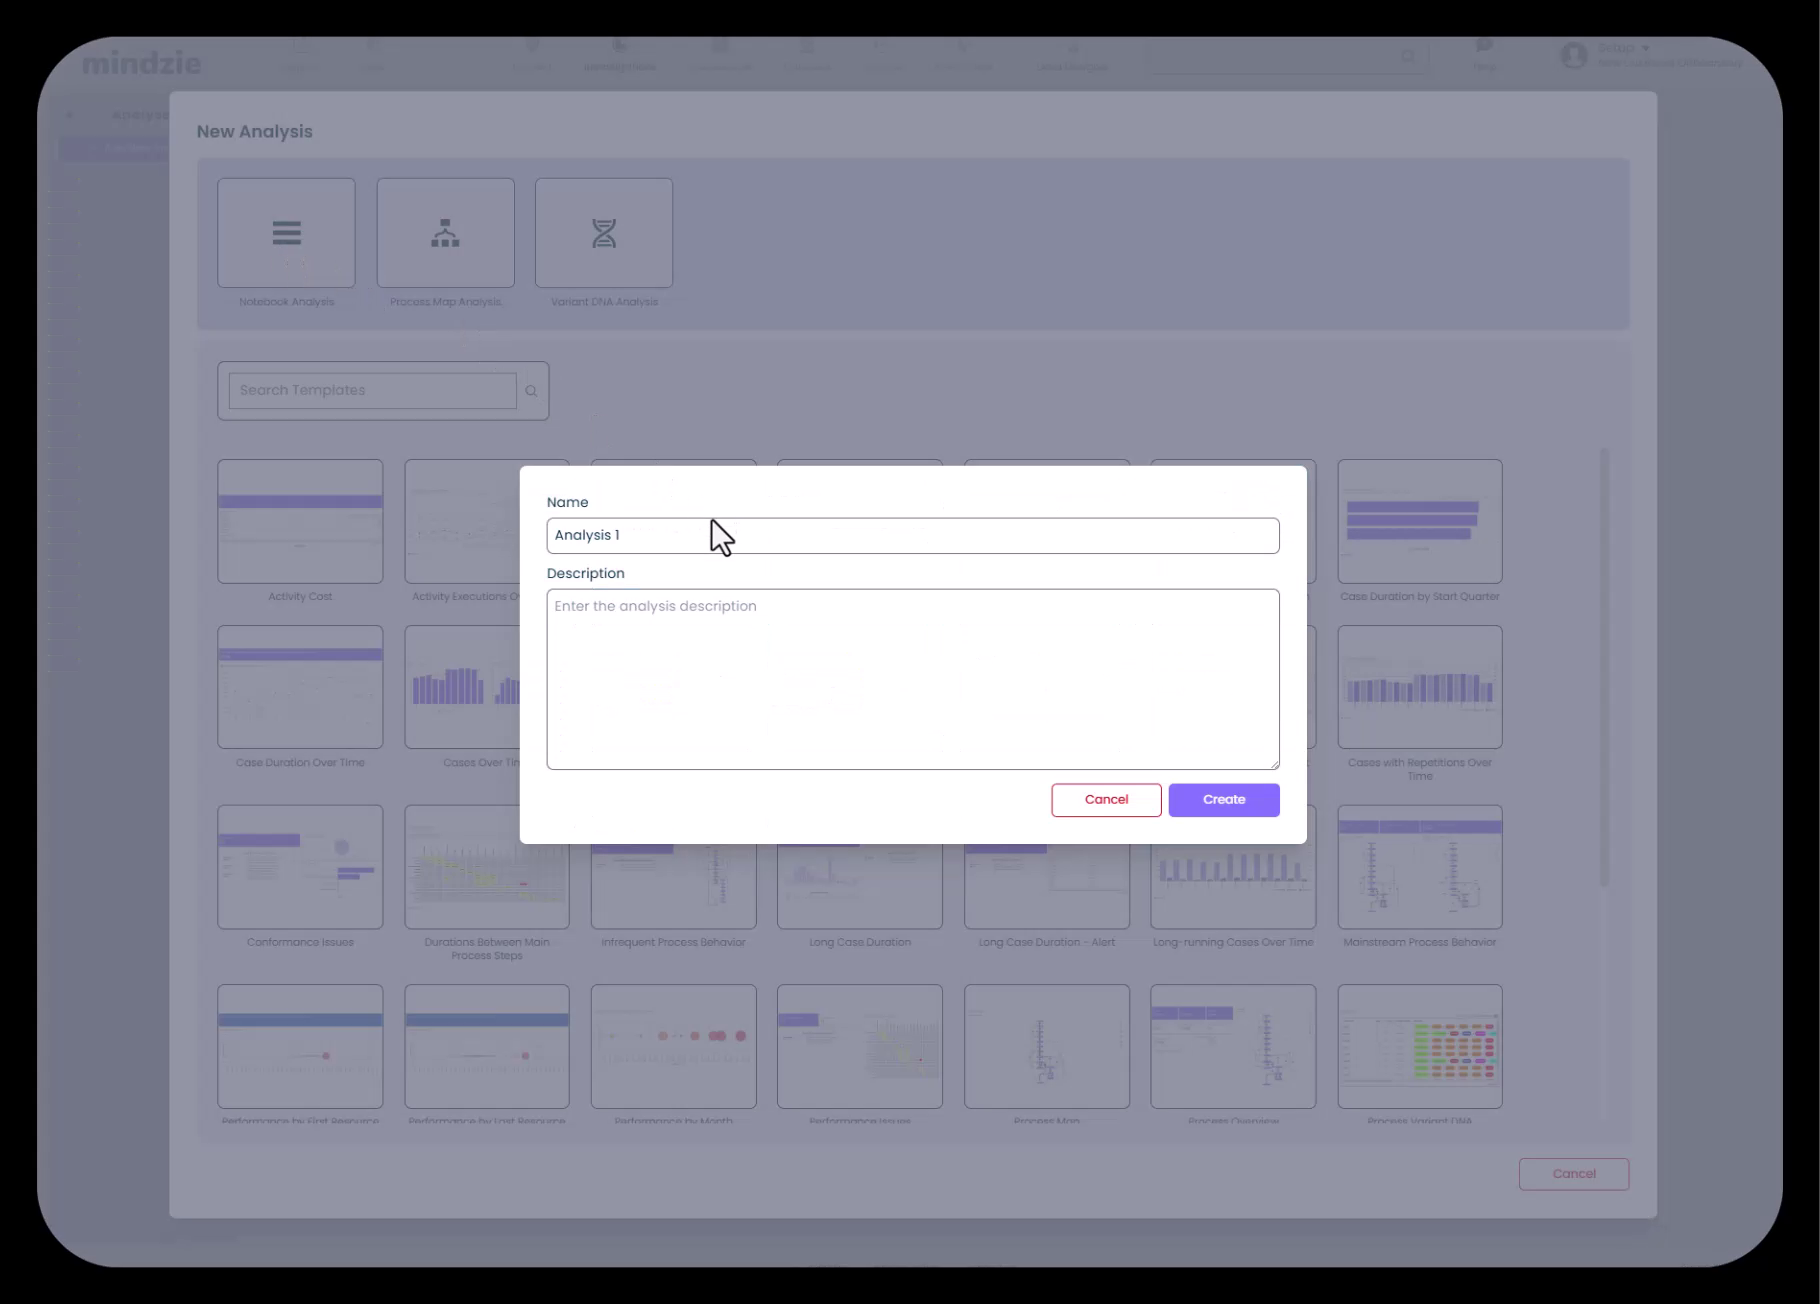
The analysis name should clearly indicate what insight you're looking for. This makes it easier to find analyses later and understand what each notebook contains.
The Analysis Notebook Interface
Once created, your analysis notebook opens with a comprehensive interface containing multiple tabs and capabilities:
Notebook Tabs and Features
Each analysis notebook includes:
- Analysis Tab: The main workspace where you add filters, calculators, and build your metrics using mindzie's low-code/no-code approach
- Process Map: A visual representation of your process flow filtered by your analysis criteria
- Variant DNA: Shows the different variants (paths) through your process
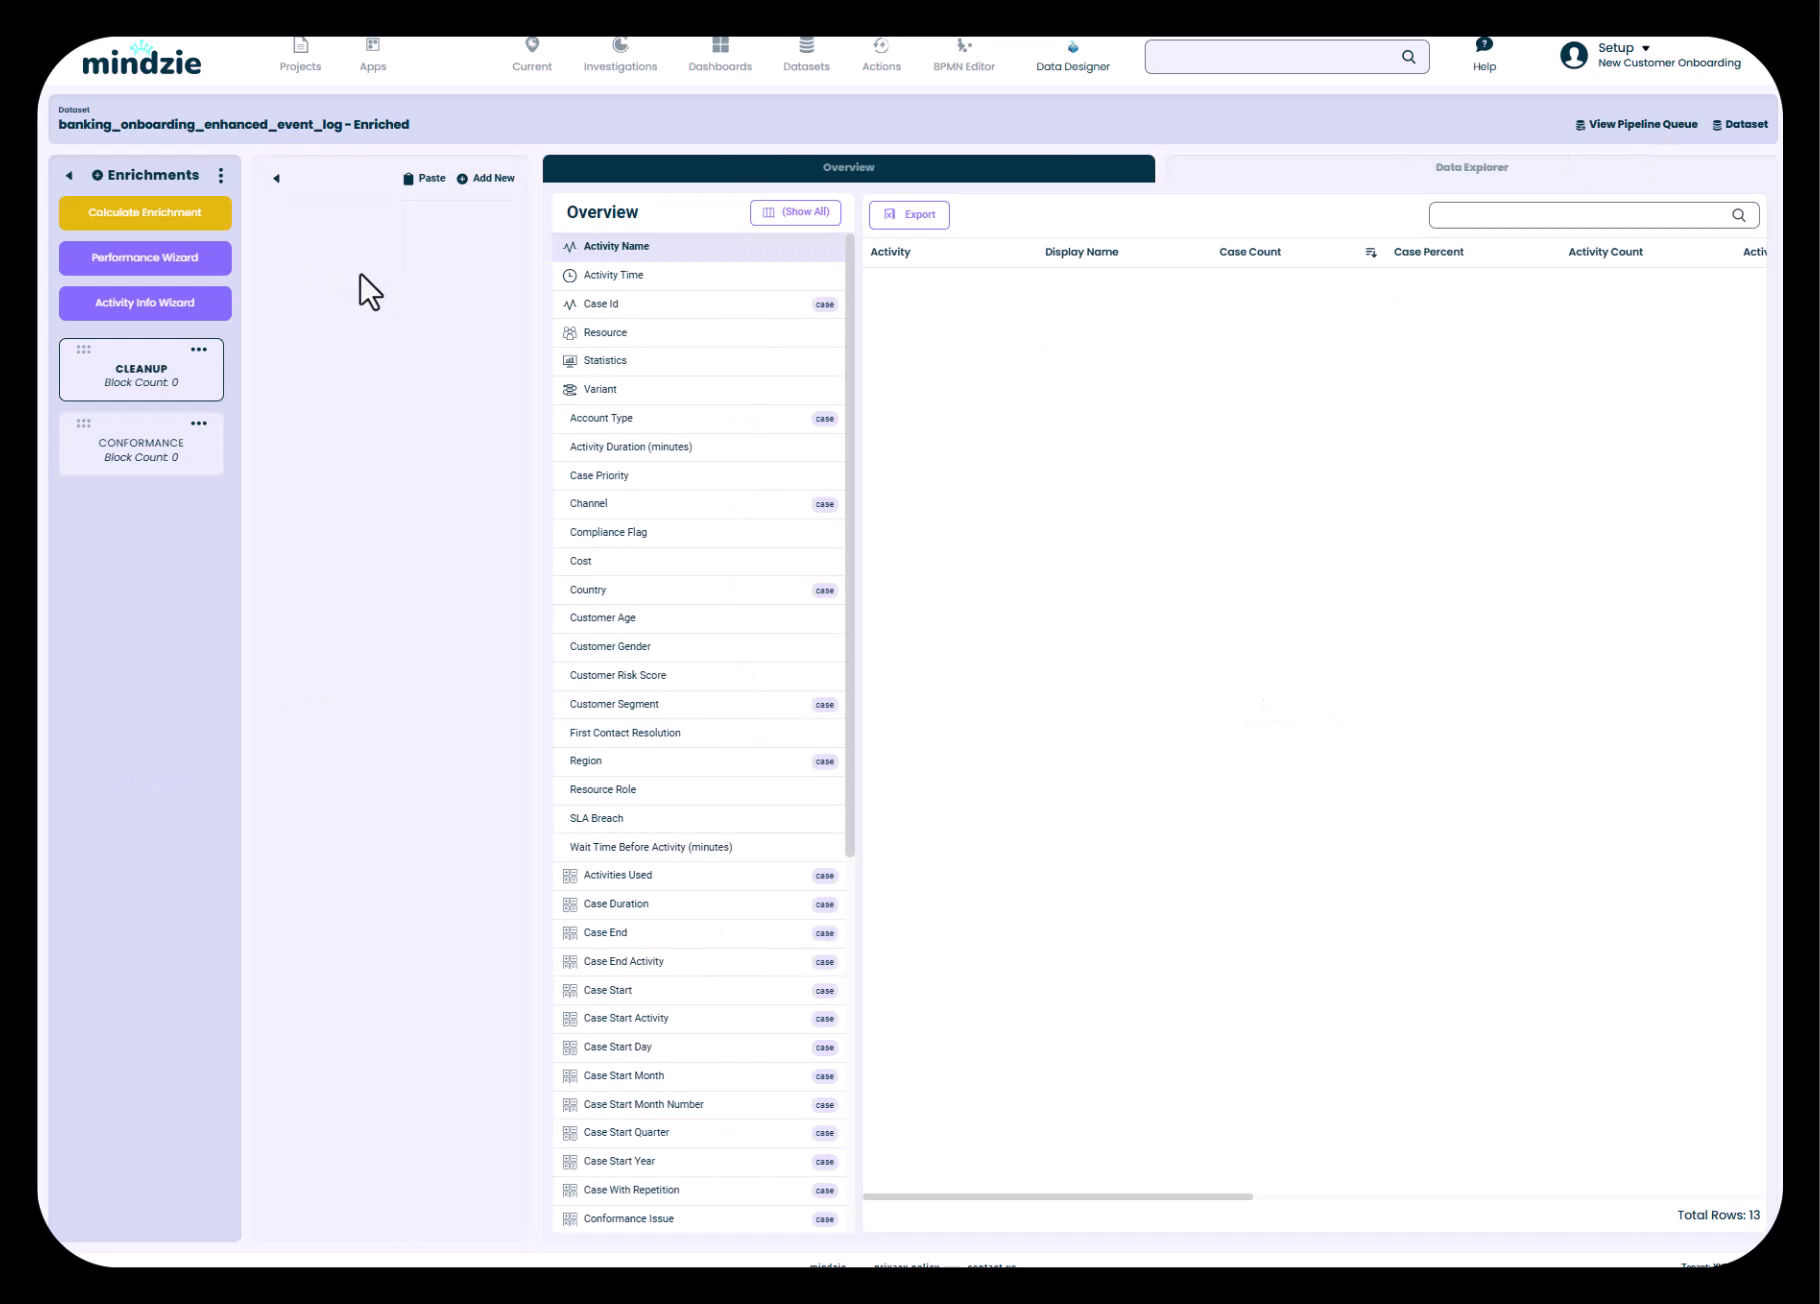
- Data Overview: Displays all available attributes and their values in your dataset
- Case Explorer: Lets you drill into individual cases to see specific process instances
- Local Dashboard: A dashboard view specific to this analysis where you can publish blocks
Building Analysis with Filters and Calculators
Within the Analysis tab, you'll use mindzie's core paradigm: filters to isolate specific data segments, and calculators to visualize insights. This low-code/no-code approach makes it easy to build sophisticated metrics without writing code.
For example, to analyze average onboarding duration:
- Add filters to focus on specific divisions, departments, or regions
- Add calculator blocks to compute and display average case duration
- Use the enriched attributes created by log enrichment to power your calculations
Leveraging the AI Co-Pilot
Each analysis notebook includes access to mindzie's AI co-pilot, which can assist you with:
- Understanding your data
- Suggesting relevant filters and calculators
- Answering questions about your process
- Providing insights based on your analysis
The co-pilot is context-aware and understands the specific investigation and dataset you're working with.
Organizing Multiple Analyses
Within a single investigation, you can create as many analysis notebooks as needed. For a "Process Overview" investigation, you might create separate analyses for:
- Average case duration
- Case volume over time
- Cases with conformance issues
- Cost per case
- Resource utilization
Each analysis becomes a building block that can be published to dashboards, creating a comprehensive view for your end users.
Next Steps
Now that you understand investigations and analysis notebooks, you're ready to:
- Enhance your data - Use the log enrichment engine to add performance metrics, conformance rules, and custom attributes
- Build metrics - Create specific analyses using filters and calculators
- Publish to dashboards - Move your completed analyses to global dashboards for end users
The investigation structure you create now will serve as the foundation for all your process mining insights in mindzie Studio.
Key Takeaways
- Investigations are folders that organize related analyses
- Align investigation names with dashboards for clarity and ease of use
- Select the enriched dataset for most analyses to access calculated attributes
- Use templates or start from scratch depending on your needs
- Each notebook includes multiple tabs - analysis, process map, variant DNA, data overview, and case explorer
- The AI co-pilot is available to assist throughout your analysis work
- Build front-to-back - create structure first, then populate with metrics