Uploading and Configuring Data Sources
Overview
This guide walks you through the process of uploading CSV data into mindzie Studio and configuring key columns for process mining analysis. Properly mapping your data columns is essential for mindzie to analyze your business processes effectively.
Prerequisites
Before uploading data, ensure you have:
- A CSV file containing your process event log data
- At minimum, the following columns in your data:
- Case ID: A unique identifier for each process instance
- Activity: The name of each process step or activity
- Timestamp: Date and time when each activity occurred
- Resource (recommended): The person or system that performed the activity
Choosing Your Data Import Method
mindzie offers two primary methods for importing data into your projects:
CSV Upload
Best for:
- One-time data analysis
- Testing and proof-of-concept projects
- Smaller datasets
- Manual data refresh scenarios
mindzie Data Designer
Best for:
- Continuous monitoring and scheduled updates
- Connecting directly to databases or data warehouses
- Complex ETL transformations
- Production deployments with automated data refresh
This guide focuses on the CSV upload method, which is the quickest way to get started with mindzie Studio.
Step-by-Step: Uploading a CSV File
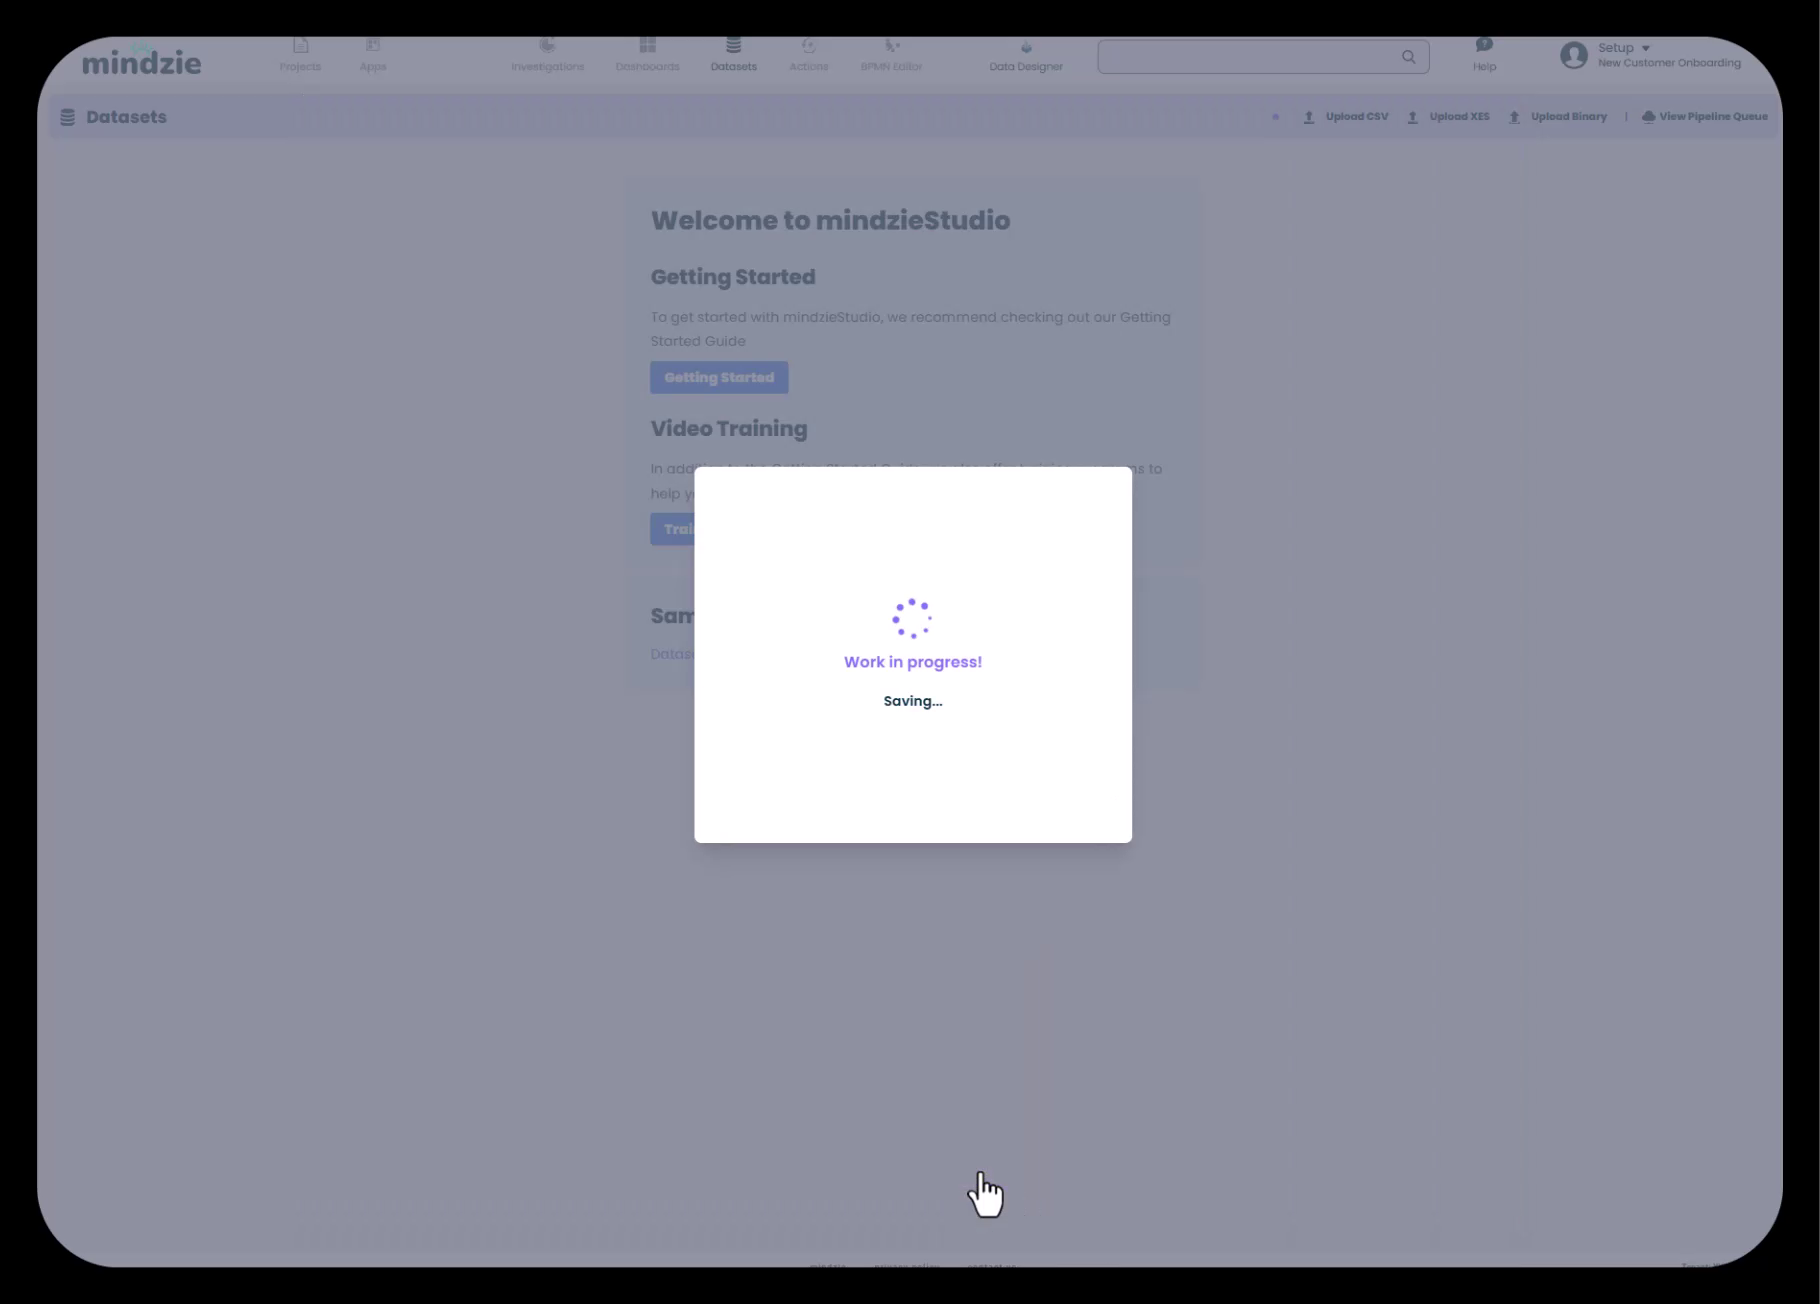
Step 1: Navigate to the Datasets Area
When you first enter your project in mindzie Studio, you'll be taken to the Datasets section automatically. If you're not already there:
- Click on the Datasets tab in the top navigation bar
- You'll see the "Welcome to mindzieStudio" screen with several options
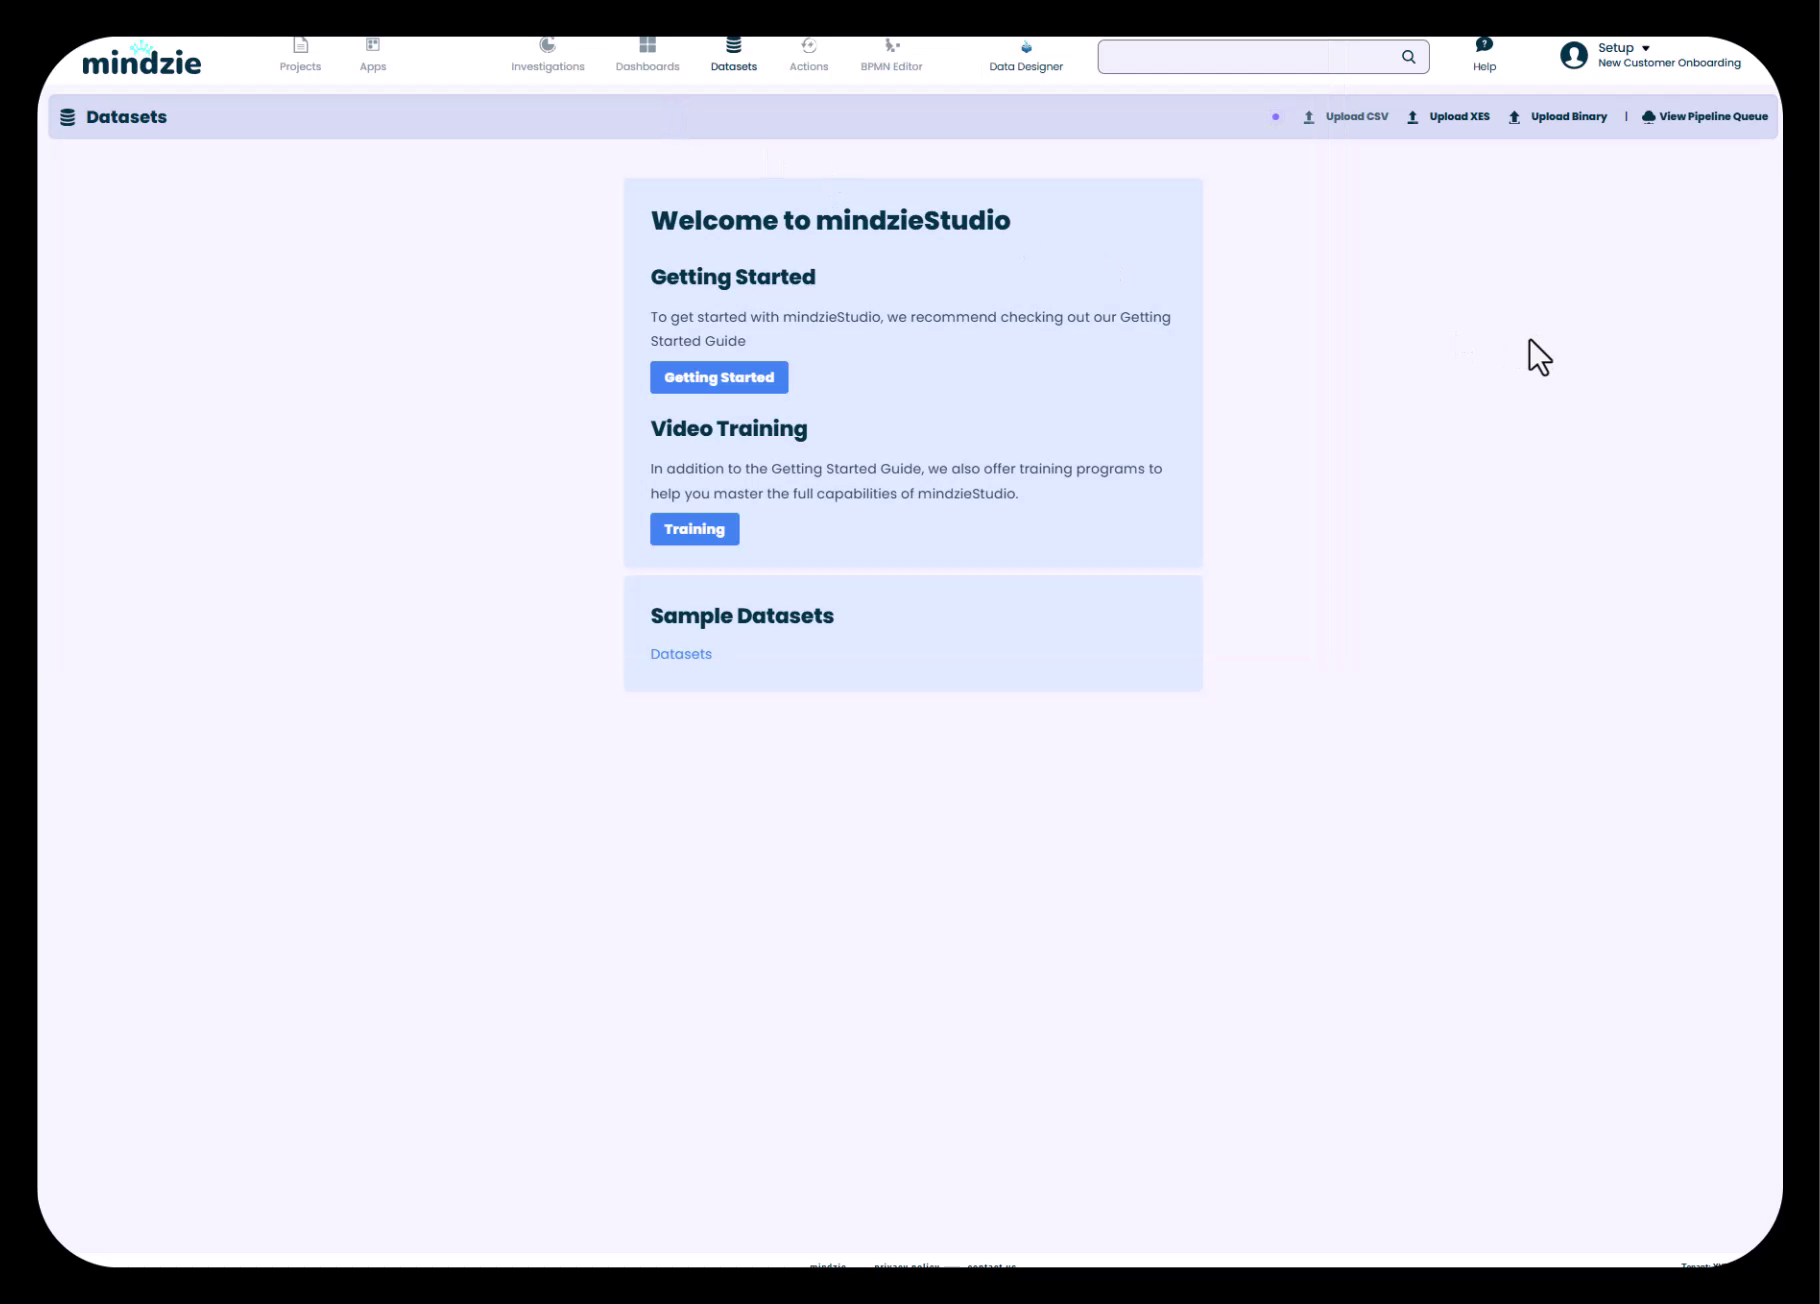
Step 2: Select Upload CSV
On the Datasets screen, click the Upload CSV button in the top-right corner of the interface. This will open a file browser dialog.
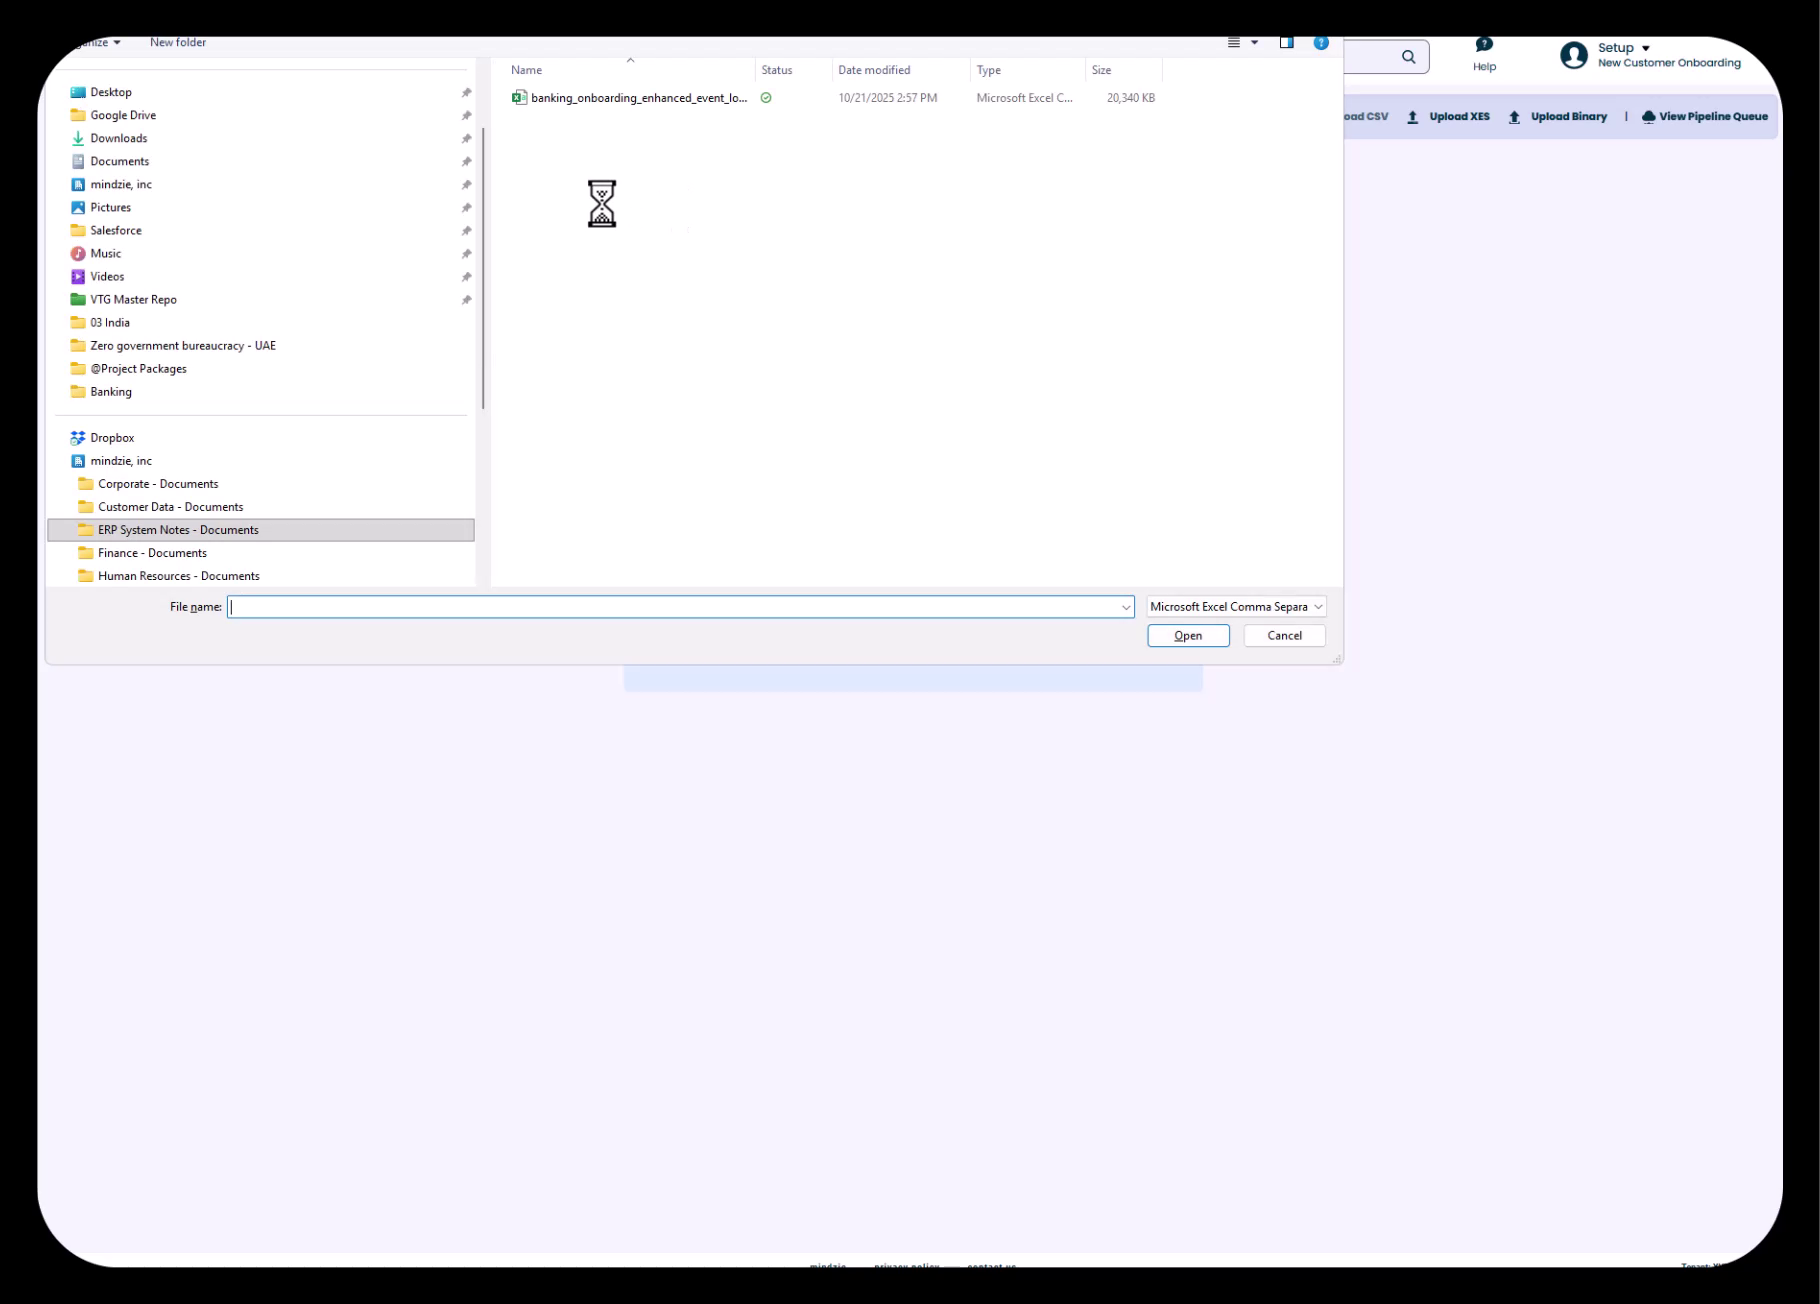
Step 3: Select Your CSV File
- Navigate to the location of your CSV file on your computer
- Select the file (e.g.,
banking_onboarding_enhanced_event_log.csv) - Click Open to begin the upload
The system will display a loading indicator showing the upload progress.
Step 4: Validate and Configure Data Settings
After the file uploads, mindzie Studio will display a preview of your data and allow you to configure settings:
Encoding Settings
- The system will auto-detect the file encoding
- If your data contains special characters, you may need to adjust the encoding setting
Data Preview
- Review the preview to ensure your data loaded correctly
- Check that columns appear properly separated
- Verify that timestamps and other values display as expected
Once you've reviewed the settings, click Next to proceed to column mapping.
Configuring Key Columns
The column mapping screen is where you tell mindzie Studio which columns in your CSV correspond to the key process mining fields.
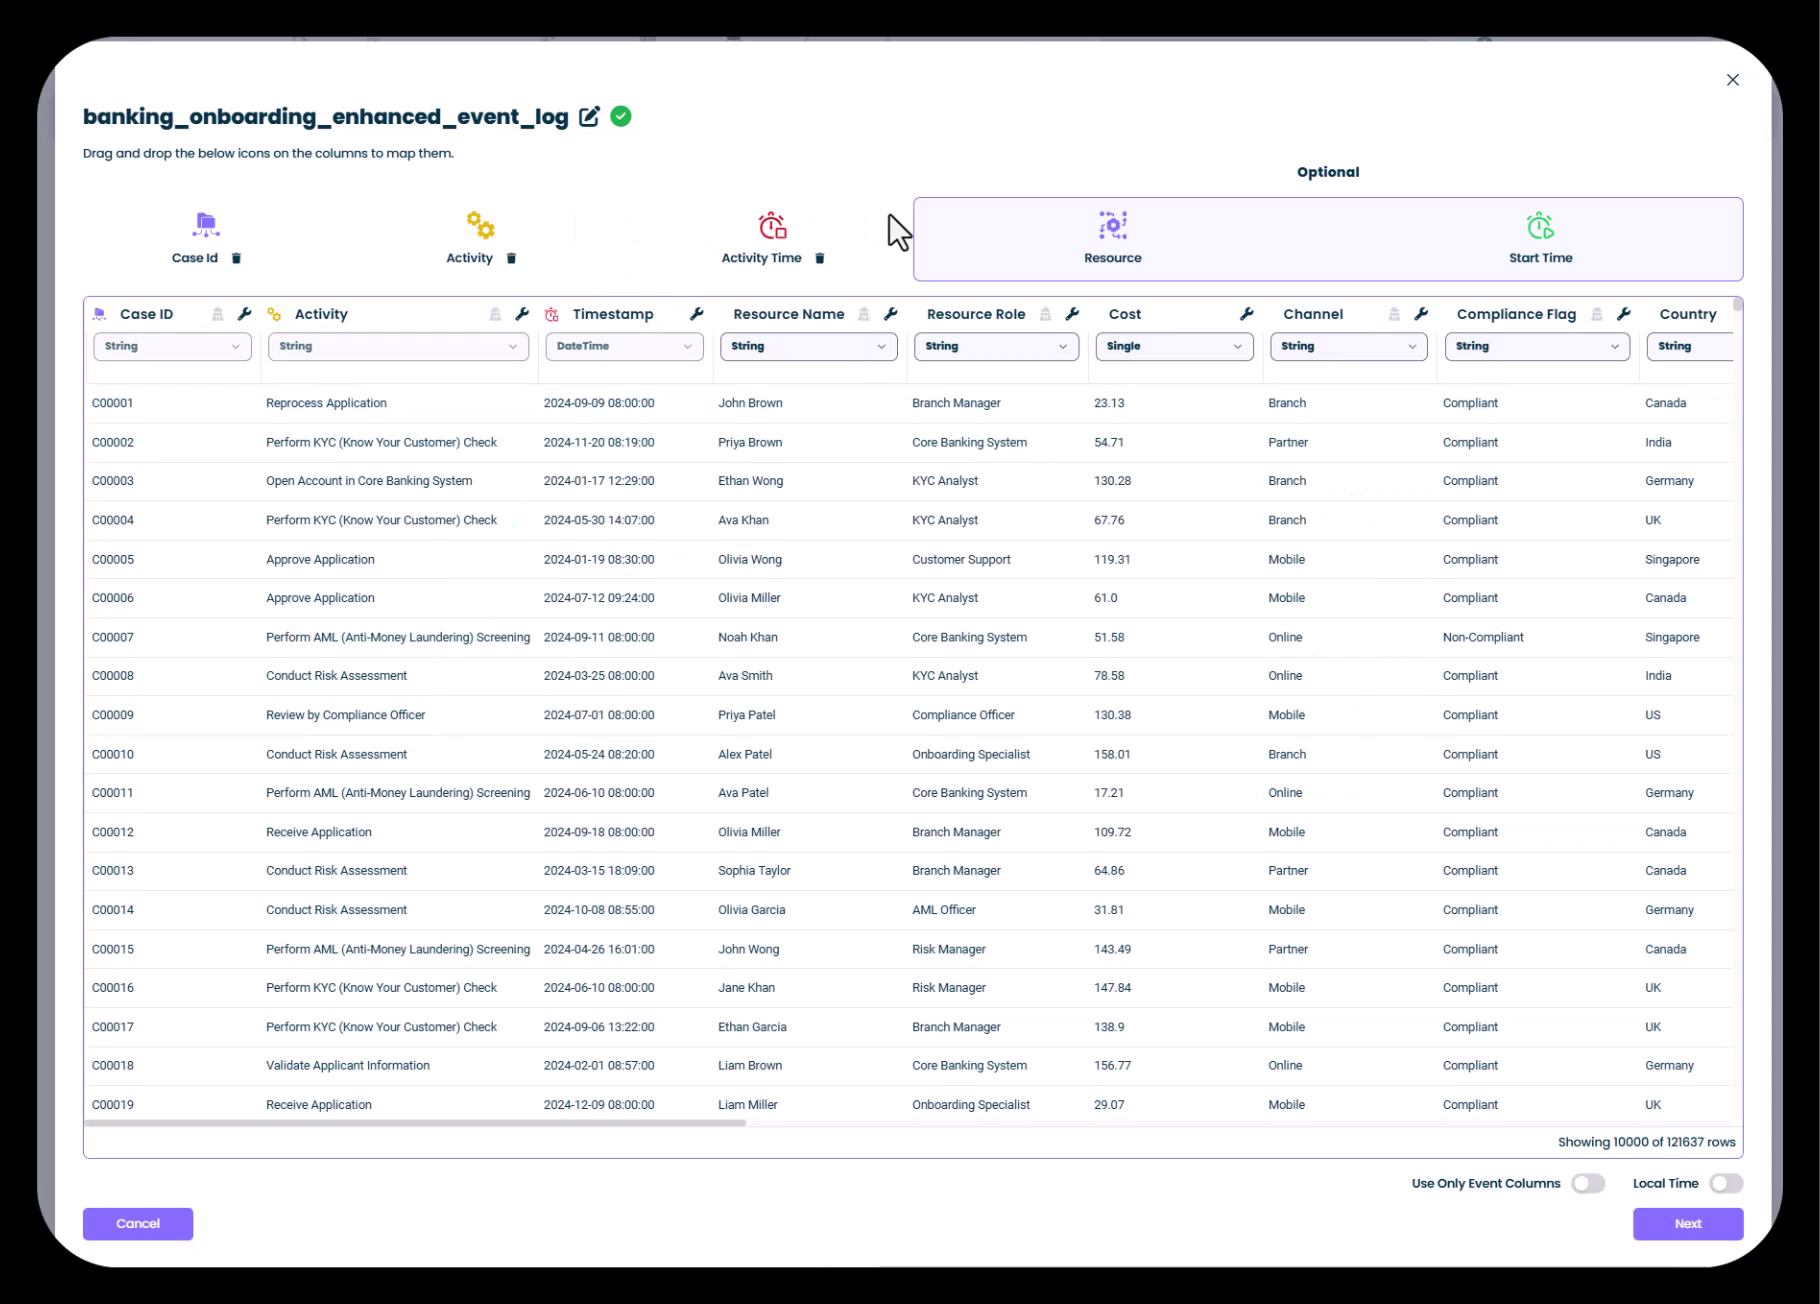
Understanding the Key Column Icons
mindzie Studio uses visual icons to help you identify and map the key columns:
- Case ID: Purple icon - Identifies unique process instances
- Activity: Yellow icon - Contains the names of process steps
- Activity Time: Orange icon - Timestamp for when each activity occurred
- Resource: Blue icon - Person or system performing the activity
Step 5: Map Your Columns with Drag-and-Drop
mindzie Studio will automatically detect and suggest mappings for common column names. To map or change column assignments:
- Automatic Detection: The system typically auto-detects standard columns like Case ID, Activity, and Timestamp
- Drag-and-Drop: To manually assign a column, drag it from the bottom section to one of the key column boxes at the top
- Resource Assignment: If you have a resource column (recommended), drag it to the Resource field
In the example shown:
- Case ID is mapped to the
Case IDcolumn - Activity is mapped to the
Activitycolumn - Timestamp is mapped to the
DateTimecolumn - Resource Name is mapped to the
Resource Namecolumn
Step 6: Configure Additional Column Settings
For each column in your dataset, you can:
Change Column Types
- Click on any column to modify its type
- Options include: String, Number, Date, Boolean, etc.
Modify Data Types
- Adjust how mindzie interprets the data
- Ensure dates are recognized as timestamps
- Confirm numeric values are typed correctly
Anonymize Sensitive Data
- Enable anonymization for columns containing sensitive information
- This is useful for compliance with data privacy regulations
- Names, customer IDs, and other PII can be masked
Optional Columns The "Optional" section on the right side of the screen allows you to map additional process mining attributes:
- Resource Role: Job title or role of the resource
- Cost: Associated costs per activity
- Channel: Process channel (e.g., Branch, Mobile, Online)
- Compliance Flags: Conformance or compliance indicators
- Country/Region: Geographic attributes
Step 7: Process and Save the Dataset
Once you've completed your column mapping:
- Review all mappings to ensure accuracy
- Click Next to begin processing
mindzie Studio will now:
- Transform your CSV data into the mindzie event log format
- Validate data quality and structure
- Create the base dataset for analysis
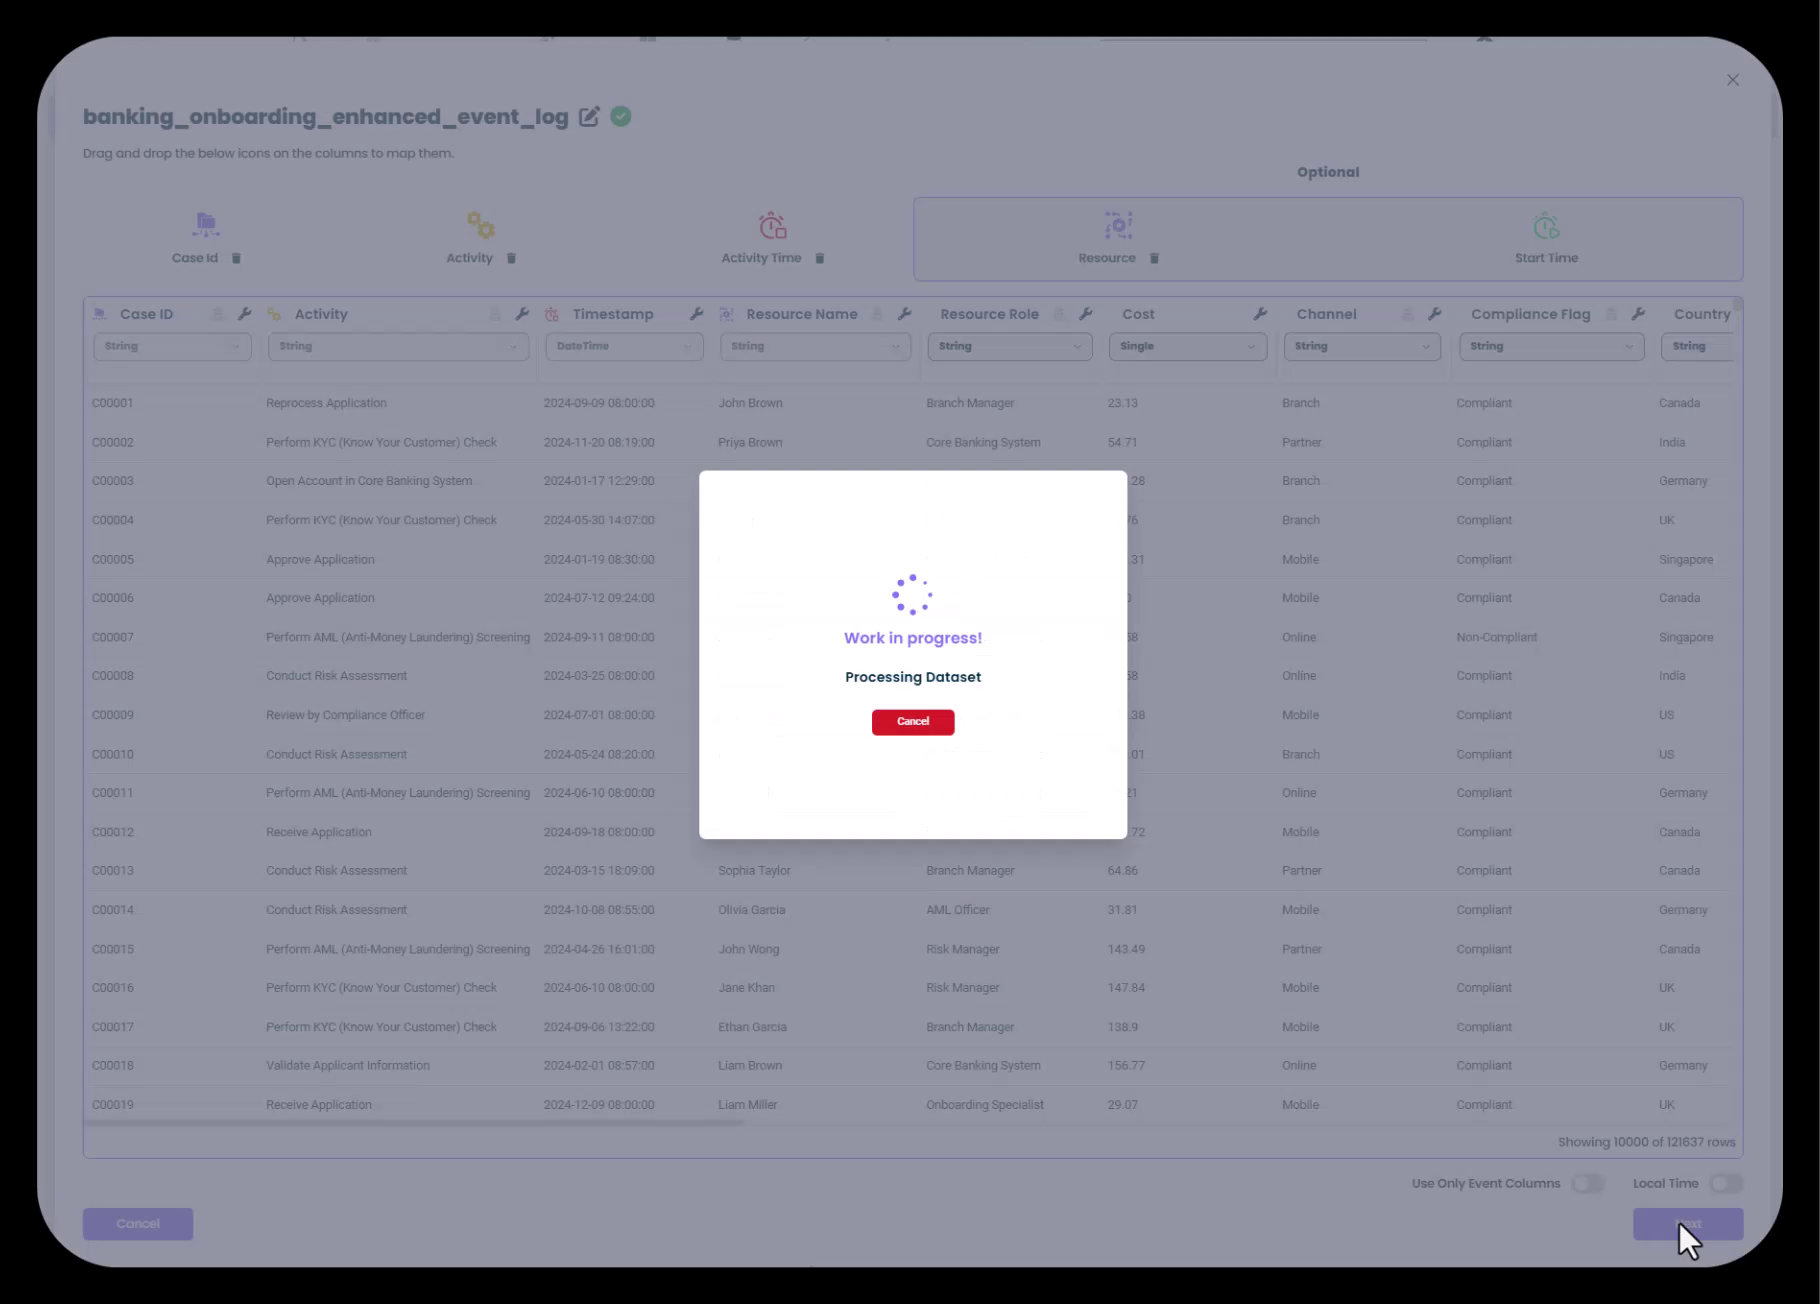
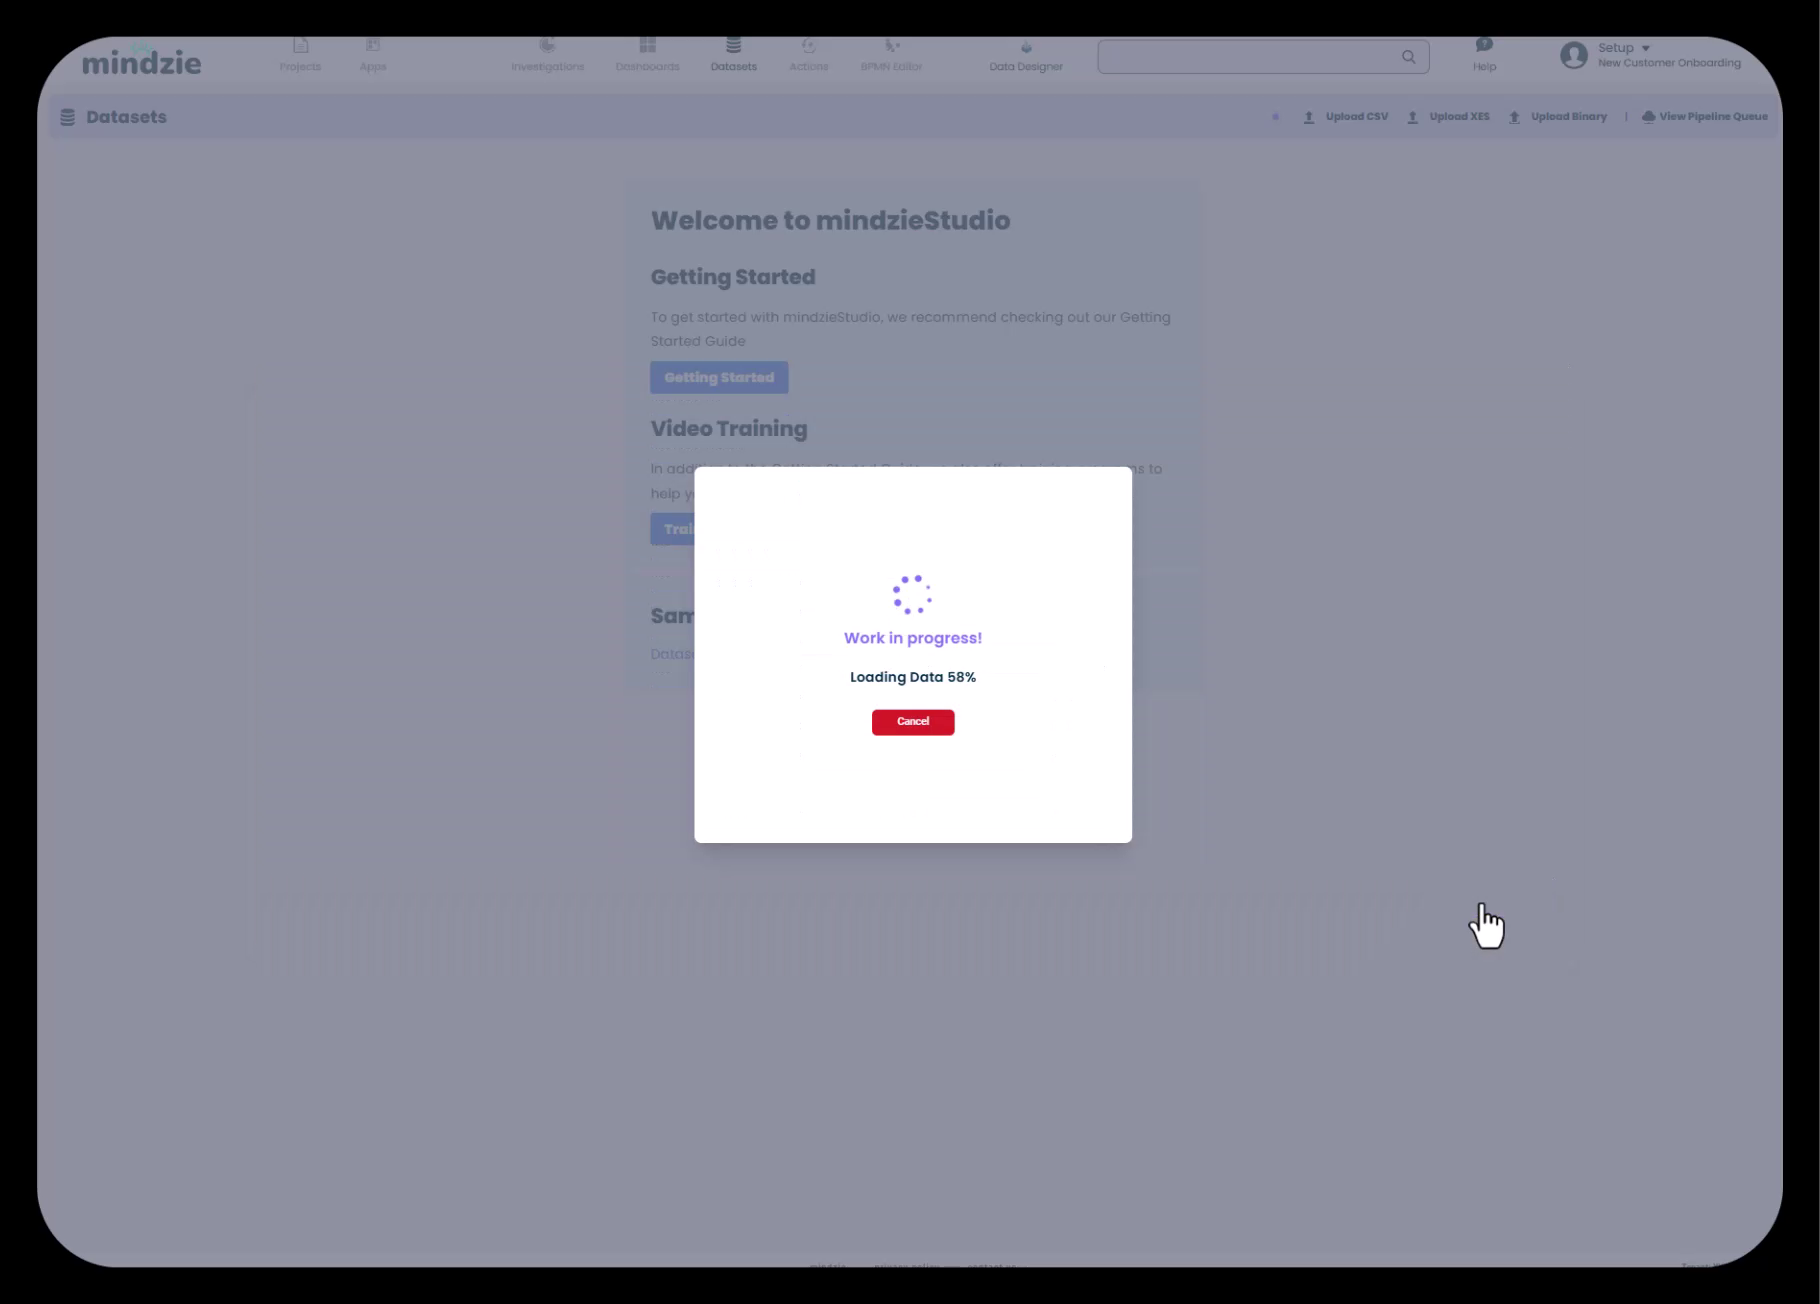
This processing step may take a few moments depending on the size of your dataset. You'll see a "Work in progress! Processing Dataset" dialog during this time.
Step 8: Confirm Data Import Success
After processing completes, mindzie Studio will display a confirmation dialog showing:
- The dataset name
- Total number of cases (process instances)
- Total number of events (activities)
In the example shown, the dataset contains:
- 10,000 cases (unique customer onboarding instances)
- 121,000 events (total activities across all cases)
Click Save to finalize the import.
What Happens After Data Upload
Once you save your dataset, mindzie Studio automatically:
Creates Two Datasets:
- Original Dataset: Your raw event log as uploaded
- Enriched Dataset: Enhanced version created by the mindzie pipeline (used for all analysis)
Builds a Data Pipeline: Prepares your data for enrichment with performance metrics, conformance rules, and other enhancements
Generates Default Analysis: Creates starter analysis including:
- Process overview
- Long case duration analysis
- Duration between main process steps
- Other foundational insights
These default analyses give you a head start on understanding your process and can be customized or removed as needed.
Understanding Data Transformation
During the upload and processing phase, mindzie Studio:
- Standardizes Data Format: Converts your CSV into mindzie's optimized event log structure
- Validates Data Quality: Checks for missing required fields, invalid timestamps, and data inconsistencies
- Prepares for Enrichment: Structures the data so it can be enhanced with calculated attributes, performance metrics, and conformance rules
The transformation process ensures your data is ready for powerful process mining analysis and visualization.
Tips for Successful Data Upload
Column Naming
- Use clear, consistent column names in your CSV
- Common names like "CaseID", "Activity", "Timestamp" are auto-detected
- Avoid special characters in column names
Data Quality
- Ensure every row has a Case ID, Activity, and Timestamp
- Timestamps should follow a consistent format (ISO 8601 recommended)
- Remove or fix any duplicate headers or malformed rows
File Size Considerations
- CSV upload works well for datasets up to several million events
- For very large datasets or continuous monitoring, consider using mindzie Data Designer instead
- Test with a sample of your data first to verify column mappings
Resource and Optional Columns
- While only Case ID, Activity, and Timestamp are required, adding Resource information enables deeper analysis
- Additional columns like Cost, Channel, and Region allow for richer segmentation and insights
- You can always add more optional columns later through data enrichment
Next Steps
After successfully uploading and configuring your data source:
- Review the Generated Datasets: Check both the original and enriched datasets in the Datasets section
- Explore Default Analysis: Navigate to Investigations to see the automatically generated insights
- Plan Your Dashboard Structure: Decide what dashboards and metrics you want to create for your users
- Enhance Your Data: Use the Log Enrichment Engine to add performance metrics, conformance rules, and custom attributes
Your data is now ready to be transformed into actionable process intelligence!
Related Topics
- Understanding mindzie's Dual Dataset Architecture: Learn about original vs. enriched datasets
- Mastering the Log Enrichment Engine: Add performance metrics and conformance rules to enhance your data
- Using mindzie Data Designer: Connect to live data sources for automated data refresh
- Creating Your First Analysis: Build metrics and KPIs from your uploaded data