Understanding Drill-Down and Continuous Monitoring
Overview
mindzie studio is designed to serve two critical use cases in process mining: discovery and continuous monitoring. Discovery involves the initial investigation and analysis of your processes to understand how they work, identify bottlenecks, and uncover improvement opportunities. Continuous monitoring enables ongoing tracking of process performance over time, allowing you to spot trends, detect issues early, and measure the impact of improvements.
This document explains how mindzie studio's drill-down capabilities and automatic recalculation features support both use cases, enabling users to move seamlessly from high-level dashboards into detailed analysis and maintain up-to-date insights as data refreshes.
Discovery vs. Continuous Monitoring
Discovery: Initial Process Investigation
During the discovery phase, analysts create investigations, build analysis notebooks, and publish key metrics to dashboards. This is the exploratory phase where you:
- Upload historical process data
- Create enrichments to enhance the data with performance metrics, conformance rules, and cost calculations
- Build analysis using filters and calculators to understand process behavior
- Publish findings to dashboards for stakeholder review
The goal is to understand the current state of your processes and identify opportunities for improvement.
Continuous Monitoring: Ongoing Performance Tracking
Once your mindzie studio project is configured and dashboards are published, the system transitions into continuous monitoring mode. In this phase:
- Data is refreshed on a regular schedule (daily, weekly, monthly) or manually updated
- All metrics, KPIs, and analysis automatically recalculate based on the new data
- Users monitor trends over time to track process performance
- Changes in process behavior are detected and investigated
The same dashboards and analysis notebooks created during discovery continue to provide value by automatically staying current with the latest data.
How Drill-Down Enables Self-Service Analysis
One of the most powerful features of mindzie studio is the ability for dashboard users to drill down from high-level KPIs into the detailed analysis that drives them. This enables self-service investigation without requiring analyst intervention.
The Drill-Down Workflow
- Dashboard View: Users start at a global dashboard displaying key metrics and KPIs.
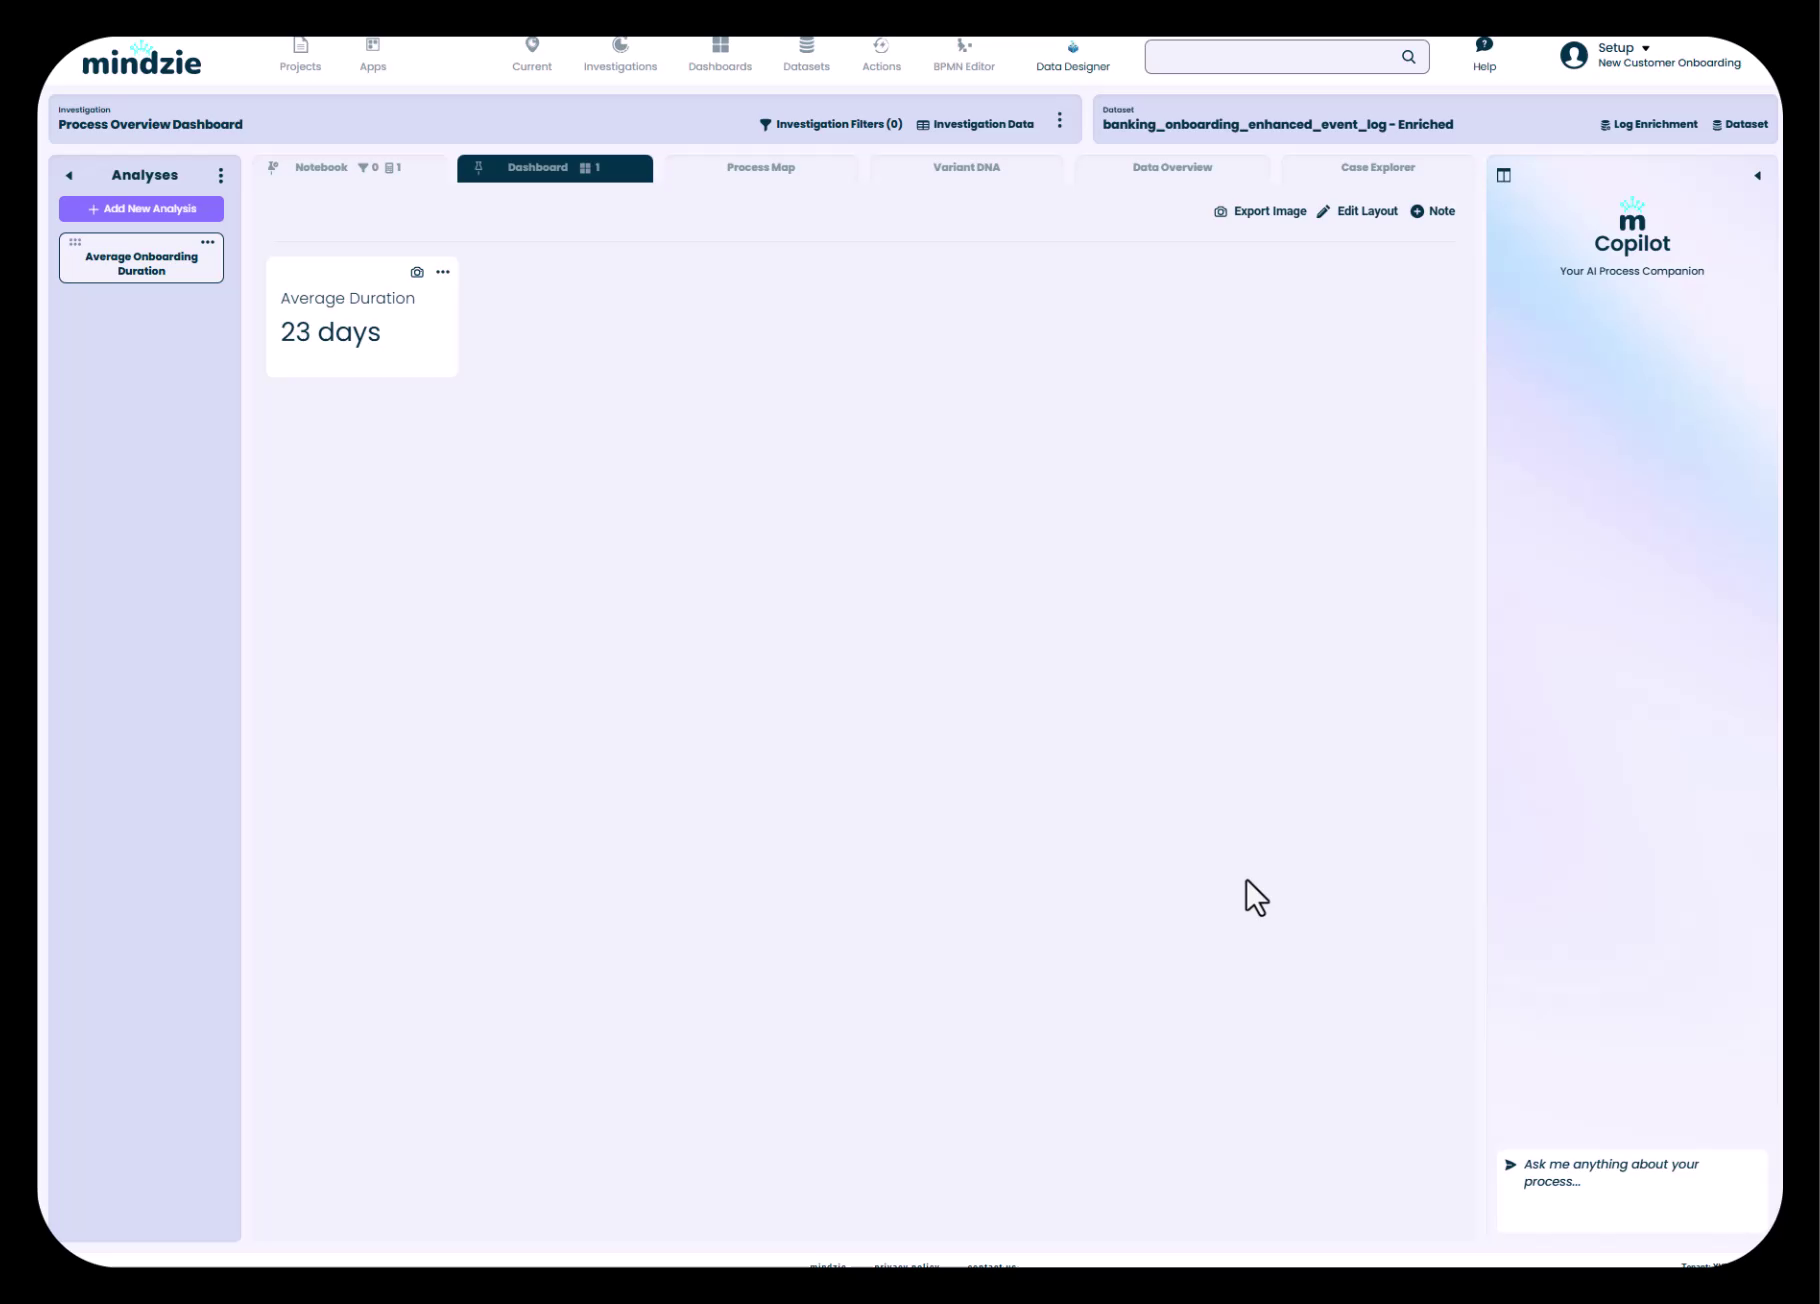
Hovering to Access Drill-Down: When users hover over a metric panel, a link icon appears, indicating that they can click to drill into the underlying analysis.
Opening the Analysis Notebook: Clicking the link icon opens the full analysis notebook that drives that particular metric, providing access to:
- Notebook tab: The analysis workspace with all filters and calculators
- Dashboard tab: The local dashboard view showing all related metrics from this analysis
- Process Map tab: A visual representation of the process flow
- Variant DNA tab: Detailed breakdown of process variants and their characteristics
- Data Overview tab: Statistical information about the underlying data
- Case Explorer tab: Ability to examine individual cases in detail
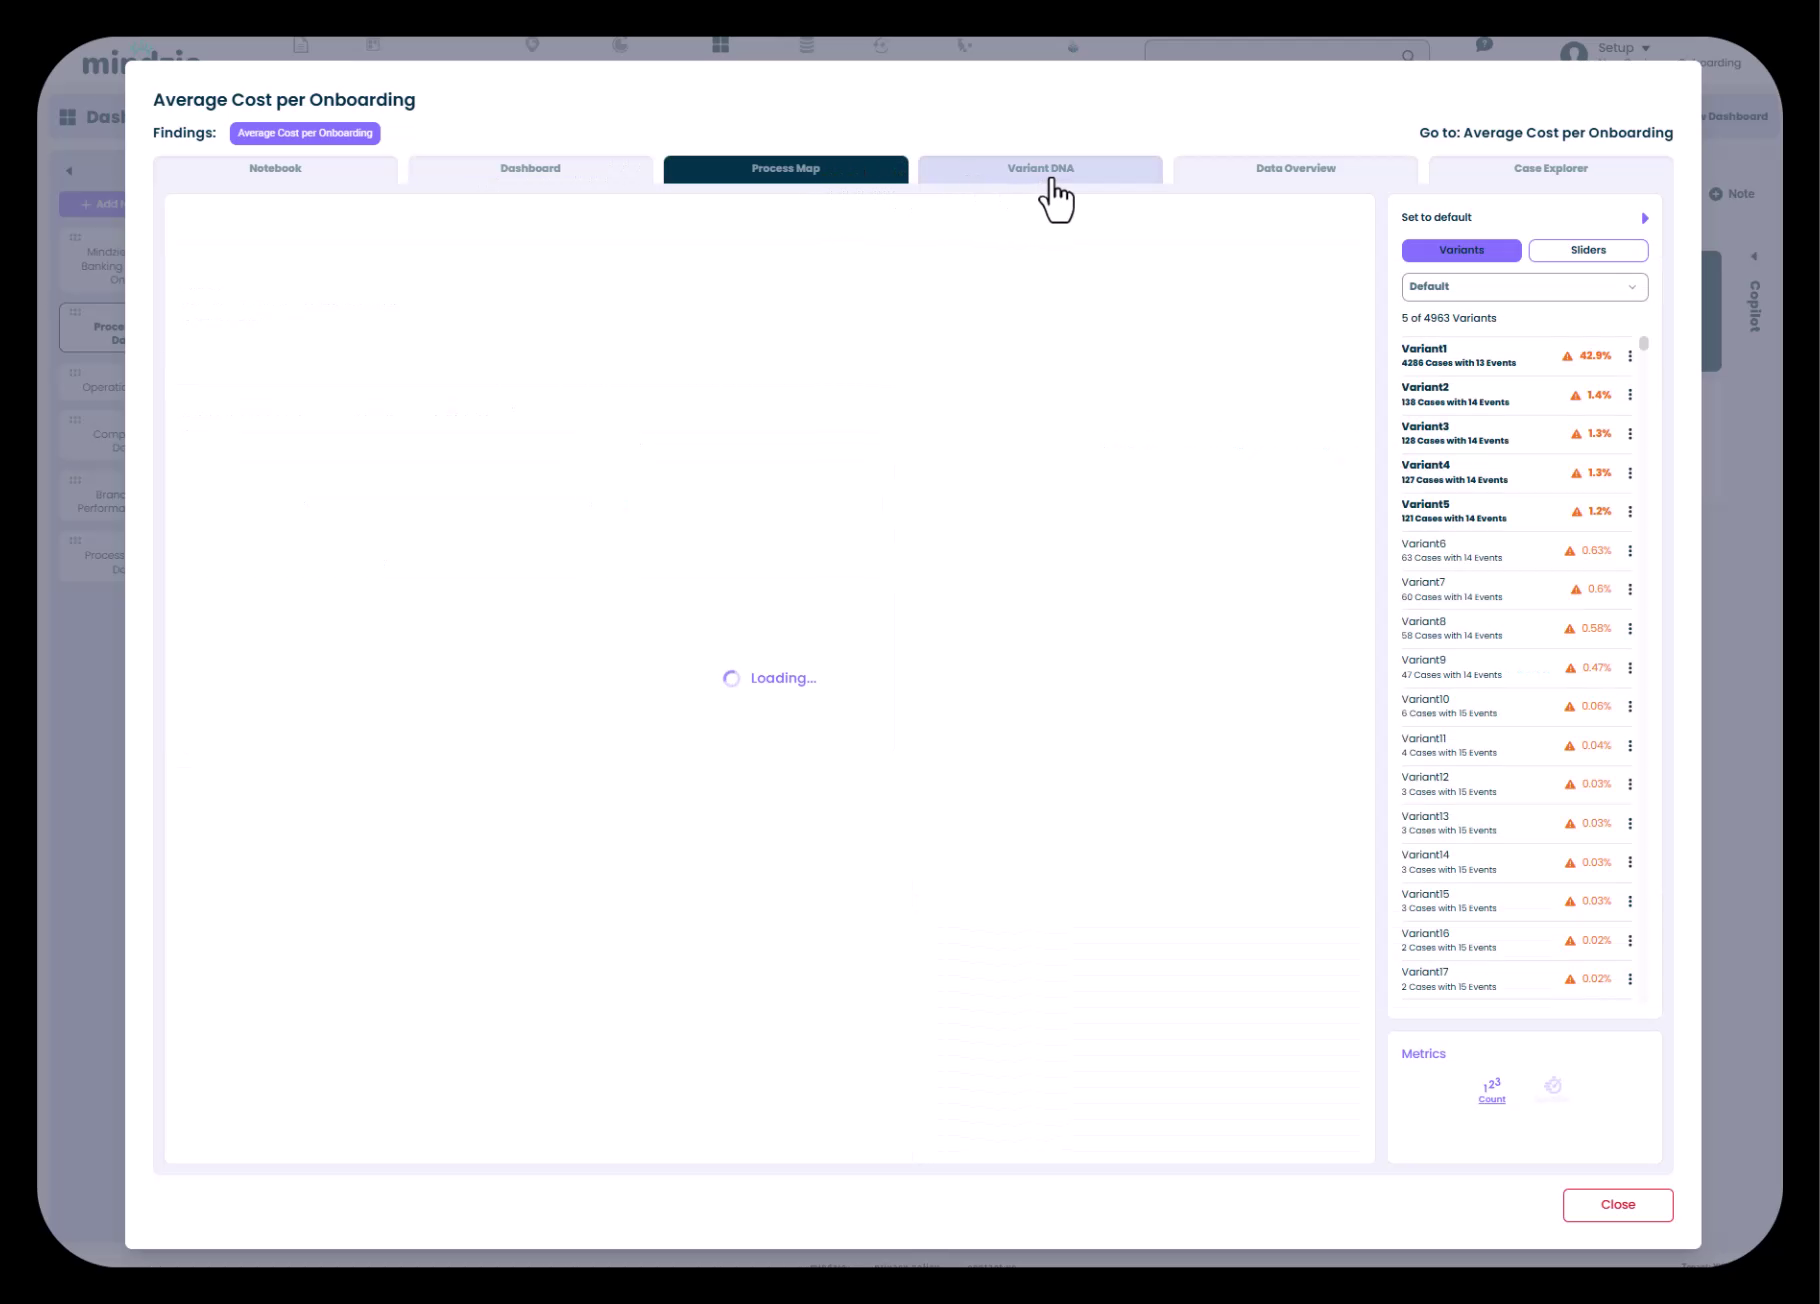
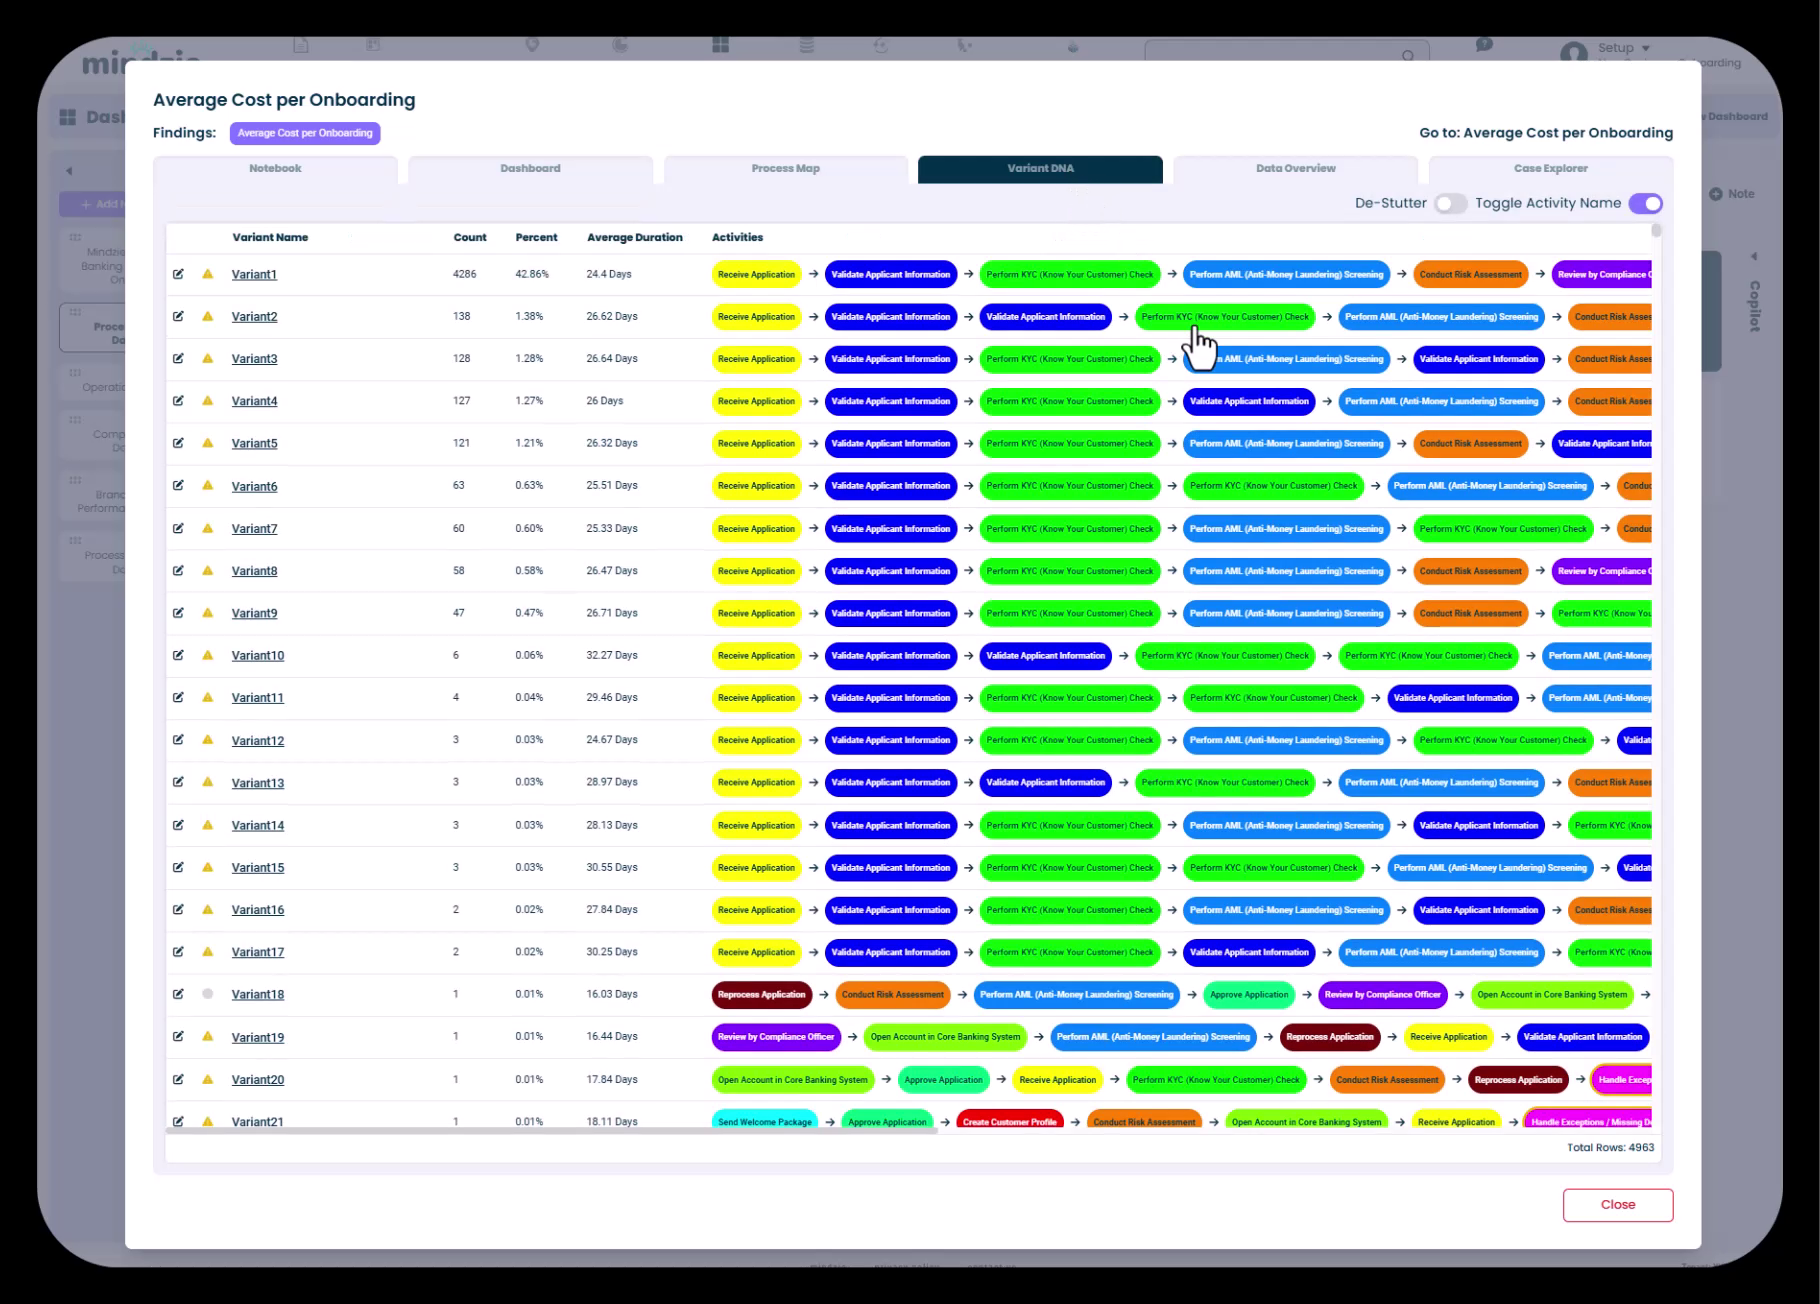
- Exploring Multiple Views: Users can switch between different tabs to explore the data from various perspectives. For example, they might view the Variant DNA to understand which process paths are most common:
Controlling the Drill-Down Experience with Pinned Tabs
As an analyst configuring mindzie studio, you can control which tab users see by default when they drill into a metric. This is accomplished using the pin feature:
- Navigate to the analysis notebook
- Select the tab you want users to see first (typically the Dashboard tab for a clean summary view)
- Click the pin icon to set this as the default view
- When users drill down from the global dashboard, they'll automatically land on the pinned tab
This ensures users get the most relevant view immediately without needing to navigate through multiple tabs.
Automatic Recalculation for Continuous Monitoring
A critical feature for continuous monitoring is mindzie studio's ability to automatically recalculate all metrics when data is refreshed. This happens seamlessly in the background without requiring manual intervention.
How Data Refresh Works
Scheduled Updates: When mindzie studio is connected to source systems via mindzie Data Designer, data can be automatically refreshed on a schedule (e.g., nightly, weekly). The system:
- Pulls updated data from source systems
- Runs the data through the enrichment pipeline
- Recalculates all metrics, KPIs, and analysis
- Updates all dashboards with the latest information
Manual Updates: For scenarios where data is uploaded via CSV files, you can manually refresh the data:
- Upload a new CSV file with updated data
- mindzie processes the new data through the same enrichment pipeline
- All existing analysis and dashboards automatically recalculate
What Gets Recalculated
When data refreshes, mindzie studio recalculates:
- Log enrichments: Performance metrics, conformance rules, cost calculations, and AI predictions
- Analysis notebooks: All filters and calculators update to reflect the new data
- Local dashboards: Metrics within notebooks refresh
- Global dashboards: All published KPIs update with current values
- Process maps and variant DNA: Visual representations reflect the latest process behavior
This ensures that users always see current information without needing to rebuild analysis or dashboards.
Monitoring Trends Over Time
With automatic recalculation, users can monitor how process metrics change over time:
- Compare current performance to historical baselines
- Identify trends (improving, declining, or stable)
- Detect anomalies or sudden changes in process behavior
- Measure the impact of process improvement initiatives
For example, if you implemented a process change to reduce customer onboarding time, your dashboards will automatically show whether average duration is decreasing as new data arrives.
Providing User Guidance on Dashboards
To maximize the value of drill-down capabilities, it's helpful to provide instructions directly on dashboards. This guides users on how to interact with the system and encourages exploration.
Adding Instructional Notes
You can add note panels to dashboards that explain how to use drill-down:
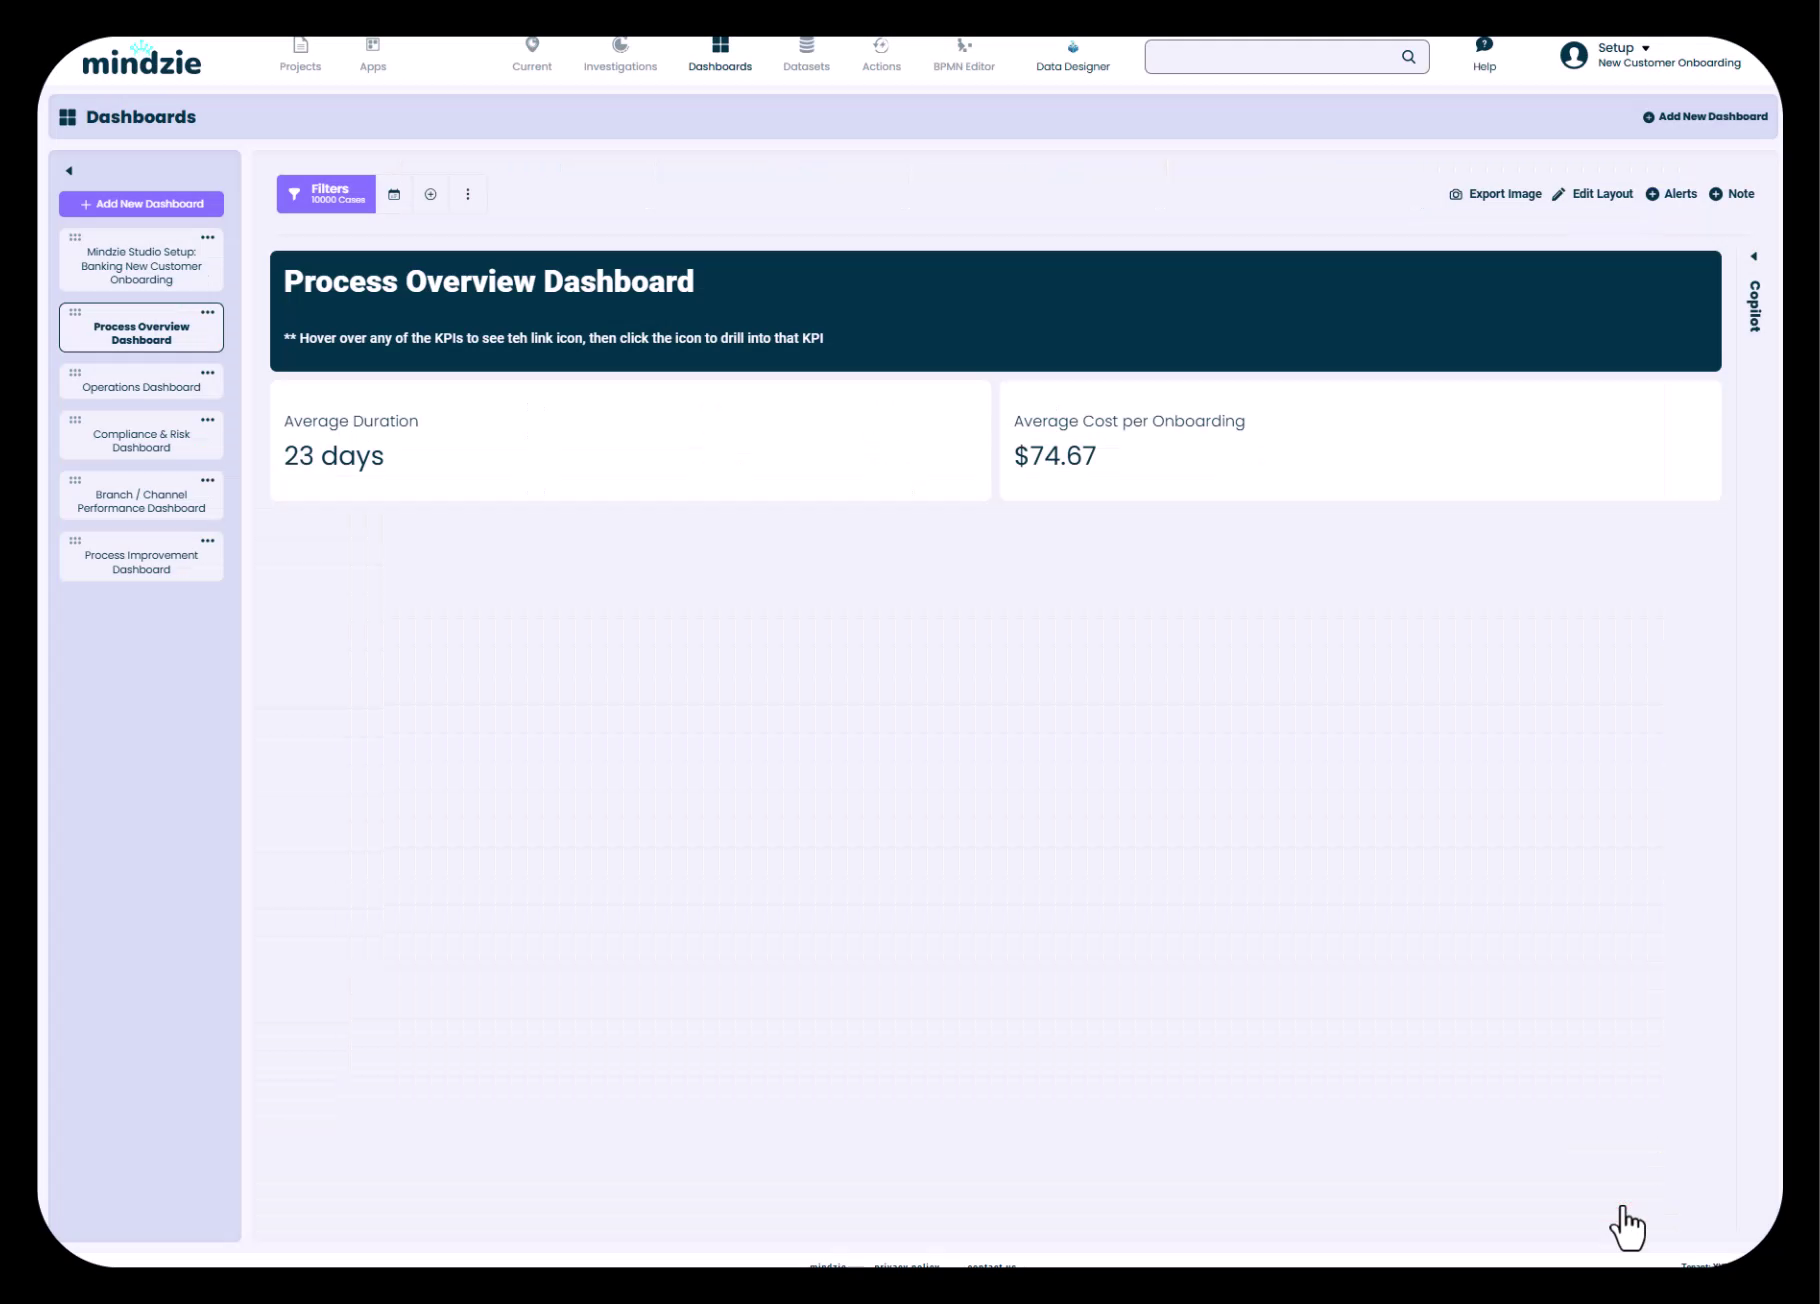
In this example, the dashboard includes a note that reads: "Hover over any of the KPIs to see the link icon, then click the icon to drill into that KPI."
Best practices for instructional notes:
- Use markdown formatting to create clear, readable text
- Place instructions prominently at the top of dashboards
- Explain what users can do (hover, click, explore)
- Set the background color to make notes stand out visually
- Keep instructions concise and action-oriented
Use Cases for Drill-Down and Continuous Monitoring
Executive Monitoring
Executives can view high-level dashboards showing key process metrics (average duration, cost per case, conformance violations). When they notice an unusual value or trend, they can drill down to:
- Understand which process variants are causing issues
- See the distribution of cases across different categories
- Identify specific cases that need attention
Operations Management
Operations managers use continuous monitoring to:
- Track daily or weekly process performance
- Spot emerging bottlenecks before they become critical
- Monitor SLA compliance in real-time
- Investigate root causes when metrics deteriorate
Process Improvement Teams
Process improvement teams leverage drill-down to:
- Analyze the impact of process changes over time
- Compare performance before and after interventions
- Identify which departments or branches show different patterns
- Build business cases for additional improvements
Compliance and Risk Teams
Compliance teams benefit from:
- Automated monitoring of conformance violations
- Trend analysis showing whether compliance is improving
- Ability to drill into specific violations to understand patterns
- Regular reporting without manual data extraction
Best Practices
For Discovery Phase
- Build comprehensive analysis: Create detailed notebooks that cover multiple perspectives (performance, conformance, cost, variants)
- Publish strategic metrics: Choose KPIs that will remain relevant for ongoing monitoring
- Set appropriate pinned tabs: Configure default views that provide the most value to end users
- Add contextual notes: Include descriptions and instructions to guide future users
For Continuous Monitoring Phase
- Establish refresh schedules: Determine the appropriate frequency for data updates based on business needs
- Communicate refresh timing: Let users know when data was last updated and when the next refresh will occur
- Monitor for data quality: Ensure that incoming data remains consistent and complete
- Review and refine: Periodically assess whether published metrics still align with business priorities
For Enabling Self-Service
- Train users on drill-down: Educate dashboard users on how to access underlying analysis
- Provide clear navigation cues: Use notes and labels to guide users through the interface
- Balance detail and simplicity: Publish high-level metrics but make detailed analysis available on demand
- Document analysis logic: Include notes in notebooks explaining what filters and calculators do
Summary
mindzie studio's drill-down and automatic recalculation capabilities make it a powerful platform for both process discovery and continuous monitoring. By publishing metrics from detailed analysis notebooks to global dashboards, you create an environment where:
- Executives and managers see high-level KPIs at a glance
- Users can drill into underlying analysis whenever they need more detail
- All metrics automatically update as new data arrives
- The same infrastructure supports both initial investigation and ongoing monitoring
This dual-purpose design maximizes the return on investment for your process mining implementation, enabling you to move seamlessly from understanding your processes to continuously improving them.
Related Topics
- Publishing Metrics from Notebooks to Dashboards: Learn how to publish analysis blocks to local and global dashboards
- Designing User-Friendly Dashboards with Notes and Formatting: Techniques for creating professional, intuitive dashboards
- Working with Investigations and Analysis Notebooks: Understanding the structure of investigations and notebooks
- Uploading and Configuring Data Sources: How to refresh data manually or via mindzie Data Designer