Publishing Metrics from Notebooks to Dashboards
Overview
Once you've created analysis metrics and KPIs in mindzie studio notebooks, the next step is to make them accessible to your end users by publishing them to dashboards. mindzie studio provides a flexible publishing system that allows you to control both where metrics appear and how users interact with them. This guide explains the difference between local and global dashboards, and walks through the complete process of publishing metrics for user consumption.
Understanding Dashboard Types
mindzie studio uses two types of dashboards, each serving a different purpose:
Local Dashboards (Analyst View)
Local dashboards are built at the notebook level and are designed primarily for analysts who are creating and refining analysis. These dashboards:
- Display within the notebook interface alongside other analysis tabs
- Serve as a staging area for metrics before publishing to global dashboards
- Allow analysts to organize related metrics together
- Can be configured as the default view when users drill into a metric
Global Dashboards (End User View)
Global dashboards are role-based, user-facing dashboards that business users access to monitor process performance. These dashboards:
- Are accessible from the main dashboards section of mindzie studio
- Are organized by user role or business function (e.g., Executive Overview, Operations, Compliance)
- Display published metrics from multiple analysis notebooks
- Support drill-down capabilities that allow users to investigate metrics in detail
Prerequisites
Before publishing metrics to dashboards, ensure you have:
- Created at least one analysis notebook with completed metrics (filters and calculators)
- Defined your global dashboard structure (dashboards should already exist)
- Identified which metrics should be published to which role-based dashboards
Publishing a Metric to Dashboards
Step 1: Add a Title and Description to Your Metric
Before publishing, it's important to add clear titles and descriptions to your metrics so users understand what they represent.
- In your analysis notebook, locate the metric you want to publish
- Click the three-dot menu (options menu) on the metric panel
- The metric configuration dialog will appear with fields for:
- Title: Enter a descriptive name for the metric (e.g., "Average Value", "Average Onboarding Duration")
- Description: Add an explanation of what the metric shows or why it's important
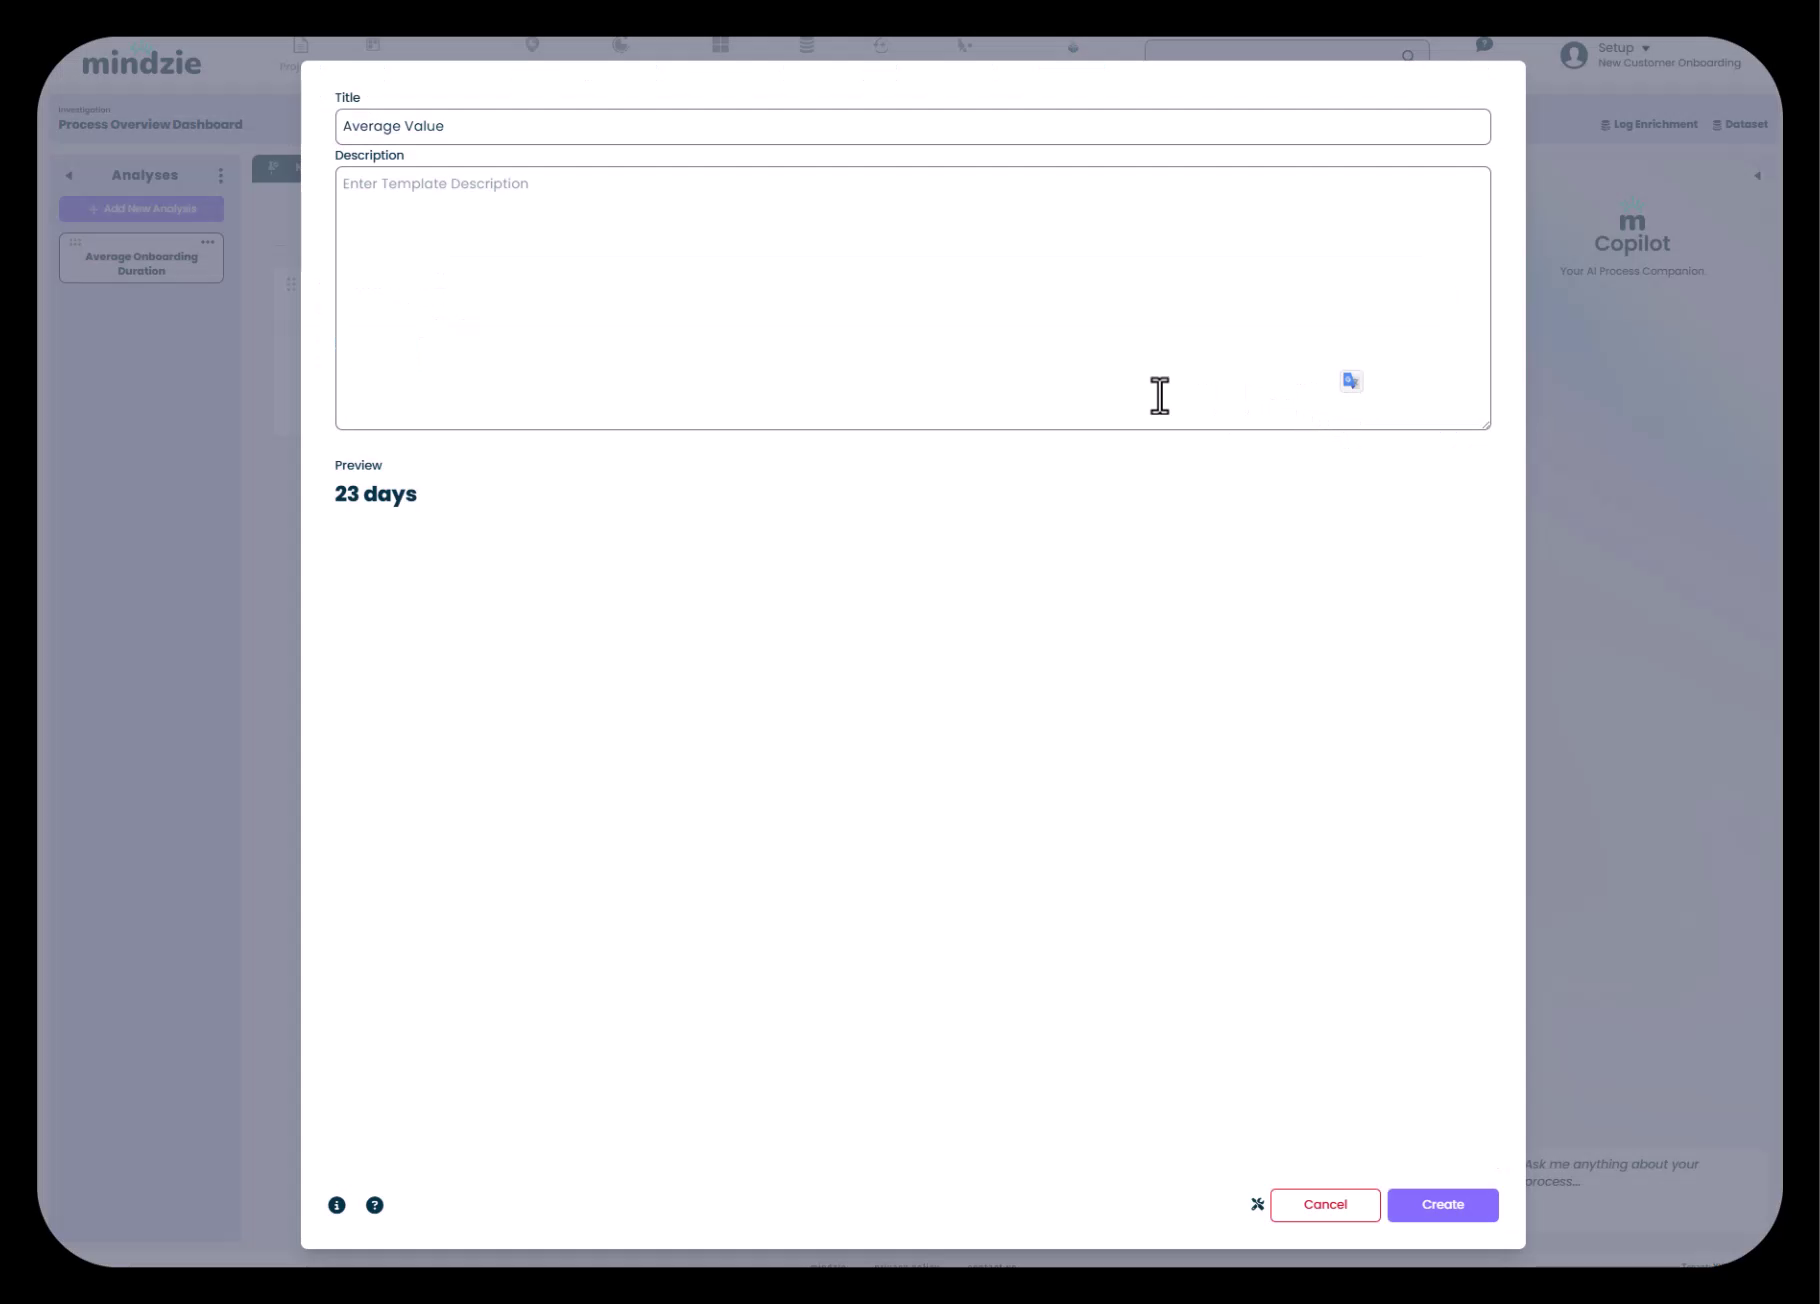
- Click Create to save the configuration
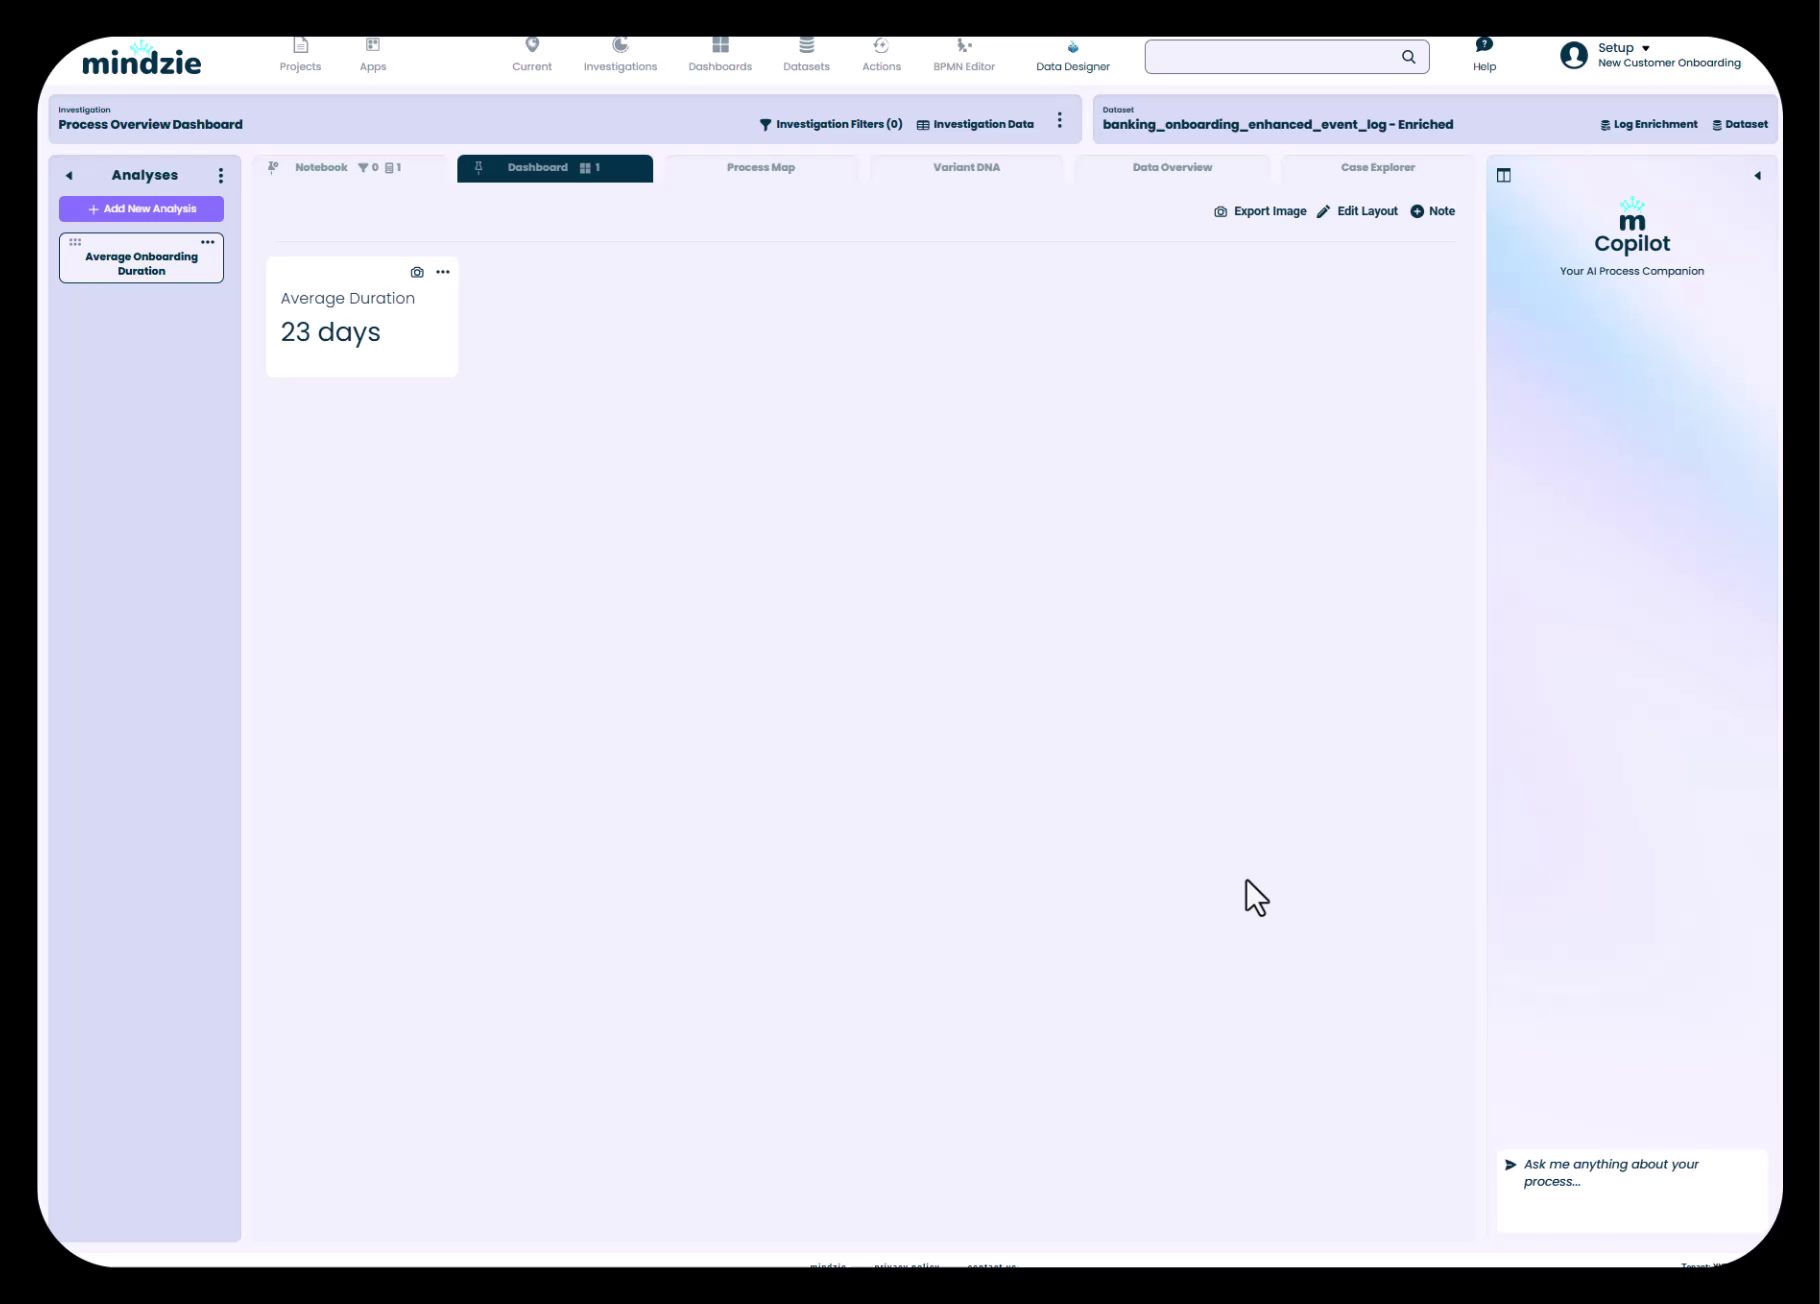
Step 2: Publish to Local Dashboard
Publishing to the local dashboard makes the metric appear on the notebook's dashboard tab, which is useful for organizing multiple related metrics.
- From the same three-dot menu on the metric panel
- Select the option to add the metric to a dashboard
- You'll see a preview showing how the metric will appear (e.g., "23 days")
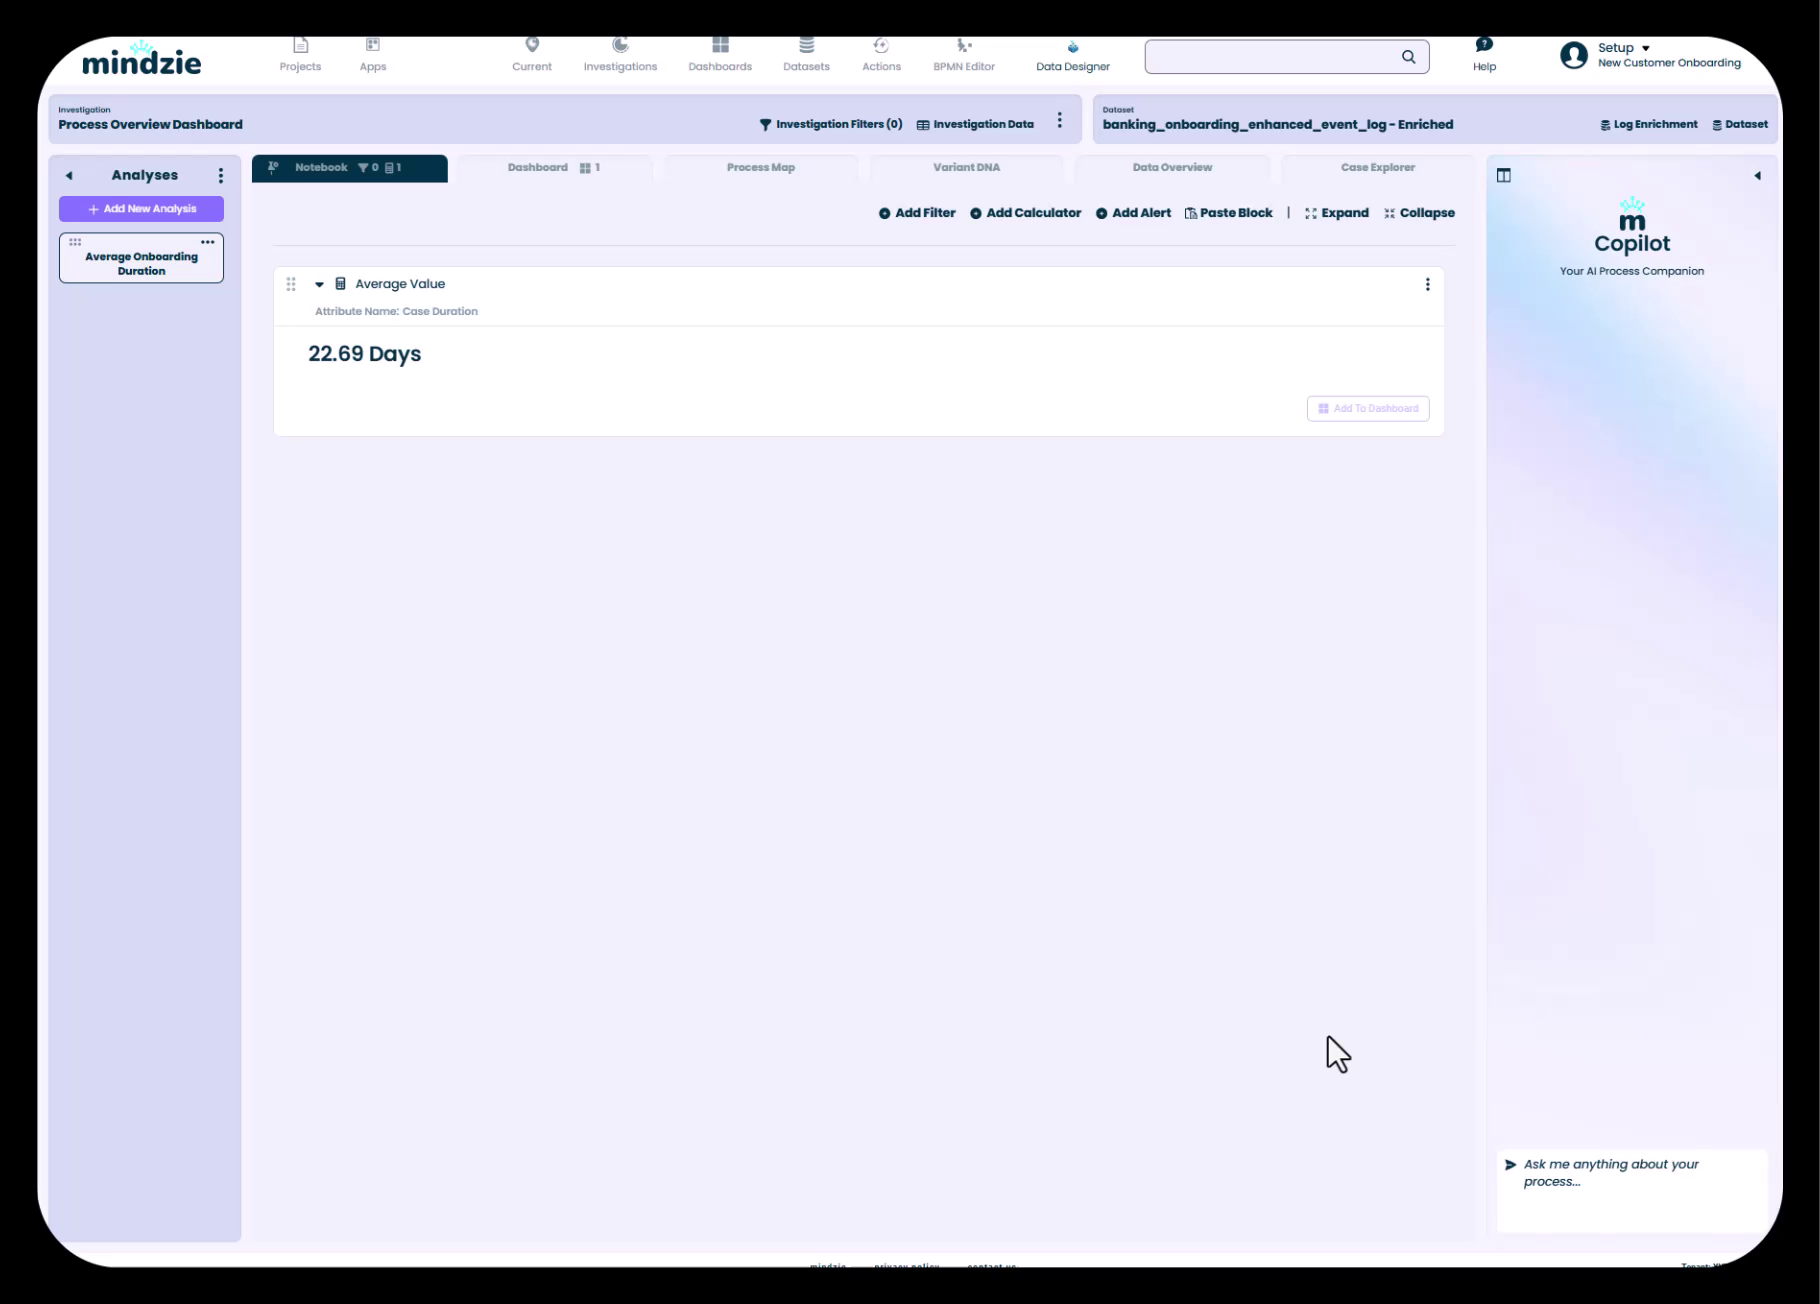
The metric is now visible on the Dashboard tab within your notebook. This local dashboard tab can display multiple metrics and serves as an analyst workspace.
Step 3: Publish to Global Dashboard
To make the metric available to end users, you need to publish it to one or more global dashboards.
- Click the three-dot menu on the metric panel again
- Select the option to publish or add to a global dashboard
- A Select A Dashboard dialog will appear showing all available global dashboards
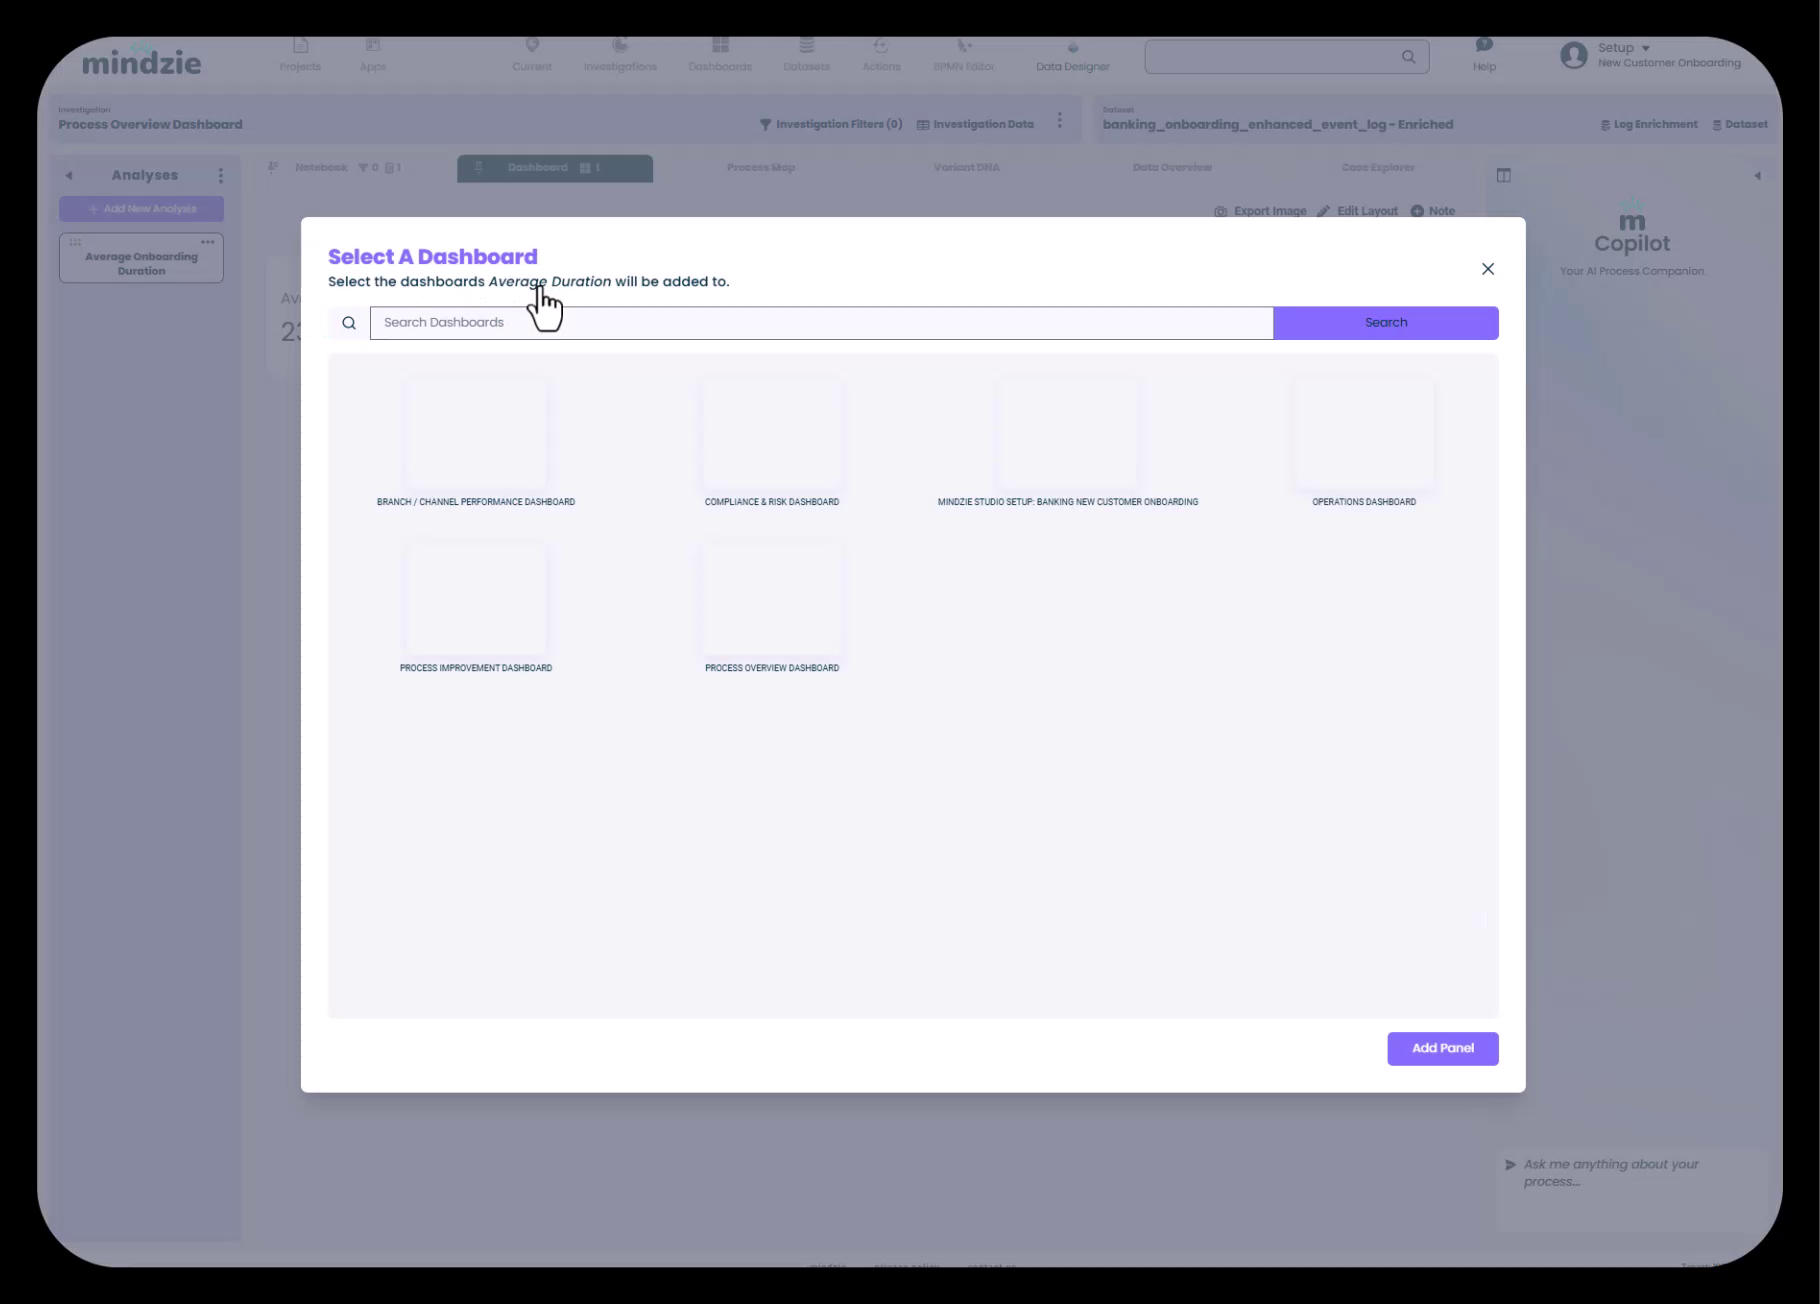
- Browse through your dashboards (e.g., Branch/Channel Performance Dashboard, Compliance & Risk Dashboard, Operations Dashboard, Process Overview Dashboard)
- Click on the dashboard where you want this metric to appear
- Click Add Panel to confirm
The metric is now published to the selected global dashboard and will be visible to users who have access to that dashboard.
Configuring Drill-Down Behavior
One of the powerful features of mindzie studio dashboards is the ability for users to drill into metrics to see the underlying analysis. You can control what users see when they click on a dashboard metric.
Using the Pin Feature
The pin feature allows you to set which notebook tab users land on when they drill into a metric from a global dashboard.
- Open your analysis notebook
- Navigate to the tab you want users to see by default (options include):
- Dashboard (local analyst view with multiple metrics)
- Process Map
- Variant DNA
- Data Overview
- Case Explorer
- Click the pin icon on that tab to set it as the default drill-down view
When users click on the metric from a global dashboard, they'll be taken directly to the pinned tab in the underlying notebook. For most use cases, pinning the local Dashboard view provides users with a comprehensive set of related metrics and context.
Adding User Guidance with Note Panels
To help users understand what they're looking at and how to use the metrics, you can add note panels directly to dashboards.
Creating a Note Panel
- In your dashboard view, click the Note button in the toolbar
- The Dashboard Note Panel dialog will appear
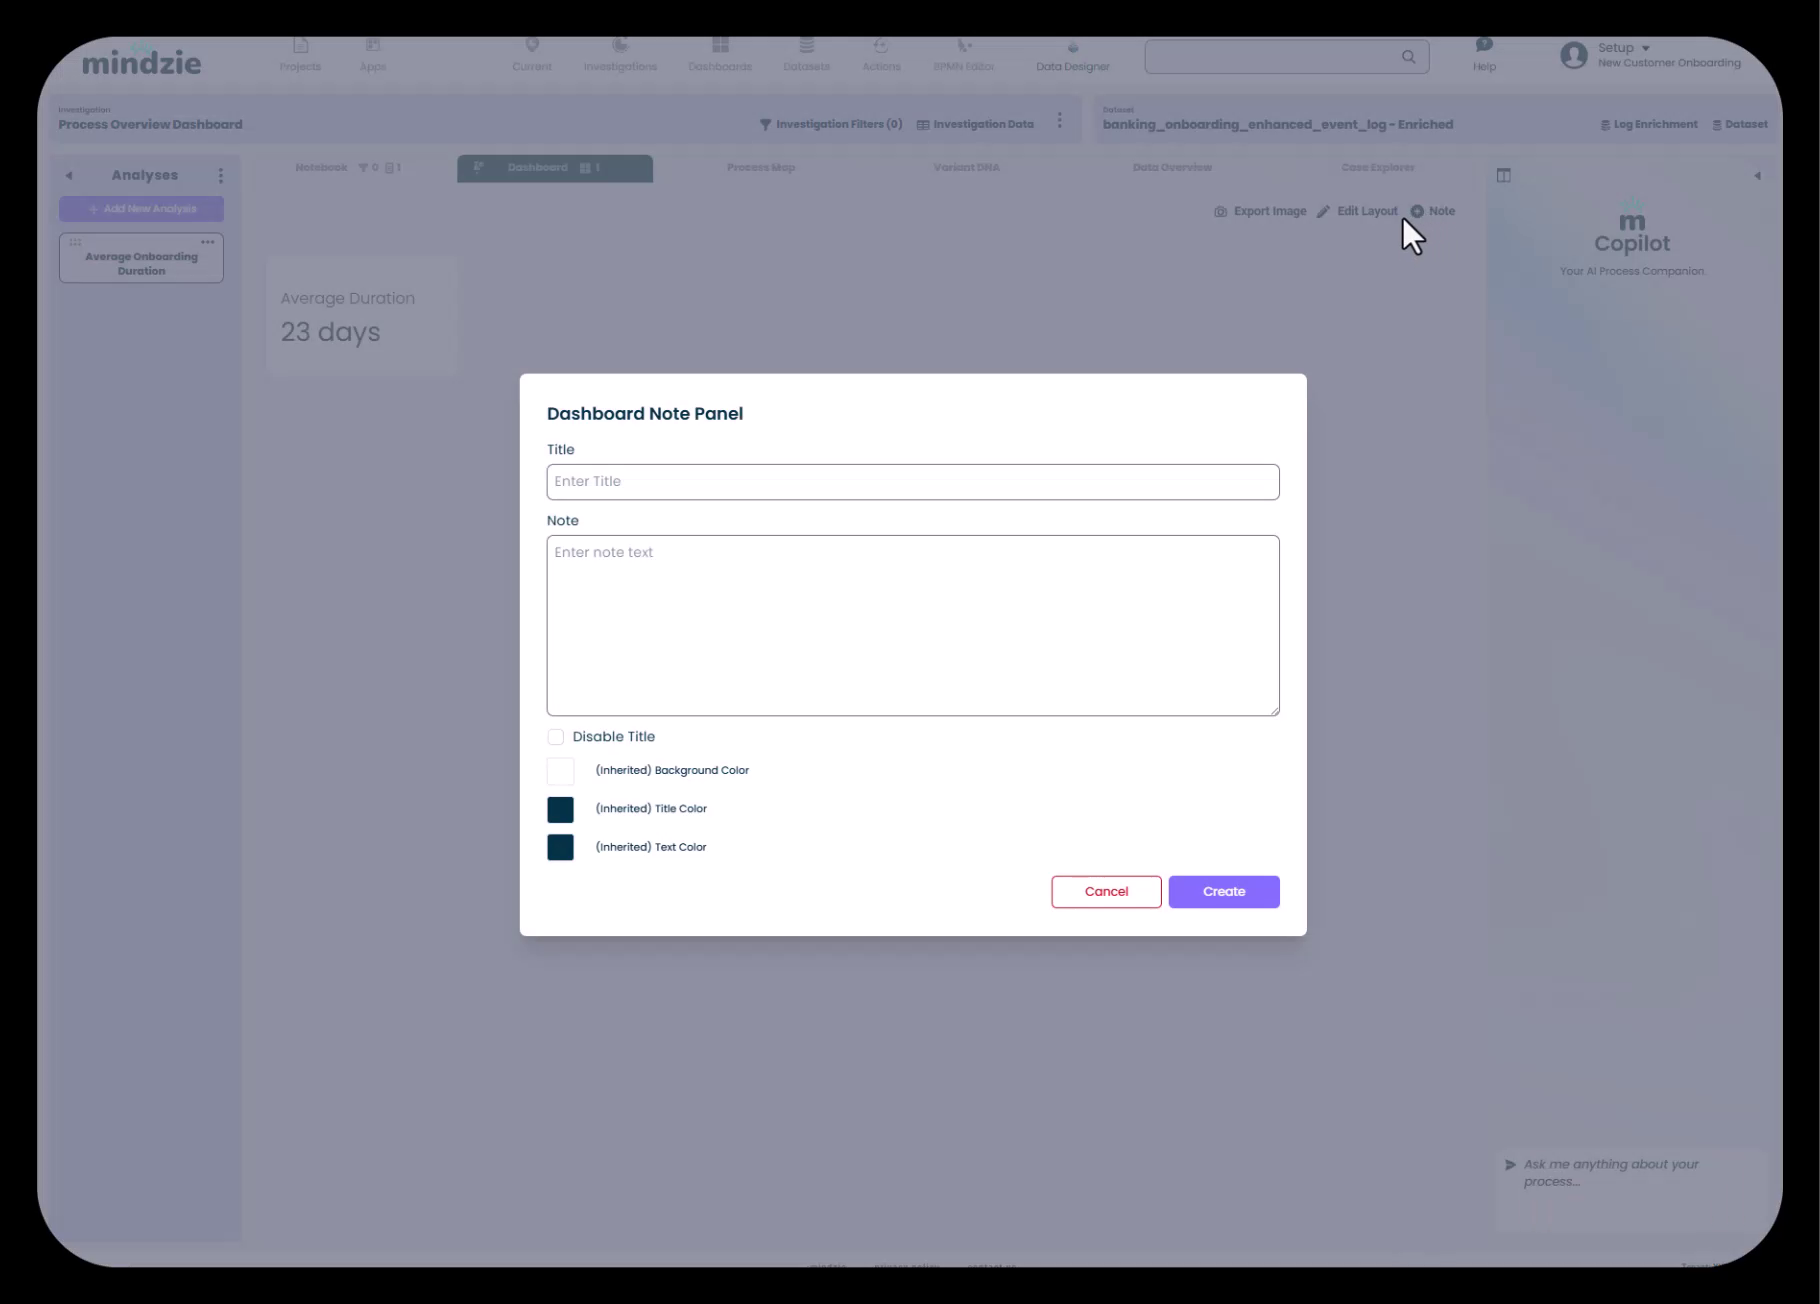
Configure the note panel:
- Title: Enter a title for the note (optional)
- Note: Add your instructional text, explanations, or tips
- Disable Title: Check this option to hide the title for a cleaner look
- Background Color: Choose a background color scheme
- Title Color: Set the title text color
- Text Color: Set the body text color
Click Create to add the note panel to your dashboard
Best Practices for Note Panels
- Use notes to explain what the dashboard shows and who it's designed for
- Add tips on how to interpret metrics or how to drill down for more detail
- Include context about data refresh schedules or data sources
- Consider using notes to provide instructions for less technical users
Working with Multiple Dashboards
As you build out your mindzie studio project, you'll likely create multiple notebooks and publish metrics to various global dashboards. The interface makes it easy to manage metrics across dashboards.

Publishing the Same Metric to Multiple Dashboards
You can publish a single metric to multiple global dashboards if it's relevant to different user roles:
- Use the three-dot menu on the metric
- Select each dashboard where the metric should appear
- The metric will be displayed on all selected dashboards
Using the Edit Layout Feature
To arrange how metrics appear on dashboards:
- Click the Edit Layout button in the dashboard toolbar
- Drag and drop panels to rearrange them
- Resize panels as needed to emphasize important metrics
- Click Save when you're satisfied with the layout
Understanding Continuous Monitoring
An important concept in mindzie studio is that dashboards are designed not only for initial process discovery but also for continuous monitoring. This has important implications for how you publish metrics:
Automatic Metric Recalculation
Once you've published metrics to dashboards and set up your complete structure:
- If data is refreshed on a schedule (via connection to source systems), all metrics automatically recalculate
- If you manually upload a new CSV file or data export, all metrics will update to reflect the new data
- Users can monitor trends over time as the data refreshes
- No need to manually update calculations or republish metrics
This means the effort you put into building and publishing metrics pays off continuously as new data flows through the system.
Complete Publishing Workflow Summary
Here's the complete workflow for taking analysis from creation to user consumption:
- Create your analysis in a notebook using filters and calculators
- Add titles and descriptions to make metrics self-explanatory
- Publish to local dashboard to organize metrics within the notebook
- Publish to global dashboards to make metrics available to end users
- Configure drill-down behavior by pinning the appropriate tab
- Add note panels to provide user guidance and context
- Arrange dashboard layout using Edit Layout for optimal presentation
- Test the user experience by clicking on metrics to verify drill-down behavior
Tips for Effective Dashboard Publishing
- Plan your dashboard structure first: Create empty global dashboards organized by role before you start publishing metrics
- Be selective: Only publish metrics that are relevant to the specific dashboard's audience
- Use descriptive titles: Metric titles should be immediately understandable without additional context
- Add context with descriptions: Use the description field to explain calculation methods or business significance
- Leverage note panels: Don't assume users know how to use the dashboards—provide instructions
- Think about drill-down: Consider what additional information users might want when they click a metric
- Test the user perspective: View dashboards as different user roles to ensure the right metrics are visible
- Organize local dashboards: Group related metrics together on local dashboards to provide comprehensive views
Next Steps
Now that you've learned how to publish metrics to dashboards, you can:
- Learn about Creating Analysis with Filters and Calculators to build more sophisticated metrics
- Explore Designing User-Friendly Dashboards with Notes and Formatting for advanced dashboard customization
- Understand Drill-Down and Continuous Monitoring to maximize the value of your dashboards