Creating Analysis with Filters and Calculators
Overview
mindzie studio provides a powerful low-code/no-code approach to building process analysis through a fundamental paradigm: analysis, filters, and calculators. This tutorial guides you through creating meaningful metrics and insights using mindzie's extensive library of pre-built filters and calculators, eliminating the need for complex coding or manual calculations.
By combining filters to isolate specific data segments with calculators to visualize insights, you can quickly build sophisticated process metrics that answer critical business questions about performance, efficiency, and compliance.
Prerequisites
Before creating analysis with filters and calculators, you should have:
- An active mindzie studio project with data loaded
- Completed log enrichment to create enhanced attributes (see "Mastering the Log Enrichment Engine")
- Created an investigation and analysis notebook (see "Working with Investigations and Analysis Notebooks")
- Understanding of your dataset's attributes and structure
Understanding the Analysis-Filter-Calculator Paradigm
mindzie studio organizes analytical work around three core building blocks:
Analysis (The Workspace)
Analysis notebooks are similar to Jupyter notebooks - they serve as your workbook or worksheet where you discover and create metrics. Each analysis provides a dedicated space for exploring specific aspects of your process.
Filters (Data Isolation)
Filters allow you to isolate specific data segments for targeted analysis. They answer the question: "What data do I want to work with?" Examples include:
- Filtering by division, department, or region
- Isolating cases from specific time periods
- Selecting cases with particular attributes
- Separating data by process variant or outcome
Calculators (Visualizations and Metrics)
Calculators are visualizations that answer the question: "What do I want to do with that data?" They transform your filtered data into actionable insights through charts, statistics, process maps, and other visual representations.
The Power of Combination
The true power lies in combining these blocks. You can stack multiple filters and multiple calculators to create sophisticated analysis that addresses complex business questions without writing a single line of code.
Creating Your First Analysis: Average Process Duration
This walkthrough demonstrates creating a simple yet powerful metric - the average duration of customer onboarding cases - using the filter and calculator approach.
Step 1: Access Your Analysis Notebook
- Navigate to your investigation in the left sidebar
- Click on the analysis notebook you want to work in
- Ensure you're viewing the "Notebook" tab in the analysis interface
You'll see the main analysis workspace with buttons across the top for adding different block types.
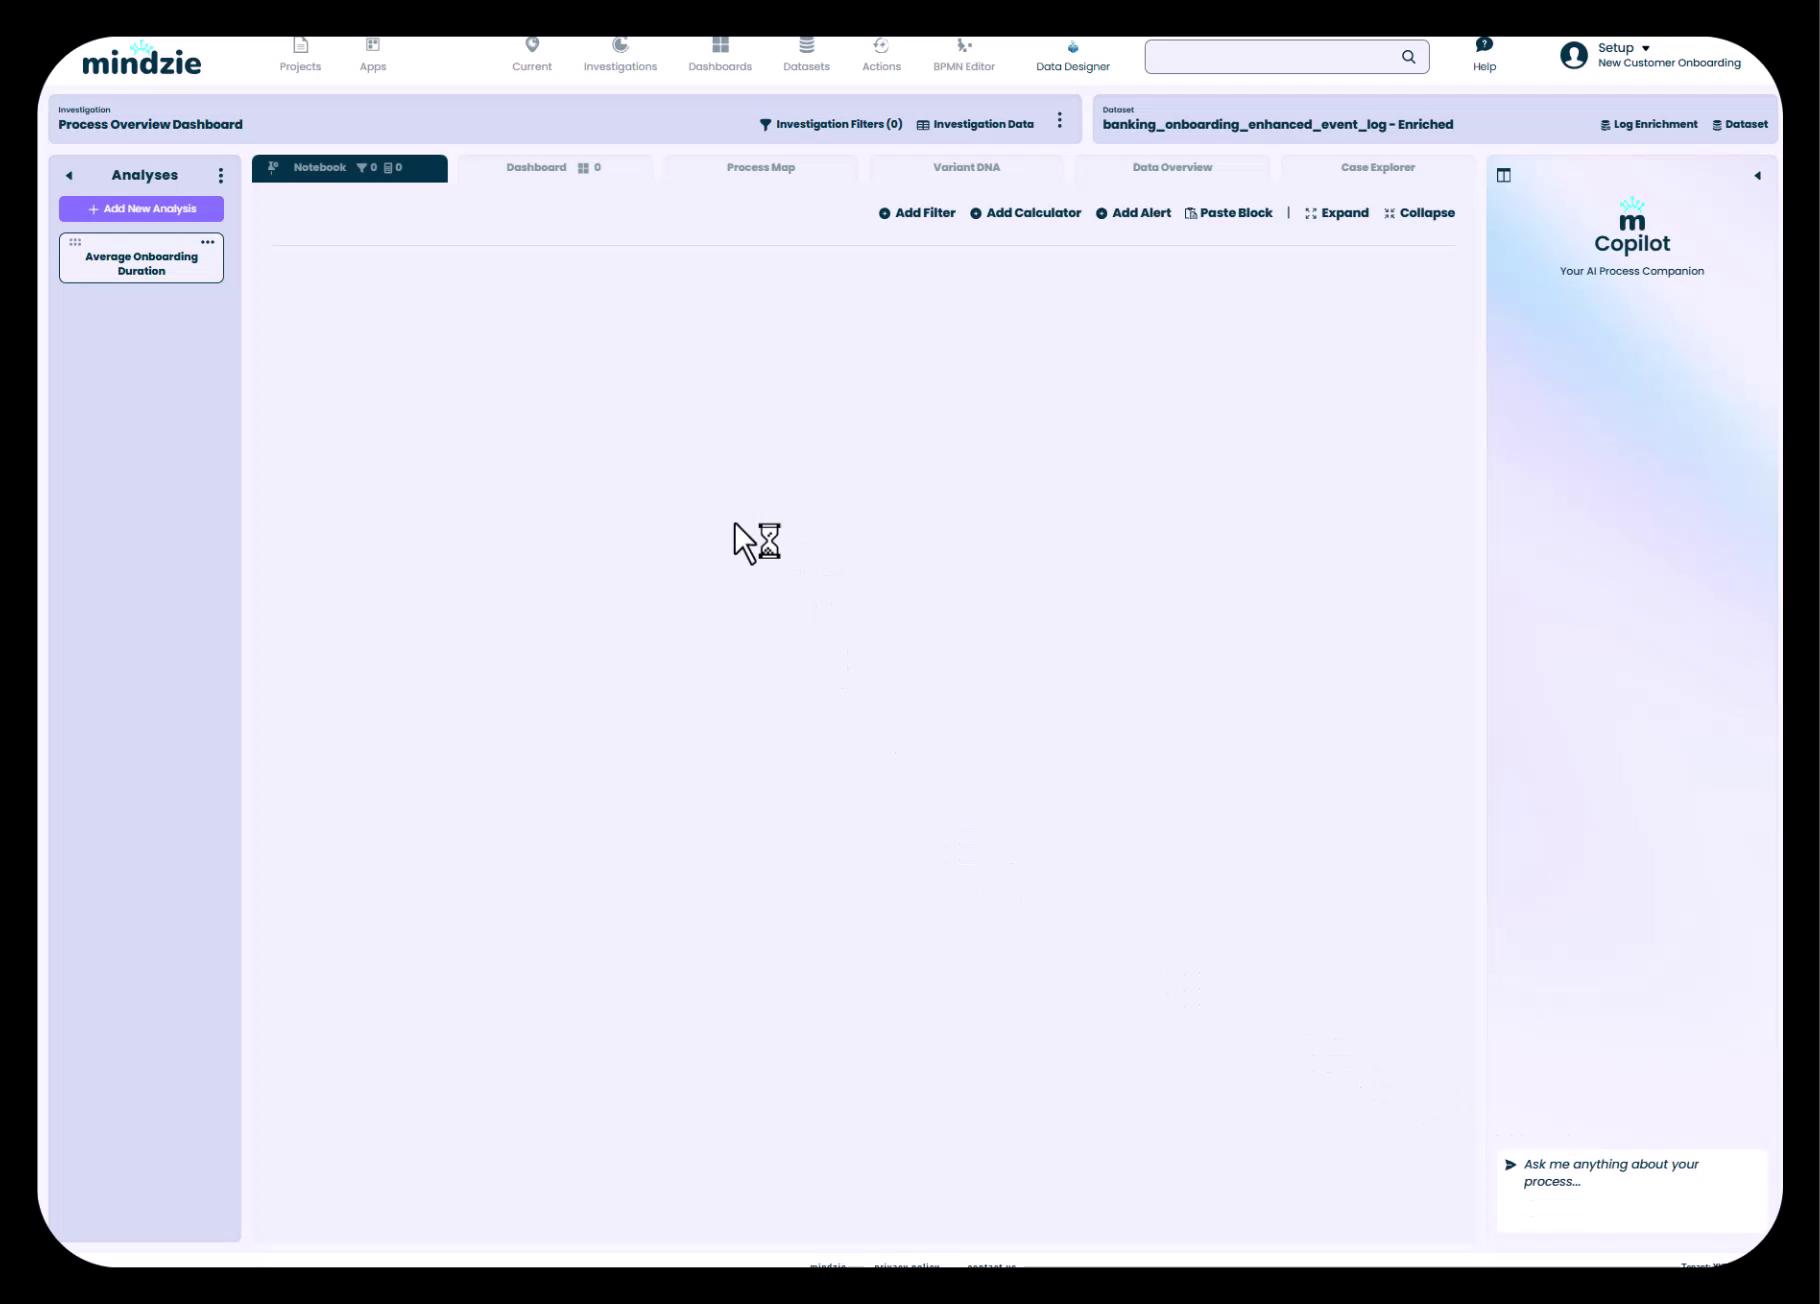
The toolbar includes:
- Add Filter - Add data filtering blocks
- Add Calculator - Add visualization and metric blocks
- Add Alert - Create automated alerts based on thresholds
- Paste Block - Paste previously copied analysis blocks
- Expand/Collapse - Control the copilot sidebar visibility
Step 2: Understanding When to Use Filters
For this first metric, we'll focus on calculators without applying filters. This gives us an overall average across all cases in the dataset.
Filters become essential when you need to:
- Compare performance across different divisions or regions (e.g., US vs. Europe)
- Analyze specific time periods (e.g., Q1 vs. Q2)
- Isolate problematic cases (e.g., only cases that violated compliance rules)
- Segment by any case or event attribute
To browse available filters, click the "Add Filter" button.
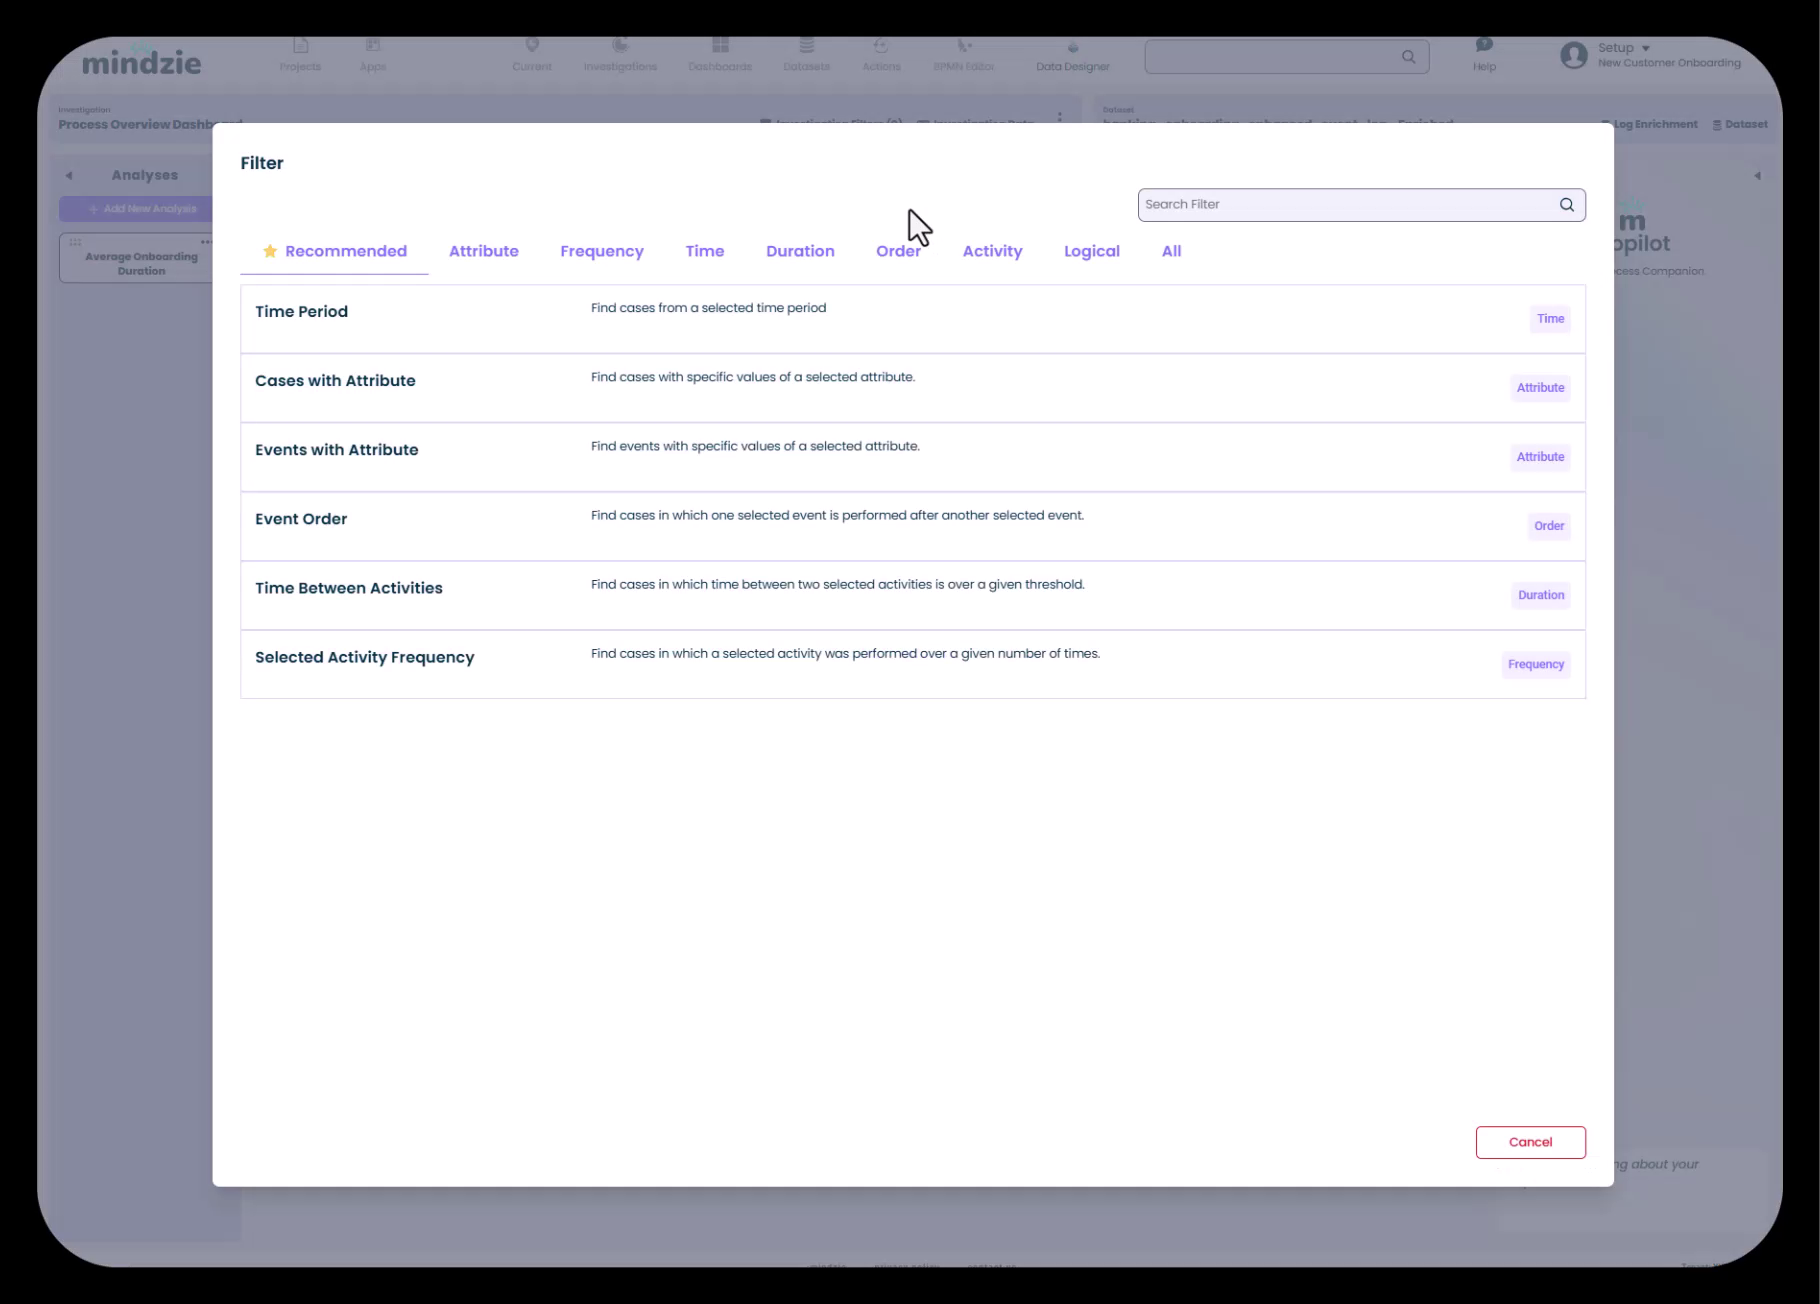
mindzie provides an extensive library of pre-built filters organized by category:
- Recommended - Common filters based on your data
- Attribute - Filter by case or event attribute values
- Frequency - Filter by activity occurrence counts
- Time - Filter by time periods and date ranges
- Duration - Filter by process or activity duration
- Order - Filter by activity sequence
- Activity - Filter by specific activities
- Logical - Combine filters with AND/OR logic
Each filter includes a description explaining its purpose, making it easy to find the right tool for your analysis needs.
Step 3: Adding a Calculator
Click the "Add Calculator" button to open the calculator library.
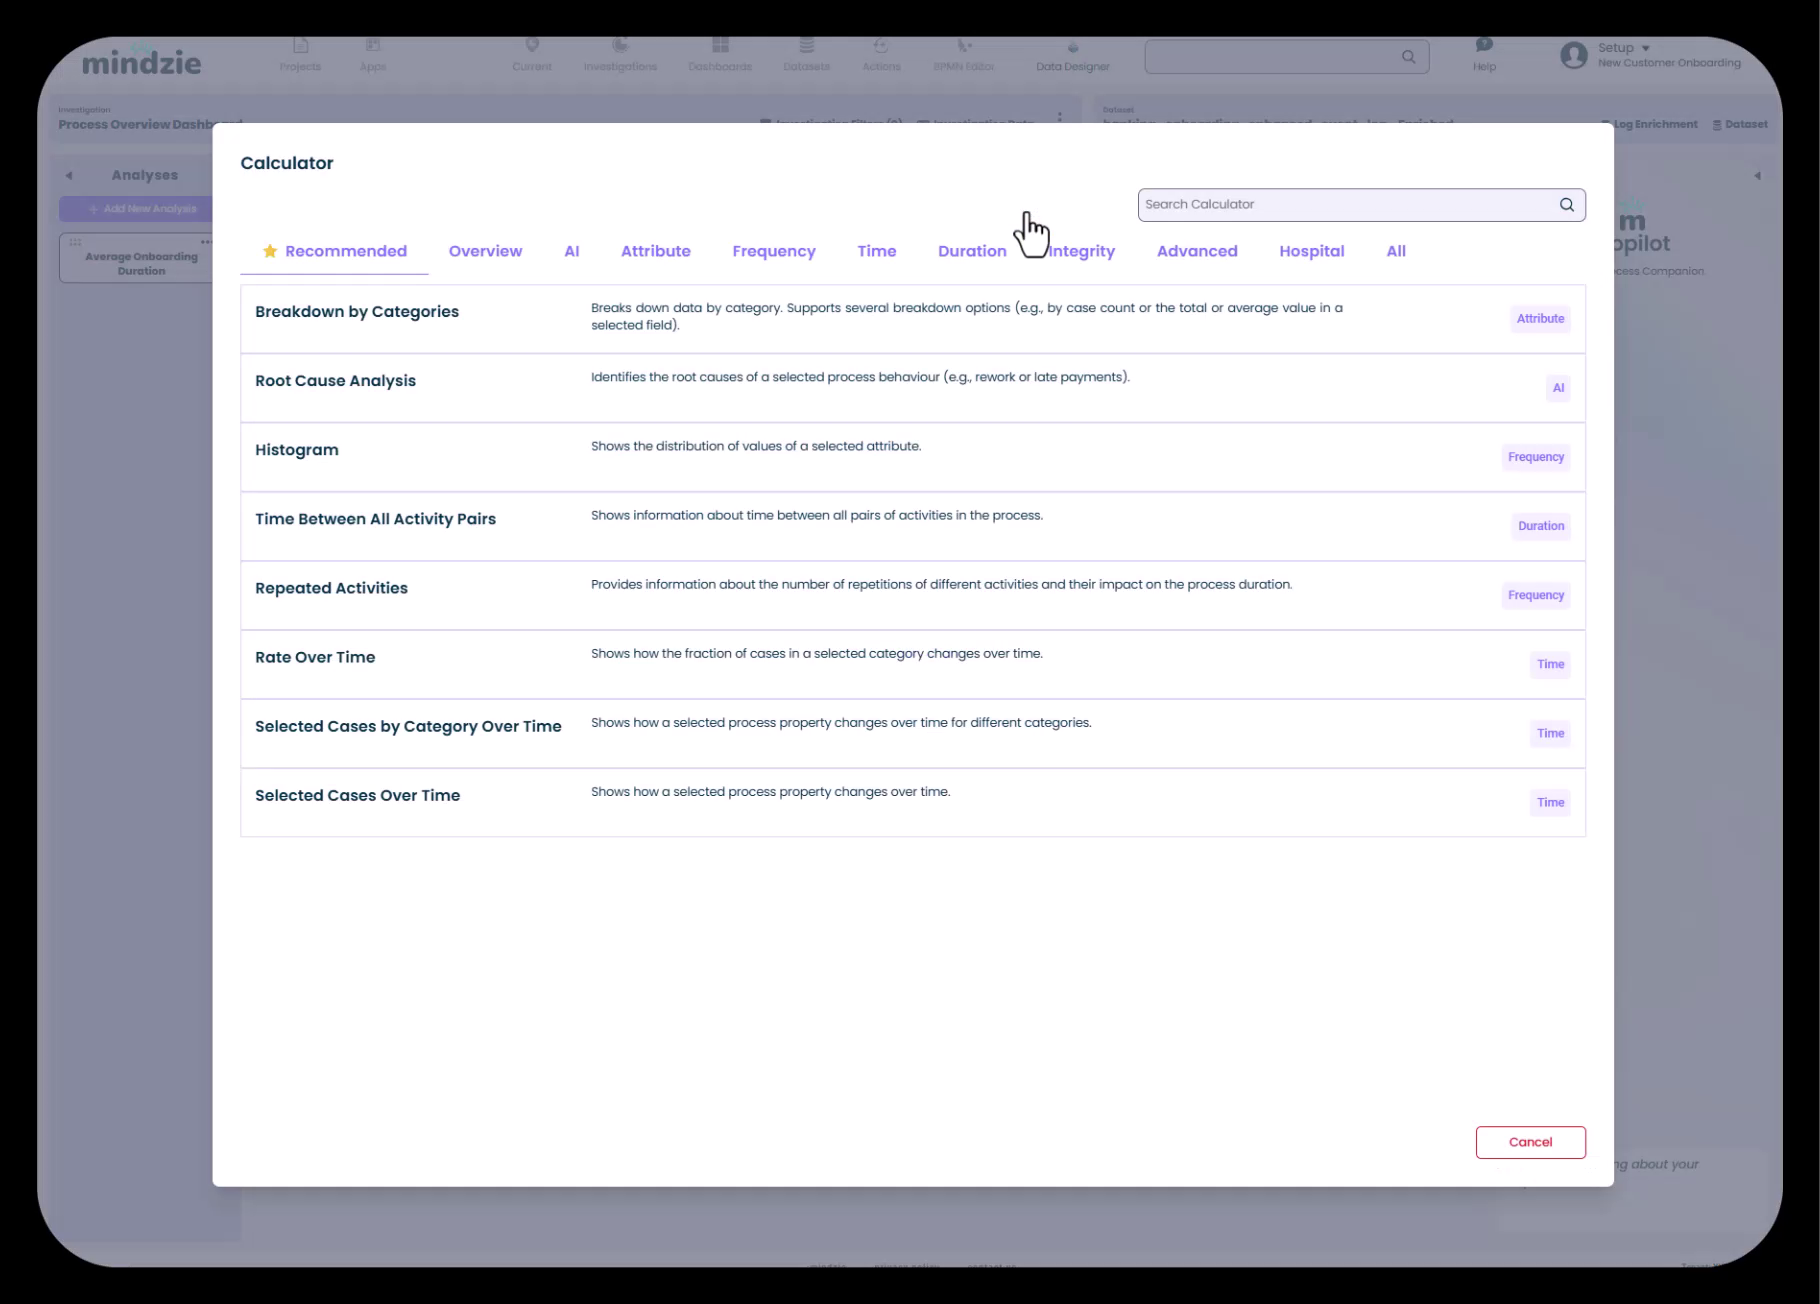
The calculator library is organized into categories:
- Recommended - Calculators suited to your current context
- Overview - Summary statistics and KPIs
- AI - Machine learning-powered insights
- Attribute - Attribute-based analysis and distributions
- Frequency - Activity frequency analysis
- Time - Time-based trends and patterns
- Duration - Duration metrics and distributions
- Integrity - Data quality and conformance metrics
- Advanced - Specialized calculators for complex analysis
- Hospital - Healthcare-specific metrics (if applicable)
Step 4: Search for the Average Calculator
Use the search box at the top of the calculator library to quickly find what you need.
- Type "average" in the search box
- Select "Average Value" from the filtered results
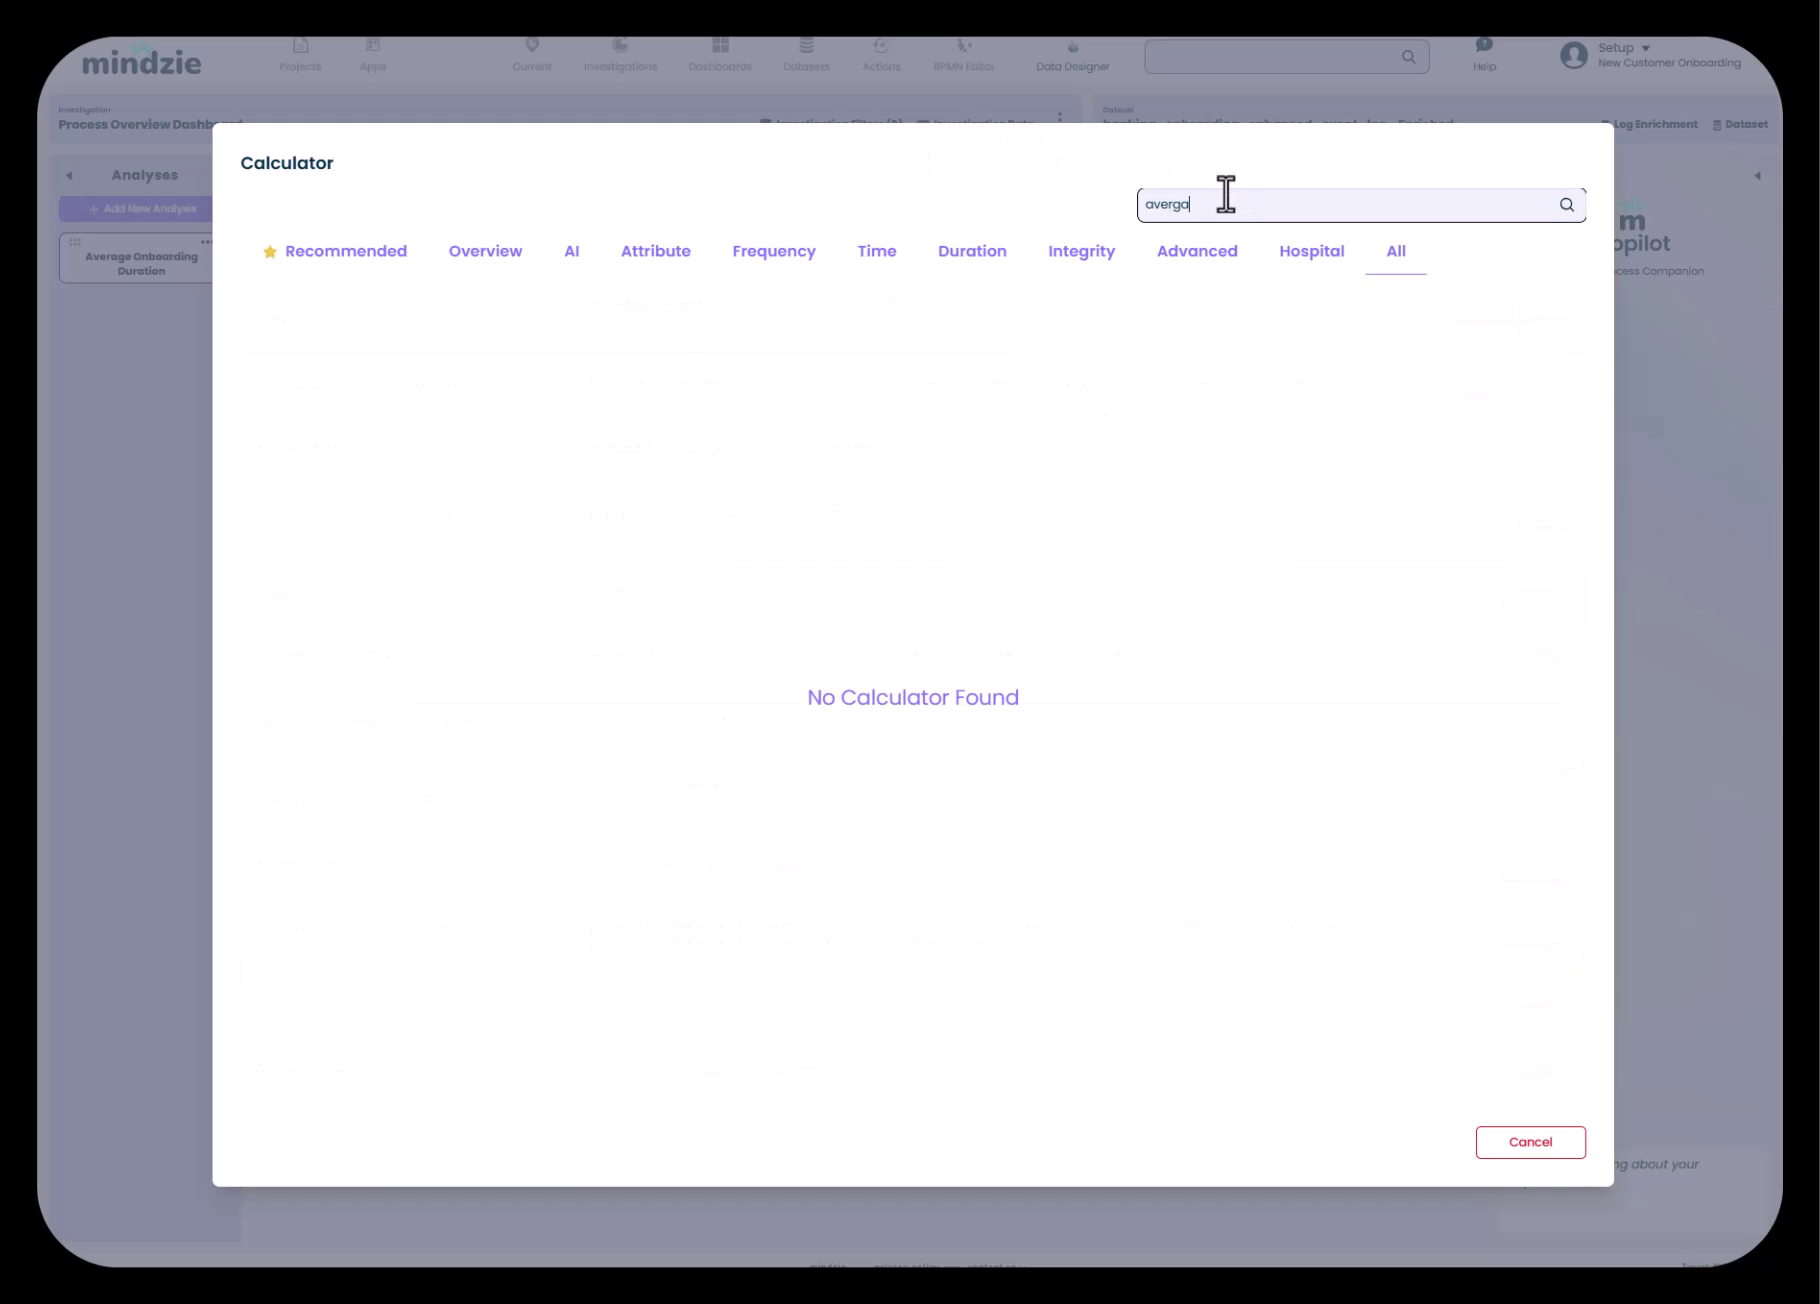
The search functionality saves time when working with mindzie's extensive library of 40+ calculators. You can search by calculator name, category, or function.
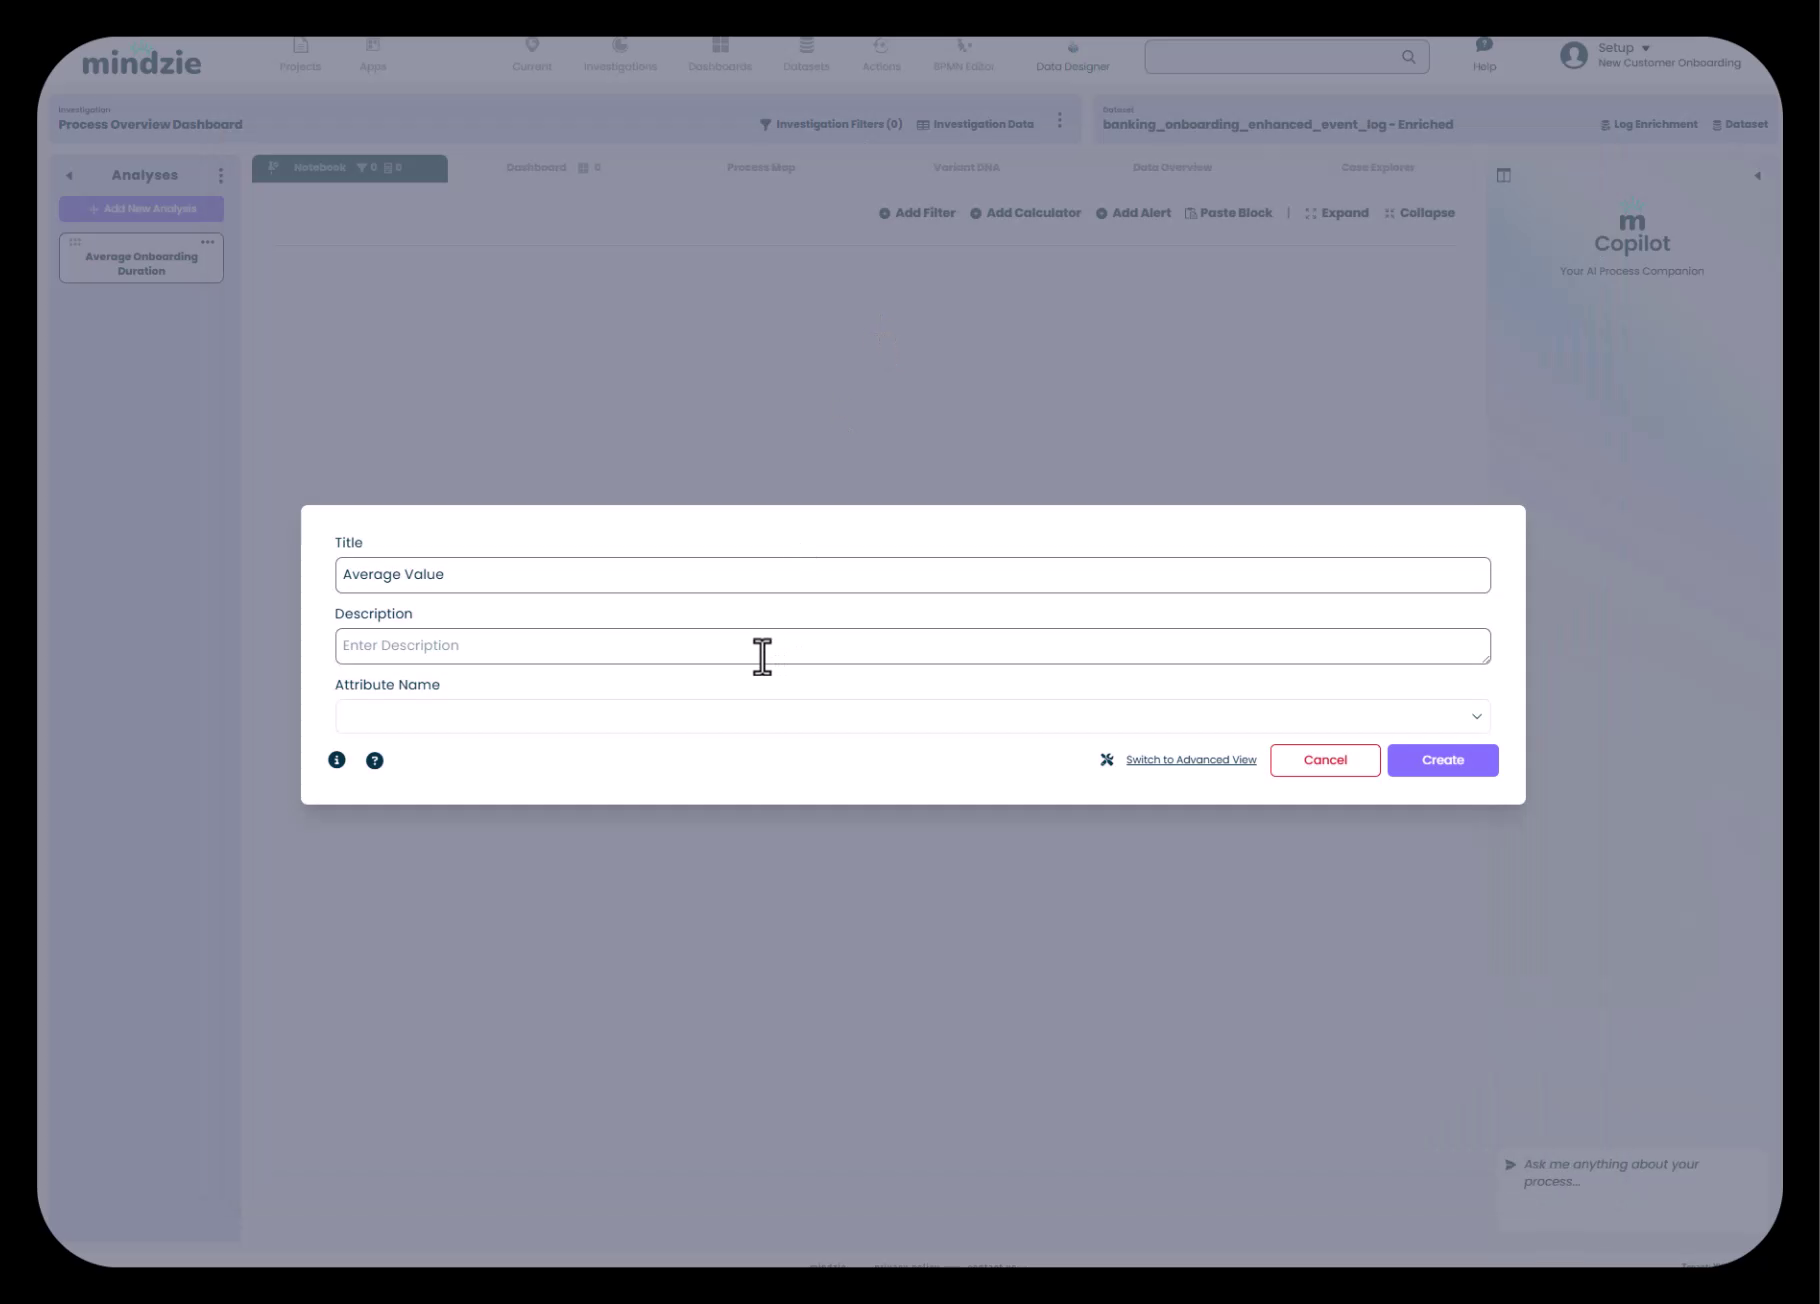
Step 5: Configure the Calculator Attribute
After selecting the Average Value calculator, you need to specify which attribute to calculate the average for.
- Click on the "Attribute Name" dropdown in the calculator configuration
- Search for "duration" in the attribute list
- Select "Case Duration"
Why Case Duration is Available:
The Case Duration attribute exists because you previously ran the data through the mindzie Log Enrichment Engine. The Performance Wizard or other enrichment blocks calculated this attribute by analyzing the timestamp differences between case start and completion events.
This highlights the critical relationship between log enrichment and analysis: enrichments create the attributes that power your calculators.
Step 6: View the Result
Once you select the Case Duration attribute and add the calculator, mindzie immediately calculates and displays the result.
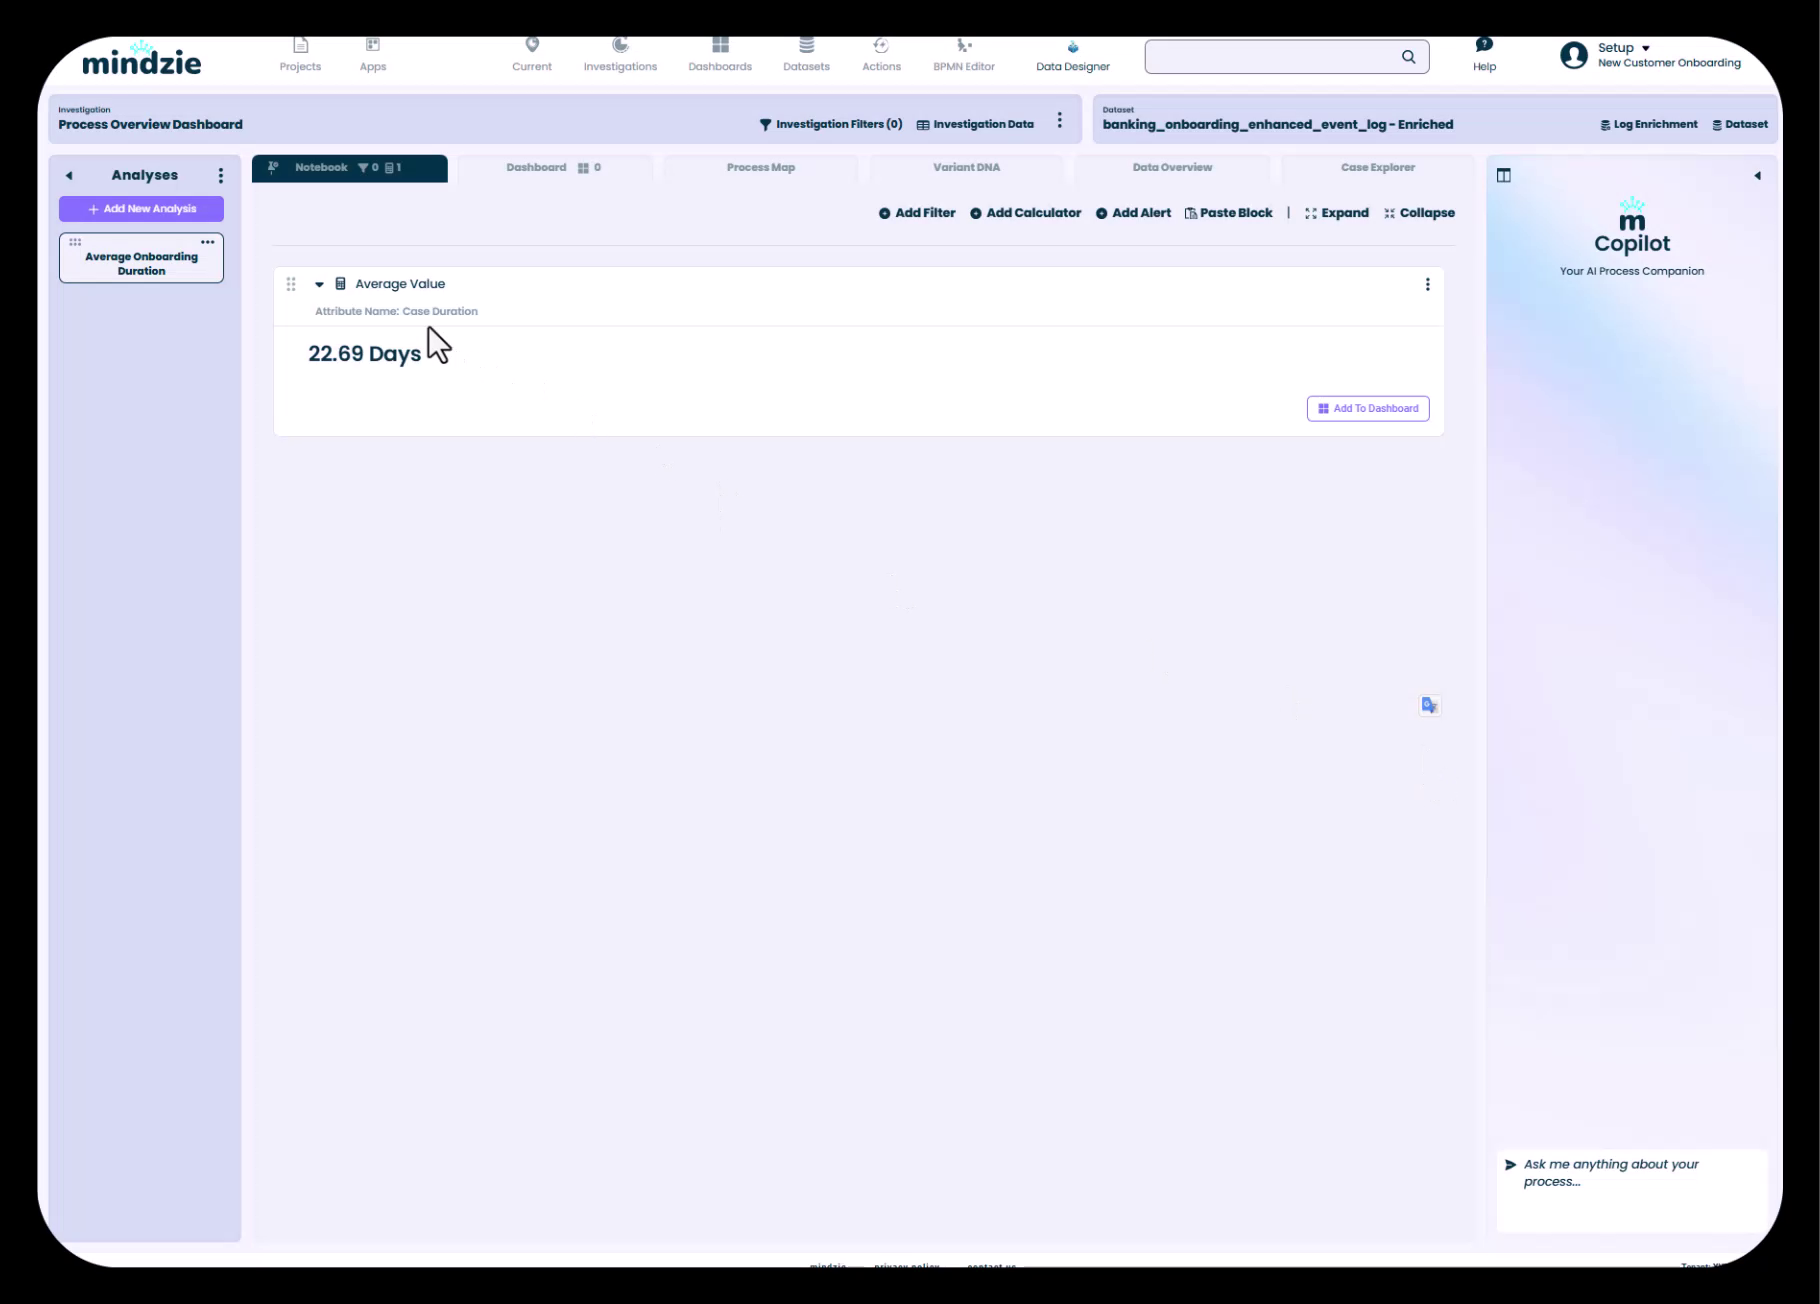
The result block shows:
- Calculator type - "Average Value" header
- Attribute name - "Case Duration" (the attribute being averaged)
- Calculated metric - "22.69 Days" (the average duration across all cases)
- Action buttons - Options to add to dashboard, configure, or remove
This metric now represents a key performance indicator (KPI) for your process: on average, customer onboarding takes 22.69 days from start to finish.
Building More Complex Analysis
Combining Multiple Filters
To create segmented analysis, you can add multiple filters to the same analysis block:
- Click "Add Filter" to add your first filter (e.g., filter by Division = "North America")
- Click "Add Filter" again to add additional filters (e.g., filter by Year = "2024")
- Add your calculator (e.g., Average Value on Case Duration)
The filters work together (typically with AND logic) to narrow your data to exactly the segment you want to analyze.
Adding Multiple Calculators
You can add multiple calculators to the same filtered dataset to view different perspectives:
- Add filters to define your data segment
- Add multiple calculators (e.g., Average Value, Distribution chart, Trend over time)
- Each calculator operates on the same filtered data, providing complementary insights
Creating Comparative Analysis
To compare performance across segments:
- Create separate analysis blocks for each segment
- Use filters to isolate each segment (e.g., one block for US region, another for Europe)
- Use the same calculator configuration in each block
- Compare the results side-by-side or publish them to the same dashboard
Advanced Calculator Configuration
Many calculators offer additional configuration options beyond attribute selection:
- Aggregation methods - Choose between average, median, sum, min, max
- Grouping - Group results by another attribute (e.g., show average duration by department)
- Time bucketing - Show trends over days, weeks, months, or years
- Visual styling - Customize colors, labels, and display formats
- Thresholds - Set performance targets or warning levels
Explore each calculator's configuration panel by clicking the three-dot menu on the calculator block.
Leveraging Enriched Attributes
The power of filters and calculators depends heavily on having meaningful attributes to analyze. Common enriched attributes that enable powerful analysis include:
Performance Attributes (from Performance Wizard):
- Case Duration
- Activity Duration
- Time Between Activities
- Performance Buckets (Fast, Normal, Slow)
Conformance Attributes (from Conformance Rules):
- Conformance Status (Compliant/Non-Compliant)
- Rule Violation Counts
- Severity Levels
Cost Attributes (from Activity Info Wizard):
- Case Total Cost
- Activity Costs
- Resource Costs
AI Predictions (from AI enrichments):
- Predicted Completion Time
- Risk Scores
- Recommended Actions
Without enrichment, you're limited to analyzing only the original data attributes (Case ID, Activity Name, Timestamp, Resource). Enrichment unlocks the full analytical potential of mindzie studio.
Best Practices
Start Simple, Then Refine
Begin with basic metrics like overall averages or counts before adding complex filters. This helps you:
- Understand the baseline performance
- Verify your data is loading correctly
- Build confidence with the interface before tackling complex scenarios
Use Descriptive Analysis Names
When creating analysis notebooks, use clear names that describe what you're investigating:
- "Average Onboarding Duration" (clear)
- "Analysis 1" (unclear)
Organize Filters Logically
When using multiple filters, organize them in a logical order:
- Time-based filters first (year, quarter, month)
- Structural filters second (division, department, region)
- Outcome-based filters last (conformance status, performance bucket)
Reuse Successful Patterns
Once you create an effective analysis, you can:
- Copy the entire analysis block and modify the filters
- Copy it to other investigations in the same project
- Copy it to other projects (see "Reusing Analysis: Copying and Adapting Notebooks")
Document Your Analysis
Use the notes feature in analysis notebooks to document:
- What question the analysis answers
- What filters and calculators you're using and why
- Any assumptions or data limitations
- How to interpret the results
Common Use Cases
Performance Benchmarking
Goal: Compare average process duration across regions
- Create one analysis block per region
- Add a "Cases with Attribute" filter for each region (e.g., Region = "North America")
- Add the Average Value calculator with Case Duration attribute
- Publish all metrics to the same dashboard for side-by-side comparison
Trend Analysis
Goal: Track how performance changes over time
- Add a Time Period filter to select your date range
- Add a Trend calculator configured to show Case Duration over time
- Set the time bucket to Month or Quarter
- Look for seasonal patterns or improvement trends
Root Cause Investigation
Goal: Understand why some cases take longer than others
- Add a Performance Bucket filter to isolate "Slow" cases
- Add multiple calculators to explore different dimensions:
- Variant DNA to see which process paths are slow
- Attribute Distribution to see which departments have slow cases
- Root Cause Analysis to identify statistically significant factors
Conformance Monitoring
Goal: Measure compliance rule violations
- Add a Conformance Status filter to select "Non-Compliant" cases
- Add calculators to quantify the problem:
- Count of non-compliant cases
- Percentage of total cases
- Breakdown by violation type
- Trend over time
Troubleshooting
Calculator Shows "No Data"
Causes:
- Filters are too restrictive and exclude all cases
- Selected attribute doesn't exist in your dataset
- Data hasn't finished loading
Solutions:
- Remove filters one at a time to identify which is too restrictive
- Verify the attribute exists in Data Overview tab
- Check that enrichments have been calculated successfully
Attribute Not in Dropdown List
Causes:
- Enrichment hasn't been calculated yet
- Enrichment failed due to configuration error
- Using original dataset instead of enriched dataset
Solutions:
- Navigate to Log Enrichment and calculate the enrichment
- Check enrichment configuration for errors
- Verify your investigation is using the enriched dataset
Calculator Result Seems Wrong
Causes:
- Filters not configured as intended
- Wrong attribute selected
- Data quality issues in source data
Solutions:
- Review filter configuration carefully
- Verify attribute selection matches your intention
- Check Data Overview to manually inspect attribute values
- Use Case Explorer to examine individual cases
Summary
The analysis-filter-calculator paradigm is the foundation of all work in mindzie studio. By mastering these building blocks, you can:
- Create sophisticated metrics without coding
- Answer complex business questions through visual analysis
- Rapidly iterate and refine your investigations
- Build reusable analysis patterns that can be adapted across projects
Remember: filters define "what data" you're analyzing, and calculators define "what you want to know" about that data. The combination of these two simple concepts enables unlimited analytical possibilities.