Filter Everywhere
Prefer to watch? This tutorial is also available as a video.
The one thing to understand
You can now filter by clicking a value you can already see - no filter panel, no dropdowns, no typing.
That is the whole feature. The same value you were looking at becomes the filter, in one click.
| Steps | |
|---|---|
| Before | Open the filter panel -> click Add Filter -> pick the column from a dropdown -> pick a comparison -> type the value in by hand (the value already under your cursor). |
| Now | Click the value -> pick a verb (Is, Is not, Contains...) -> done. |
The second win is consistency: the same operation now has the same name everywhere. "Keep this value" is called Is on every screen - Data Overview, the Variant tab, and the Process Map - instead of a different word depending on where you were standing.
Where you can now filter with one click
These are all the places where clicking what you see now builds the filter for you, instead of making you build it by hand in the filter panel.
| # | Where | Click this... | ...to get | New? |
|---|---|---|---|---|
| 1 | Data Overview -> any value | any value in a frequency grid's first column | a menu of verbs matched to that column's data type | This screen could not filter at all before - it only had Show Data / Identify Root Causes |
| 2 | Data Overview -> many values at once | tick several checkboxes, then Keep or Exclude | one filter for the whole set (one execution, not one per value) | New |
| 3 | Data Overview -> a number or duration column | drag the MIN / MAX sliders under the distribution chart, then Apply as filter | a "between" range filter for that column | New - continuous columns could not be filtered before; the chart was read-only |
| 4 | Data Overview -> any date/time column | pick a range on the Daily Event Count chart, then Apply as filter | a time-range filter, Cases or Events scope | The good chart view now works on every datetime column (Case Start, admit_dt...), not just Activity Time |
| 5 | Data Overview -> Variant tab | a variant name | the same menu, with Is / Is not | A variant click used to open only Show Data; "every case except this variant" was impossible |
| 6 | Process Map -> activity node | an activity box, then the Filter Cases dropdown | Has this activity / Is the first activity / Repeats... plus a new Identify Root Causes | Verbs reworded to match the rest of the product; Identify Root Causes is new here |
| 7 | Process Map -> flow (edge) | the arrow between two activities, then the Filter Cases dropdown | Has this flow / Doesn't have this flow | Verbs reworded to match the rest of the product |
The same menu also appears - and where it deliberately does not
The value menu is hosted inside the notebook, so it appears on the Data Overview tab of any investigation.
On screens that have no notebook - the Derived Attributes / Log Enrichment editor and the Show Data dialog - clicking a value still works, but it shows the older Show Data menu, not the new filter verbs. This is expected. If you are on one of those screens and the verbs are missing, nothing is broken - there is simply no notebook there for a filter to go into.
How you filter a continuous column now: number and duration columns show a distribution chart with MIN / MAX range sliders underneath - drag the handles and press Apply as filter (see "Number & duration ranges" below). Clicking an individual bar of that chart still does nothing - the bars are only there to show you the shape of the data. The slider is the control.
How it works - the value menu
Click a value in the first column of a frequency grid. The menu opens with its verbs already visible.
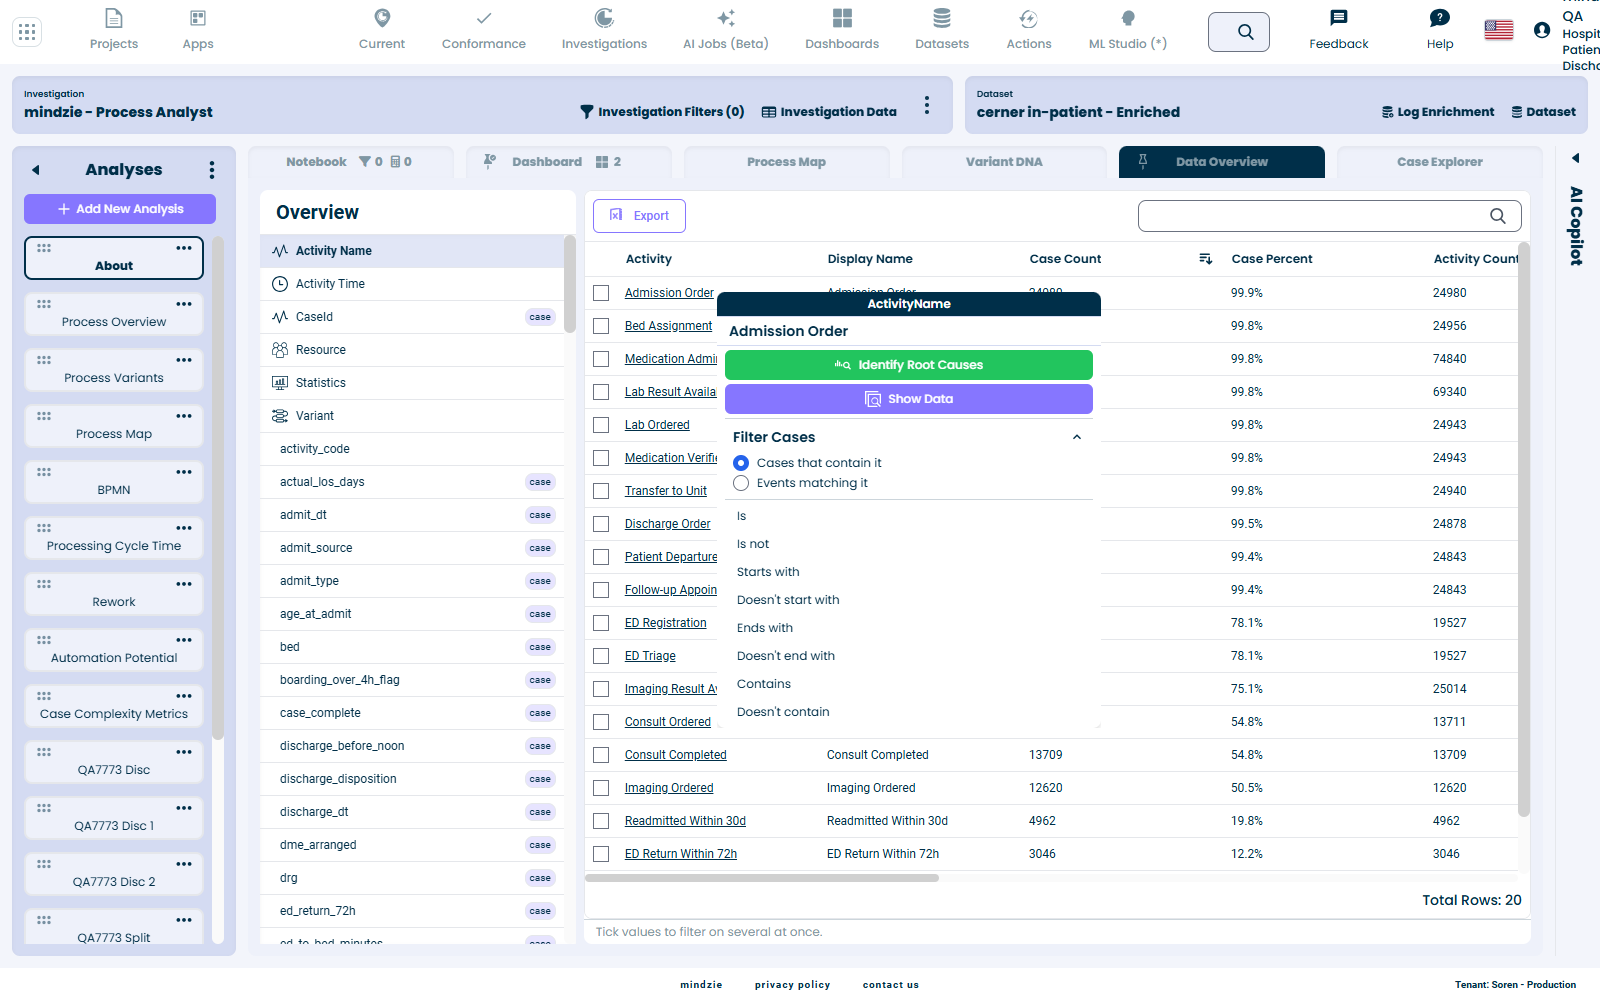
Every menu also carries Identify Root Causes and Show Data - nothing was removed.
The verbs, by data type
The verbs offered depend on the column's data type. This table is exact:
| Data type | Verbs offered |
|---|---|
| Text (String) | Is, Is not, Starts with, Doesn't start with, Ends with, Doesn't end with, Contains, Doesn't contain |
| Whole number (integer) | Is, Is not, Greater than, Less than, Between |
| True / False | Is, Is not |
| Variant | Is, Is not |
Date, duration and decimal-number columns do not open this menu. Clicking one opens a range chart or slider instead - a date/time column opens the Daily Event Count chart, a duration or decimal number (Single/Double) column opens a MIN/MAX slider. Both are covered under "Number & duration ranges" and "Date & time ranges" below, and both build a "between" range filter. Only whole-number columns (integers) stay on the frequency grid and use the value menu above, because their values are discrete and worth picking one by one.
Cases vs Events
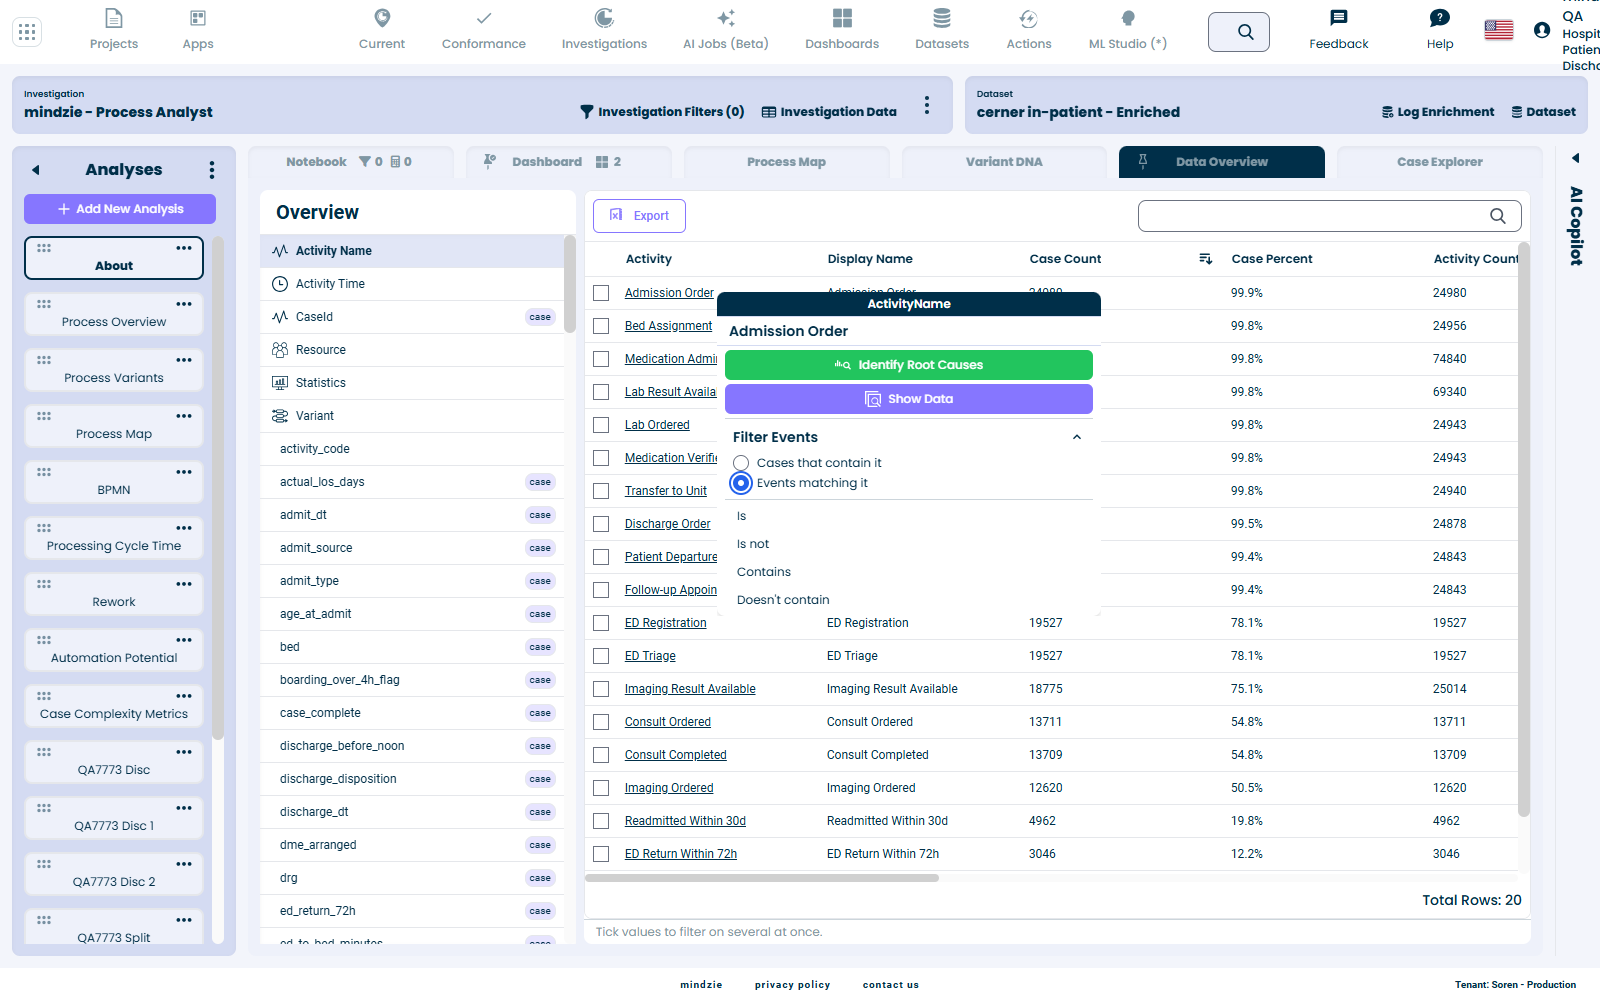
On an event-level text column (for example Activity Name or Resource) the menu offers a choice, because the click honestly means two different things:
- Cases that contain it - keep the whole case if any event matches; its other events survive.
- Events matching it - keep only the matching events, shrinking the case.
The section header follows your choice: it reads Filter Cases or Filter Events.
Under Filter Events, only the verbs the engine can honour at the event level are shown - Is, Is not, Contains, Doesn't contain. Starts with / Ends with and their negatives are hidden, because the engine has no event-level filter for them (offering them there would silently build a case filter instead).
What the filter panel reads afterwards
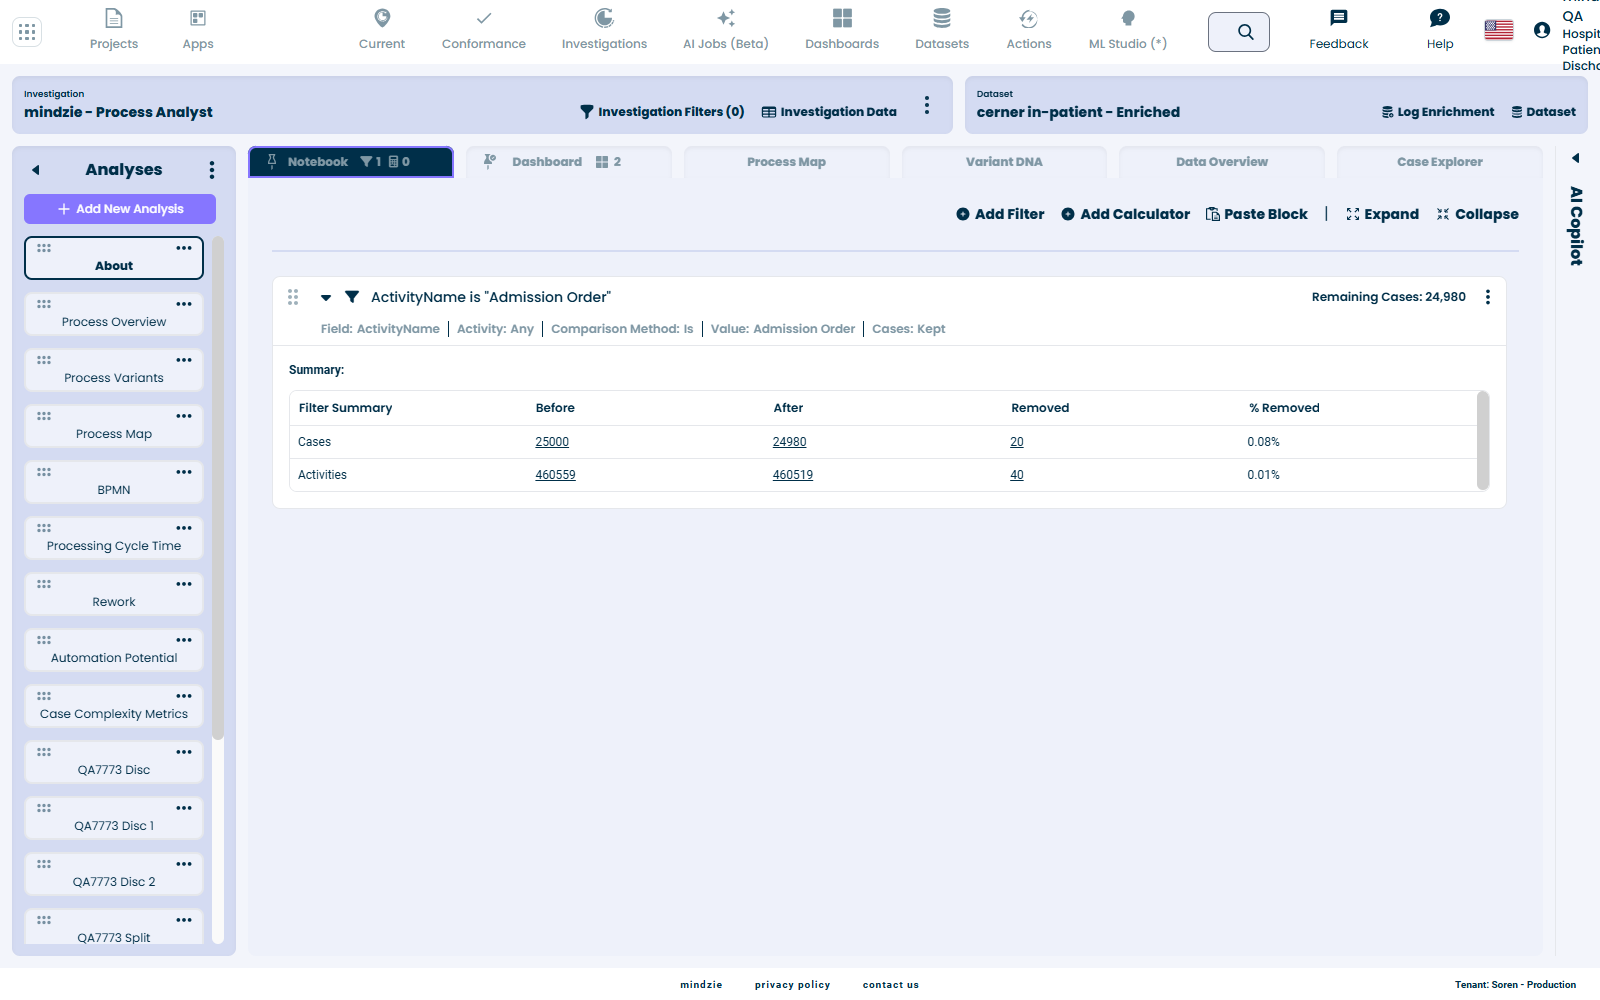
The filter block is written in plain language, using the verb you clicked - not code operators:
| Before | Now |
|---|---|
Region != "EMEA" |
Region is not "EMEA" |
age_at_admit > 65 |
age_at_admit is greater than 65 |
Surface by surface
1. Data Overview - any value
Open Data Overview, pick an attribute in the left rail, and click a value in the first column.
Try it: click any value in the grid. The menu opens with the verbs that suit that column's type, and picking one adds a single filter block to your notebook.
Note: the menu opens upwards when you click near the bottom of the window, so its verbs are never off-screen. Escape closes it.
2. Data Overview - many values at once
Checkboxes appear on text and whole-number columns only. Tick a few values; a footer appears with Keep, Exclude and Clear.
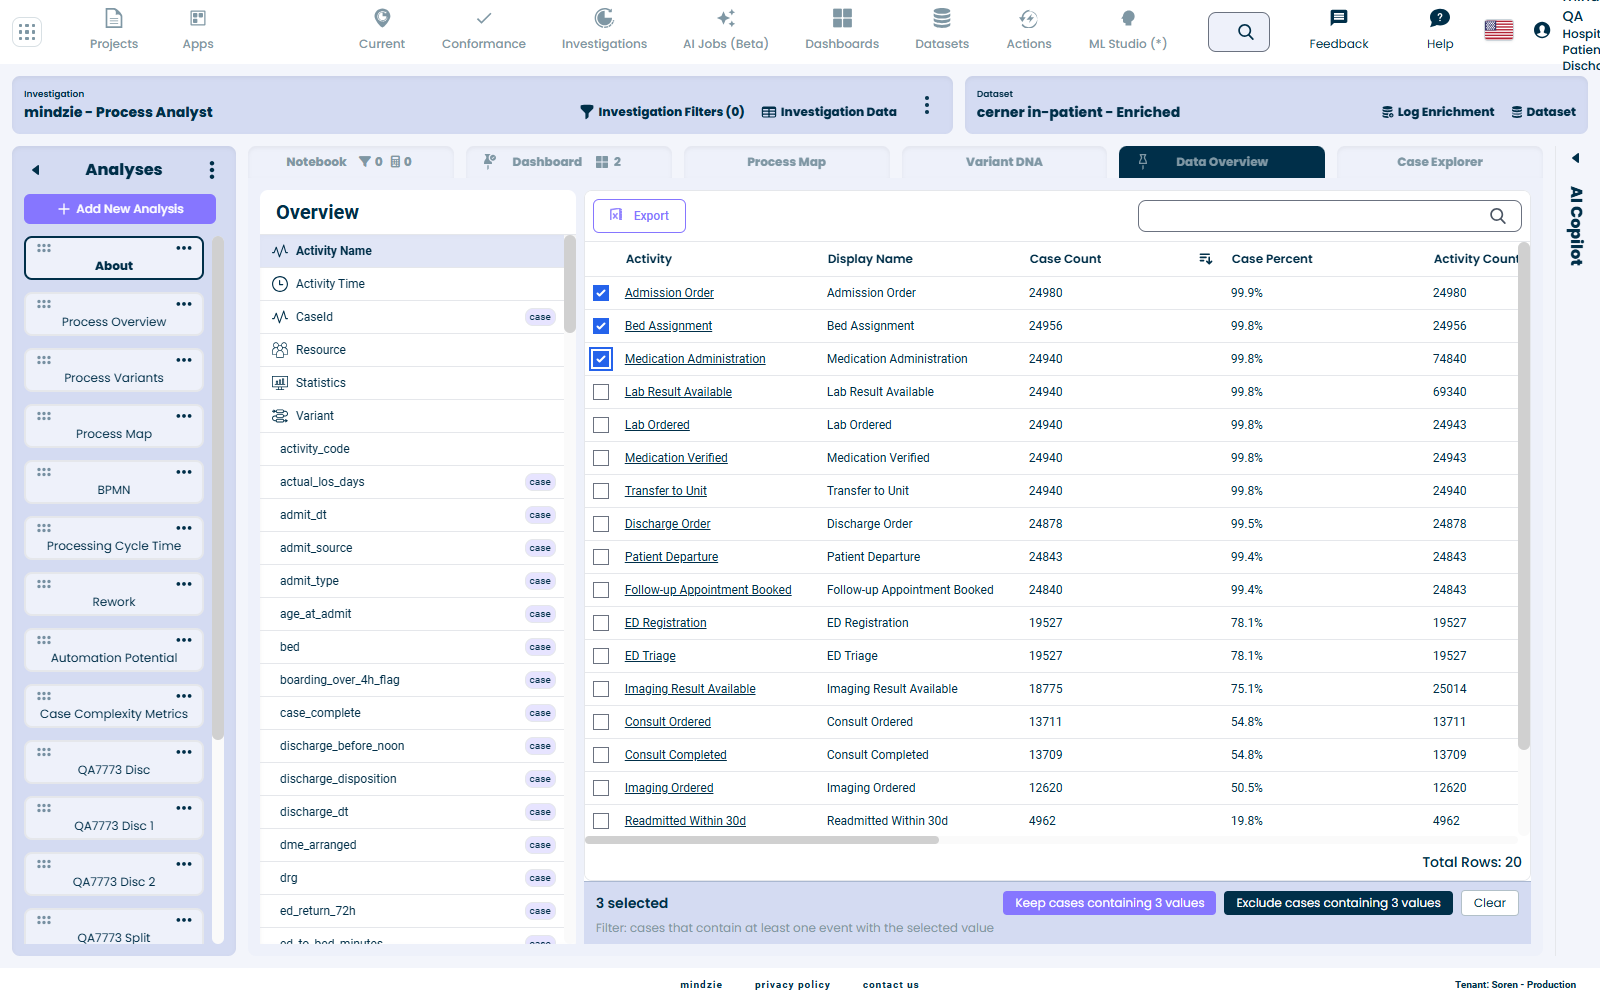
The buttons tell you exactly what you will get:
- Case-level attribute (e.g. Admit Type): Keep cases matching N values.
- Event-level attribute (e.g. Activity Name): Keep cases containing N values - with a line underneath: "cases that contain at least one event with the selected value."
Try it: tick three values and press Keep. You get one filter block covering all three, and the filter panel names them - for example ActivityName is one of "Admission Order", "Bed Assignment", "Medication Administration".
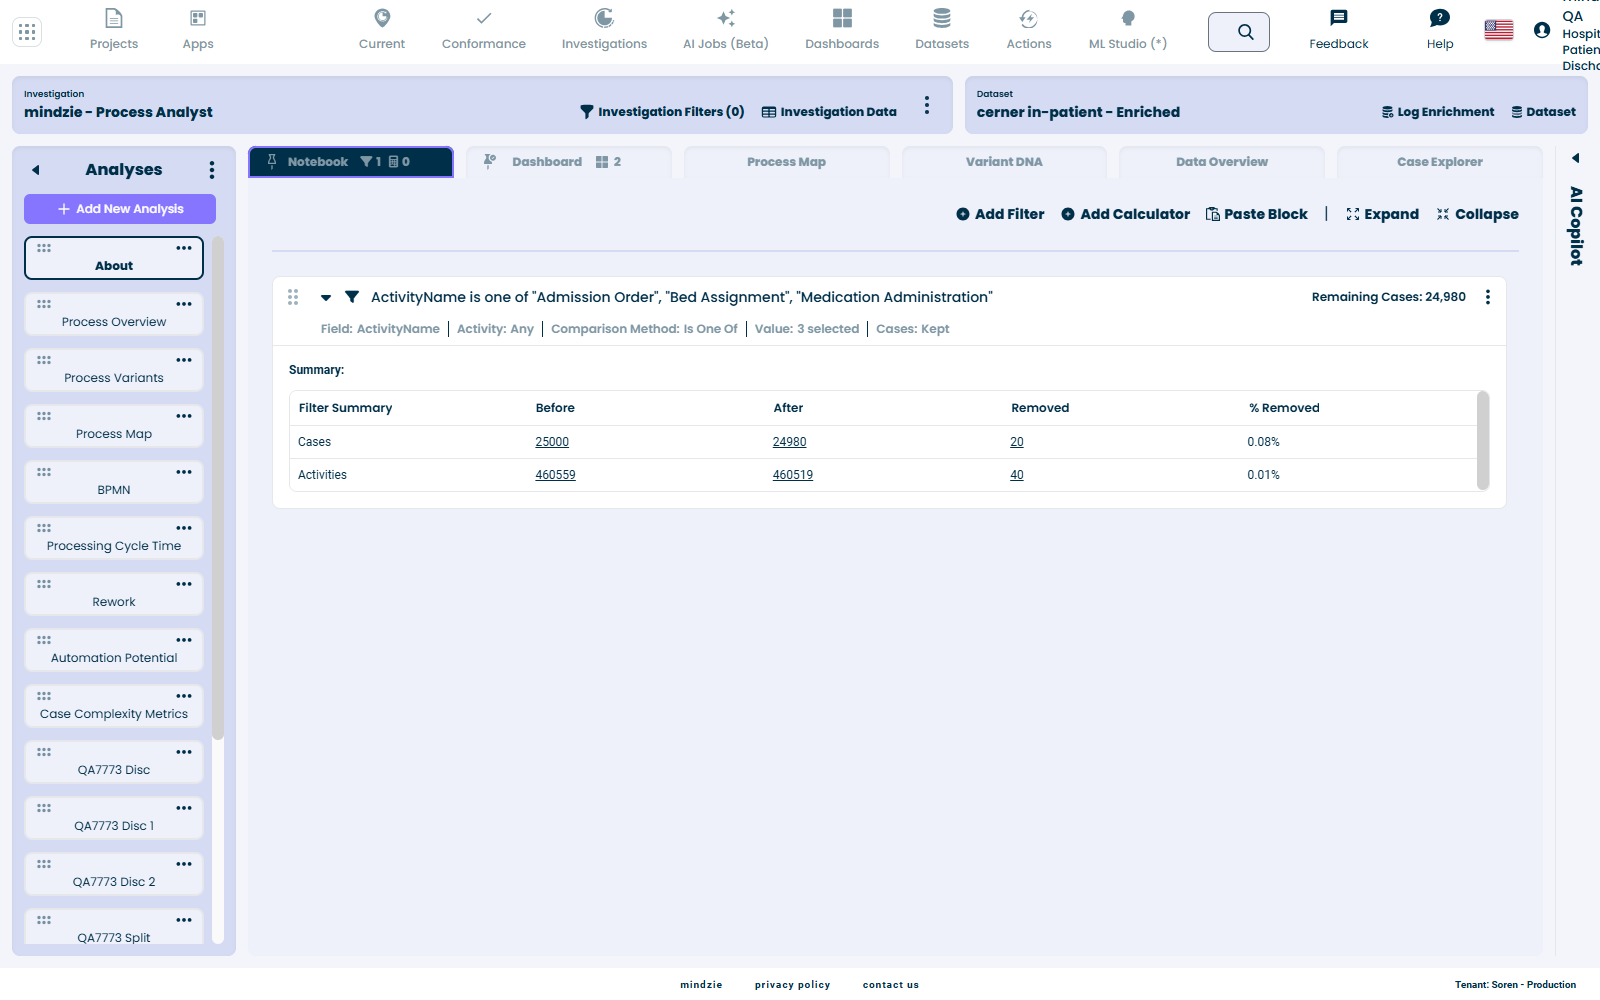
Note: the Blank row's checkbox is disabled (a blank value has nothing to filter on). Checkboxes do not appear on True/False, Date or Duration columns, because the multi-value filter cannot run on those types.
3. Data Overview - number & duration ranges
Click a duration column (Case Duration, or any duration attribute) or a decimal-number column (Single/Double, e.g. actual_los_days). Instead of the value menu you get a distribution chart with two range sliders - a MIN and a MAX. Set the smallest and largest value to keep, then press Apply as filter.
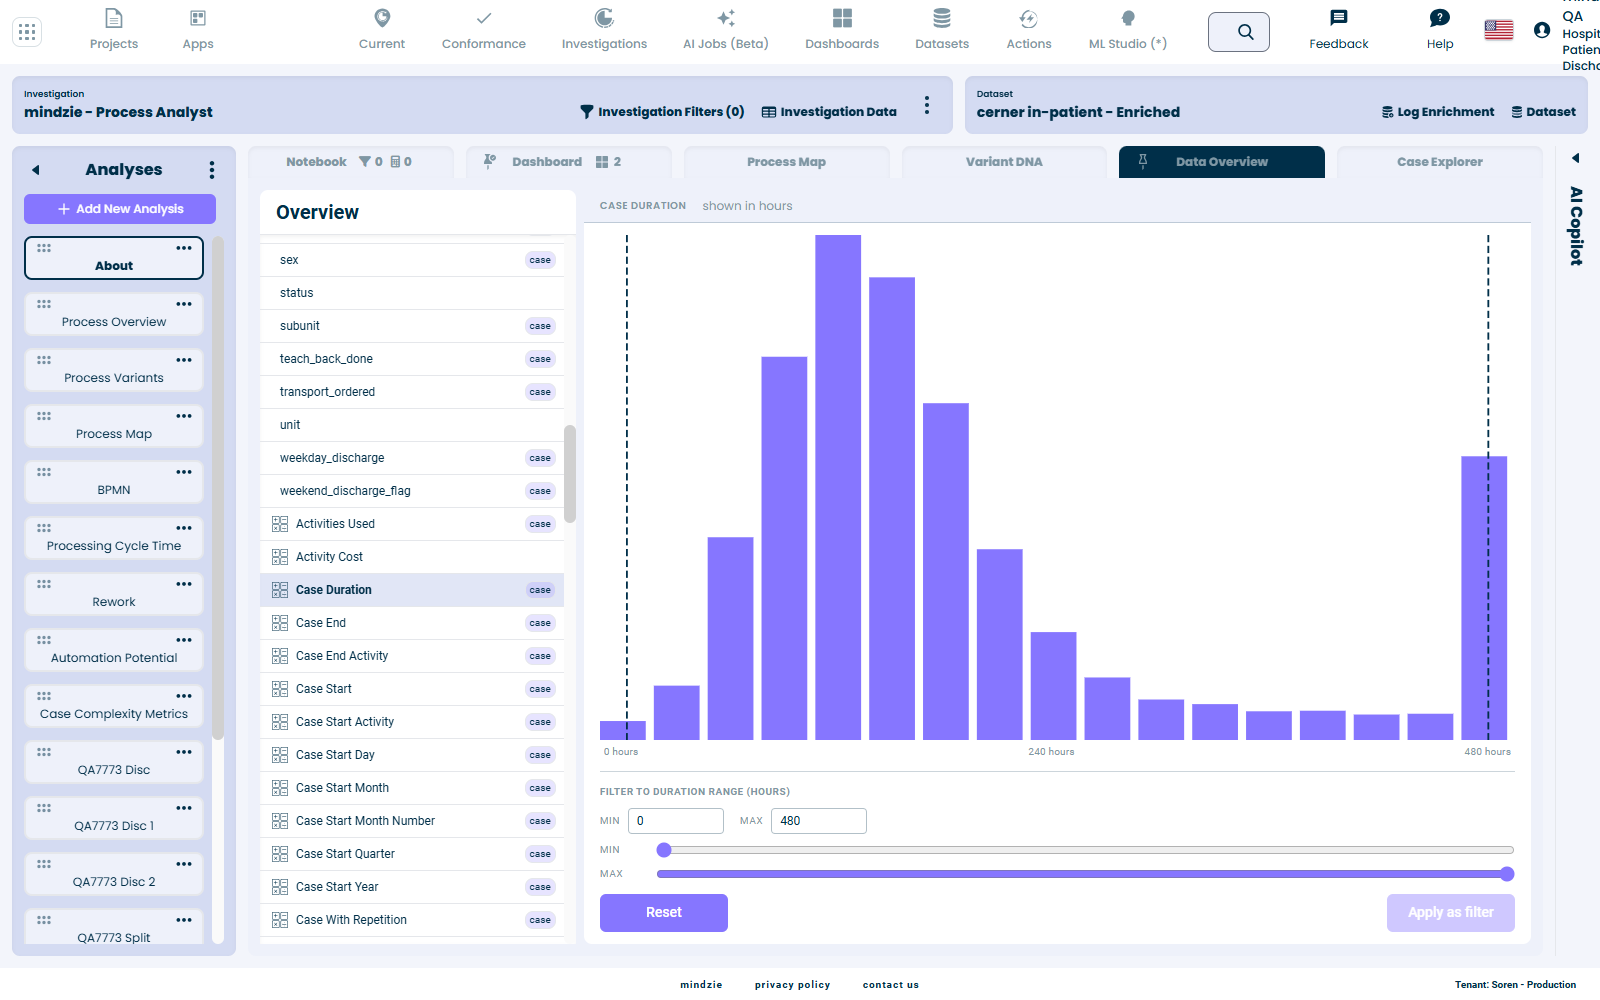
A duration column is captioned Filter to duration range and shows its unit (hours, days or weeks - the chart picks the unit that fits). A number column is captioned Filter to range with no unit.
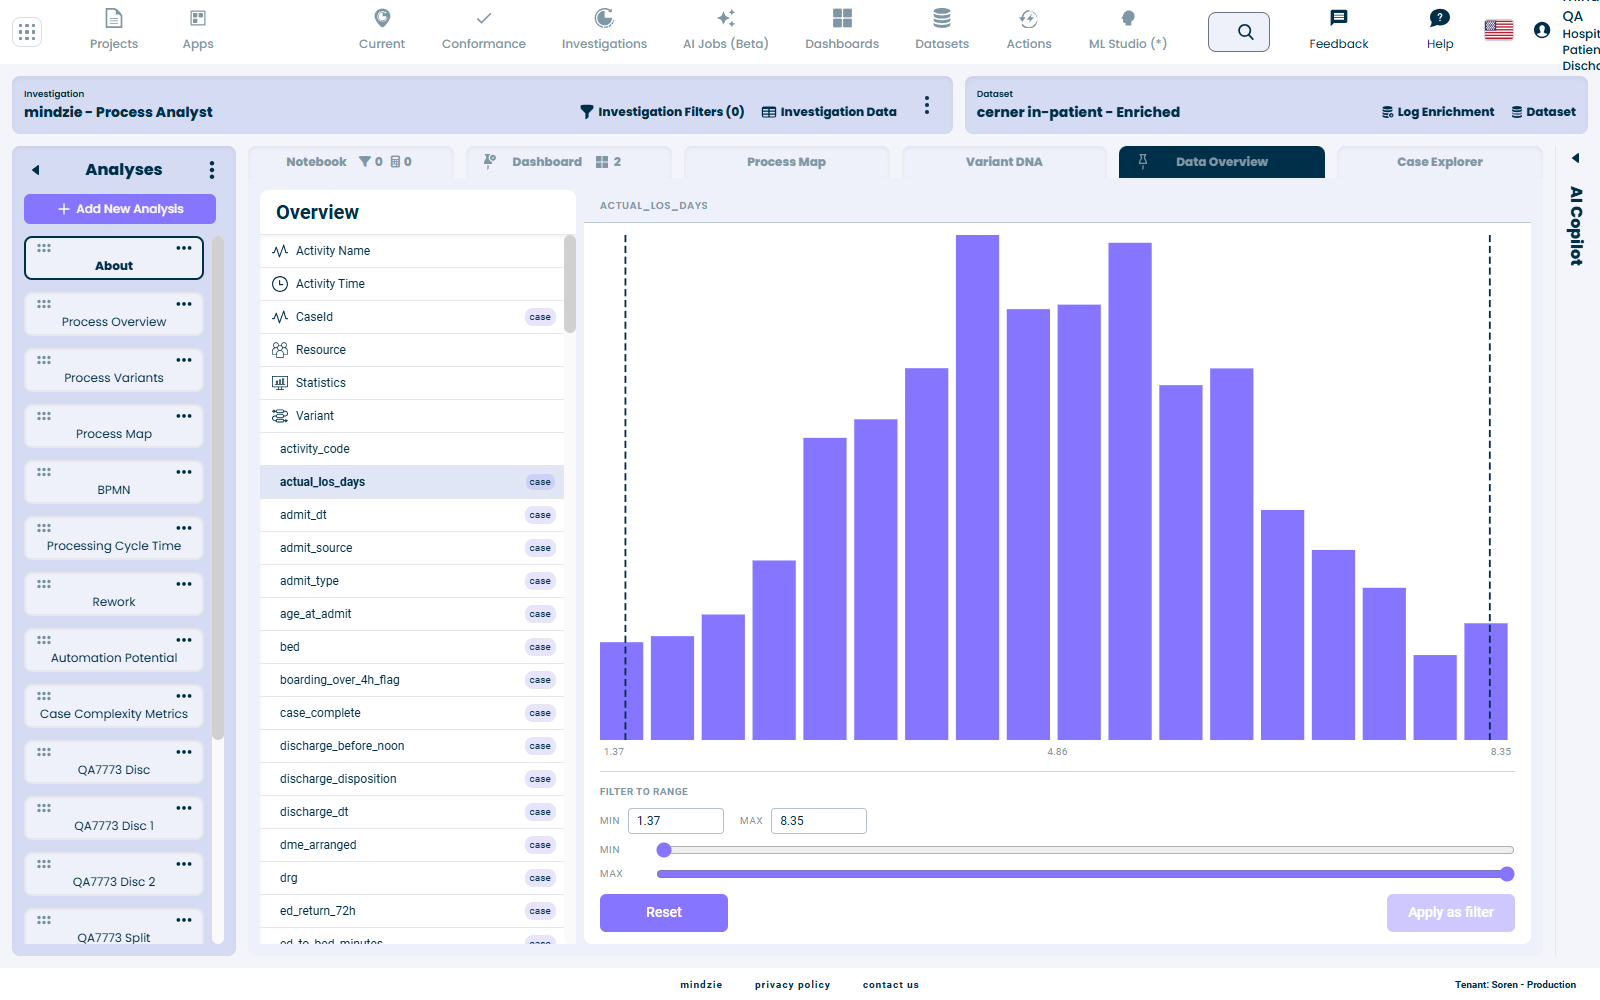
- You can type exact bounds into the MIN / MAX boxes or drag the sliders - they stay in step.
- Apply as filter builds one "between" filter block. Reset returns the sliders to the full range.
- Return to a column you have already filtered and the sliders read the existing range back, the button becomes Update filter, and applying replaces that filter rather than stacking a second one - so a column keeps at most one range filter.
Try it: open a duration column, narrow the MIN / MAX slider and press Apply as filter. Re-open the same column and your range reads back, with the button now offering Update filter - so you adjust the filter you already have instead of stacking a second one on top.
Note: whole-number (integer) columns do not show the slider - they stay on the frequency grid and filter through the value menu (section 1), because their values are discrete.
4. Data Overview - date & time ranges
Click any date/time column - Activity Time, Case Start, admit_dt, discharge_dt, and so on. Each opens the Daily Event Count chart: pick a resolution (Display by Days / Weeks / Months / Quarters / Years - the bar count is shown before you pick), set a range with the date boxes or the sliders, and press Apply as filter. Auto trims the quiet ramp-up and ramp-down at each end; Reset restores the full range.
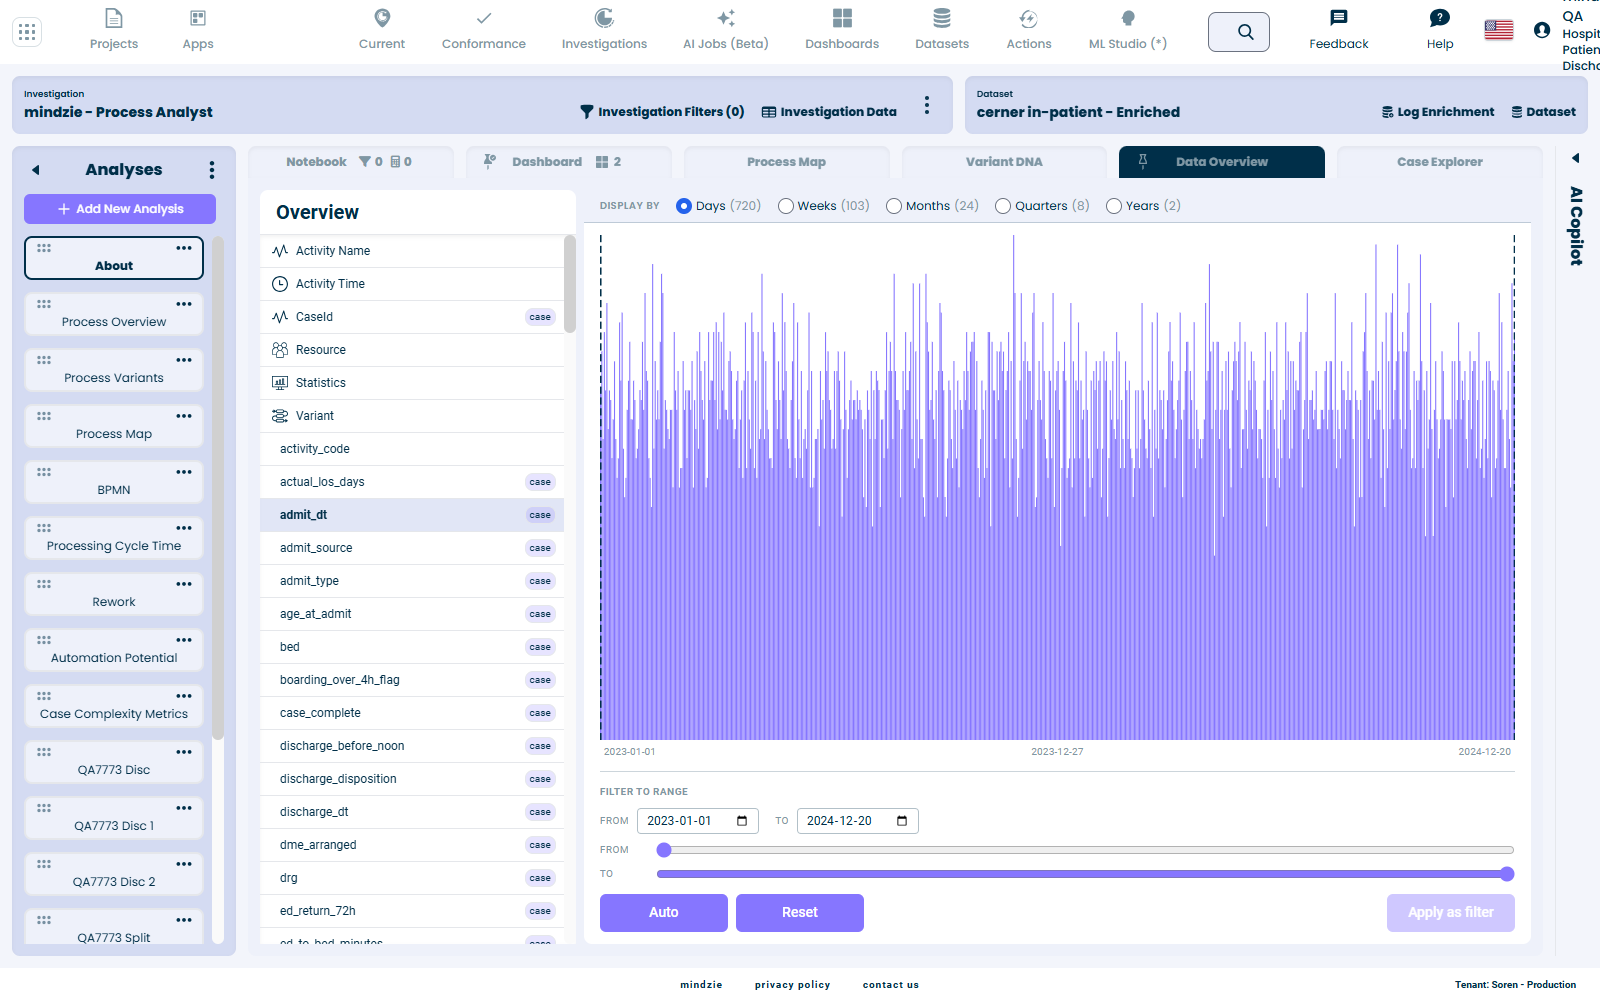
Whether you filter cases or events depends on the column:
- An event-level datetime (Activity Time) offers a Cases / Events choice:
- Cases - keeps whole cases that touch the range (a case that starts before your window survives entire). Adds one filter block.
- Events - keeps only the events inside the range (cases get shorter). Adds two filter blocks (the engine's event filter has no "between", so it uses an on-or-after and an on-or-before bound), as one save and one execution.
- A case-level datetime (Case Start, admit_dt) has one value per case, so the Cases / Events choice is hidden - it can only filter cases, and adds one block.
Like the range sliders, the datetime filter keeps one filter per column: return to a filtered datetime and its range reads back, the button reads Update filter, and applying replaces the previous range (including when you switch Cases <-> Events). Apply is disabled when the selected range is the whole range (it would be a no-op).
Try it: on Activity Time, pick a range with Cases selected. Switch to Events and apply, and the case block is replaced by the two event-bound blocks rather than added to them. A case-level datetime such as Case Start has no Cases / Events choice at all, and simply adds one block.
This view covers every datetime column.
5. Data Overview - the Variant tab
Open Variant in the left rail and click a variant name. The same menu opens, offering Is and Is not.
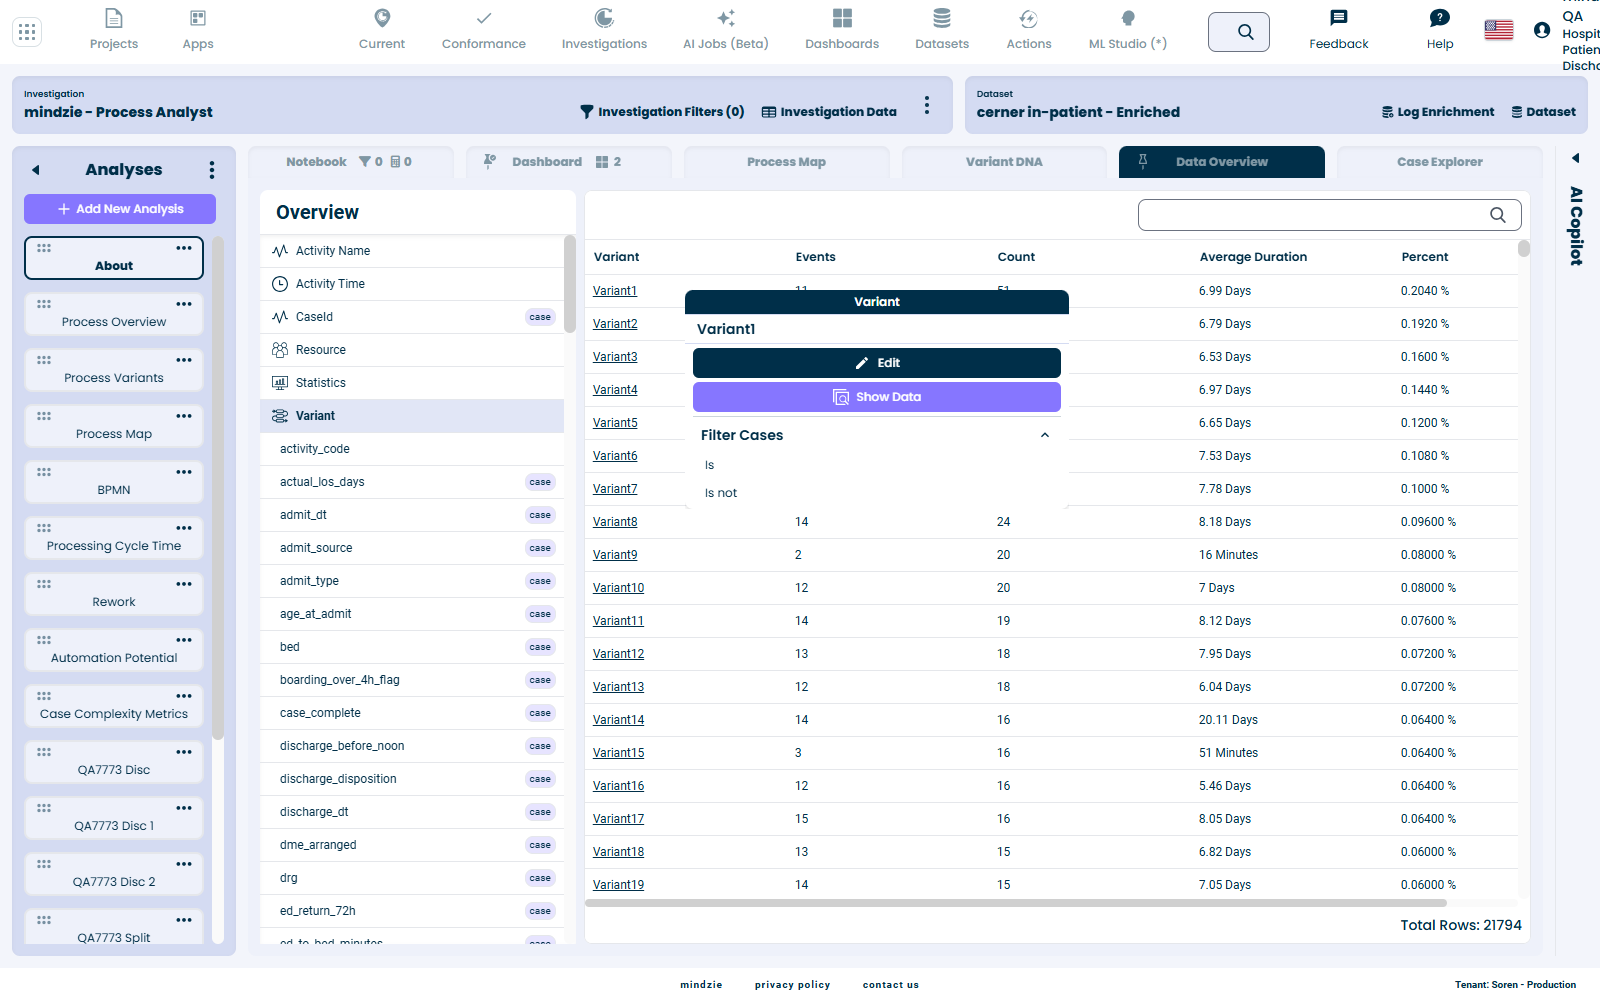
Try it: click a variant and press Is not to keep every case except that path. The menu shows the variant's readable name, such as Variant1.
Note: on a dashboard (no notebook) the variant grid keeps its original Show Data behaviour.
6. Process Map - activity node & flow
On the Process Map tab, click an activity box. The popup carries the activity's details, Identify Root Causes, Show Data, and a Filter Cases dropdown.
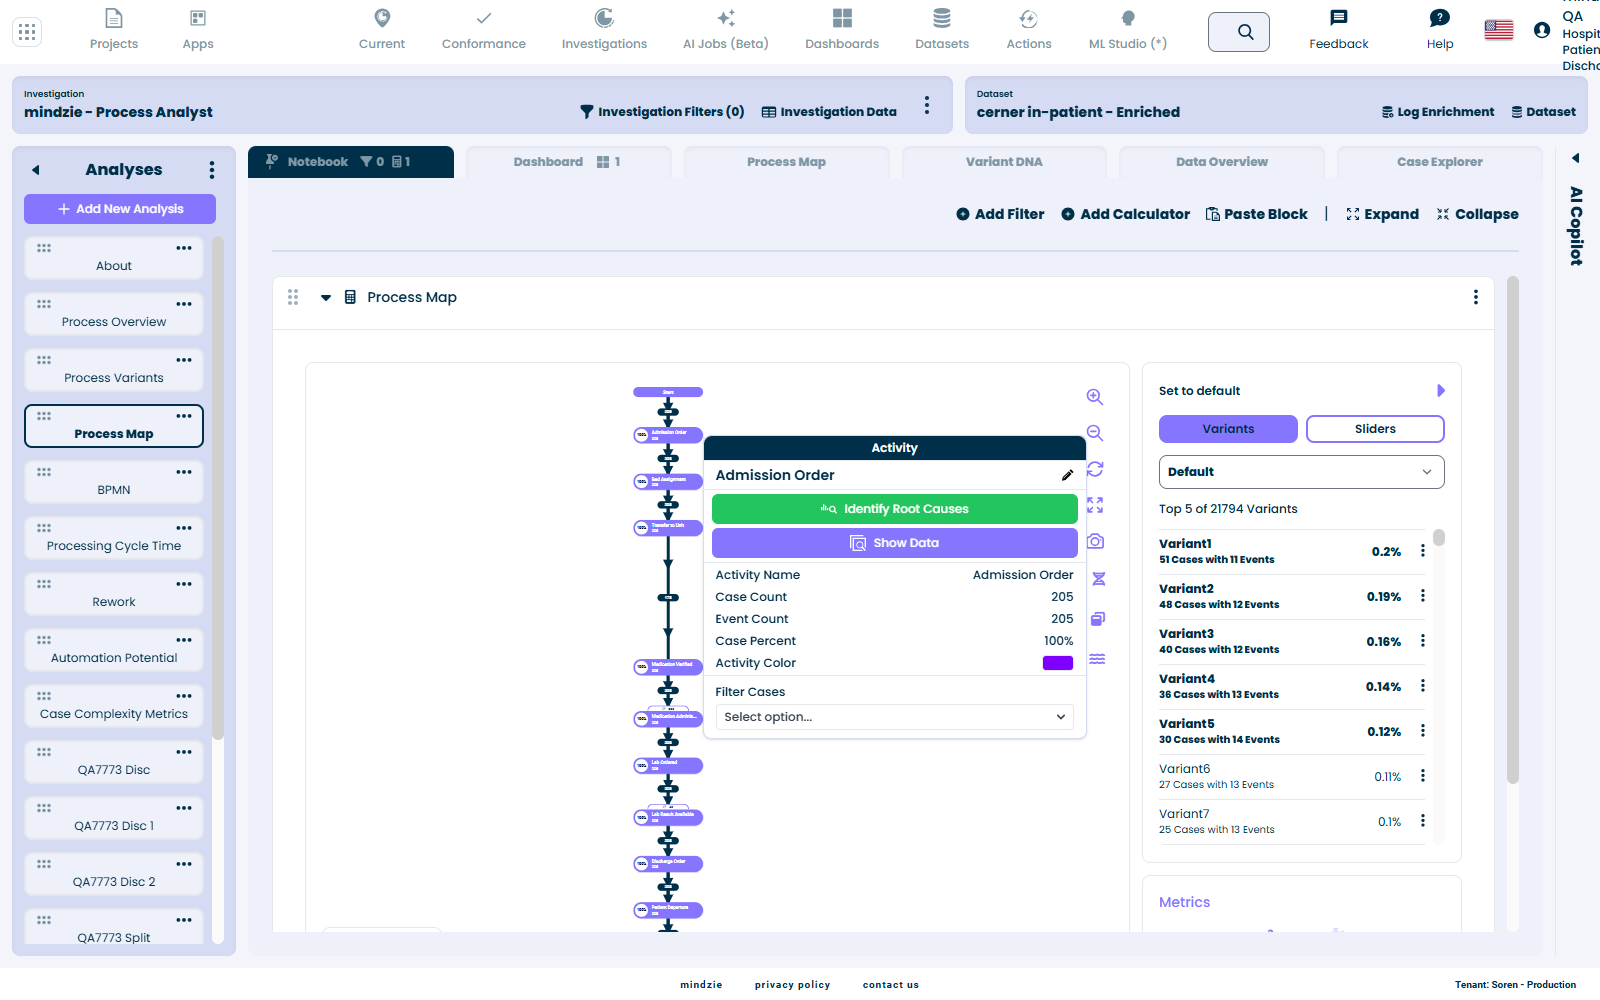
The Filter Cases dropdown now speaks the same language as the rest of the product:
| Before | Now |
|---|---|
| With | Has this activity |
| Without | Doesn't have this activity |
| Starts With | Is the first activity |
| Doesn't Start With | Isn't the first activity |
| Ends With | Is the last activity |
| Doesn't End With | Isn't the last activity |
| Repeats | Repeats |
| Doesn't Repeat | Doesn't repeat |
Try it: click an activity node. Alongside Identify Root Causes, its Filter Cases dropdown reads as full sentences - "Has this activity", "Is the first activity" - and picking one adds a filter block.
The flow (edge) popup
Click a flow - the arrow between two activities - and its popup opens with the flow's details (Edge Count, Case Count, average / median / max / total duration), Identify Root Causes, Show Data, and a Filter Cases dropdown of its own. That dropdown now speaks the same language as everything else:
| Before | Now |
|---|---|
| With This | Has this flow |
| Without This | Doesn't have this flow |
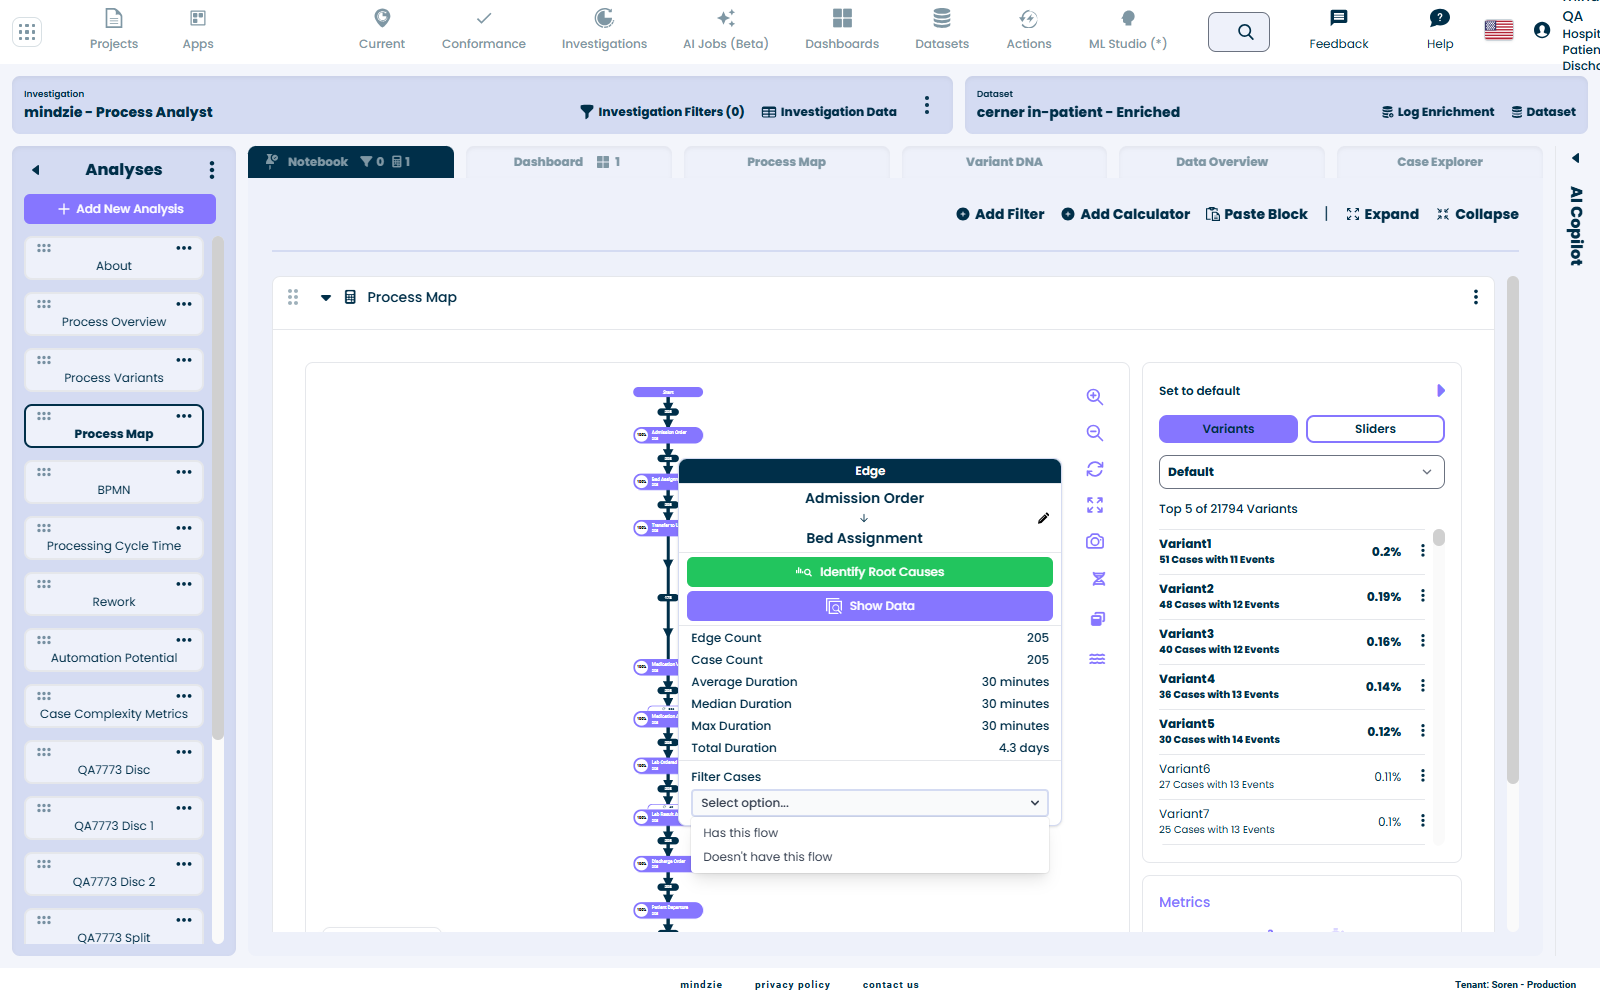
Try it: click a flow (an arrow) and open its Filter Cases dropdown, which reads Has this flow / Doesn't have this flow. Picking one adds a filter block.