Activity Costs
Why Use Activity Costs?
Activity Costs turns an event log of "what happened" into a financial picture of "what it cost." Once costs are configured, every metric in mindzieStudio gains a dollar dimension - and the conversation shifts from "this case took a long time" to "this case cost the business $1,200." That shift is what makes process mining actionable for executives, finance teams, and anyone deciding where to invest improvement effort.
Configure Activity Costs to gain:
- Cost per case and total process cost for every dashboard
- ROI analysis for automation candidates - see exactly how much you save by automating an activity
- Cost-weighted bottleneck detection - so you focus on the activities that cost the most, not just the slowest
- Variant cost comparison - rank execution paths by cost, not just frequency
- Cost outliers - find the cases that quietly drain the budget
- Industry benchmarking - compare your activity costs to published industry norms
Without costs, improvement decisions are made on time alone - which often picks the wrong priorities. Adding costs reframes every chart in business terms.
What This Tab Does
In this tab you provide, for each activity:
- Cost ($) - The estimated cost to perform that activity once
- Estimated Time (min) - How long the activity typically takes
These two values together let mindzieStudio reason about both money and effort. They power calculators like Days of Sales Outstanding, the Automation Calculator, the Case Outcome by Category calculator, and many others.
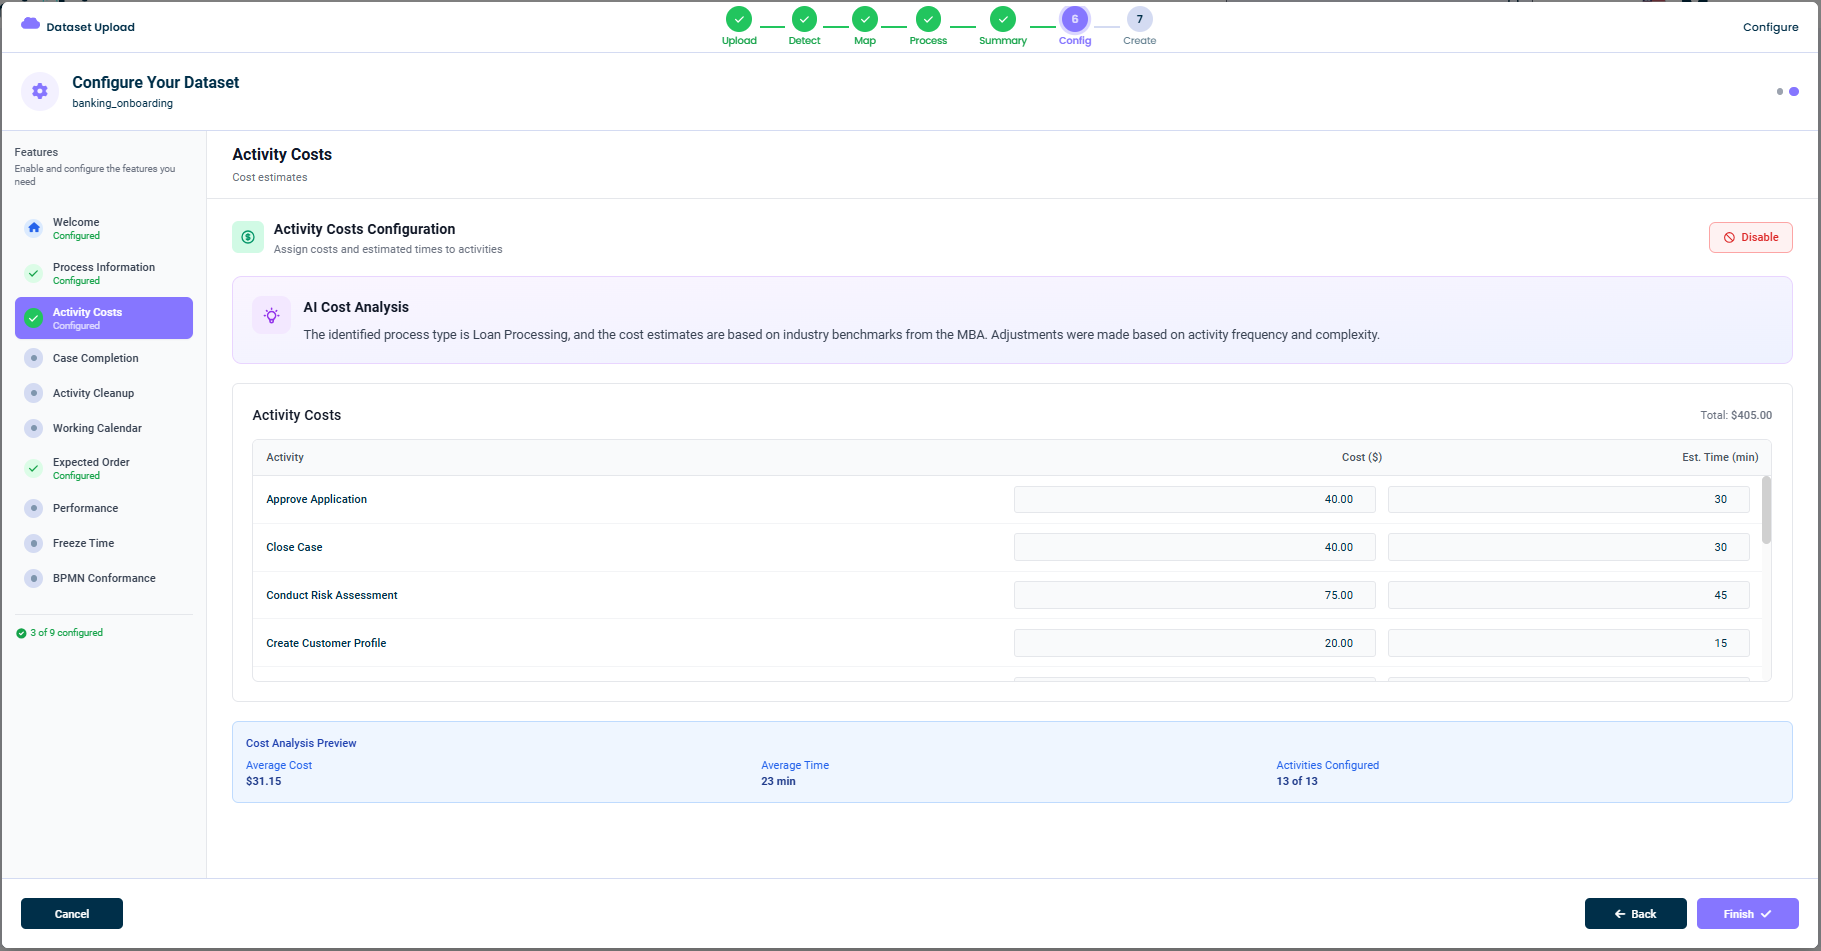
AI Cost Analysis
When you open this tab, mindzie AI shows a brief explanation of how it derived the suggested values. For example:
The identified process type is Loan Processing, and the cost estimates are based on industry benchmarks from the MBA. Adjustments were made based on activity frequency and complexity.
The AI uses three inputs to suggest costs:
- The process type identified in the Process Information tab
- Industry benchmarks from public sources for that process type
- Activity frequency and complexity within your event log
The result is a starting estimate that is realistic for your industry but specific to your dataset. You can override every value if your business has better numbers.
The Activity Table
The main part of this tab is a table with one row per activity. Each row has:
| Column | What It Means |
|---|---|
| Activity | The activity name as it appears in the event log |
| Cost ($) | Estimated cost per occurrence in dollars |
| Est. Time (min) | Estimated time in minutes |
You can edit any cell directly. Tab through to fill in values quickly, or paste from a spreadsheet for bulk updates.
Cost Analysis Preview
At the bottom of the tab, mindzieStudio shows a live preview as you change values:
- Average Cost - Mean cost per event across all activities
- Average Time - Mean estimated time per event
- Activities Configured - How many of the activities have values (e.g.
13 of 13)
You can also see a running Total in the top-right of the table.
Disabling This Feature
If cost analysis is not relevant for your dataset, click Disable in the top-right. mindzieStudio will skip this feature and your dataset will work normally - just without cost-based metrics.
Tips
- Use the AI suggestions as a starting point - they are based on industry benchmarks
- Fill values for the most expensive activities first - they dominate the totals
- Don't worry about precision - even rough estimates are valuable for relative comparisons
- Update over time - revisit the costs as your team builds better data
This documentation is part of the mindzieStudio process mining platform.