AI Causal Analysis (Alpha)
The AI Causal Analysis calculator uses machine learning to discover which case attributes most strongly drive a target outcome. Instead of just showing correlation, it isolates the features that have the greatest statistical impact on whether a case meets the outcome you define - so you can move from "what is happening" to "why it is happening."
Alpha Feature: This calculator is part of the mindzie Alpha Program. It requires PreRelease to be enabled for your tenant. See Alpha Features for more information.
Overview
AI Causal Analysis answers questions like:
- Why do some cases take longer than 7 days to complete?
- Which attributes make an invoice more likely to be paid late?
- What distinguishes cases that breach SLA from those that do not?
- Which facilities, teams, or product categories most influence a given outcome?
You define the outcome (the cases you want to explain), point the calculator at a set of input columns, and it returns a ranked list of the factors most responsible for those cases falling into the outcome group.
How it compares to Root Cause Analysis
AI Causal Analysis shares a goal with the existing Root Cause Analysis calculator but takes a much more rigorous approach:
| Capability | Root Cause Analysis | AI Causal Analysis |
|---|---|---|
| Finds single-attribute drivers | Yes | Yes |
| Finds multi-attribute conjunctions (up to 3 attributes per rule) | No | Yes |
| Distinguishes correlation from causation | No | Yes (causal graph + propensity adjustment) |
| Reports confidence intervals | No | Yes (95% Wilson CI on every rule) |
| Controls for multiple testing | No | Yes (Benjamini-Hochberg FDR) |
| Handles numeric / date / time attributes | No (strings only) | Yes (outcome-aware binning) |
| Plain-English narrative per driver | No | Yes |
Use Root Cause Analysis for a fast single-attribute scan, and AI Causal Analysis for any serious investigation - particularly when someone will act on the result.
How to Add the Calculator
- Open a notebook in mindzieStudio
- Click Add Calculator and select AI Causal Analysis (Alpha)
- Configure the outcome and input columns (see below)
- Click Create
Configuration
Title
The display name of the calculator. Defaults to AI Causal Analysis (Alpha) - change it to something specific to the question you are answering, for example Why are ICU stays long? or Drivers of Late Payment.
Description
Optional free-text notes. Useful for documenting the business question, the date range the analysis was run on, or the stakeholder who requested it.
Outcome Definition
The outcome is the group of cases you want to explain. The calculator compares these cases against the rest of the dataset and identifies which input columns best separate the two groups.
Three modes are available for defining the outcome:
Filter Mode
Select the Filter tab and add one or more filter expressions. The calculator treats cases that match the filter as the "outcome" group.
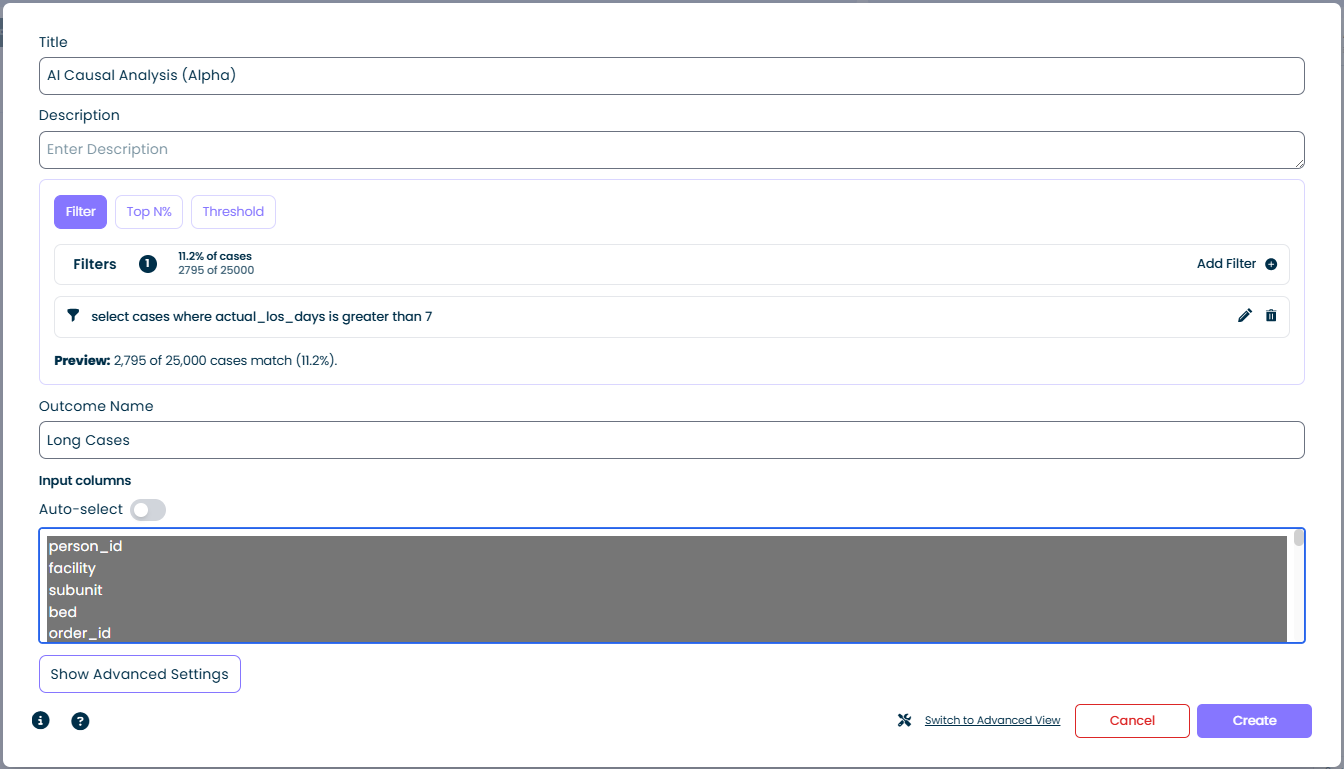
- Cases matching: shown as a percentage and raw count, for example
11.2% of cases / 2,795 of 25,000 - Add Filter: opens the standard filter builder - combine any number of conditions
- Preview: updates live as you build the filter so you can validate the selection before running the calculator
Filter mode is the most flexible option. Any condition you can express as a mindzie filter (duration thresholds, attribute matches, activity presence, and so on) can become an outcome. In the screenshot above, the filter select cases where actual_los_days is greater than 7 defines "Long Cases" as the outcome.
Top N% Mode
Select the Top N% tab to use the highest (or lowest) values of a numeric attribute as the outcome. This is useful when you want to explain "the worst cases" or "the top performers" without having to pick a hard threshold. Example: the top 10% of cases by cycle time.
Threshold Mode
Select the Threshold tab to define the outcome with a single numeric cutoff on an attribute. Any case above (or below) the value becomes part of the outcome group. Example: cases where invoice_amount exceeds 50,000.
Outcome Name
A short label that identifies the outcome group in the results, for example Long Cases, Late Payments, or SLA Breach. This name appears throughout the analysis output wherever the outcome group is referenced.
Input Columns
The columns the model is allowed to use when searching for drivers of the outcome.
- Column list: every case attribute in the dataset is shown. Select one or more to include them in the analysis. The columns are highlighted when selected.
- Auto-select toggle: when enabled, mindzie automatically picks a sensible default set of input columns based on the dataset schema. Turn this off when you want full manual control - for example to exclude a column that is trivially correlated with the outcome (such as an ID that leaks the answer).
Tips for choosing input columns:
- Exclude columns that are downstream of the outcome. If
discharge_dateis used to computeactual_los_days, it will dominate the results without adding insight. - Exclude high-cardinality identifiers (
person_id,order_id) unless you specifically want per-entity effects. - Include contextual attributes (facility, product category, priority, region) - these are usually where the interesting drivers live.
Show Advanced Settings
Opens additional tuning options for the search. The defaults work well for most analyses - only override them when you have a specific reason.
| Setting | Default | Purpose |
|---|---|---|
| Beam width | 50 | How many candidate rules are kept at each search depth. Higher = more exhaustive, slower. |
| Max rule depth | 3 | Longest rule allowed. 3 means rules of the form A AND B AND C. |
| Min cases per rule | 30 | Rules that would affect fewer than this many cases are discarded as too small to be actionable. |
| Min lift | 1.2 | The in-rule outcome rate must exceed the baseline by at least this factor (1.2 = at least 20% higher than baseline). |
| FDR alpha | 0.05 | Benjamini-Hochberg significance threshold for controlling false discoveries across the rule search. |
| Max drivers returned | 20 | Upper bound on the number of rules shown in the full-table view. |
| Redundancy Jaccard | 0.9 | Rules whose case sets overlap by more than this fraction are treated as duplicates and filtered. |
| Sampling threshold | 2,000,000 cases | Datasets above this size are deterministically sampled down using Floyd's combination algorithm. The output reports WasSampled = true and the actual sample size. |
Switch to Advanced View
Switches the editor to advanced mode for fine-grained control over every model parameter. The guided view shown here is sufficient for the large majority of use cases.
Typical Workflow
- Frame the question - decide what outcome you want to explain. "What makes cases slow?" becomes a Filter outcome of
case_duration > 7 days. - Define the outcome - use Filter, Top N%, or Threshold mode. Verify the Preview percentage looks sensible (too few cases will produce unstable results; too many means the outcome is not really distinctive).
- Name the outcome - pick a concise label that will read well in results and reports.
- Select input columns - start with Auto-select, then prune any columns that leak the answer or add noise.
- Create - run the calculator. The result surfaces the ranked drivers of the outcome.
- Interpret - review the top drivers, refine the outcome or input set if needed, and re-run.
Example
A hospital operations team wants to understand why some inpatient stays run longer than 7 days.
| Setting | Value |
|---|---|
| Title | AI Causal Analysis (Alpha) |
| Filter mode | select cases where actual_los_days is greater than 7 |
| Preview | 2,795 of 25,000 cases match (11.2%) |
| Outcome Name | Long Cases |
| Input columns | facility, subunit, bed, order_id, ... (auto-selected) |
After running, the calculator reports which combinations of facility, sub-unit, and care attributes most strongly distinguish long-stay cases from normal-stay cases. This points the team at specific units and workflows to investigate rather than leaving them to explore every attribute manually.
Interpreting the Results
For each top driver, the calculator produces a plain-English narrative paragraph and an evidence badge describing the strength of the finding:
| Badge | Meaning | How to act |
|---|---|---|
| Causal | Both the causal-graph signal and the confounder-adjusted effect are positive. | Strongest actionable evidence - safe to prioritise for intervention. |
| Likely Causal | The causal graph connects the rule to the outcome, but the effect weakens once we adjust for confounders. | Promising - investigate further before acting. |
| Associated | The effect survives adjustment, but the graph does not place the rule on a direct path to the outcome. | Real association, but likely indirect - may be a proxy for the true driver. |
| Correlational | There is an association but we cannot confirm a causal relationship. | Diagnostic signal only - do not act on it alone. |
Example narrative for a Causal rule:
Channel = Online is a likely driver of Non-First Contact Resolution. Cases matching this rule show a 46.1% outcome rate vs. the 29.0% baseline (1.59x, 95% CI 1.51x - 1.68x, p < 0.001). It covers 2,518 cases, accounting for 34.7% of all Non-First Contact Resolution occurrences. The effect survived adjustment for other top drivers and sits on a direct path to the outcome in the learned causal graph.
The Full Table view adds the complete ranked list with coverage, lift, confidence interval, adjusted effect, p-value, and badge for every rule that survived the search and the significance filter.
How the Algorithm Works
AI Causal Analysis runs a five-stage pipeline. Each stage has a specific job and is designed so the whole thing finishes in seconds even on million-case datasets.
1. Preparation and binning
- The calculator takes the cases in your outcome group and labels them
1; all others are labelled0. This is the baseline rate you see in the output. - Categorical attributes (strings, booleans, low-cardinality integers) are used directly. Each distinct value becomes a candidate literal (e.g.,
facility = Memorial). - Numeric and date/time attributes are binned with an MDL-optimal, outcome-aware binner. Instead of picking equal-width or equal-frequency bins, the binner chooses cut-points that best separate outcome from non-outcome cases, then uses the Minimum Description Length principle to pick the number of bins automatically. This turns a numeric column like
actual_los_daysinto a small set of meaningful buckets (e.g.,<= 3 days,4 - 7 days,> 7 days).
2. Bitmap indexing
Every literal is stored as a bitset - one bit per case, 1 if the case matches the literal. Combining literals with AND becomes a fast bitwise intersection:
facility = Memorial AND priority = Highis computed asbitset_A & bitset_B.- Coverage, outcome count, and lift for a candidate rule can be evaluated in microseconds regardless of rule depth.
Literals that cover fewer than Min cases per rule are dropped before the search begins.
3. Beam-search subgroup discovery
The calculator walks the space of rules breadth-first:
- Depth 1: evaluate every single literal. Score each one using a quality measure (lift and Weighted Relative Accuracy) and keep the top
Beam width(default 50). - Depth 2: extend every kept rule with every other compatible literal to form conjunctions like
A AND B. Score them all and keep the topBeam widthagain. - Depth 3: repeat one more time. Stop at
Max rule depth.
Rules that fall below Min lift or Min cases per rule are pruned at every level.
After the search, a Jaccard redundancy filter removes near-duplicate rules: if two rules cover essentially the same cases (overlap above Redundancy Jaccard, default 0.9), only the better one is kept.
4. Statistical significance
For each surviving rule the calculator computes:
- The risk ratio (in-rule outcome rate divided by baseline rate) and its 95% Wilson confidence interval, which is well-behaved for small and extreme probabilities where the normal approximation fails.
- A p-value under the null hypothesis that the rule has no effect.
- A Benjamini-Hochberg FDR correction across all tested rules.
FDR alpha(default 0.05) sets the expected false-discovery rate. Rules that do not survive FDR are not reported, which is what prevents the search from drowning you in spurious findings.
5. Causal adjudication
Significance alone still only tells you there is an association. Two extra signals decide whether a rule gets a Causal badge:
- Causal-graph signal - a lightweight Bayesian structural score learned from the attributes and the outcome. It asks: does this rule sit on a direct path to the outcome in the learned graph, or only on an indirect path through a confounder?
- Propensity-score adjustment - a ridge-regularised logistic regression models the probability that each case matches the rule, given all the other top drivers. The rule's effect is then re-estimated after weighting by that propensity. If the effect shrinks to zero, the rule was just a proxy for other drivers; if it persists, it has independent explanatory power.
The adjudicator combines both signals into the four evidence badges defined above.
6. Narrative generation
The final step composes the plain-English paragraph shown in the card view. It weaves together the rule definition, the in-rule and baseline outcome rates, the risk ratio and confidence interval, the p-value, the coverage, and the evidence badge into a sentence structure tuned to read naturally to a non-statistical reader.
Performance
Measured on a development machine:
| Dataset | Time |
|---|---|
| 100,000 cases x 4 columns | under 1 second |
| 200,000 cases x 20 columns | under 2 seconds |
| 1,000,000 cases x 50 columns | around 3 seconds |
Datasets above the sampling threshold (default 2,000,000 cases) are deterministically sampled using Floyd's combination algorithm. When this happens the output flags WasSampled = true and reports the actual sample size so the result is reproducible and the sampling is visible.
Known Limitations (v1)
- Binary outcomes only. Multi-class outcomes (fast / medium / slow, for example) are not supported in this release. Define two-way splits as separate analyses.
- No per-case explanations yet. v1 answers "what drives this outcome across the dataset?" A future release will add "why did this specific case go wrong?" panels.
- No temporal drift analysis. If the drivers change between quarters, v1 will not split them over time. Run the calculator separately on each time slice when that matters.
- Numeric binning is outcome-aware. If you want fixed, human-chosen bins, pre-bucket the column with an enrichment before running the calculator.
Use Cases
Performance Drivers
Identify the attributes most associated with cases that breach SLA, exceed budget, or run past their expected duration. Works well with a Filter outcome built on a duration or KPI enrichment.
Outcome Analysis
Compare successful cases against failed or cancelled ones. Use a Filter outcome on a status or outcome attribute to see which upstream attributes predict each outcome.
Risk and Compliance
Point the calculator at cases flagged by a conformance or control enrichment to learn which contextual factors correlate with compliance failures.
Top-Performer Analysis
Use Top N% mode to explain what makes your best cases, teams, or customers different from the rest. Feed the insights back into process design or training.
Tips
- Start simple. A well-chosen Filter with two or three conditions plus auto-selected inputs usually produces the clearest results.
- Watch the preview percentage. If the outcome group is less than ~2% or more than ~50% of the dataset, the analysis becomes harder to interpret. Adjust the filter until the group is a meaningful minority.
- Iterate on input columns. Remove columns whose presence dominates results without insight (IDs, timestamps that leak the outcome), then re-run.
- Name outcomes specifically.
Long CasesbeatsOutcome 1when you share results with stakeholders or compose them into reports. - Pair with the Decision Tree calculator for a second view on the same question. Decision Tree shows the branching structure; AI Causal Analysis ranks overall feature impact.
Related Calculators
- Decision Tree - complementary view showing how attributes split cases into outcome groups
- Root Cause Analysis - deterministic statistical root-cause discovery for KPI deviations
- Case Outcome By Category - compare outcome rates across a chosen categorical attribute
Related Features
- AI Studio (Alpha) - the broader predictive analytics workspace, including Feature Impact and Root Cause
- Alpha Features Overview - full list of features in the mindzie Alpha Program
Providing Feedback
AI Causal Analysis is an Alpha feature and your input directly shapes how it evolves:
- Email: support@mindzie.com
- Subject: Include
Alpha Feedback: AI Causal Analysis - Include: the outcome definition you used, the input columns, what you expected, and what you got