Analysis Architecture
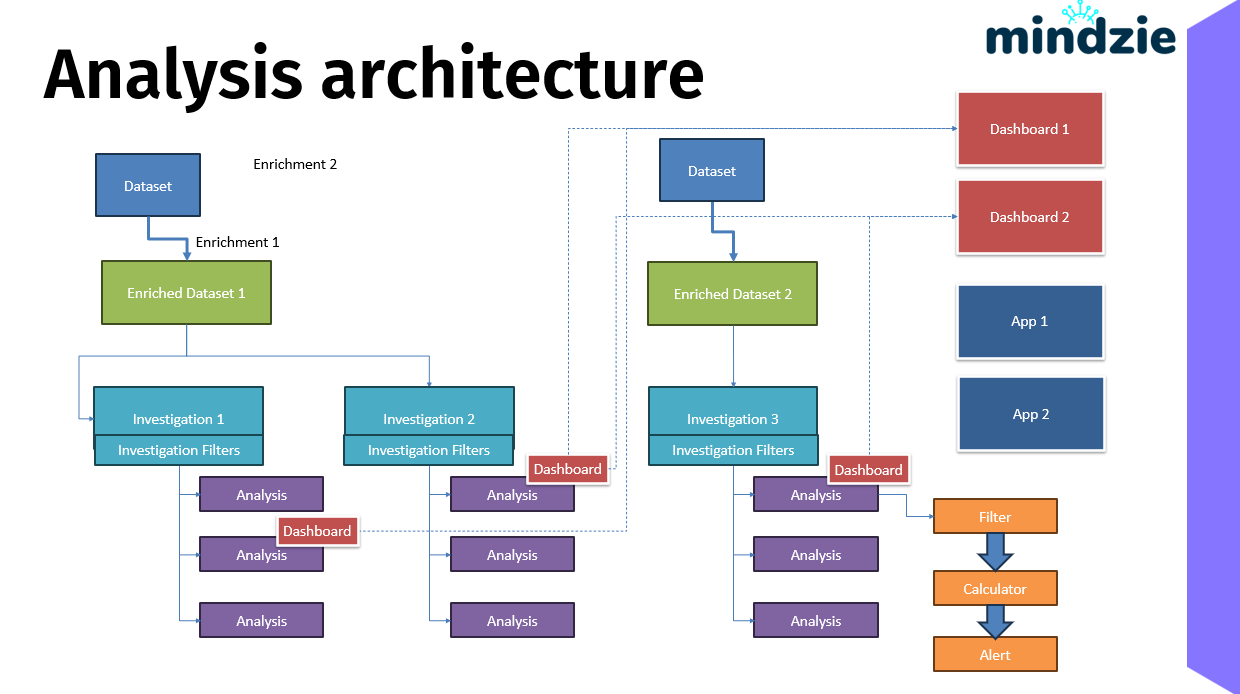
The analysis architecture shows how mindzieStudio transforms your raw process data into actionable insights through a layered approach. Understanding this architecture helps you design effective analysis workflows and make the most of the platform's capabilities.
Overview
The analysis architecture follows a data transformation pipeline that moves from raw event logs through enrichment and analysis to visual dashboards. At each stage, you have powerful tools to refine, analyze, and present your process data.
Dataset
Your Dataset is the starting point for all analysis. A dataset contains your raw event log data - the digital footprint of your business process.
Every dataset includes:
- Case ID: A unique identifier for each process instance (e.g., order number, ticket ID)
- Activity: The name of each step in your process (e.g., "Create Order", "Approve Request")
- Timestamp: When each activity occurred
- Additional Attributes: Any other data columns relevant to your process (e.g., user, department, value)
Datasets can be uploaded directly as CSV, Excel, or Parquet files, or imported through mindzie Data Designer from your source systems.
Enrichment
Enrichments transform and enhance your raw data. Think of enrichment as a preparation stage where you clean, calculate, and add business context to your data before analysis.
Enrichments can:
- Clean and normalize your data
- Calculate new attributes (e.g., case duration, activity counts)
- Apply business rules and categorizations
- Add conformance flags (e.g., "process followed expected order")
- Remove unwanted events or cases
Multiple enrichments can be chained together, with the output of one enrichment serving as the input to the next. This allows you to build sophisticated data preparation pipelines.
Enriched Dataset
An Enriched Dataset is the output of an enrichment process. It contains all your original data plus any new attributes, calculations, or transformations you defined.
Enriched datasets are stored separately from your original data, so you can always return to the source. You can create multiple enriched datasets from the same source, each optimized for different analysis needs.
Investigation
An Investigation is your analysis workspace where you explore a dataset in depth. Each investigation is linked to either a raw or enriched dataset.
Investigations include:
- Investigation Filters: Global filters that apply to all analysis within the investigation, allowing you to focus on specific scenarios (e.g., "only completed cases" or "only cases from Q4")
- Analysis Notebooks: Multiple notebooks can exist within a single investigation, each answering different questions about your process
Think of an investigation as a project folder that organizes all your analysis work for a particular dataset.
Analysis Notebooks
Analysis Notebooks are ordered collections of analysis blocks. Each notebook represents a logical sequence of analysis steps that together answer specific questions about your process.
For example, a notebook might:
- Filter to a specific case type
- Calculate key metrics
- Identify outliers
- Generate visualizations
You can create multiple notebooks within an investigation, each focusing on different aspects of your process.
Blocks: Filter, Calculator, and Alert
Blocks are the building blocks of analysis. There are three types of blocks that work together:
Filters
Filters select which cases or events to include in your analysis. They help you focus on the specific subset of data relevant to your question. Examples include:
- Cases that started in a specific time period
- Cases where a particular activity occurred
- Cases with duration above a threshold
Calculators
Calculators compute metrics, generate visualizations, and produce statistics. They turn your filtered data into insights. Examples include:
- Process maps showing activity flow
- Case duration histograms
- Trend analysis over time
- Root cause analysis
Alerts
Alerts monitor your process data and notify you when conditions are met. They enable continuous monitoring of your processes. Examples include:
- Alert when case volume exceeds threshold
- Alert when average duration increases significantly
- Alert when conformance rate drops
The typical flow in an analysis notebook is: Filter (select data) -> Calculator (compute insights) -> Alert (monitor conditions).
Dashboards
Dashboards present your analysis results to stakeholders. A dashboard pulls visualizations from multiple analysis blocks across different notebooks into a single, unified view.
Dashboards feature:
- Grid-based layout for flexible arrangement
- Multiple panels showing different metrics
- Real-time data when connected to refreshed datasets
- Shareable views for collaboration
You can create multiple dashboards from the same investigation, each tailored to different audiences (e.g., executive summary vs. operational detail).
Apps
Apps are external applications that consume your analysis results for operational use. They extend the reach of your process insights beyond the mindzieStudio interface.
Apps enable:
- Embedding dashboards in other systems
- Operational tools built on process insights
- Integration with business applications
Summary
The analysis architecture provides a structured approach to process intelligence:
- Load your data into a Dataset
- Prepare it through Enrichments to create Enriched Datasets
- Analyze within Investigations using Notebooks and Blocks
- Present results through Dashboards and Apps
Each layer builds on the previous, allowing you to progressively refine your understanding of your business processes.