# mindzie Documentation - Complete Corpus
> Complete documentation for the mindzie platform. Includes mindzieStudio, mindzieDataDesigner, BPM Studio, and mindzieAPI in a single file.
Generated dynamically from the current documentation set.
# Product: mindzieStudio
---
## Overview
Section: Filters
URL: https://docs.mindziestudio.com/mindzie_studio/filters/overview
Source: /docs-master/mindzieStudio/filters/overview/page.md
# Filters
Filters
Filters allow you to control which cases and events are included in your analysis.
Choose from various filter types to focus on specific aspects of your process data.
There are 37 filters available for you to choose from. Browse them all below.
★
Recommended Filters
These filters are most frequently used by our users and provide the greatest value for process analysis.
Start here for the most effective filtering of your process data.
---
## Activity Frequency
Section: Filters
URL: https://docs.mindziestudio.com/mindzie_studio/filters/activity-frequency
Source: /docs-master/mindzieStudio/filters/activity-frequency/page.md
# Activity Frequency
## Overview
The Activity Frequency filter removes activities that appear too rarely or too frequently across your process cases. Unlike case-level filters that remove entire cases, this event-level filter analyzes how often each activity appears across all cases and removes individual events for activities that fall outside your specified frequency range. This helps you focus on activities that matter most by removing noise from rare exceptions or filtering out overly common activities that don't provide analytical value.
The filter calculates the percentage of cases that contain each activity, then removes all events for activities whose frequency falls outside the minimum and maximum thresholds you specify. This is particularly useful for simplifying process maps, focusing analysis on meaningful activities, and removing data quality issues caused by rare or unusual events.
## Common Uses
- **Process Simplification**: Remove very rare activities that clutter process maps and make analysis difficult.
- **Noise Reduction**: Filter out exceptional activities that appear in less than 5% of cases to focus on standard process flows.
- **Core Process Analysis**: Analyze only the most common activities by filtering to activities that appear in 80% or more of cases.
- **Middle-Range Focus**: Examine activities with moderate frequency (e.g., 20-80%) to identify optional steps or exceptions.
- **Data Quality Assessment**: Identify and remove activities with unusual frequency patterns that may indicate data quality issues.
- **Process Map Clarity**: Create cleaner process maps by removing both very rare and very common activities that don't add analytical value.
## Settings
**Minimum Percent**: The minimum percentage of cases (0.0 to 1.0) an activity must appear in to be included. Activities appearing in fewer cases will be filtered out. For example, 0.2 means the activity must appear in at least 20% of cases.
**Maximum Percent**: The maximum percentage of cases (0.0 to 1.0) an activity can appear in to be included. Activities appearing in more cases will be filtered out. For example, 0.8 means the activity must appear in no more than 80% of cases.
> **Note**: The filter uses inclusive range checking, so activities with frequencies exactly equal to the minimum or maximum percentages will be included. Both minimum and maximum must be values between 0.0 (0%) and 1.0 (100%).
## Examples
### Example 1: Removing Rare Exception Activities
**Scenario**: Your purchase order process contains many rare exception activities that clutter your process map. You want to focus on standard activities that appear in at least 10% of cases.
**Settings**:
- Minimum Percent: 0.1
- Maximum Percent: 1.0
**Result**: All activities that appear in fewer than 10% of cases are removed. For example, if "Emergency Approval" only appears in 5% of cases, all events with that activity are filtered out.
**Insights**: This creates a cleaner view of your standard process flow by removing rare exceptions like emergency procedures, special escalations, or unusual corrections. You can then analyze these exceptional cases separately if needed.
### Example 2: Focusing on Core Process Activities
**Scenario**: You want to analyze only the core activities that occur in nearly all cases, filtering out optional or conditional steps.
**Settings**:
- Minimum Percent: 0.8
- Maximum Percent: 1.0
**Result**: Only activities that appear in 80% or more of cases are retained. Activities like "Create Order" (100% of cases), "Approve Order" (95% of cases), and "Ship Order" (85% of cases) are kept, while optional activities like "Apply Discount" (40% of cases) are removed.
**Insights**: This reveals your mandatory process steps and standard path, helping you understand the core workflow that most cases follow. Deviations from this core can be analyzed separately.
### Example 3: Analyzing Mid-Frequency Activities
**Scenario**: You want to focus on activities that appear in a moderate number of cases (20-80%) to understand optional process steps and common variations.
**Settings**:
- Minimum Percent: 0.2
- Maximum Percent: 0.8
**Result**: Very rare activities (under 20%) and very common activities (over 80%) are removed, leaving only mid-frequency activities.
**Insights**: This helps identify:
- Optional process steps that are frequently but not universally used
- Common process variations that occur in a substantial minority of cases
- Activities that may be candidates for standardization or removal
- Process branches that serve specific customer segments or product types
### Example 4: Removing Ubiquitous Activities
**Scenario**: Your process has some administrative activities that appear in nearly every case but don't provide analytical insights. You want to remove activities that appear in more than 95% of cases.
**Settings**:
- Minimum Percent: 0.0
- Maximum Percent: 0.95
**Result**: Activities that appear in more than 95% of cases are removed. For example, if "System Log Entry" appears in 99% of cases, all those events are filtered out.
**Insights**: This removes activities that occur so frequently they don't help differentiate between cases or process paths. It helps focus on activities that actually indicate process variations or decisions.
### Example 5: Finding Activities at Specific Frequency
**Scenario**: You want to analyze only activities that appear in exactly 50% of cases (plus or minus a small margin) to understand process branching points.
**Settings**:
- Minimum Percent: 0.45
- Maximum Percent: 0.55
**Result**: Only activities that appear in 45-55% of cases are retained. These often represent decision points where the process splits into two roughly equal paths.
**Insights**: These activities typically indicate:
- Binary process decisions (approved/rejected, domestic/international)
- Optional features chosen by approximately half of customers
- Seasonal variations that affect half the year's cases
- Process changes that were implemented mid-period
### Example 6: Comprehensive Noise Reduction
**Scenario**: You want to remove both very rare exceptions (under 5%) and very common administrative activities (over 90%) to focus on meaningful process activities.
**Settings**:
- Minimum Percent: 0.05
- Maximum Percent: 0.9
**Result**: The filter removes rare exception activities and ubiquitous administrative activities, leaving activities that appear in 5-90% of cases.
**Insights**: This creates a balanced view that:
- Excludes rare data quality issues and exceptional cases
- Removes administrative overhead activities
- Retains all meaningful business process activities
- Provides a clear picture for process optimization analysis
## Output
The filter returns a new dataset containing only events for activities whose frequency falls within the specified range. Cases may have fewer events after filtering, but no entire cases are removed unless all their activities fall outside the frequency range.
If you set Minimum Percent to 0.0 and Maximum Percent to 1.0, no filtering occurs and all activities are retained.
The output preserves all event attributes and timestamps for the retained events, maintaining temporal and contextual information for the filtered process data.
## Technical Notes
- **Filter Type**: Event-level filter (removes individual events, which affects cases)
- **Frequency Calculation**: Counts the number of cases containing each activity, not the number of times the activity occurs
- **Performance**: Analyzes all activities and cases, then filters events based on frequency calculation
- **Empty Cases**: Cases may become empty if all their activities are filtered out
- **Percentage Format**: Uses decimal format (0.0 to 1.0) rather than percentage format (0 to 100)
---
*This documentation is part of the mindzieStudio process mining platform.*
---
## Activity More Than
Section: Filters
URL: https://docs.mindziestudio.com/mindzie_studio/filters/activity-more-than
Source: /docs-master/mindzieStudio/filters/activity-more-than/page.md
# Activity More Than
## Overview
The Activity More Than filter selects cases based on how many times a specific activity was performed. This frequency-based case-level filter identifies cases where a particular activity occurred more than a specified number of times, making it ideal for detecting repetitive work patterns, rework loops, or unusual process behaviors.
## Common Uses
- Identify cases with excessive rework or repeated activities
- Find cases where approval loops occurred multiple times
- Detect unusual process patterns with repeated steps
- Analyze cases with multiple review cycles
- Filter for cases requiring repeated customer contacts
- Identify potential process inefficiencies through activity repetition
## Settings
**Activity Value:** Select the activity name to count occurrences of. The dropdown displays all unique activities in your data along with their frequency counts and percentages.
**More Than Count:** Specify the threshold count. The filter returns cases where the selected activity occurred MORE than this number of times. For example, setting this to 1 returns cases where the activity happened 2 or more times.
**Remove Selected Cases:** When enabled, inverts the filter logic to exclude matching cases instead of including them.
## Examples
### Example 1: Finding Rework Cases
**Scenario:** You want to identify cases where the "Review" activity was performed more than once, indicating potential rework or quality issues.
**Settings:**
- Activity Value: "Review"
- More Than Count: 1
- Remove Selected Cases: Unchecked
**Result:**
Cases where "Review" occurred 2 or more times are included. Case #1001 with 3 review activities is included. Case #1002 with 1 review activity is excluded. Case #1003 with 5 review activities is included.
**Insights:** This reveals which cases required multiple review cycles, often indicating quality issues, incomplete submissions, or process bottlenecks. You can analyze what causes cases to need repeated reviews.
### Example 2: Multiple Customer Contacts
**Scenario:** Your customer service process should ideally resolve issues in a single contact. You want to find cases where "Customer Contact" happened more than twice, indicating escalations or unresolved issues.
**Settings:**
- Activity Value: "Customer Contact"
- More Than Count: 2
- Remove Selected Cases: Unchecked
**Result:**
Cases with 3 or more customer contacts are included. This might represent 15% of all cases but consume 40% of customer service resources. These cases warrant investigation for root cause analysis.
**Insights:** Multiple contacts often indicate first-contact resolution failures. Analyzing these cases can reveal training gaps, system issues, or complex case types requiring specialized handling.
### Example 3: Excluding Normal Repetition
**Scenario:** In your manufacturing process, a "Quality Check" activity legitimately occurs at multiple stages. You want to EXCLUDE cases with many quality checks to focus on cases that bypassed normal quality procedures.
**Settings:**
- Activity Value: "Quality Check"
- More Than Count: 2
- Remove Selected Cases: Checked
**Result:**
Cases with 3 or more quality checks are removed. The remaining cases (with 0-2 quality checks) may indicate shortcuts or bypassed quality gates. Case #5001 with 4 quality checks is excluded (normal process). Case #5002 with 1 quality check is kept for investigation.
**Insights:** By inverting the filter, you identify cases that may have bypassed standard quality procedures, potentially leading to quality issues downstream.
### Example 4: Approval Loop Detection
**Scenario:** Your purchase order process should have one approval per level. You want to find cases where "Manager Approval" occurred more than once, indicating rejected and resubmitted requests.
**Settings:**
- Activity Value: "Manager Approval"
- More Than Count: 1
- Remove Selected Cases: Unchecked
**Result:**
Cases requiring multiple manager approvals are identified. Case #7001 with 2 manager approvals had its first request rejected. Case #7002 with 4 manager approvals went through multiple revision cycles.
**Insights:** Multiple approvals often indicate unclear requirements, budget issues, or communication gaps between requesters and approvers. These cases typically have longer cycle times and higher costs.
### Example 5: Threshold-Based Analysis
**Scenario:** You want to identify extreme cases where any activity occurred more than 10 times, regardless of what activity it is. You'll run this filter multiple times with different activities.
**Settings:**
- Activity Value: "Data Entry"
- More Than Count: 10
- Remove Selected Cases: Unchecked
**Result:**
Cases where "Data Entry" happened more than 10 times are flagged as potential data quality issues or system problems. These outlier cases may represent training needs, system errors, or exceptionally complex transactions.
**Insights:** High activity counts can indicate process problems, training issues, or genuinely complex cases requiring special handling procedures.
## Output
This filter operates at the case level based on activity occurrence counts:
- Counts occurrences of the specified activity within each case
- Compares the count against the threshold using greater-than logic
- When "Remove Selected Cases" is unchecked: Returns cases where activity count > threshold
- When "Remove Selected Cases" is checked: Returns cases where activity count <= threshold
- Preserves all case and event attributes for included cases
- Setting threshold to 0 returns cases containing the activity at least once
Use this filter to identify process behaviors based on activity repetition patterns, particularly useful for rework analysis, loop detection, and identifying unusual cases requiring investigation.
---
*This documentation is part of the mindzie Studio process mining platform.*
---
## Activity Not Performed
Section: Filters
URL: https://docs.mindziestudio.com/mindzie_studio/filters/activity-not-performed
Source: /docs-master/mindzieStudio/filters/activity-not-performed/page.md
# Activity Not Performed Filter
## Overview
The Activity Not Performed filter selects cases where a specified activity was never executed. This case-level filter examines each case's complete activity sequence and returns only those cases that do not contain any events with the specified activity name. The filter is particularly useful for identifying process deviations, missing mandatory steps, or cases that followed alternative paths through the process.
## Common Uses
- **Quality Control**: Find cases that skipped review or approval activities to identify quality issues.
- **Compliance Checking**: Identify cases missing mandatory regulatory or compliance activities.
- **Exception Analysis**: Discover cases that never went through error handling or escalation activities.
- **Process Completeness**: Detect cases missing critical process steps like payment verification or delivery confirmation.
- **Variant Analysis**: Understand which cases followed alternative process paths by identifying missing standard activities.
- **Bottleneck Investigation**: Find cases that bypassed certain activities, potentially indicating workarounds or shortcuts.
## Settings
**Activity Value**: Select the activity name you want to check for absence. In the dropdown menu, you will see available activity names along with the percentage and number of cases they appeared in. The filter will return all cases where the selected activity was never performed.
> **Note**: The activity name comparison is case-sensitive and requires an exact match. If you misspell an activity name, the filter's validation system will suggest the closest matching activity.
## Examples
### Example 1: Finding Cases Without Payment
**Scenario**: You want to identify all purchase orders where the invoice was never paid, which could indicate outstanding receivables or payment issues.
**Settings**:
- Activity Value: "Pay Invoice"
**Result**: The filter removes all cases that contain the "Pay Invoice" activity, leaving only cases where payment never occurred.
**Insights**: This helps identify unpaid invoices that may require follow-up, collection efforts, or investigation into why payment was skipped.
### Example 2: Identifying Cases Without Approval
**Scenario**: You need to find all cases that proceeded without going through the approval process, which could indicate compliance violations or process gaps.
**Settings**:
- Activity Value: "Approve Request"
**Result**: The filter returns only cases that never had an "Approve Request" activity.
**Insights**: These cases may represent:
- Auto-approved low-value transactions
- Process violations where approval was skipped
- System errors that bypassed approval workflows
- Emergency expedited processing
### Example 3: Detecting Missing Quality Checks
**Scenario**: You want to find manufacturing cases that skipped the quality inspection step.
**Settings**:
- Activity Value: "Quality Inspection"
**Result**: The filter selects cases without any "Quality Inspection" events.
**Insights**: This can reveal:
- Products that may have quality issues
- Process shortcuts that could lead to defects
- Cases that need retrospective quality review
- Patterns in when inspections are skipped
### Example 4: Finding Incomplete Order Processing
**Scenario**: Identify orders where the delivery activity was never performed, indicating potential fulfillment issues.
**Settings**:
- Activity Value: "Deliver Order"
**Result**: The filter returns cases where "Deliver Order" never occurred.
**Insights**: These cases might indicate:
- Cancelled orders
- Orders stuck in processing
- Fulfillment failures requiring investigation
- Backorders or out-of-stock situations
## Output
The filter returns a new dataset containing only the cases where the specified activity was not performed. Each returned case preserves all its original events and attributes, but the specified activity will not appear in any of those cases.
If no cases match the criteria (meaning all cases contain the specified activity), the filter returns an empty result set.
## Technical Notes
- **Filter Type**: Case-level filter (removes entire cases, not individual events)
- **Performance**: Efficiently implemented with early termination logic
- **Activity Matching**: Uses exact, case-sensitive string matching
- **Null Handling**: Can find cases without null activities if ActivityValue is set to null
- **Validation**: Automatically suggests similar activity names if the specified activity is not found
---
*This documentation is part of the mindzieStudio process mining platform.*
---
## Activity Performed Once
Section: Filters
URL: https://docs.mindziestudio.com/mindzie_studio/filters/activity-performed-once
Source: /docs-master/mindzieStudio/filters/activity-performed-once/page.md
# Activity Performed Once
## Overview
The Activity Performed Once filter selects cases where a specified activity was executed exactly one time. This case-level filter examines each case's complete activity sequence and returns only those cases where the selected activity appears exactly once - not zero times, and not more than once. The filter is particularly useful for identifying cases that followed standard single-occurrence patterns, detecting anomalies where activities were repeated or skipped, and ensuring process compliance.
## Common Uses
- **Process Compliance**: Verify that critical one-time activities (like contract signing or initial approval) occur exactly once per case.
- **Quality Control**: Identify cases where unique activities are performed the expected single time, indicating proper process execution.
- **Exception Detection**: Find cases with unique activity patterns that differ from processes where activities are typically repeated or absent.
- **Data Validation**: Ensure that certain activities like case initiation or final closure are not duplicated or missing within cases.
- **Workflow Analysis**: Understand which cases follow expected single-occurrence patterns for specific process steps.
- **Audit Requirements**: Confirm that auditable events like final sign-off or completion certification happen exactly once.
## Settings
**Activity Value**: Select the activity name you want to check for single occurrence. In the dropdown menu, you will see available activity names along with frequency statistics. The filter will return all cases where the selected activity was performed exactly once.
> **Note**: The activity name comparison uses exact string matching. If you misspell an activity name, the filter's validation system will suggest the closest matching activity.
## Examples
### Example 1: Finding Properly Signed Contracts
**Scenario**: You want to identify all contract cases where the signature activity occurred exactly once, indicating proper execution without duplicates or omissions.
**Settings**:
- Activity Value: "Sign Contract"
**Result**: The filter returns only cases that contain exactly one "Sign Contract" activity. Cases with zero signatures or multiple signatures are excluded.
**Insights**: This helps identify properly executed contracts. Cases excluded by this filter may indicate process problems:
- Zero signatures suggest incomplete contracts requiring follow-up
- Multiple signatures could indicate rework or data quality issues
### Example 2: Validating Single Approval Steps
**Scenario**: You need to find cases where the final approval was granted exactly once, ensuring no duplicate approvals or missing approvals occurred.
**Settings**:
- Activity Value: "Final Approval"
**Result**: The filter selects only cases with a single "Final Approval" event.
**Insights**: These cases represent standard process flow. This analysis helps:
- Confirm proper approval workflow execution
- Identify cases requiring investigation (filtered out due to 0 or 2+ approvals)
- Validate that approval controls are functioning correctly
- Detect potential approval bypass or duplicate approval issues
### Example 3: Detecting Single Quality Inspections
**Scenario**: You want to find manufacturing cases where quality inspection was performed exactly once, as required by standard procedures.
**Settings**:
- Activity Value: "Quality Inspection"
**Result**: The filter returns cases with exactly one "Quality Inspection" event.
**Insights**: This reveals:
- Cases following standard quality procedures
- Compliance with single-inspection requirements
- Proper resource allocation (inspections not repeated unnecessarily)
- Cases excluded may need attention (no inspection or multiple re-inspections)
### Example 4: Verifying Unique Order Creation
**Scenario**: Identify orders where the order creation activity occurred exactly once, indicating clean order entry without duplicates or missing creation events.
**Settings**:
- Activity Value: "Create Order"
**Result**: The filter selects cases where "Create Order" appears exactly once.
**Insights**: These cases indicate:
- Proper order initiation process
- No duplicate order creation errors
- Clean data entry practices
- Cases filtered out may indicate system errors or data quality problems
## Output
The filter returns a new dataset containing only the cases where the specified activity was performed exactly once. Each returned case preserves all its original events and attributes.
Cases are excluded if:
- The specified activity never occurred (zero occurrences)
- The specified activity occurred more than once (two or more occurrences)
If no cases match the criteria, the filter returns an empty result set.
## Technical Notes
- **Filter Type**: Case-level filter (removes entire cases, not individual events)
- **Performance**: O(n*m) time complexity where n is number of cases and m is average events per case
- **Activity Matching**: Uses exact string matching for activity comparison
- **Null Handling**: Empty or null activity values in events are not counted
- **Validation**: Automatically suggests similar activity names if the specified activity is not found in the dataset
---
*This documentation is part of the mindzieStudio process mining platform.*
---
## Case End
Section: Filters
URL: https://docs.mindziestudio.com/mindzie_studio/filters/case-end
Source: /docs-master/mindzieStudio/filters/case-end/page.md
# Case End
## Overview
The Case End filter selects or removes cases based on the value of a specified attribute in the last event of each case. This filter examines what activity, resource, status, or other attribute value appears in the final event of a case, allowing you to identify cases that ended in a particular way.
## Common Uses
- Identify cases that ended with activities they should not have (e.g., cases ending with "Cancelled" instead of "Completed")
- Select cases that ended with specific purchase order statuses (e.g., "Back Ordered", "Cancelled", or "On Hold")
- Find cases where a particular resource performed the final activity
- Analyze cases that ended with specific approval states or quality check results
- Filter cases based on final customer interaction type or final payment status
- Investigate cases that concluded with error or exception activities
## Settings
**Event Column**: Select the event attribute you want to examine in the last event of each case. This can be any event-level column such as Activity Name, Resource, Status, Department, or any custom event attribute in your log.
**Column Values**: Choose one or more values from the selected column. Cases where the last event contains any of these values will be selected. The filter shows the percentage of cases that end with each value to help you understand the data distribution.
**Remove Selected Cases**: When checked, the filter inverts its behavior - cases that match the criteria are removed instead of kept. Use this when you want to exclude cases that ended with specific values.
## Examples
### Example 1: Select Cases Ending with Incomplete Activities
**Scenario**: A procurement process should always end with "Clear Invoice" activity. You want to find cases that ended with any other activity to identify incomplete processes.
**Settings**:
- Event Column: Activity Name
- Column Values: Clear Invoice
- Remove Selected Cases: Checked (to exclude cases ending with Clear Invoice)
**Result**: The filter removes 99.9% of cases that properly ended with "Clear Invoice" and keeps only the 1 case that ended with a different activity.
**Insights**: This reveals process deviations where cases did not complete the expected final step, indicating potential process quality issues or incomplete workflows.
### Example 2: Find Cases Ending with Specific Resources
**Scenario**: You want to analyze cases where either Resource 48 or Resource 17 performed the final activity to understand their workload patterns or identify bottlenecks.
**Settings**:
- Event Column: Resource
- Column Values: Resource 48, Resource 17
- Remove Selected Cases: Unchecked
**Result**: The filter selects only cases where the last activity was performed by either Resource 48 or Resource 17.
**Insights**: This helps identify which cases these specific resources are responsible for completing, useful for workload analysis, quality control, or understanding resource specialization in your process.
### Example 3: Analyze Cases with Back Order Status
**Scenario**: In a purchase order process, you want to identify cases that ended with a "Back Ordered" status to understand supply chain issues.
**Settings**:
- Event Column: Order Status
- Column Values: Back Ordered
- Remove Selected Cases: Unchecked
**Result**: The filter selects all cases where the final status was "Back Ordered".
**Insights**: This reveals potential supply chain problems and allows you to analyze common characteristics of back-ordered cases, such as specific vendors, products, or time periods where back orders are more common.
### Example 4: Exclude Cancelled Cases
**Scenario**: You want to analyze only successfully completed cases by removing those that ended with "Cancelled" or "Rejected" statuses.
**Settings**:
- Event Column: Case Status
- Column Values: Cancelled, Rejected
- Remove Selected Cases: Checked
**Result**: The filter removes all cases that ended with "Cancelled" or "Rejected" statuses, leaving only cases that reached other conclusion states.
**Insights**: This creates a clean dataset for analyzing successful process execution patterns without the noise of cancelled or rejected cases.
## Output
The filter operates at the case level, meaning it removes or keeps entire cases based on the criteria. After applying the filter:
- Cases where the last event matches any of the selected values will be kept (or removed if "Remove Selected Cases" is checked)
- All other cases will be removed (or kept if "Remove Selected Cases" is checked)
- The percentage of cases removed and kept is displayed in the filter output
- Subsequent analysis will only include the filtered cases
**Important Notes**:
- The filter examines only the final event in each case, not all events
- Multiple values can be selected, and cases matching any of the values will be included
- The filter treats values as exact matches - they must match precisely
- Null or empty values in the selected column are ignored and will not match any criteria
---
*This documentation is part of the mindzie Studio process mining platform.*
---
## Case Start
Section: Filters
URL: https://docs.mindziestudio.com/mindzie_studio/filters/case-start
Source: /docs-master/mindzieStudio/filters/case-start/page.md
# Case Start
## Overview
The Case Start filter selects or removes cases based on the value of a specified attribute in the first event of each case. This filter examines the starting point of each case and matches against one or more specific values you define.
This is a case-level filter, which means it evaluates entire cases and either keeps or removes them based on how each case begins. It's particularly useful when you need to analyze processes that started in a particular way, or exclude cases that began with specific conditions.
## Common Uses
- **Analyze cases by initial activity**: Select cases that started with specific activities, such as "Order Received" or "Request Submitted", to understand process variations based on how cases begin.
- **Filter by entry point resource**: Identify cases that were initiated by particular teams, departments, or individuals to analyze performance patterns and workload distribution at the process entry point.
- **Focus on specific order types**: Select cases that began with particular order types, customer segments, or priority levels to perform targeted analysis on specific business scenarios.
- **Exclude problematic starts**: Remove cases that started with known problematic activities or conditions, allowing you to focus your analysis on normally-initiated cases.
- **Compare different process entry points**: Analyze how cases that start with different activities behave differently throughout the process lifecycle.
- **Identify entry channel patterns**: Select cases by their initial channel (web, phone, email, in-person) to compare customer journey patterns across different origination points.
## Settings
**Activity Attribute**: Select the event attribute to examine in the first event of each case. Common choices include Activity Name, Resource, or any custom event attribute that exists in your event log. This determines what aspect of the starting event you want to match against.
**Attribute Values**: Choose one or more specific values from the selected attribute that should match the first event. Cases that begin with any of these values will be selected (or removed if the Remove option is enabled). The dropdown shows available values along with their frequency as starting events.
**Remove Selected Cases**: Check this box to invert the filter behavior. When enabled, cases that match your criteria will be removed instead of kept, allowing you to focus on cases that did NOT start with the specified values.
## Examples
### Example 1: Cases Starting with Specific Activity
**Scenario**: You want to analyze only those purchase order cases that started with the activity "Order Received" to understand the standard process flow, excluding cases that began differently (such as expedited orders or returns).
**Settings**:
- Activity Attribute: Activity Name
- Attribute Values: Order Received
- Remove Selected Cases: Unchecked
**Result**: The filter keeps only cases where the first event has Activity Name = "Order Received". If you had 10,000 total cases and 8,500 started with "Order Received", you would now have 8,500 cases (85% of your original data).
**Insights**: By focusing on standard-entry cases, you can analyze the typical process flow without the complexity introduced by alternative starting points. This is useful for establishing baseline performance metrics and identifying the most common process variant.
### Example 2: Excluding Cases by Starting Resource
**Scenario**: You've discovered that cases started by a specific automated system (Resource: "AutoImport_Bot") have incomplete data in early stages. You want to remove these cases to focus on manually-initiated cases that have complete information.
**Settings**:
- Activity Attribute: Resource
- Attribute Values: AutoImport_Bot
- Remove Selected Cases: Checked
**Result**: All cases that started with the resource "AutoImport_Bot" are removed from your analysis. If 1,200 of your 10,000 cases (12%) were started by this bot, you now have 8,800 cases remaining.
**Insights**: By removing the auto-imported cases, you ensure your analysis focuses on cases with complete early-stage data. This prevents skewed metrics caused by incomplete or differently-structured automated entries and provides more accurate insights into the human-initiated process flow.
### Example 3: Multiple Starting Activities
**Scenario**: Your customer service process has three valid entry points: "Phone Call Received", "Email Received", and "Chat Started". You want to analyze only these standard entries and exclude any cases that started differently (such as escalations or transfers from other departments).
**Settings**:
- Activity Attribute: Activity Name
- Attribute Values: Phone Call Received, Email Received, Chat Started (select multiple)
- Remove Selected Cases: Unchecked
**Result**: Only cases that began with one of these three activities are kept. If 9,500 of your 10,000 cases started through these channels, you now have 9,500 cases, excluding the 500 cases that started through non-standard entry points.
**Insights**: This allows you to focus your analysis on the standard customer service journey while excluding edge cases like internal escalations or transferred cases that don't follow the normal process pattern. You can now establish accurate benchmarks for standard case handling.
### Example 4: Analyzing High-Priority Order Starts
**Scenario**: You want to specifically analyze how high-priority orders are processed differently from regular orders. Your event log has a custom attribute "Priority" that is set in the first event.
**Settings**:
- Activity Attribute: Priority (custom event attribute)
- Attribute Values: High, Urgent
- Remove Selected Cases: Unchecked
**Result**: Only cases that started with Priority = "High" or Priority = "Urgent" are kept for analysis. If 2,500 of your 10,000 cases (25%) were high-priority, you now have 2,500 cases to analyze.
**Insights**: By isolating high-priority cases from the start, you can measure their end-to-end performance separately, identify if they receive preferential treatment, calculate their true cycle times, and ensure that SLAs for urgent orders are being met throughout the entire process.
## Output
The Case Start filter produces a refined event log containing only the cases that match (or don't match, if Remove is enabled) your specified starting criteria. Each case in the output has a first event that matches one of your selected attribute values.
**What gets filtered**: Entire cases are either included or excluded based on their first event. If a case doesn't start with one of your specified values, all events from that case are removed from the analysis.
**What stays unchanged**: The events within each kept case remain exactly as they were - this filter doesn't modify event details, timing, or sequence. It simply performs a binary decision at the case level.
**Percentage information**: When configuring the filter, mindzieStudio displays the percentage of cases that start with each available value, helping you understand the impact of your selection before applying the filter.
---
*This documentation is part of the mindzieStudio process mining platform.*
---
## Cases With Attribute
Section: Filters
URL: https://docs.mindziestudio.com/mindzie_studio/filters/cases-with-attribute
Source: /docs-master/mindzieStudio/filters/cases-with-attribute/page.md
# Cases with Attribute
## Overview
The Cases with Attribute filter selects or removes cases based on attribute values at either the case level or event level. This versatile filter supports comprehensive comparison operations including exact matching, text pattern matching, numerical comparisons, date operations, and multi-value selections.
The filter automatically detects whether the specified attribute exists in the case data or event data and applies the appropriate filtering logic. When filtering on event attributes, entire cases are included or excluded based on whether they contain events matching the criteria - the filter does not remove individual events.
## Common Uses
**Include cases where:**
- All cases from a specific region or department
- Cases with total order value exceeding a threshold
- Cases containing a specific activity or resource
- Cases started or completed within a date range
- Cases where a boolean flag is true (e.g., "Expedited" or "Cancelled")
- Cases with customer type matching one of several categories
**Exclude cases where:**
- Cases from test accounts or inactive vendors
- Cases with amounts below minimum processing thresholds
- Cases that don't contain required activities
- Cases outside your analysis timeframe
- Cases marked as cancelled or invalid
- Cases from specific organizational units being reorganized
## Settings
**Attribute:** Select the attribute you want to filter on from the dropdown menu. This can be any case-level attribute (like Region, Customer, Total Amount) or event-level attribute (like Activity Name, Resource, Event Status). The filter automatically determines whether the attribute exists at the case or event level.
**Comparison Method:** Choose how to compare attribute values against your criteria. Available comparison methods depend on the attribute's data type:
- **Text attributes:** Equal, Not Equal, Begins With, Ends With, Contains, Is One Of
- **Numeric attributes:** Equal, Not Equal, Greater Than, Greater Than or Equal, Less Than, Less Than or Equal, Between
- **Date attributes:** Day Equal, Day Greater Than, Day Greater Than or Equal, Day Less Than, Day Less Than or Equal, Between
- **Boolean attributes:** Equal (True/False)
**Compare Value:** Enter the value to compare against when using single-value comparisons (Equal, Not Equal, Greater Than, etc.). For text comparisons, matching is case-insensitive.
**Compare Values (Is One Of):** When using "Is One Of" comparison, select multiple values from the list or enter multiple values. Cases matching any of the specified values will be included.
**Range Values (Between):** For Between comparisons, specify both the lower and upper bounds. The comparison is inclusive - cases with values equal to either bound are included.
**Activity Filter (Event Attributes Only):** When filtering on event-level attributes, you can optionally specify an activity name to limit the evaluation to events from that specific activity. If left blank, all events are considered regardless of their activity.
**Remove Selected Cases:** Check this box to invert the filter logic - instead of including cases that match the criteria, the filter will exclude them. This is useful for removing unwanted cases from your analysis.
## Examples
### Example 1: Filter by Region (Text Exact Match)
**Scenario:** You want to analyze only cases from the European region to compare performance against other regions.
**Settings:**
- Attribute: Region
- Comparison Method: Equal
- Compare Value: "Europe"
- Remove Selected Cases: Unchecked
**Result:**
- Cases Included: All cases where Region = "Europe"
- Cases Excluded: All cases from other regions (North America, Asia, etc.)
**Insights:** This creates a focused dataset for regional analysis, allowing you to identify region-specific patterns and compare metrics against other regions.
### Example 2: Filter High-Value Orders (Numeric Comparison)
**Scenario:** You want to focus on high-value purchase orders exceeding $50,000 to analyze approval patterns and processing times.
**Settings:**
- Attribute: Total Order Amount
- Comparison Method: Greater Than
- Compare Value: 50000
- Remove Selected Cases: Unchecked
**Result:**
- Cases Included: All cases where Total Order Amount > $50,000
- Cases Excluded: All cases with amounts of $50,000 or less
**Insights:** Isolating high-value transactions helps identify whether approval bottlenecks or compliance issues are specific to large orders, enabling targeted process improvements.
### Example 3: Filter by Multiple Vendor Categories (Multi-Value Selection)
**Scenario:** You need to analyze cases from preferred vendors in categories A, B, and C while excluding other vendor categories.
**Settings:**
- Attribute: Vendor Category
- Comparison Method: Is One Of
- Compare Values: ["Category A", "Category B", "Category C"]
- Remove Selected Cases: Unchecked
**Result:**
- Cases Included: All cases where Vendor Category is A, B, or C
- Cases Excluded: All cases from other vendor categories
**Insights:** This allows focused analysis on preferred vendor performance while maintaining a sufficient case volume for meaningful insights across multiple related categories.
### Example 4: Find Cases with Specific Activity (Event Attribute)
**Scenario:** You want to find all cases that went through manual approval to understand how often this exception path occurs.
**Settings:**
- Attribute: Activity Name
- Comparison Method: Equal
- Compare Value: "Manual Approval"
- Remove Selected Cases: Unchecked
**Result:**
- Cases Included: All cases containing at least one "Manual Approval" event
- Cases Excluded: All cases that never had manual approval
**Insights:** Identifying cases requiring manual approval helps quantify automation rates and understand which types of cases require human intervention.
### Example 5: Filter Recent Cases (Date Range)
**Scenario:** You want to analyze only cases that started in the last quarter for a current performance assessment.
**Settings:**
- Attribute: Case Start Date
- Comparison Method: Between
- Lower Value: 2024-07-01
- Upper Value: 2024-09-30
- Remove Selected Cases: Unchecked
**Result:**
- Cases Included: All cases with start dates from July 1 through September 30, 2024
- Cases Excluded: All cases started before July 1 or after September 30, 2024
**Insights:** Time-based filtering ensures your analysis reflects current process performance rather than historical patterns that may no longer be relevant.
### Example 6: Exclude Test Accounts (Inverse Filter)
**Scenario:** Your dataset includes test cases that should not be part of operational analysis. You want to remove all cases where the "Test Account" flag is true.
**Settings:**
- Attribute: Is Test Account
- Comparison Method: Equal
- Compare Value: True
- Remove Selected Cases: Checked
**Result:**
- Cases Included: All cases where Is Test Account = False or Null
- Cases Excluded: All cases where Is Test Account = True
**Insights:** Removing test data ensures your metrics and analysis reflect actual operational performance and aren't skewed by testing activities.
## Output
The filter modifies the case selection in your current analysis view. The case count indicator at the top of the screen updates to show how many cases remain after filtering. All subsequent calculators, visualizations, and analysis tools will operate only on the filtered case set.
The filter operates at the case level - even when filtering on event attributes, entire cases are included or excluded based on whether they contain matching events. Individual events are not removed from cases.
When multiple filters are applied, they work together using AND logic - a case must pass all filter criteria to be included in the analysis.
---
*This documentation is part of the mindzie Studio process mining platform.*
---
## Cases With Changed Attribute
Section: Filters
URL: https://docs.mindziestudio.com/mindzie_studio/filters/cases-with-changed-attribute
Source: /docs-master/mindzieStudio/filters/cases-with-changed-attribute/page.md
# Cases with Changed Attribute
## Overview
The Cases with Changed Attribute filter selects cases where an event attribute has different values across events within the case. This case-level filter examines all events in each case and keeps only those cases where the specified attribute varies from event to event. The filter is particularly useful for identifying dynamic processes where attribute values change during case execution, such as status transitions, location changes, or resource handoffs.
The filter focuses on non-null values - it filters out null values first, then checks if the remaining values are identical. Cases where all events have the same value (or all null values) are excluded from the results.
## Common Uses
- **Status Progression Analysis**: Identify cases where status values changed during processing, indicating progression through different stages.
- **Resource Handoff Detection**: Find cases where different resources or departments handled different events, revealing collaboration patterns.
- **Location Change Tracking**: Discover cases where the location attribute changed, indicating physical movement or transfer between sites.
- **Priority Escalation**: Detect cases where priority levels changed during execution, showing escalation or de-escalation patterns.
- **Process Deviation Identification**: Find cases where attribute values varied unexpectedly, potentially indicating exceptions or non-standard processing.
- **Multi-Stage Process Analysis**: Identify cases that went through multiple stages by detecting changes in stage-related attributes.
## Settings
**Event Column Name**: Select the event attribute you want to evaluate for variation. The filter will return cases where this attribute has different values across events. Only non-null values are considered when checking for variation.
> **Note**: The attribute must exist in the event table and be of a supported data type (String, Int32, Int64, DateTime, TimeSpan, Single, Double, or Boolean). If you mistype the column name, the filter's validation system will suggest similar column names.
## Examples
### Example 1: Finding Cases with Status Changes
**Scenario**: You want to identify all order processing cases where the order status changed during processing, indicating that the order progressed through different stages.
**Settings**:
- Event Column Name: "Order Status"
**Result**: The filter returns cases where different events have different "Order Status" values (e.g., "New" -> "Processing" -> "Shipped"). Cases where all events have the same status are excluded.
**Insights**: This helps identify:
- Cases that successfully progressed through the workflow
- Normal processing patterns with status transitions
- Cases that may have experienced multiple status changes
- Orders that moved through different fulfillment stages
### Example 2: Detecting Resource Handoffs
**Scenario**: You need to find cases where different resources or employees worked on different activities, indicating collaboration or handoff situations.
**Settings**:
- Event Column Name: "Resource"
**Result**: The filter selects cases where the "Resource" attribute varies across events, meaning multiple people or systems handled different activities.
**Insights**: These cases reveal:
- Collaborative work patterns where multiple people contribute
- Handoffs between departments or teams
- Cases requiring specialized expertise from different resources
- Potential bottlenecks where resource changes occurred
### Example 3: Identifying Location Changes
**Scenario**: You want to track shipments or items that moved between different locations during processing.
**Settings**:
- Event Column Name: "Location"
**Result**: The filter returns cases where events occurred at different locations, indicating physical movement or transfer.
**Insights**: This can reveal:
- Items that traveled through multiple warehouses or distribution centers
- Cross-site processing patterns
- Geographic routing of cases
- Cases requiring multi-location coordination
### Example 4: Finding Priority Escalations
**Scenario**: Identify support tickets or requests where the priority level changed during handling, indicating escalation or de-escalation.
**Settings**:
- Event Column Name: "Priority"
**Result**: The filter selects cases where "Priority" values changed between events (e.g., from "Low" to "High").
**Insights**: These cases might indicate:
- Escalated issues requiring increased attention
- De-escalated cases after initial assessment
- Dynamic priority adjustments based on customer feedback
- Cases requiring management intervention
### Example 5: Detecting Department Transfers
**Scenario**: You want to find cases that were transferred between departments during processing, indicating complex cases requiring cross-functional support.
**Settings**:
- Event Column Name: "Department"
**Result**: The filter returns cases where different events were handled by different departments.
**Insights**: This helps identify:
- Cases requiring expertise from multiple departments
- Cross-functional collaboration patterns
- Potential handoff delays between departments
- Complex cases that could benefit from process optimization
### Example 6: Tracking Approval Level Changes
**Scenario**: Identify cases where the approval level changed, such as requests that required escalation to higher management levels.
**Settings**:
- Event Column Name: "Approval Level"
**Result**: The filter selects cases where the "Approval Level" attribute varied across events.
**Insights**: These cases may represent:
- Requests that required multiple approval tiers
- Escalation patterns for high-value or complex requests
- Cases that exceeded standard approval thresholds
- Multi-stage approval workflows
## Output
The filter returns a new dataset containing only the cases where the specified event attribute has different values across events. Each returned case preserves all its original events and attributes, and you will see variation in the selected attribute's values.
Cases where all non-null values are identical are excluded. Cases with only null values or a single unique value are also excluded.
If no cases match the criteria, the filter returns an empty result set.
## Technical Notes
- **Filter Type**: Case-level filter (removes entire cases, not individual events)
- **Null Handling**: Ignores null values when checking for variation - only considers non-null values
- **Variation Detection**: Compares the first non-null value against all other non-null values
- **Supported Data Types**: String, Int32, Int64, DateTime, TimeSpan, Single, Double, Boolean
- **Validation**: Automatically suggests similar column names if the specified column is not found
---
*This documentation is part of the mindzieStudio process mining platform.*
---
## Cases With Identical Event Dates
Section: Filters
URL: https://docs.mindziestudio.com/mindzie_studio/filters/cases-with-identical-event-dates
Source: /docs-master/mindzieStudio/filters/cases-with-identical-event-dates/page.md
# Cases with Identical Event Dates
## Overview
The Cases with Identical Event Dates filter identifies cases where multiple activities occurred on the same calendar day, regardless of the specific time. This filter helps you analyze temporal clustering patterns in your processes, identify intensive work periods, or distinguish between cases with concentrated activity versus those spread across multiple days. Unlike the timestamp filter, this filter compares only the calendar date, ignoring the time of day.
## Common Uses
- Identify cases with concentrated daily activity indicating intensive processing
- Find batch processing patterns where multiple steps occur on the same day
- Analyze work intensity by identifying cases with same-day activity clustering
- Separate rush-processed cases from normal multi-day cases
- Detect cases where multiple events were completed in a single work session
- Compare processing patterns between concentrated and distributed workflows
## Settings
**Include or Exclude Cases:** Choose whether to include cases that have same-day activities or exclude them.
- **Include cases with same-day activities:** Returns only cases where at least two events occurred on the same calendar day
- **Exclude cases with same-day activities:** Returns only cases where all events occurred on different calendar days
## Examples
### Example 1: Identifying Express Orders
**Scenario:** Your order fulfillment process normally spans multiple days (Order Received on Day 1, Processing on Day 2, Shipped on Day 3). However, express orders are rushed through the entire workflow in a single day. You want to identify these express cases for performance analysis.
**Settings:**
- Include cases with same-day activities
**Result:**
The filter returns all cases where multiple fulfillment steps occurred on the same calendar day. For example, Case #EXP-1234 shows "Order Received" at 9:00 AM, "Payment Processed" at 9:15 AM, "Picked" at 10:30 AM, and "Shipped" at 2:00 PM, all on October 15, 2024. If 300 out of 5,000 orders were processed same-day, those 300 cases are returned.
**Insights:** These cases represent your express or rush processing workflow, which operates differently from standard multi-day fulfillment. By analyzing these separately, you can measure express service performance, identify bottlenecks in rush processing, and calculate the true capacity of same-day fulfillment.
### Example 2: Analyzing Normal Multi-Day Workflows
**Scenario:** You want to analyze your standard loan approval process, which typically spans several days with proper review periods. You need to exclude rush cases where multiple steps were completed on the same day, focusing only on cases with proper daily distribution.
**Settings:**
- Exclude cases with same-day activities
**Result:**
The filter returns only cases where all activities occurred on different calendar days. For example, Case #LOAN-5678 shows "Application Submitted" on Oct 10, "Document Review" on Oct 11, "Credit Check" on Oct 12, and "Final Approval" on Oct 13. If 4,500 out of 5,000 loans followed the normal multi-day pattern, those 4,500 cases are returned.
**Insights:** By excluding same-day cases, you can analyze your standard workflow without noise from expedited processing. This provides accurate insights into normal processing times, proper review periods, and typical bottlenecks when cases progress through your intended multi-day workflow.
### Example 3: Detecting Bulk Processing Days
**Scenario:** Your invoice processing system normally handles invoices individually across multiple days. However, at month-end, accounting staff often bulk-process multiple steps for many invoices on the same day. You want to identify cases processed during these intensive bulk sessions.
**Settings:**
- Include cases with same-day activities
**Result:**
The filter identifies cases where multiple processing steps (Invoice Received, Validation, Approval, Payment Scheduled) occurred on the same calendar day. For example, during month-end on October 31, 150 invoices show all steps completed on that single day, while throughout the rest of October, only 20 invoices had same-day processing. Those 170 cases with same-day activity are returned.
**Insights:** This reveals your bulk processing patterns and helps distinguish between normal daily processing and intensive batch sessions. You can analyze these patterns separately, optimize bulk processing workflows, and understand the impact of concentrated processing on quality and accuracy.
### Example 4: Measuring Patient Journey Duration
**Scenario:** Your healthcare process tracks patient journeys through Emergency Department visits. You want to identify cases where the entire visit (Triage, Examination, Treatment, Discharge) occurred within a single calendar day versus cases requiring overnight stays or multi-day care.
**Settings:**
- Include cases with same-day activities
**Result:**
The filter returns all ED visits where all activities happened on the same calendar day. For example, Patient #12345 was triaged at 2:00 PM, examined at 2:30 PM, treated at 3:15 PM, and discharged at 4:45 PM, all on October 15. If 2,800 out of 3,000 ED visits were same-day, those 2,800 cases are returned.
**Insights:** Most ED visits should be same-day cases, so this helps you identify the 200 cases that required multi-day care or overnight observation. By analyzing each group separately, you can understand the characteristics of same-day versus extended care cases and optimize resource allocation accordingly.
## Output
This filter operates at the case level and filters entire cases based on calendar date analysis:
- **Include mode:** Returns only cases containing at least two events on the same calendar day
- **Exclude mode:** Returns only cases where all events occurred on different calendar days
- Comparison uses calendar dates only (ignores time of day)
- Case and event attributes are preserved
- Event sequences and all other properties remain unchanged
- More lenient than timestamp comparison (events at different times on the same day count as same-day)
Use this filter to analyze temporal clustering patterns, identify concentrated versus distributed workflows, and separate rush processing from normal multi-day cases.
---
*This documentation is part of the mindzie Studio process mining platform.*
---
## Cases With Identical Event Timestamps
Section: Filters
URL: https://docs.mindziestudio.com/mindzie_studio/filters/cases-with-identical-event-timestamps
Source: /docs-master/mindzieStudio/filters/cases-with-identical-event-timestamps/page.md
# Cases with Identical Event Timestamps
## Overview
The Cases with Identical Event Timestamps filter identifies cases where multiple activities occurred at exactly the same timestamp, down to the millisecond. This filter is valuable for detecting data quality issues, identifying simultaneous process execution, or finding cases where events were logged in bulk with identical timestamps. You can choose to include cases with same-time activities or exclude them, depending on whether you're investigating timestamp anomalies or focusing on properly sequenced cases.
## Common Uses
- Detect data quality issues where multiple events have identical timestamps
- Identify cases with suspicious timestamp patterns that may indicate data loading errors
- Find cases where parallel activities were executed simultaneously
- Exclude cases with timestamp anomalies from process analysis
- Investigate batch processing or bulk data loading scenarios
- Clean datasets by focusing only on cases with properly sequenced timestamps
## Settings
**Include or Exclude Cases:** Choose whether to include cases that have same-time activities or exclude them.
- **Include cases with same-time activities:** Returns only cases where at least two events occurred at exactly the same timestamp
- **Exclude cases with same-time activities:** Returns only cases where all events have different timestamps (properly sequenced)
## Examples
### Example 1: Finding Data Quality Issues
**Scenario:** Your process mining dataset was imported from a legacy system. You suspect that some cases have data quality issues where multiple events were logged with identical timestamps, which shouldn't happen in your sequential approval workflow.
**Settings:**
- Include cases with same-time activities
**Result:**
The filter returns all cases where two or more events share exactly the same timestamp. For example, if Case #12345 has "Submit Request" and "Manager Approval" both timestamped at 2024-10-15 14:32:18.450, this case would be included in the results. If you had 5,000 cases with 120 showing timestamp anomalies, those 120 cases are returned.
**Insights:** These cases likely represent data quality issues that need investigation. Events in a sequential approval workflow shouldn't occur at the exact same millisecond. This could indicate bulk data loading, system clock issues, or improper event logging. Review these cases with your data team to determine the root cause.
### Example 2: Analyzing Clean Sequential Cases
**Scenario:** You want to perform accurate process variant analysis and need to exclude cases with timestamp anomalies. Your goal is to analyze only cases where events occurred at distinct times, ensuring proper sequential ordering.
**Settings:**
- Exclude cases with same-time activities
**Result:**
The filter returns only cases where all events have unique timestamps. If you had 5,000 cases with 120 showing timestamp collisions, the filter returns the remaining 4,880 cases where all events are properly sequenced in time. Each case in the result has events with distinct timestamps.
**Insights:** By excluding cases with identical timestamps, you ensure your variant analysis is based on properly sequenced data. This provides more accurate cycle times, bottleneck identification, and variant frequencies since all events have clear temporal ordering.
### Example 3: Investigating Bulk Processing
**Scenario:** Your warehouse management system processed a large batch of shipments overnight. You want to identify which cases were part of the bulk processing where multiple activities (Pick, Pack, Label) might have been logged simultaneously.
**Settings:**
- Include cases with same-time activities
**Result:**
The filter identifies cases where multiple warehouse activities share the same timestamp. For example, Case #WH-7890 might show "Pick Items," "Pack Box," and "Generate Label" all timestamped at 2024-10-15 03:15:22.000, indicating bulk processing. If 200 shipments were processed in the batch, those 200 cases would be returned.
**Insights:** These cases represent bulk processing events where multiple steps were completed and logged simultaneously rather than individually. This helps you separate bulk-processed cases from normal sequential cases, allowing different analysis approaches for each processing mode.
### Example 4: Validating Real-Time Transaction Logging
**Scenario:** Your financial transaction system should log each step (Transaction Initiated, Validation, Authorization, Completion) with precise timestamps. You want to verify that your real-time logging is working correctly by finding any cases with timestamp collisions.
**Settings:**
- Include cases with same-time activities
**Result:**
The filter returns cases where two or more transaction steps have identical timestamps. Ideally, this should return zero cases in a properly functioning real-time system. If you find 15 cases out of 50,000 with timestamp collisions, these warrant investigation.
**Insights:** Cases with identical timestamps in a real-time transaction system indicate potential issues with event logging or system clock resolution. A small number might be acceptable, but a large number suggests systematic problems with your timestamp capture mechanism that should be addressed.
## Output
This filter operates at the case level and filters entire cases based on timestamp analysis:
- **Include mode:** Returns only cases containing at least two events with identical timestamps
- **Exclude mode:** Returns only cases where all events have unique timestamps
- Case and event attributes are preserved
- Event sequences and all other properties remain unchanged
- The filter performs exact timestamp comparison (including milliseconds)
Use this filter to identify data quality issues or to ensure your analysis uses only properly sequenced cases with accurate temporal ordering.
---
*This documentation is part of the mindzie Studio process mining platform.*
---
## Cases With Unchanged Attribute
Section: Filters
URL: https://docs.mindziestudio.com/mindzie_studio/filters/cases-with-unchanged-attribute
Source: /docs-master/mindzieStudio/filters/cases-with-unchanged-attribute/page.md
# Cases with Unchanged Attribute
## Overview
The Cases with Unchanged Attribute filter selects cases where a specified attribute maintains the same value throughout the entire case. This case-level filter examines all events within each case and returns only those cases where every event has an identical value in the selected attribute. This filter is particularly useful for identifying processes where certain properties remain constant, detecting data quality issues, or finding cases that follow standardized patterns without variation.
## Common Uses
- **Data Quality Validation**: Identify cases where attributes that should change (like status or location) remain static throughout the process, potentially indicating data recording issues.
- **Process Standardization**: Find cases that were handled by a single department, resource, or system without handoffs or transfers.
- **Consistency Analysis**: Detect cases where key attributes like priority level, customer type, or product category remained unchanged from start to finish.
- **Single-Location Processing**: Identify cases processed entirely at one location or facility without transfers between sites.
- **Dedicated Resource Analysis**: Find cases handled by a single resource or team member throughout the entire process.
- **Static Configuration Detection**: Discover cases where configuration values or system settings remained constant, indicating stable processing conditions.
## Settings
**Event Attribute Name**: Select the event attribute you want to check for consistency. The filter will return all cases where every event has the same value in this attribute. The attribute must exist in your event table and be of a supported data type (String, Integer, DateTime, TimeSpan, Decimal, Boolean).
> **Note**: The filter uses exact value matching. For numeric and date attributes, values must be identical. For string attributes, the comparison is case-sensitive. Null values are treated as valid - if all events have null values in the selected attribute, the case will be included in the results.
## Examples
### Example 1: Finding Single-Department Cases
**Scenario**: You want to identify purchase orders that were processed entirely within a single department without any inter-departmental handoffs.
**Settings**:
- Event Attribute Name: "Department"
**Result**: The filter returns only cases where every event has the same department value, such as all events having "Finance" or all events having "Procurement".
**Insights**: These cases represent streamlined processes without departmental transfers. This can help identify:
- Departments with end-to-end process ownership
- Cases that avoided coordination overhead
- Potential best practices for process efficiency
- Simpler cases that didn't require cross-functional collaboration
### Example 2: Detecting Unchanging Priority Levels
**Scenario**: You need to find cases where the priority level never changed from start to finish, which could indicate either straightforward processing or a failure to escalate urgent issues.
**Settings**:
- Event Attribute Name: "Priority"
**Result**: The filter selects cases where all events have the same priority value (e.g., all "Low", all "Medium", or all "High").
**Insights**: This reveals:
- Cases that maintained their initial priority classification
- Potential issues where urgent cases weren't escalated
- Standard processing patterns for different priority levels
- Opportunities to implement dynamic priority adjustment
### Example 3: Identifying Static Status Cases
**Scenario**: Find cases where a status attribute never changed, which could indicate data quality problems or incomplete process execution.
**Settings**:
- Event Attribute Name: "Status"
**Result**: The filter returns cases where the status field has the same value in all events.
**Insights**: These cases may represent:
- Data recording errors where status updates weren't logged
- Cancelled or abandoned cases that never progressed
- System integration issues preventing status updates
- Cases requiring data quality remediation
### Example 4: Single-Location Processing
**Scenario**: Identify manufacturing orders that were completed entirely at one production facility without transfers to other locations.
**Settings**:
- Event Attribute Name: "Location"
**Result**: The filter selects cases where all events occurred at the same location.
**Insights**: This can reveal:
- Products manufactured at a single facility from start to finish
- Cases that avoided logistics complexity
- Location-specific capabilities and expertise
- Opportunities for centralized processing models
### Example 5: Consistent Resource Allocation
**Scenario**: Find cases where the same resource handled all activities, indicating dedicated case ownership.
**Settings**:
- Event Attribute Name: "Resource"
**Result**: The filter returns cases where every event was performed by the same resource or person.
**Insights**: These cases show:
- End-to-end case ownership by individual resources
- Potential efficiency gains from avoiding handoffs
- Resource specialization patterns
- Training opportunities for dedicated case handling
### Example 6: Uniform Customer Type Processing
**Scenario**: Identify cases where the customer type classification remained constant throughout processing.
**Settings**:
- Event Attribute Name: "CustomerType"
**Result**: The filter selects cases where all events have the same customer type value (e.g., all "Premium", all "Standard", or all "Enterprise").
**Insights**: This helps understand:
- Customer segments with stable classifications
- Processes tailored to specific customer types
- Consistency in customer categorization
- Patterns in how different customer types are handled
## Output
The filter returns a new dataset containing only the cases where all events have identical values in the specified attribute. Each returned case preserves all its original events and attributes. If a case contains any variation in the selected attribute's value across its events, that case is excluded from the results.
If no cases match the criteria (meaning all cases have at least one event with a different value), the filter returns an empty result set.
## Technical Notes
- **Filter Type**: Case-level filter (removes entire cases, not individual events)
- **Comparison Logic**: Uses the first event's value as a reference and compares all subsequent events to it
- **Null Handling**: Treats null values as valid and consistent - cases where all events have null values are included
- **Supported Data Types**: String, Int32, Int64, DateTime, TimeSpan, Single, Double, Boolean
- **Performance**: Efficiently implemented using LINQ with early termination when a mismatch is found
---
*This documentation is part of the mindzieStudio process mining platform.*
---
## Compare Attribute Values
Section: Filters
URL: https://docs.mindziestudio.com/mindzie_studio/filters/compare-attribute-values
Source: /docs-master/mindzieStudio/filters/compare-attribute-values/page.md
# Compare Attribute Values
## Overview
The Compare Attribute Values filter validates mathematical calculations by comparing the result of a computed operation against a stored result value. This filter performs arithmetic operations (addition, subtraction, multiplication, division) on two attributes and compares the calculated result with a third attribute containing the expected result. It can filter cases based on whether the calculation matches, differs from, or produces null results compared to the stored values.
The filter supports both case-level and event-level filtering depending on the source of the attributes. It includes tolerance handling for floating-point precision issues through a configurable threshold, making it ideal for data quality validation and anomaly detection in business processes.
## Common Uses
- **Data Quality Validation**: Verify that calculated totals match stored totals in financial data, identifying potential data entry errors or system calculation issues.
- **Invoice Verification**: Check that line item amounts (quantity * price) match the stored total amount, flagging invoices with calculation discrepancies.
- **Reconciliation Analysis**: Find cases where expected calculations don't match actual values, such as tax calculations, discount applications, or currency conversions.
- **Fraud Detection**: Identify suspicious transactions where calculated values don't align with recorded values, potentially indicating manual manipulation or system errors.
- **Process Integrity Checks**: Ensure that derived values in your process data are mathematically consistent with their source values.
- **System Migration Validation**: Verify data integrity after system migrations by checking that calculated fields remained consistent with their source values.
## Settings
**First Operand**: The name of the first attribute used in the mathematical operation. This must contain numeric data (integer or decimal) and must be from the same source (case or event) as the other operand and result attributes.
**Operation Type**: Specifies the mathematical operation to perform between the first and second operands. Available options:
- Add: Addition operation (First Operand + Second Operand)
- Subtract: Subtraction operation (First Operand - Second Operand)
- Multiply: Multiplication operation (First Operand * Second Operand)
- Divide: Division operation (First Operand / Second Operand). Automatically handles division by zero by treating it as a null result.
**Second Operand**: The name of the second attribute used in the mathematical operation. This must contain numeric data and must be from the same source as the first operand and result attribute.
**Result Attribute**: The name of the attribute containing the expected result value to compare against the calculated operation result. This must contain numeric data and must be from the same source as the operand attributes.
**Keep Records**: Determines which records to keep based on the comparison result:
- Same: Keeps records where the calculated result matches the stored result (within the specified threshold)
- Different: Keeps records where the calculated result differs from the stored result
- Null: Keeps records where the calculation produces a null result (typically due to missing values or division by zero)
**Tolerance Threshold**: Sets the tolerance threshold for treating small differences as zero due to floating-point precision issues. If the absolute difference between calculated and expected results is less than this threshold, the difference is considered zero (matching). Default is 0.01. Set to 0.0 for exact comparison with no tolerance.
## Examples
### Example 1: Finding Invoice Calculation Errors
**Scenario**: You want to identify invoices where the line item total (Quantity * Unit Price) doesn't match the stored Line Total value, indicating potential data entry or calculation errors.
**Settings**:
- First Operand: "Quantity"
- Operation Type: Multiply
- Second Operand: "Unit Price"
- Result Attribute: "Line Total"
- Keep Records: Different
- Tolerance Threshold: 0.01
**Result**: The filter returns cases where the calculated value (Quantity * Unit Price) differs from the stored Line Total by more than 0.01.
**Insights**: These cases may represent data entry errors, rounding inconsistencies, system calculation bugs, or potentially fraudulent manual adjustments. Cases should be reviewed for correction.
### Example 2: Validating Discount Calculations
**Scenario**: You need to verify that the final price equals the original price minus the discount amount, helping identify pricing errors or incorrect discount applications.
**Settings**:
- First Operand: "Original Price"
- Operation Type: Subtract
- Second Operand: "Discount Amount"
- Result Attribute: "Final Price"
- Keep Records: Different
- Tolerance Threshold: 0.01
**Result**: The filter selects cases where (Original Price - Discount Amount) does not match the stored Final Price.
**Insights**: Discrepancies could indicate incorrectly applied discounts, data entry mistakes, or pricing policy violations that require investigation.
### Example 3: Detecting Tax Calculation Issues
**Scenario**: Identify orders where the calculated tax amount (Subtotal * Tax Rate) doesn't match the stored tax value, which could indicate tax calculation errors or rate changes.
**Settings**:
- First Operand: "Subtotal"
- Operation Type: Multiply
- Second Operand: "Tax Rate"
- Result Attribute: "Tax Amount"
- Keep Records: Different
- Tolerance Threshold: 0.001
**Result**: The filter returns cases where the calculated tax differs from the stored tax amount.
**Insights**: These cases may require tax recalculation, refunds, or corrections to ensure compliance with tax regulations.
### Example 4: Finding Cases with Missing Calculation Data
**Scenario**: You want to identify cases where calculations cannot be performed due to missing values, helping detect incomplete data entry or system integration issues.
**Settings**:
- First Operand: "Amount"
- Operation Type: Divide
- Second Operand: "Quantity"
- Result Attribute: "Unit Price"
- Keep Records: Null
- Tolerance Threshold: 0.01
**Result**: The filter selects cases where any of the three values (Amount, Quantity, or Unit Price) are null, or where Quantity is zero (division by zero).
**Insights**: These cases indicate data quality issues that need to be addressed, such as missing required fields or incomplete transactions.
### Example 5: Verifying Balance Calculations
**Scenario**: Ensure that the opening balance plus the transaction amount equals the closing balance in financial accounts, with exact precision required.
**Settings**:
- First Operand: "Opening Balance"
- Operation Type: Add
- Second Operand: "Transaction Amount"
- Result Attribute: "Closing Balance"
- Keep Records: Same
- Tolerance Threshold: 0.0
**Result**: The filter returns only cases where the calculation exactly matches (Opening Balance + Transaction Amount = Closing Balance).
**Insights**: This helps verify accounting accuracy and can be used to confirm that all transactions are properly recorded with correct balance updates.
### Example 6: Finding Consistent Unit Price Calculations
**Scenario**: Identify cases where the unit price calculation is correct (Total Amount / Quantity = Unit Price), which can be used to validate pricing consistency across orders.
**Settings**:
- First Operand: "Total Amount"
- Operation Type: Divide
- Second Operand: "Quantity"
- Result Attribute: "Unit Price"
- Keep Records: Same
- Tolerance Threshold: 0.01
**Result**: The filter returns cases where the calculated unit price matches the stored unit price within the tolerance threshold.
**Insights**: This helps identify properly calculated orders that can serve as benchmarks, while excluding these from analysis allows you to focus on problematic cases.
## Output
The filter returns a new dataset containing only the cases that meet the specified comparison criteria. For case-level filtering (when using case attributes), entire cases are kept or removed based on whether they meet the condition. For event-level filtering (when using event attributes), cases are kept if they contain at least one event meeting the specified condition.
All three attributes (First Operand, Second Operand, and Result Attribute) must be from the same source - either all case attributes or all event attributes. If attributes are from different sources, the filter returns the original dataset unchanged.
The filter preserves all original events and attributes in the returned cases.
## Technical Notes
- **Filter Type**: Case-level filter (removes entire cases based on attribute comparisons)
- **Data Source Flexibility**: Supports both case attributes and event attributes, but all three must be from the same source
- **Numeric Types Supported**: Double, Single, Int32 (integer), Int64 (long integer)
- **Division by Zero Handling**: Division operations only proceed if the second operand is greater than zero; otherwise, the result is null
- **Null Value Handling**: If any of the three required values are null, the calculation result is considered null
- **Threshold Processing**: After calculating the difference, the tolerance threshold is applied to handle floating-point precision issues
- **Performance**: Efficiently validates calculations across large datasets with optimized numeric comparisons
---
*This documentation is part of the mindzieStudio process mining platform.*
---
## Deadline
Section: Filters
URL: https://docs.mindziestudio.com/mindzie_studio/filters/deadline
Source: /docs-master/mindzieStudio/filters/deadline/page.md
# Deadline
## Overview
The Deadline filter selects cases based on whether a specific activity was performed before, after, or on the same day as a deadline timestamp stored in an event attribute. This temporal comparison filter helps identify deadline compliance and violations by comparing activity timestamps with deadline values. The filter operates at the case level, meaning entire cases are included or excluded based on whether they contain activities that meet the specified deadline criteria.
Unlike filters that compare dates against fixed values, the Deadline filter compares activity timestamps against dynamic deadline values stored as event attributes in your data. This makes it ideal for analyzing processes where each activity has its own deadline recorded in the event log.
## Common Uses
- **Late Payment Detection**: Find invoices paid after their due date to identify late payment penalties or interest charges.
- **Delivery Performance**: Identify orders delivered before or after promised delivery dates to assess fulfillment accuracy.
- **Compliance Monitoring**: Detect activities performed outside of allowed timeframes to identify regulatory violations.
- **SLA Violation Analysis**: Find cases where service activities exceeded their service level agreement deadlines.
- **Early Completion Analysis**: Identify activities completed before their scheduled dates to recognize efficiency opportunities.
- **Same-Day Processing**: Find activities that were performed on the same day as their deadline for just-in-time processing analysis.
## Settings
**Activity**: Select the activity you want to compare against its deadline. The dropdown shows all available activities in your event log. The filter will examine only events with this activity name.
**Attribute Time Name**: Select the event attribute that contains the deadline timestamp. This must be a DateTime column in your event table. The filter will compare each selected activity's timestamp against the deadline value in this attribute for the same event.
**Search Type**: Choose the type of temporal comparison to perform:
- **Activity Time Greater Than**: Finds cases where the activity timestamp (including time) occurred after the deadline timestamp. Use this for finding activities that missed their deadline.
- **Activity Date Greater Than**: Finds cases where the activity date (ignoring time) occurred after the deadline date. Use this for date-only deadline comparisons.
- **Activity Time Less Than**: Finds cases where the activity timestamp (including time) occurred before the deadline timestamp. Use this for finding activities completed early.
- **Activity Date Less Than**: Finds cases where the activity date (ignoring time) occurred before the deadline date. Use this for date-only early completion analysis.
- **Activity Time Same Day**: Finds cases where the activity and deadline occurred on the same date, regardless of time. Use this for same-day processing analysis.
> **Important**: The deadline attribute must exist in the event table (not the case table). Each event can have its own deadline value, allowing for activity-specific deadline tracking.
## Examples
### Example 1: Late Invoice Payments
**Scenario**: Your accounts payable process has a "Pay Invoice" activity, and each invoice event has a "DueDate" attribute. You need to identify all cases where invoices were paid after their due date to calculate late payment penalties.
**Settings**:
- Activity: "Pay Invoice"
- Attribute Time Name: "DueDate"
- Search Type: Activity Time Greater Than
**Result**: The filter selects only cases where the "Pay Invoice" activity timestamp is later than the DueDate value for that event, indicating the invoice was paid late.
**Insights**: This helps you identify late payment patterns, calculate penalty amounts, understand which vendors are affected by late payments, and analyze the average delay in payment processing.
### Example 2: On-Time Delivery Performance
**Scenario**: Your order fulfillment process has a "Deliver Order" activity with a "PromisedDeliveryDate" attribute. You want to find orders delivered before the promised date to measure early delivery performance.
**Settings**:
- Activity: "Deliver Order"
- Attribute Time Name: "PromisedDeliveryDate"
- Search Type: Activity Date Less Than
**Result**: The filter returns cases where the delivery date was before the promised delivery date, showing early deliveries.
**Insights**: Identify which orders were delivered early, understand if early delivery correlates with customer satisfaction, and determine if promised dates are too conservative.
### Example 3: Same-Day Approval Processing
**Scenario**: Your loan approval process has an "Approve Loan" activity with an "ApplicationDate" attribute. You need to find applications that were approved on the same day they were submitted to measure fast-track processing efficiency.
**Settings**:
- Activity: "Approve Loan"
- Attribute Time Name: "ApplicationDate"
- Search Type: Activity Time Same Day
**Result**: The filter selects cases where the approval activity occurred on the same calendar day as the application date.
**Insights**: Measure the percentage of same-day approvals, identify characteristics of fast-track applications, and understand which loan types receive expedited processing.
### Example 4: SLA Compliance Analysis
**Scenario**: Your support ticket process has a "Resolve Ticket" activity with an "SLA_Deadline" attribute. You need to find tickets resolved after their SLA deadline to measure compliance and identify problem areas.
**Settings**:
- Activity: "Resolve Ticket"
- Attribute Time Name: "SLA_Deadline"
- Search Type: Activity Time Greater Than
**Result**: The filter returns cases where ticket resolution occurred after the SLA deadline, indicating SLA violations.
**Insights**: Calculate SLA violation rates, identify which ticket categories have the most violations, understand average delay times for missed SLAs, and prioritize process improvement efforts.
### Example 5: Manufacturing Schedule Adherence
**Scenario**: Your manufacturing process has a "Complete Production" activity with a "ScheduledCompletionDate" attribute. You want to analyze cases that finished production before the scheduled date to identify efficiency gains.
**Settings**:
- Activity: "Complete Production"
- Attribute Time Name: "ScheduledCompletionDate"
- Search Type: Activity Date Less Than
**Result**: The filter selects cases where production was completed before the scheduled date, showing ahead-of-schedule performance.
**Insights**: Identify production lines that consistently finish early, understand which products have the most schedule buffer, and optimize scheduling based on actual performance.
## Output
The filter returns a dataset containing only cases where the specified activity met the deadline comparison criteria. All events and attributes from the selected cases are preserved in the output.
If the specified deadline attribute does not exist in the event table, the filter returns the original dataset unchanged without applying any filtering.
Cases that do not contain the specified activity are automatically excluded from the results.
---
*This documentation is part of the mindzieStudio process mining platform.*
---
## Event Order
Section: Filters
URL: https://docs.mindziestudio.com/mindzie_studio/filters/event-order
Source: /docs-master/mindzieStudio/filters/event-order/page.md
# Event Order
## Overview
The Event Order filter identifies cases based on sequential relationships between activities. It allows you to find cases where one activity follows another according to specific patterns: directly (with no activities in between), eventually (at any point later in the case), on the same date, or at the same time. This powerful filter is essential for conformance checking, process variant analysis, and detecting whether expected activity sequences actually occurred in your process data.
The filter provides four distinct relationship types to match different analysis needs. You can use it to verify that required sequences happened (like "approval before payment"), find cases that follow or violate standard procedures, or analyze temporal relationships between activities.
## Common Uses
- **Conformance Checking**: Verify that required activity sequences occur in the correct order (e.g., "Purchase Order" must come before "Goods Receipt").
- **Process Compliance**: Ensure that approval activities directly precede execution activities with no intervening steps.
- **Variant Analysis**: Identify cases that follow specific process paths by checking if certain activities eventually follow others.
- **Root Cause Investigation**: Find cases where problematic sequences occurred (e.g., "Rework" following "Quality Check").
- **Concurrent Activity Detection**: Locate cases where activities happened at the same time or on the same date, which may indicate data quality issues or parallel processing.
- **Exception Handling**: Discover cases where escalation activities followed regular activities, indicating process problems.
## Settings
**Activity First**: The first activity in the sequence relationship. This is the activity that should occur before the second activity.
**Activity Follows**: The second activity in the sequence relationship. This is the activity that should follow the first activity according to the selected follow method.
**Follow Method**: Defines the type of relationship to check between the two activities:
- **Directly Follows**: The second activity must immediately follow the first with no activities in between
- **Eventually Follows**: The second activity must occur after the first at any point in the case
- **Same Times**: Both activities must occur at exactly the same timestamp
- **Same Dates**: Both activities must occur on the same calendar date
**Remove Filter**: When unchecked (default), returns cases that match the follow pattern. When checked, returns cases that do NOT match the pattern, effectively inverting the filter logic.
**Attribute Name** (optional): Specifies which event attribute column to analyze for activity names. If not provided, uses the default activity column from your event log.
**Compare Attribute Name** (optional): Adds an additional attribute comparison constraint when using Directly Follows or Eventually Follows methods. This enables more complex filtering scenarios.
**Use Date If No Time** (optional): When checked, uses date-based sorting for activities that lack time information. Only relevant for Directly Follows and Eventually Follows methods.
## Examples
### Example 1: Direct Sequence Verification
**Scenario**: You want to find all purchase orders where goods receipt directly follows the purchase order creation, with no activities in between. This helps identify the smoothest, fastest cases without complications.
**Settings**:
- Activity First: "Create Purchase Order"
- Activity Follows: "Goods Receipt"
- Follow Method: Directly Follows
- Remove Filter: Unchecked
**Result**: Returns only cases where "Goods Receipt" immediately follows "Create Purchase Order" with no intervening activities like approvals, changes, or holds.
**Insights**: These cases represent the ideal process flow. Comparing their characteristics (supplier, department, value) with cases that have additional steps reveals what factors enable smooth processing.
### Example 2: Eventual Relationship Detection
**Scenario**: You need to verify that all cases with a quality check activity eventually reached the delivery activity, regardless of how many steps occurred between them.
**Settings**:
- Activity First: "Quality Check"
- Activity Follows: "Deliver Order"
- Follow Method: Eventually Follows
- Remove Filter: Unchecked
**Result**: Returns all cases where "Deliver Order" occurred at any point after "Quality Check", even if there were rework, approvals, or other activities in between.
**Insights**: This confirms that quality-checked items were ultimately delivered. Cases missing from this filter result may indicate incomplete processing or cancelled orders after quality inspection.
### Example 3: Compliance Violation Detection
**Scenario**: You want to find cases where payment occurred without prior approval, which violates company policy. Using the inverted filter helps identify these non-compliant cases.
**Settings**:
- Activity First: "Approve Payment"
- Activity Follows: "Execute Payment"
- Follow Method: Directly Follows
- Remove Filter: Checked
**Result**: Returns cases where "Execute Payment" does NOT directly follow "Approve Payment", indicating either missing approvals or activities between approval and payment.
**Insights**: These cases represent potential compliance violations requiring investigation. They may reveal auto-payments, emergency processing, or gaps in approval workflows.
### Example 4: Same-Day Activity Analysis
**Scenario**: You want to identify cases where order creation and delivery happened on the same day, which may indicate expedited processing or data quality issues.
**Settings**:
- Activity First: "Create Order"
- Activity Follows: "Deliver Order"
- Follow Method: Same Dates
- Remove Filter: Unchecked
**Result**: Returns cases where both activities occurred on the same calendar date, regardless of the actual time difference.
**Insights**: Same-day order fulfillment may indicate:
- Express shipping requests
- Local deliveries with fast processing
- Emergency orders with special handling
- Potential timestamp errors if this pattern is unexpected
### Example 5: Concurrent Timestamp Detection
**Scenario**: You need to find cases where two different systems recorded activities at exactly the same timestamp, which could indicate data quality issues or batch processing.
**Settings**:
- Activity First: "System A Update"
- Activity Follows: "System B Update"
- Follow Method: Same Times
- Remove Filter: Unchecked
**Result**: Returns cases where both activities have identical timestamps down to the second.
**Insights**: Exact timestamp matches across different activities may reveal:
- Automated batch processes updating multiple systems
- Data import issues where timestamps weren't properly recorded
- Need for more precise timestamp granularity
- Integration problems between systems
### Example 6: Finding Cases Without Expected Sequences
**Scenario**: You want to identify cases where approval never eventually led to execution, which could indicate cancelled or stuck processes.
**Settings**:
- Activity First: "Approve Request"
- Activity Follows: "Execute Request"
- Follow Method: Eventually Follows
- Remove Filter: Checked
**Result**: Returns cases where "Execute Request" did NOT occur after "Approve Request" at any point in the case.
**Insights**: These cases represent approved requests that were never executed, potentially indicating:
- Cancelled approvals
- Cases stuck after approval
- Process breakdowns requiring intervention
- Approved requests awaiting execution
## Output
The filter returns a dataset containing only the cases that match (or don't match, if Remove Filter is checked) the specified sequential relationship. All events and attributes for each case are preserved in the filtered results. The number of cases in the output will typically be fewer than the input, as cases not meeting the criteria are removed.
If no cases match the specified sequence relationship, the filter returns an empty result set.
## Technical Notes
- **Filter Type**: Case-level filter (removes entire cases based on activity relationships)
- **Activity Matching**: Uses exact, case-sensitive string matching for activity names
- **Temporal Logic**: For Directly Follows and Eventually Follows, activities must exist in chronological order
- **Validation**: Automatically suggests similar activity names if specified activities are not found
- **Performance**: Optimized for efficient sequence detection even in cases with many activities
- **Both Activities Required**: Cases must contain both specified activities to be considered for inclusion (unless using inverted logic)
---
*This documentation is part of the mindzieStudio process mining platform.*
---
## Events Before Or After Activity
Section: Filters
URL: https://docs.mindziestudio.com/mindzie_studio/filters/events-before-or-after-activity
Source: /docs-master/mindzieStudio/filters/events-before-or-after-activity/page.md
# Events Before or After Activity
## Overview
The Events Before or After Activity filter selects or removes events based on their position relative to specific activities within each case. This powerful event-level filter allows you to focus on portions of your process by keeping only events that occur before, after, or between specified activities. You can analyze process segments, identify patterns in specific workflow stages, or remove irrelevant events that fall outside your area of interest.
## Common Uses
- Analyze events that occur before a critical milestone or decision point
- Focus on activities that happen after a specific process stage
- Extract process segments between two key activities
- Remove preliminary events to focus on core processing activities
- Identify patterns in post-approval or post-rejection workflows
- Study process behavior between start and end milestones
## Settings
**Activity Name:** The primary activity that serves as your reference point or boundary.
**Activity Name 2:** (For Between operations only) The second activity that defines the end boundary.
**Before/After Selection:** Choose the filtering mode that determines which events to keep or remove.
| Mode | Description | Example Use |
|------|-------------|-------------|
| Before | Events before the first occurrence of Activity | Analyze activities leading up to first approval |
| Before and Including | Events before and including first occurrence | Include approval in pre-approval analysis |
| After | Events after the last occurrence of Activity | Study post-completion follow-up activities |
| After and Including | Events after and including last occurrence | Include completion in post-completion analysis |
| Between | Events between first occurrence of two activities | Analyze processing between submission and approval |
| Between and Including | Events between and including both activities | Include boundaries in segment analysis |
**Remove Events:** Choose whether to keep the matching events or remove them.
- **Keep (false):** Returns only events that match the criteria
- **Remove (true):** Removes events that match the criteria, keeping everything else
## Examples
### Example 1: Analyzing Pre-Approval Activities
**Scenario:** You want to analyze all activities that occur before the first "Manager Approval" in your expense claim process to understand what preparation work happens before claims reach approval.
**Settings:**
- Activity Name: "Manager Approval"
- Before/After Selection: Before (not including)
- Remove Events: Keep (false)
**Result:**
For each case, only events occurring before the first "Manager Approval" are retained. Case #EXP-1234 might show "Submit Claim," "Attach Receipts," "Department Review," but not "Manager Approval" or anything after it. This lets you analyze the submission and preparation phase separately.
**Insights:** By isolating pre-approval activities, you can measure preparation time, identify bottlenecks in document collection, and understand which activities consistently precede approval. This helps optimize the submission phase of your workflow.
### Example 2: Studying Post-Rejection Activities
**Scenario:** When loan applications are rejected, you want to analyze what happens afterward - whether customers reapply, request appeals, or abandon the process. You need to focus only on events after the "Application Rejected" activity.
**Settings:**
- Activity Name: "Application Rejected"
- Before/After Selection: After (not including)
- Remove Events: Keep (false)
**Result:**
For each rejected case, only events occurring after the last "Application Rejected" are kept. Case #LOAN-5678 might show "Appeal Requested," "Additional Documents," "Manager Review," but not the rejection event itself or anything before it. This isolates the post-rejection workflow.
**Insights:** This reveals customer behavior after rejection and identifies opportunities for process improvement. You can measure how many customers reapply, how long they wait before appealing, and whether certain rejection types lead to more appeals.
### Example 3: Analyzing Processing Between Activities
**Scenario:** Your insurance claim process has a clear processing window between "Initial Assessment" and "Final Decision." You want to analyze only the activities that occur during this core processing phase, excluding preliminary and follow-up activities.
**Settings:**
- Activity Name: "Initial Assessment"
- Activity Name 2: "Final Decision"
- Before/After Selection: Between (not including)
- Remove Events: Keep (false)
**Result:**
For each case, only events between the first "Initial Assessment" and first "Final Decision" are retained, excluding both boundary activities. Case #CLM-9876 might show "Document Verification," "Expert Consultation," "Additional Information Request," but not the assessment or decision themselves.
**Insights:** This isolates your core claims processing activities, allowing you to measure processing efficiency, identify common investigation steps, and analyze bottlenecks in the evaluation phase without noise from preliminary or post-decision activities.
### Example 4: Removing Post-Completion Activities
**Scenario:** Your order fulfillment analysis should focus only on activities up to and including delivery. Events after "Delivered" like "Customer Survey" and "Feedback Collected" are important but should be excluded from fulfillment cycle time analysis.
**Settings:**
- Activity Name: "Delivered"
- Before/After Selection: After and Including (Delivered)
- Remove Events: Remove (true)
**Result:**
For each case, the "Delivered" event and everything after it are removed, keeping only the fulfillment activities. Case #ORD-4567 retains "Order Received," "Payment Processed," "Shipped" but removes "Delivered," "Survey Sent," and "Feedback Received."
**Insights:** By removing post-delivery activities, your cycle time calculations reflect actual fulfillment duration without including customer feedback collection. This provides accurate operational metrics while you can analyze feedback activities separately using a different filter configuration.
### Example 5: Complete Workflow Segment Analysis
**Scenario:** You want to analyze the complete approval workflow including both the "Approval Request Submitted" start point and "Final Approval Decision" end point, excluding everything outside this segment.
**Settings:**
- Activity Name: "Approval Request Submitted"
- Activity Name 2: "Final Approval Decision"
- Before/After Selection: Between and Including
- Remove Events: Keep (false)
**Result:**
For each case, events from the first "Approval Request Submitted" through the first "Final Approval Decision" are retained, including both boundary activities. This gives you the complete approval segment with clear start and end points.
**Insights:** Including both boundaries gives you complete approval workflow metrics including the activities that mark the beginning and end of the approval process. This is ideal for measuring total approval duration and analyzing the complete sequence of approval-related activities.
## Output
This filter operates at the event level and can significantly reshape your process log:
- **Before/After modes:** Find the first (Before) or last (After) occurrence of the specified activity
- **Between modes:** Find events between the first occurrence of Activity Name and Activity Name 2
- **Remove mode:** Inverts the selection (removes matching events instead of keeping them)
- Cases remain in the dataset even if events are removed
- Empty cases may result if all events are filtered out
- Event sequences and attributes are preserved for retained events
Use this filter to focus your analysis on specific process segments, understand behavior patterns before or after key milestones, or remove irrelevant events that fall outside your area of interest.
---
*This documentation is part of the mindzie Studio process mining platform.*
---
## Events With Attribute
Section: Filters
URL: https://docs.mindziestudio.com/mindzie_studio/filters/events-with-attribute
Source: /docs-master/mindzieStudio/filters/events-with-attribute/page.md
# Events with Attribute
## Overview
The Events with Attribute filter selects or removes individual events based on attribute values. This powerful filter operates at the event level, allowing you to filter by both event-level attributes (like activity name, resource, or timestamp) and case-level attributes (like customer type or region). It supports filtering by text, numbers, dates, durations, and boolean values using various comparison methods.
Unlike case-level filters that include or exclude entire cases, this filter evaluates each event individually and only affects the specific events that match your criteria - unless you filter by a case-level attribute, in which case all events from matching cases are affected.
## Common Uses
- Select all "Create Invoice" activity events to analyze invoice creation patterns
- Filter events performed by specific resources to review workload distribution
- Exclude events that occurred outside business hours using timestamp filtering
- Select high-value transaction events where item cost exceeds a threshold
- Find events with specific attribute values to investigate process variations
- Remove test data by filtering out events with test user identifiers
## Settings
**Attribute:** Select the attribute (column) you want to filter on. This can be any event-level attribute (like Activity Name, Resource, or Event Time) or case-level attribute (like Customer Type or Region). The filter automatically detects whether the attribute is at the event or case level.
**Compare Type:** Choose how to compare the attribute values. Available options depend on the data type of your selected attribute:
- **Text attributes:** Equal, Begins With, Ends With, Contains, Is One Of
- **Numeric attributes:** Equal, Greater Than, Greater Than or Equal, Less Than, Less Than or Equal, Is One Of
- **Date/time attributes:** Equal, Greater Than, Greater Than or Equal, Less Than, Less Than or Equal, Day Equal, Day Greater Than, Day Greater Than or Equal, Day Less Than, Day Less Than or Equal
- **Duration attributes:** Same as numeric, with additional time unit selection (Days, Hours, Minutes, Seconds, Milliseconds)
- **Boolean attributes:** Equal (True or False)
**Compare Value:** Specify the value to compare against. For "Is One Of" comparisons, you can select multiple values from a list. The value type must match your selected attribute's data type.
**Time Units:** (For duration attributes only) Specify the time unit for comparison - Days, Hours, Minutes, Seconds, or Milliseconds.
**Remove Selected Events:** When checked, the filter excludes events that match your criteria instead of including them. This inverts the filter logic without changing your comparison settings.
## Examples
### Example 1: Filter by Activity Name
**Scenario:** You want to analyze only the "Create Order" events in your order-to-cash process to understand order creation patterns.
**Settings:**
- Attribute: Activity Name
- Compare Type: Equal
- Compare Value: Create Order
- Remove Selected Events: Unchecked
**Result:** The filter selects all events where the activity is "Create Order". All other activity events are excluded from the analysis.
**Insights:** This allows you to focus your analysis on order creation, examine the resources involved, check timing patterns, and analyze any attributes specific to order creation events.
### Example 2: Select Events by Multiple Resources
**Scenario:** You want to review the work performed by your senior team members: John Doe, Jane Smith, and Bob Wilson.
**Settings:**
- Attribute: Resource
- Compare Type: Is One Of
- Compare Value: John Doe, Jane Smith, Bob Wilson
- Remove Selected Events: Unchecked
**Result:** The filter selects all events performed by any of the three specified resources. Events performed by other resources are excluded.
**Insights:** This helps you analyze the activities, throughput, and performance patterns of your senior team members compared to the rest of the team.
### Example 3: Filter High-Value Transaction Events
**Scenario:** You want to focus on events involving transactions over $1,000 to analyze high-value order handling.
**Settings:**
- Attribute: Item Cost
- Compare Type: Greater Than
- Compare Value: 1000
- Remove Selected Events: Unchecked
**Result:** Only events where the item cost exceeds $1,000 are selected for analysis.
**Insights:** This reveals how high-value transactions are processed differently from regular transactions, including which resources handle them, how long they take, and what additional steps might be involved.
### Example 4: Exclude Events Outside Business Hours
**Scenario:** You want to analyze only events that occurred during business hours (before 6 PM) to exclude after-hours processing.
**Settings:**
- Attribute: Event Time
- Compare Type: Less Than or Equal
- Compare Value: 18:00:00 (6 PM)
- Remove Selected Events: Unchecked
**Result:** Only events that occurred at or before 6 PM are included in the analysis.
**Insights:** This helps you understand the normal business-hours process flow without the noise of after-hours exceptions or batch processing.
### Example 5: Filter Events by Case-Level Attribute
**Scenario:** You want to analyze events only from cases belonging to Premium customers.
**Settings:**
- Attribute: Customer Type
- Compare Type: Equal
- Compare Value: Premium
- Remove Selected Events: Unchecked
**Result:** All events from cases where Customer Type equals "Premium" are selected. This includes all activities in those cases, even though you're filtering by a case-level attribute.
**Insights:** When filtering by case-level attributes, the filter affects all events in matching cases, allowing you to see the complete process flow for specific case types.
### Example 6: Select Events by Date Range
**Scenario:** You want to analyze only events that occurred in January 2024 to compare monthly performance.
**Settings:**
- Attribute: Event Time
- Compare Type: Day Greater Than or Equal
- Compare Value: 2024-01-01
- Additional filter needed: Day Less Than, value 2024-02-01
**Result:** Only events that occurred on dates from January 1-31, 2024 are selected (ignoring the time portion).
**Insights:** Using the Day comparison methods allows you to filter by calendar dates without worrying about exact timestamps, making date-range analysis simpler.
## Output
After applying the Events with Attribute filter:
- Events that match your criteria are included in the filtered event log (or excluded if "Remove Selected Events" is checked)
- Cases that no longer have any events are completely removed from the analysis
- Cases that still have some events remain, even if they lost some events due to filtering
- Your process map, statistics, and other analyses update to reflect only the filtered events
- The case count shown in mindzieStudio reflects the number of cases that still have at least one event after filtering
**Important:** Unlike case-level filters, this filter can result in partial cases - cases that have some events removed but still appear in the analysis with their remaining events. This is particularly useful when you want to analyze specific activities or events while maintaining the context of the cases they belong to.
---
*This documentation is part of the mindzie Studio process mining platform.*
---
## Filter List
Section: Filters
URL: https://docs.mindziestudio.com/mindzie_studio/filters/filter-list
Source: /docs-master/mindzieStudio/filters/filter-list/page.md
# Filter List
## Overview
The Filter List is a logical filter that combines multiple filters using AND logic, where a case must satisfy ALL filter conditions to be included in the results. This powerful case-level filter applies a sequence of filters one after another, with each filter operating on the results of the previous filter. Only cases that pass through all filters successfully remain in the final dataset, making it ideal for creating precise, multi-criteria filtering rules.
## Common Uses
- Apply multiple criteria that must all be satisfied simultaneously
- Create complex filtering logic with multiple required conditions
- Build sequential filtering pipelines where each filter narrows the dataset
- Combine different filter types to create precise inclusion rules
- Implement business rules requiring multiple simultaneous qualifications
- Create rigorous compliance or quality filters with multiple mandatory criteria
## Settings
**Filter List:** A collection of individual filters that will be applied sequentially using AND logic. Each filter in the list is applied to the results of the previous filter, so a case must pass all filters to remain in the final results.
**How it works:**
1. The first filter is applied to the original dataset
2. The second filter is applied to the results from the first filter
3. This continues sequentially through all filters in the list
4. Only cases that pass through all filters appear in the final results
**Note:** If no filters are in the list, the original dataset is returned unchanged. With just one filter, it behaves like that single filter.
## Examples
### Example 1: High-Value Regional Analysis
**Scenario:** You want to analyze high-value orders from the Eastern region only. Cases must be both from the Eastern region AND have order amounts exceeding $5,000. Both conditions are mandatory.
**Settings:**
- Filter 1: Cases with Attribute "Region" equals "Eastern"
- Filter 2: Cases with Attribute "Order Amount" greater than 5000
**Result:**
Only cases satisfying both conditions are included. Case #12345 from Eastern with $8,000 amount is included (passes both). Case #67890 from Eastern with $2,000 amount is excluded (fails amount test). Case #11111 from Western with $10,000 amount is excluded (fails region test). If you had 1,000 cases total with 300 Eastern cases, and 80 of those Eastern cases exceed $5,000, your result contains 80 cases.
**Insights:** This provides focused analysis on your target segment - high-value Eastern region orders. You can measure performance for this specific combination, identify best practices for handling high-value regional business, and optimize processing for this important customer segment.
### Example 2: Completed High-Priority Cases
**Scenario:** You want to analyze only high-priority cases that have been completed, to measure how well your organization handled priority cases through to completion. Cases must be both Priority = "High" AND Status = "Completed."
**Settings:**
- Filter 1: Cases with Attribute "Priority" equals "High"
- Filter 2: Cases with Attribute "Status" equals "Completed"
**Result:**
Only completed high-priority cases are included. Case #ABC with Priority = "High" and Status = "Completed" is included (both conditions met). Case #DEF with Priority = "High" and Status = "In Progress" is excluded (not completed). Case #GHI with Priority = "Low" and Status = "Completed" is excluded (not high priority).
**Insights:** This shows you how high-priority cases performed when they reached completion. You can measure cycle time for completed priority cases, identify whether priority cases got faster processing, and analyze resource allocation effectiveness for your most important cases.
### Example 3: Recent Manufacturing Quality Cases
**Scenario:** Your quality analysis should focus on recent manufacturing cases from the past 90 days that also had quality inspections performed. You need cases within the date range AND containing the "Quality Inspection" activity.
**Settings:**
- Filter 1: Time Period filter for last 90 days
- Filter 2: Cases containing Activity "Quality Inspection"
**Result:**
Only cases from the past 90 days that also include quality inspection events are retained. Recent cases without quality inspections are excluded. Older cases with quality inspections are also excluded. This gives you a focused dataset of recent, quality-checked production.
**Insights:** By combining recency with quality inspection requirement, you analyze current quality practices rather than historical or incomplete data. This shows whether quality inspection rates are improving and how recent quality-checked cases perform compared to historical data.
### Example 4: Complex Compliance Filtering
**Scenario:** Compliance audit requires cases meeting multiple criteria - they must be from regulated industries, exceed the regulatory threshold, involve specific high-risk countries, and include manager approval. All four conditions are mandatory for audit inclusion.
**Settings:**
- Filter 1: Cases with Attribute "Industry" is one of ["Banking", "Healthcare", "Insurance"]
- Filter 2: Cases with Attribute "Transaction Amount" greater than 10000
- Filter 3: Cases with Attribute "Country" is one of ["Country X", "Country Y", "Country Z"]
- Filter 4: Cases containing Activity "Manager Approval"
**Result:**
Only cases passing all four filters are included in the audit sample. This might be a small subset (perhaps 2-3% of total cases), but these are precisely the cases requiring detailed regulatory review. Each filter eliminates cases not meeting that specific criterion, resulting in a highly focused compliance dataset.
**Insights:** This creates a precise audit population matching exact regulatory requirements. You ensure audit resources focus on genuinely relevant cases while documenting that your filtering logic matches regulatory criteria. Sequential AND logic guarantees no cases slip through that fail any single criterion.
### Example 5: Resource-Specific Performance Analysis
**Scenario:** You want to analyze cases handled entirely by experienced resources in the Claims department that were also completed within SLA. Cases must meet all three conditions - correct department, resource experience level, and SLA compliance.
**Settings:**
- Filter 1: Cases with Attribute "Department" equals "Claims"
- Filter 2: Cases with Attribute "Resource Experience" equals "Senior"
- Filter 3: Cases with Attribute "SLA Compliance" equals "Met"
**Result:**
Only Claims department cases, handled by senior resources, that met SLA are included. This focused dataset shows optimal performance - experienced resources handling departmental work within target timeframes. Cases failing any single criterion are excluded.
**Insights:** This reveals performance when all optimal conditions are met - right department, experienced staff, successful outcome. You can use this as a benchmark for expected performance and compare it against cases where one or more conditions weren't met, helping identify which factors most impact performance.
## Output
This filter operates at the case level using sequential AND logic:
- Applies filters one after another in sequence
- Each filter operates on the results of the previous filter
- Only cases passing all filters appear in final results
- Dataset size progressively decreases (or stays the same) through the filter sequence
- Preserves all case and event attributes for included cases
- Returns original dataset if no filters are in the list
- More restrictive than OR filter - fewer cases typically pass through
Use Filter List when you need cases to meet multiple simultaneous conditions, creating precise filtering rules that ensure all criteria are satisfied before including cases in your analysis.
---
*This documentation is part of the mindzie Studio process mining platform.*
---
## Keep Events With Same Value As Case Attribute
Section: Filters
URL: https://docs.mindziestudio.com/mindzie_studio/filters/keep-events-with-same-value-as-case-attribute
Source: /docs-master/mindzieStudio/filters/keep-events-with-same-value-as-case-attribute/page.md
# Keep Events with Same Value as Case Attribute
## Overview
The Keep Events with Same Value as Case Attribute filter compares event-level attributes with case-level attributes to retain only matching events. This specialized event-level filter removes events from cases where the event attribute value doesn't match the corresponding case attribute value, then returns only cases that have at least one matching event. It's particularly useful for filtering events by organizational context, geographical regions, or business rules where event characteristics must align with case-level properties.
## Common Uses
- Keep only events handled by resources from the same region as the case
- Filter events to match case-level business rules or constraints
- Retain events where the processing location matches the case origin
- Focus on events performed by the designated department for each case
- Remove events handled by incorrect organizational units
- Ensure event-level assignments align with case-level routing rules
## Settings
**Case Column Name:** The name of the case attribute to use as the reference value.
**Event Column Name:** The name of the event attribute to compare against the case attribute.
**Keep Event If Null:** Choose whether to keep events where the event attribute is null.
- **Keep null events (true):** Events with null values in the event column are retained, along with matching events
- **Remove null events (false):** Only events with non-null values that exactly match the case attribute are kept
| Setting | Purpose | Example Value |
|---------|---------|---------------|
| Case Column Name | Reference attribute at case level | "Customer Region" |
| Event Column Name | Attribute to compare at event level | "Processing Region" |
| Keep Event If Null | Handle null event values | True or False |
## Examples
### Example 1: Filtering Events by Regional Alignment
**Scenario:** Your customer support process assigns cases to regions based on customer location. However, sometimes support agents from other regions handle tickets due to workload balancing. You want to analyze only events where the "Agent Region" matches the "Customer Region" to measure regional performance accurately.
**Settings:**
- Case Column Name: "Customer Region"
- Event Column Name: "Agent Region"
- Keep Event If Null: False
**Result:**
For each case, only events where the agent's region matches the customer's region are kept. Case #SUP-1234 with Customer Region = "Northeast" keeps events handled by Northeast agents but removes events handled by Southeast or Western agents. Cases with no matching events are excluded entirely from the results.
**Insights:** This shows you true regional performance where agents handled cases from their own regions. By filtering out cross-region handling, you can measure how efficiently each region serves its own customers and identify whether certain regions consistently need help from other regions.
### Example 2: Analyzing Department-Specific Workflows
**Scenario:** Your approval workflow routes cases to specific departments based on request type. You want to analyze only events performed by the designated department for each case to understand how well departmental routing works when followed correctly.
**Settings:**
- Case Column Name: "Assigned Department"
- Event Column Name: "Processing Department"
- Keep Event If Null: True
**Result:**
For each case, events where the processing department matches the assigned department are retained. Case #REQ-5678 with Assigned Department = "Finance" keeps all Finance department activities. Events with null Processing Department values are also kept, which might represent automated system activities. Cases without any matching events are removed from the analysis.
**Insights:** This reveals how often cases stay within their assigned department versus being escalated or transferred. By including null events, you retain system activities while focusing on departmental alignment. This helps identify cases that required cross-departmental collaboration and measure single-department processing efficiency.
### Example 3: Validating Location-Based Processing Rules
**Scenario:** Your manufacturing process has a business rule that parts must be processed at facilities in the same country where the order originated for regulatory compliance. You want to verify this rule is being followed by keeping only events where "Processing Country" matches "Order Country."
**Settings:**
- Case Column Name: "Order Country"
- Event Column Name: "Processing Country"
- Keep Event If Null: False
**Result:**
For each order, only processing events that occurred in the same country as the order origin are retained. Order #MFG-9876 from Germany keeps only events processed at German facilities, removing any events processed in other countries. Orders with all events filtered out indicate complete rule violations.
**Insights:** This provides compliance validation by showing which orders were processed entirely within the correct country. Orders that disappear from the filtered data indicate rule violations that need investigation. You can quickly identify and remedy compliance issues before they become regulatory problems.
### Example 4: Analyzing Resource Assignment Accuracy
**Scenario:** Your project management system assigns team members to projects based on their skill set. Each case has "Required Skill Level" and each activity has "Resource Skill Level." You want to analyze only work performed by appropriately skilled resources.
**Settings:**
- Case Column Name: "Required Skill Level"
- Event Column Name: "Resource Skill Level"
- Keep Event If Null: True
**Result:**
For each project case, only activities performed by resources with the matching skill level are retained. Project #PROJ-4567 requiring "Senior" skill keeps only events performed by Senior-level resources. Events with null skill levels (perhaps automated or unassigned activities) are kept because Keep Event If Null is true.
**Insights:** This shows you what portion of work is performed by appropriately skilled resources versus over-skilled or under-skilled assignments. By analyzing these filtered cases, you can measure productivity when skill levels are correctly matched and identify patterns in skill mismatches that affect project efficiency.
## Output
This filter operates at both event and case levels with unique behavior:
- **Event-level filtering:** Removes events where the event attribute doesn't match the case attribute
- **Case-level result:** Returns only cases that have at least one matching event
- Non-matching events are removed from all cases
- Cases with zero matching events are completely excluded from results
- When Keep Event If Null is true, events with null values in the event column are retained
- When Keep Event If Null is false, only exact non-null matches are kept
- All other event and case attributes are preserved
Use this filter to ensure event-level activities align with case-level rules, validate organizational routing, or focus analysis on correctly assigned work while identifying exceptions.
---
*This documentation is part of the mindzie Studio process mining platform.*
---
## Or Filter
Section: Filters
URL: https://docs.mindziestudio.com/mindzie_studio/filters/or-filter
Source: /docs-master/mindzieStudio/filters/or-filter/page.md
# Or Filter
## Overview
The Or Filter is a logical filter that combines multiple filters using OR logic, where a case is included if it matches ANY of the individual filter conditions. This powerful case-level filter allows you to create complex filtering scenarios by combining different filter types into a single operation. Instead of a case needing to satisfy all conditions (AND logic), it only needs to satisfy at least one condition to be included in the results.
## Common Uses
- Include cases from multiple regions or business units in a single analysis
- Select cases that meet any of several different priority or value criteria
- Combine different attribute conditions to capture exception cases
- Create flexible filtering rules where multiple paths lead to inclusion
- Build complex business rules with multiple qualifying conditions
- Identify cases that satisfy any of several compliance or quality criteria
## Settings
**Filter List:** A collection of individual filters that will be combined using OR logic. Each filter in the list represents a condition, and a case is included if it matches ANY of these conditions.
**How it works:**
1. Each filter in the list is evaluated independently against the original dataset
2. Results from all filters are combined using set union (OR logic)
3. Duplicate cases are automatically removed
4. The final result includes any case that matched at least one filter condition
**Note:** You need at least 2 filters in the list for meaningful OR operation. With fewer than 2 filters, the original dataset is returned unchanged.
## Examples
### Example 1: Multi-Region Analysis
**Scenario:** You want to analyze orders from both the Eastern and Western sales regions. Instead of running two separate analyses or using a complex attribute filter, you can use an OR filter to include cases from either region.
**Settings:**
- Filter 1: Cases with Attribute "Region" equals "Eastern"
- Filter 2: Cases with Attribute "Region" equals "Western"
**Result:**
Any case where Region = "Eastern" OR Region = "Western" is included in the results. Case #12345 from Eastern region is included, Case #67890 from Western region is included, but Case #11111 from Northern region is excluded. If you had 1,000 cases total with 300 Eastern and 250 Western, your result would contain 550 cases.
**Insights:** This lets you compare and analyze multiple regions together while excluding others. You can identify best practices from high-performing regions, compare processing patterns between regions, and measure combined performance of specific geographical areas.
### Example 2: Priority or High-Value Cases
**Scenario:** Your analysis should include both high-priority cases (Priority = "High") and high-value cases (Order Amount > $10,000), as both types require special attention regardless of the other characteristic.
**Settings:**
- Filter 1: Cases with Attribute "Priority" equals "High"
- Filter 2: Cases with Attribute "Order Amount" greater than 10000
**Result:**
Any case marked as high priority OR with order amount exceeding $10,000 is included. Case #ABC with Priority = "High" and Amount = $5,000 is included (high priority). Case #DEF with Priority = "Medium" and Amount = $15,000 is included (high value). Case #GHI with Priority = "High" and Amount = $12,000 is included (matches both). Low-priority, low-value cases are excluded.
**Insights:** This captures all cases requiring special handling for any reason, whether due to customer importance (priority) or financial significance (value). You can analyze resource allocation for VIP cases and measure whether high-priority or high-value cases receive faster processing.
### Example 3: Multiple Status Conditions
**Scenario:** You want to analyze cases in any active state - those that are "In Progress," "Pending Review," or "Awaiting Approval." Any of these statuses indicates an active case that needs attention.
**Settings:**
- Filter 1: Cases with Attribute "Status" equals "In Progress"
- Filter 2: Cases with Attribute "Status" equals "Pending Review"
- Filter 3: Cases with Attribute "Status" equals "Awaiting Approval"
**Result:**
Cases with any of the three active statuses are included. Case #100 with Status = "In Progress" is included, Case #200 with Status = "Awaiting Approval" is included, but Case #300 with Status = "Completed" is excluded. This gives you a complete view of active workload across all active states.
**Insights:** By combining multiple active statuses, you can analyze current workload comprehensively, identify bottlenecks in any active phase, and measure overall active case duration without needing to analyze each status separately.
### Example 4: Exception Case Identification
**Scenario:** You want to identify exception cases that require investigation - those that took longer than 30 days OR had more than 50 events OR were handled by more than 5 different resources.
**Settings:**
- Filter 1: Cases with Case Duration greater than 30 days
- Filter 2: Cases with Event Count greater than 50
- Filter 3: Cases with Unique Resource Count greater than 5
**Result:**
Any case meeting at least one exception criterion is included. Case #AAA with 45-day duration is included (long). Case #BBB with 65 events is included (many events). Case #CCC with 8 different resources is included (many handoffs). Normal cases meeting none of these criteria are excluded.
**Insights:** This identifies problematic cases that exhibit any form of exceptional behavior requiring investigation. You can analyze what makes these cases different, identify common patterns among exception cases, and develop strategies to prevent or handle exceptional situations more effectively.
### Example 5: Compliance or Audit Criteria
**Scenario:** Your audit process needs to review cases that meet any of several risk indicators - cases from restricted countries, cases above the approval threshold without manager approval, or cases flagged by the fraud detection system.
**Settings:**
- Filter 1: Cases with Attribute "Country" is one of ["Country A", "Country B", "Country C"]
- Filter 2: Cases with Attribute "Amount" greater than 50000 AND "Manager Approval" equals "No"
- Filter 3: Cases with Attribute "Fraud Flag" equals "Yes"
**Result:**
Any case triggering at least one risk indicator is included for audit review. This could be 5% of total cases, but these are the highest-risk cases requiring detailed examination. The OR logic ensures you capture all cases requiring attention for any reason.
**Insights:** By combining multiple risk indicators with OR logic, you create a comprehensive audit population without missing edge cases. This ensures thorough compliance coverage while focusing audit resources on cases with genuine risk indicators rather than reviewing everything.
## Output
This filter operates at the case level using union logic:
- Evaluates each constituent filter independently against the original dataset
- Combines all results using set union (no duplicates)
- Returns any case that matched at least one filter condition
- Preserves all case and event attributes for included cases
- Requires at least 2 filters for meaningful operation
- Returns original dataset if fewer than 2 filters are provided
Use OR filters to create flexible, comprehensive filtering rules where multiple different conditions can lead to case inclusion, making it ideal for capturing diverse scenarios in a single analysis.
---
*This documentation is part of the mindzie Studio process mining platform.*
---
## Process Variants
Section: Filters
URL: https://docs.mindziestudio.com/mindzie_studio/filters/process-variants
Source: /docs-master/mindzieStudio/filters/process-variants/page.md
# Process Variants
## Overview
The Process Variants filter selects or removes cases based on the frequency of their process variants. A process variant represents a unique sequence of activities that cases follow through the process. This filter enables you to focus on the most common process paths or identify outlier behavior by filtering cases according to variant frequency.
The filter operates at the case level, keeping or removing entire cases based on their variant ranking. You can select top variants by count (e.g., top 5 variants), by case percentage (e.g., variants representing 80% of cases), or by variant percentage (e.g., top 20% of variants). This makes it valuable for process standardization, Pareto analysis, and outlier detection.
## Common Uses
- **Process Standardization**: Focus analysis on the most common process paths to understand and optimize standard workflows.
- **Pareto Analysis**: Identify the small number of variants that handle the majority of cases to prioritize improvement efforts.
- **Outlier Detection**: Remove common variants to analyze exceptional cases and understand deviation patterns.
- **Process Simplification**: Reduce complexity by filtering to top variants, making process maps and analysis more readable.
- **Compliance Analysis**: Focus on standard variants to validate compliance, then analyze excluded cases for deviations.
- **Performance Benchmarking**: Compare performance metrics between the most common variants and less frequent paths.
## Settings
**Filter Mode**: Determines how top variants are selected. Three modes are available:
- **Variant Count**: Select the top N most frequent variants by count (e.g., 3 = top 3 variants)
- **Case Percent**: Select variants that account for a specified percentage of total cases (e.g., 0.5 = 50% of cases)
- **Variant Percent**: Select a specified percentage of the most frequent variants (e.g., 0.25 = top 25% of variants)
**Threshold Value**: The threshold value interpreted based on the Filter Mode:
- For Variant Count: Number of top variants to select (e.g., 3 for top 3 variants)
- For Case Percent: Percentage of cases to include (e.g., 0.5 for 50%)
- For Variant Percent: Percentage of variants to include (e.g., 0.25 for top 25%)
**Remove Filter**: When unchecked (default), selects cases matching the criteria. When checked, removes cases matching the criteria, returning only cases that don't match. This allows outlier analysis by excluding the most common variants.
## Examples
### Example 1: Focus on Top 3 Most Common Variants
**Scenario**: Your process has 50 different variants, but you want to focus on just the three most common paths to simplify analysis and identify the standard process flow.
**Settings**:
- Filter Mode: Variant Count
- Threshold Value: 3
- Remove Filter: Unchecked
**Result**: The filter keeps only cases from the top 3 most frequent process variants, removing all cases that follow other variants.
**Insights**: This dramatically simplifies process maps and calculators by focusing on the paths most cases follow. If these 3 variants represent 70% of cases, you can optimize these standard paths first for maximum impact.
### Example 2: Analyze Variants Representing 80% of Cases
**Scenario**: You want to apply the Pareto principle (80/20 rule) to your process by focusing on the variants that handle 80% of cases.
**Settings**:
- Filter Mode: Case Percent
- Threshold Value: 0.8
- Remove Filter: Unchecked
**Result**: The filter accumulates variants from most to least frequent until reaching 80% of total cases, keeping all cases from those variants.
**Insights**: This typically reveals that a small percentage of variants (perhaps 10-15%) handle the majority of cases. You can focus process improvements on these high-volume paths while treating less frequent variants as exceptions.
### Example 3: Select Top 25% of Variants by Frequency
**Scenario**: You have 100 different process variants and want to analyze the top quartile to understand common process patterns.
**Settings**:
- Filter Mode: Variant Percent
- Threshold Value: 0.25
- Remove Filter: Unchecked
**Result**: The filter selects the top 25 most frequent variants (25% of 100), keeping all cases that follow these variants.
**Insights**: This provides a middle ground between selecting by case percentage and variant count, useful when you want to analyze a proportional sample of variant diversity.
### Example 4: Identify Outlier Cases
**Scenario**: You want to find exceptional or unusual cases by excluding the two most common process variants.
**Settings**:
- Filter Mode: Variant Count
- Threshold Value: 2
- Remove Filter: Checked
**Result**: The filter removes cases from the top 2 most frequent variants, keeping only cases that follow less common paths.
**Insights**: This helps identify unusual process behavior, potential workarounds, exceptions, or edge cases that may require special handling or indicate process problems.
### Example 5: Focus on the "Happy Path"
**Scenario**: You want to analyze only cases following the single most common process variant to establish a baseline for the ideal process flow.
**Settings**:
- Filter Mode: Variant Count
- Threshold Value: 1
- Remove Filter: Unchecked
**Result**: The filter keeps only cases following the most frequent process variant, removing all other cases.
**Insights**: This reveals the "happy path" - the most common way cases flow through the process. You can use this to establish performance benchmarks and understand what the standard process looks like without deviations.
### Example 6: Analyze the Long Tail
**Scenario**: You want to examine rare variants by excluding the common ones that account for 90% of cases.
**Settings**:
- Filter Mode: Case Percent
- Threshold Value: 0.9
- Remove Filter: Checked
**Result**: The filter removes variants representing 90% of cases, keeping only the remaining 10% from rare variants.
**Insights**: This reveals the "long tail" of rare process variations. These cases may represent errors, special handling, or edge cases that need investigation. Understanding why these variants exist can help prevent them or improve exception handling.
## Output
The filter returns a dataset containing cases that match the selected criteria. All cases are complete with their full activity sequences and attributes - the filter operates at the case level and does not remove individual events.
The filtered dataset can be used with calculators to analyze variant-specific performance, duration, or other metrics. When Remove Filter is checked, the output contains the complement set, showing cases that don't match the selection criteria.
## Technical Notes
- **Filter Type**: Case-level filter (removes entire cases, not individual events)
- **Variant Definition**: A variant is the unique sequence of activities in a case, regardless of timing or other attributes
- **Frequency Ordering**: Variants are ordered by case count from most to least frequent
- **Threshold Handling**: For Variant Count mode, if the threshold exceeds available variants, it's capped to the total variant count
- **Empty Results**: If no variants match the criteria, the filter returns an empty dataset
---
*This documentation is part of the mindzieStudio process mining platform.*
---
## Remove Activity Loops
Section: Filters
URL: https://docs.mindziestudio.com/mindzie_studio/filters/remove-activity-loops
Source: /docs-master/mindzieStudio/filters/remove-activity-loops/page.md
# Remove Activity Loops
## Overview
The Remove Activity Loops filter simplifies process traces by eliminating duplicate activity occurrences within cases. This filter helps clean your event data by removing repetitive activities that can make process analysis more complex. You can choose to remove only consecutive duplicates (activities that repeat back-to-back) or all duplicates throughout the entire case, keeping only the first occurrence of each unique activity.
This filter is particularly valuable when analyzing processes where activities are recorded multiple times due to system logging behavior, data quality issues, or genuine process loops that you want to simplify for clearer analysis.
## Common Uses
- **Process Visualization**: Simplify process maps by removing activity loops that make process flows difficult to understand and analyze.
- **Data Quality Improvement**: Clean event logs where system errors or integration issues cause duplicate activity recordings.
- **Variant Analysis**: Reduce the number of process variants by eliminating loop-based variations and focusing on core process paths.
- **Performance Measurement**: Get more accurate duration metrics by removing duplicate activities that artificially inflate processing times.
- **Compliance Analysis**: Identify the essential sequence of activities without repetitions to check conformance to standard processes.
- **Process Mining Preparation**: Prepare cleaner datasets for process discovery and conformance checking algorithms.
## Settings
**Deduplication Method**: Choose how duplicate activities should be identified and removed:
- **Directly Follows Deduplication**: Removes only consecutive duplicate activities. If the same activity appears multiple times in a row, only the first occurrence is kept. Non-consecutive duplicates are preserved. For example, "A, B, B, C, D, D, D" becomes "A, B, C, D".
- **Global Deduplication**: Removes all duplicate activities throughout the entire case, keeping only the first occurrence of each unique activity. For example, "A, C, B, C, D" becomes "A, C, B, D" (the second "C" is removed even though it wasn't consecutive).
## Examples
### Example 1: Simplifying Consecutive System Logs
**Scenario**: Your order fulfillment system logs the "Check Inventory" activity multiple times consecutively when processing large orders, creating noise in your process analysis. You want to simplify these consecutive duplicates while preserving the overall process flow.
**Settings**:
- Deduplication Method: Directly Follows Deduplication
**Result**: Cases with consecutive duplicate activities are simplified. For example, if a case had the sequence "Create Order, Check Inventory, Check Inventory, Check Inventory, Pick Items, Pack Order", it becomes "Create Order, Check Inventory, Pick Items, Pack Order". Non-consecutive duplicates remain unchanged.
**Insights**: This approach is ideal when you want to clean up logging artifacts while preserving genuine process loops. If "Check Inventory" appears again later in the process (not consecutively), it would be kept because it represents a different process step.
### Example 2: Finding True Process Paths
**Scenario**: Your customer service process has multiple review activities, and cases often loop back through the same activities. You want to identify the unique activities performed in each case without considering how many times they were repeated.
**Settings**:
- Deduplication Method: Global Deduplication
**Result**: All cases are reduced to their unique activity sequences. A case like "Open Ticket, Assign Agent, Review, Escalate, Review, Resolve" becomes "Open Ticket, Assign Agent, Review, Escalate, Resolve". Every duplicate activity is removed, keeping only the first occurrence.
**Insights**: This is useful for understanding which activities were performed in each case without considering frequency. It helps identify the essential process steps and can reveal the minimal path through your process.
### Example 3: Cleaning Data Entry Errors
**Scenario**: Manual data entry in your approval process sometimes results in the same approval activity being recorded twice in succession due to user error or system refresh issues.
**Settings**:
- Deduplication Method: Directly Follows Deduplication
**Result**: Consecutive duplicate approvals are removed while preserving cases where genuine re-approvals occurred after other activities. For example, "Submit, Approve, Approve" becomes "Submit, Approve", but "Submit, Approve, Modify, Approve" remains unchanged.
**Insights**: This cleans data quality issues without distorting the process. Legitimate multiple approvals (separated by other activities) are preserved, while obvious errors are removed.
### Example 4: Variant Reduction for Analysis
**Scenario**: Your process has many variants due to activity loops, making it difficult to identify core process patterns. You want to reduce variant count by focusing on which activities occur rather than how many times.
**Settings**:
- Deduplication Method: Global Deduplication
**Result**: Process variants are consolidated based on unique activity sequences. Multiple variants that differ only in loop iterations collapse into single variants. This can dramatically reduce your variant count from hundreds to dozens.
**Insights**: Simplifying to unique activities helps identify core process patterns and makes process discovery more meaningful. You can later analyze the filtered-out cases separately to understand loop behavior.
## Output
The filter returns a modified dataset containing the same cases with deduplicated event sequences. Each case maintains its original case-level attributes and metadata, but the events within each case are filtered according to the selected deduplication method.
- **Directly Follows Deduplication**: Returns cases with consecutive duplicates removed. Events are preserved unless they immediately follow an event with the same activity name.
- **Global Deduplication**: Returns cases with only the first occurrence of each unique activity. All subsequent events with the same activity name are removed, regardless of their position in the case.
All removed events are excluded from the result, and the remaining events maintain their original timestamps and attributes.
---
*This documentation is part of the mindzieStudio process mining platform.*
---
## Remove Activity With Same Date
Section: Filters
URL: https://docs.mindziestudio.com/mindzie_studio/filters/remove-activity-with-same-date
Source: /docs-master/mindzieStudio/filters/remove-activity-with-same-date/page.md
# Remove Activity with Same Date
## Overview
The Remove Activity with Same Date filter removes specific activity events from cases when they occur on the same calendar day as another specified activity. This event-level filter is designed to clean process logs by eliminating redundant or secondary activities that happen on the same day as a primary activity. You specify which activity to remove and which activity to use as the reference date comparison.
## Common Uses
- Remove redundant validation steps when primary approval happens on the same day
- Clean logs by eliminating duplicate processing activities on the same calendar day
- Filter out secondary notification events that occur on the same day as primary notifications
- Remove follow-up activities when they happen on the same day as the initial activity
- Clean up process logs where alternative paths were logged on the same day
- Simplify process flows by removing same-day redundant activities
## Settings
**Activity to Remove:** The name of the activity you want to remove from cases.
**Activity to Compare To:** The reference activity for date comparison. If this activity exists on the same calendar day as the activity to remove, the removal activity is filtered out.
| Setting | Purpose | Example Value |
|---------|---------|---------------|
| Activity to Remove | Specifies which activity events to remove | "Secondary Check" |
| Activity to Compare To | Reference activity for date comparison | "Primary Validation" |
## Examples
### Example 1: Removing Redundant Validation Steps
**Scenario:** Your loan approval process has both "Automated Credit Check" and "Manual Credit Review" activities. When both occur on the same day, it means the manual review caught issues immediately, making the automated check redundant in the log. You want to remove "Automated Credit Check" events that occur on the same day as "Manual Credit Review."
**Settings:**
- Activity to Remove: "Automated Credit Check"
- Activity to Compare To: "Manual Credit Review"
**Result:**
Any "Automated Credit Check" event that occurs on the same calendar day as a "Manual Credit Review" event in the same case is removed. For example, if Case #LOAN-5678 has "Automated Credit Check" at 9:00 AM on October 15 and "Manual Credit Review" at 2:00 PM on October 15, the automated check is removed from the log. If they occur on different days, both activities are retained.
**Insights:** This simplifies your process flow by removing redundant automated checks when manual review happened the same day. The resulting log better represents the actual decision-making workflow, showing manual review as the primary validation method for these cases while preserving cases where only automated checks occurred.
### Example 2: Eliminating Duplicate Notifications
**Scenario:** Your customer service system sends both "Email Notification" and "SMS Alert" when a ticket is resolved. For analysis purposes, you only want to track the primary "Email Notification" and remove "SMS Alert" events that occur on the same day, as they represent the same business event.
**Settings:**
- Activity to Remove: "SMS Alert"
- Activity to Compare To: "Email Notification"
**Result:**
Any "SMS Alert" event that occurs on the same calendar day as an "Email Notification" event is removed. If Case #TICKET-123 has "Email Notification" on October 15 and "SMS Alert" also on October 15, the SMS alert is removed. Cases where SMS alerts occur on different days than email notifications retain both events.
**Insights:** By removing same-day duplicate notifications, you get a cleaner view of unique customer communications without double-counting notification events. This provides more accurate counts of customer touchpoints and simplifies process flow visualization.
### Example 3: Cleaning Alternative Process Paths
**Scenario:** Your invoice processing workflow has both "Standard Approval" and "Express Approval" paths. When both occur on the same day, it means the invoice was initially routed to standard approval but then expedited. You want to remove "Standard Approval" events when "Express Approval" happens the same day to show only the final approval method.
**Settings:**
- Activity to Remove: "Standard Approval"
- Activity to Compare To: "Express Approval"
**Result:**
Any "Standard Approval" event that occurs on the same calendar day as an "Express Approval" event is removed from the case. If Case #INV-9876 has "Standard Approval" at 10:00 AM and "Express Approval" at 3:00 PM on the same day, the standard approval is removed, showing only the express approval that actually processed the invoice.
**Insights:** This clarifies process paths by showing the actual approval method used rather than intermediate routing steps. Your process mining visualization becomes cleaner, showing express approval as the single approval activity for these cases while preserving standard approval for cases that didn't get expedited.
### Example 4: Removing Same-Day Follow-Up Activities
**Scenario:** Your support ticket system logs both "Ticket Assigned" and "Agent Follow-Up" activities. When both occur on the same day, the follow-up is part of the initial assignment process rather than a separate activity. You want to remove "Agent Follow-Up" events when they happen on the same day as "Ticket Assigned."
**Settings:**
- Activity to Remove: "Agent Follow-Up"
- Activity to Compare To: "Ticket Assigned"
**Result:**
Any "Agent Follow-Up" event occurring on the same calendar day as "Ticket Assigned" is removed. If Case #SUP-4567 has "Ticket Assigned" on October 10 and "Agent Follow-Up" also on October 10, the follow-up is removed. Follow-ups on subsequent days are retained as they represent separate touchpoints.
**Insights:** This distinguishes between immediate follow-ups (part of assignment) and delayed follow-ups (separate process steps). Your process metrics become more accurate, showing true follow-up rates while eliminating same-day activities that are really part of initial assignment.
## Output
This filter operates at the event level, removing individual events from cases:
- Only the specified "Activity to Remove" events are affected
- Events are removed if they occur on the same calendar day as the reference activity
- Comparison uses calendar dates only (ignores time of day)
- Cases remain in the dataset even if events are removed
- All other event attributes and properties are preserved
- If no events match the removal criteria, the original data is returned unchanged
Use this filter to clean process logs by removing redundant or secondary activities that occur on the same calendar day as primary activities, simplifying process flows and providing clearer insights into actual business operations.
---
*This documentation is part of the mindzie Studio process mining platform.*
---
## Remove Activity With Similar Time
Section: Filters
URL: https://docs.mindziestudio.com/mindzie_studio/filters/remove-activity-with-similar-time
Source: /docs-master/mindzieStudio/filters/remove-activity-with-similar-time/page.md
# Remove Activity with Similar Time
## Overview
The Remove Activity with Similar Time filter removes specific activity events from cases when they occur within a defined time window of another activity. This event-level filter is designed to clean process logs by eliminating redundant or duplicate activities that happen too close together in time. You specify which activity to remove, which activity to compare against (or all other activities), and the maximum time difference that triggers removal.
## Common Uses
- Remove duplicate or redundant activities that occur within seconds or minutes of each other
- Clean logs by eliminating automatic retry events that happen immediately after failures
- Remove redundant notification events that fire too close to their triggering activities
- Filter out duplicate data entry activities logged within a short time window
- Clean up process logs where the same activity was mistakenly logged multiple times
- Remove follow-up activities that occur too quickly after initial activities
## Settings
**Activity to Remove:** The name of the activity you want to remove from cases.
**Activity to Compare To:** The reference activity to compare timing against. Leave empty to compare against all other activities.
**Duration Threshold:** The maximum time difference between events. If the activity to remove occurs within this time window after the reference activity, it will be removed.
| Setting | Purpose | Example Value |
|---------|---------|---------------|
| Activity to Remove | Specifies which activity events to remove | "Email Notification" |
| Activity to Compare To | Reference activity for timing comparison | "Order Confirmed" or leave empty |
| Duration Threshold | Maximum time gap that triggers removal | "00:05:00" (5 minutes) |
## Examples
### Example 1: Removing Duplicate Email Notifications
**Scenario:** Your order management system sometimes sends duplicate email notifications within minutes of order confirmation. These duplicate "Email Sent" events clutter your process log and don't represent meaningful process steps. You want to remove "Email Sent" events that occur within 5 minutes of the "Order Confirmed" activity.
**Settings:**
- Activity to Remove: "Email Sent"
- Activity to Compare To: "Order Confirmed"
- Duration Threshold: "00:05:00" (5 minutes)
**Result:**
Any "Email Sent" event that occurs within 5 minutes after an "Order Confirmed" event in the same case is removed. For example, if Case #12345 has "Order Confirmed" at 10:00:00 AM and "Email Sent" at 10:02:30 AM, the email event is removed. If another case has "Email Sent" at 10:08:00 AM (8 minutes later), that email event is kept because it's outside the 5-minute window.
**Insights:** This cleans your process log by removing redundant notification events that always follow order confirmation closely. The remaining email events represent legitimate separate communications, while duplicate notifications are filtered out, giving you a cleaner view of actual process flow.
### Example 2: Eliminating Automatic Retry Events
**Scenario:** Your payment processing system automatically retries failed transactions within 30 seconds. These automatic "Retry Payment" events are system-generated and should be removed from analysis, keeping only manual retry attempts that occur later.
**Settings:**
- Activity to Remove: "Retry Payment"
- Activity to Compare To: "Payment Failed"
- Duration Threshold: "00:00:30" (30 seconds)
**Result:**
Any "Retry Payment" event occurring within 30 seconds after "Payment Failed" is removed from the log. If Case #PAY-789 has "Payment Failed" at 2:15:00 PM and "Retry Payment" at 2:15:15 PM, the retry is removed. Manual retries attempted hours later remain in the log.
**Insights:** By filtering out automatic system retries, you can focus on meaningful payment processing steps and manual interventions. This provides accurate cycle times and helps identify cases requiring human intervention versus automatic recovery.
### Example 3: Removing Redundant Status Checks
**Scenario:** Your application logs a "Status Check" activity that sometimes happens immediately after any other activity due to automated monitoring. You want to remove "Status Check" events that occur within 1 second of any other activity, as these are automated system checks rather than meaningful process steps.
**Settings:**
- Activity to Remove: "Status Check"
- Activity to Compare To: (leave empty to compare against all activities)
- Duration Threshold: "00:00:01" (1 second)
**Result:**
Any "Status Check" event that occurs within 1 second after any other activity is removed. For example, if Case #APP-456 has "Document Upload" at 11:30:00.000 AM and "Status Check" at 11:30:00.500 AM (500 milliseconds later), the status check is removed. Status checks that occur more than 1 second after the previous activity are retained.
**Insights:** This eliminates automated system monitoring events that clutter your process log, keeping only intentional status checks initiated by users or scheduled processes. Your process visualization becomes cleaner and more representative of actual business activities.
### Example 4: Cleaning Duplicate Data Entry
**Scenario:** During a data migration, some "Update Customer Info" activities were mistakenly logged twice within the same minute. You want to remove these duplicate update events to clean your historical data.
**Settings:**
- Activity to Remove: "Update Customer Info"
- Activity to Compare To: (leave empty)
- Duration Threshold: "00:01:00" (1 minute)
**Result:**
Any "Update Customer Info" event that occurs within 1 minute after any other activity in the same case is removed. This catches duplicate entries that happened during the migration. If Case #CUST-321 has two "Update Customer Info" events at 3:45:00 PM and 3:45:30 PM, the second one is removed.
**Insights:** This helps clean historical data from migration issues or double-entry errors. By removing near-simultaneous duplicates, you get a more accurate representation of actual customer information updates and cleaner process metrics.
## Output
This filter operates at the event level, removing individual events from cases:
- Only the specified "Activity to Remove" events are affected
- Events are removed if they occur AFTER reference events within the time threshold
- Time comparison is directional (only looks at events occurring after reference events)
- Cases remain in the dataset even if events are removed
- All other event attributes and properties are preserved
- If no events match the removal criteria, the original data is returned unchanged
Use this filter to clean process logs by removing redundant, duplicate, or system-generated activities that occur too close in time to meaningful process steps.
---
*This documentation is part of the mindzie Studio process mining platform.*
---
## Remove Data From Underactive Periods
Section: Filters
URL: https://docs.mindziestudio.com/mindzie_studio/filters/remove-data-from-underactive-periods
Source: /docs-master/mindzieStudio/filters/remove-data-from-underactive-periods/page.md
# Remove Data from Underactive Periods
## Overview
The Remove Data from Underactive Periods filter automatically trims the beginning and end of your process log by identifying and removing low-activity periods. This intelligent case-level filter calculates daily event frequencies, determines average activity levels, and removes cases that fall in "warm-up" or "wind-down" periods where event volumes are below your specified thresholds. It's particularly useful for eliminating startup and shutdown periods when analyzing steady-state process operations.
## Common Uses
- Remove system warm-up periods from the start of process logs
- Eliminate wind-down periods at the end of data collection timeframes
- Focus analysis on steady-state operations excluding ramp-up phases
- Clean logs from pilot programs before full rollout
- Remove low-activity periods during system migrations or transitions
- Trim data collection periods that don't represent normal operations
## Settings
**Start Factor:** A multiplier applied to the mean daily event count to determine the threshold for the first day to include. Days are included once daily activity exceeds StartFactor times the mean.
**End Factor:** A multiplier applied to the mean daily event count to determine the threshold for the last day to include. Days are included while daily activity exceeds EndFactor times the mean.
| Setting | Purpose | Typical Values | Effect |
|---------|---------|----------------|--------|
| Start Factor | Controls how aggressively to trim the beginning | 0.1 - 0.5 | Lower = more lenient, Higher = more aggressive trimming |
| End Factor | Controls how aggressively to trim the ending | 0.1 - 0.5 | Lower = more lenient, Higher = more aggressive trimming |
**How it works:**
1. Calculates the number of events per day across the entire log
2. Computes the mean (average) daily event count
3. Finds the first day where activity exceeds (Start Factor x Mean)
4. Finds the last day where activity exceeds (End Factor x Mean)
5. Removes all cases that fall outside this date range
## Examples
### Example 1: Removing System Launch Period
**Scenario:** Your new order management system was launched on January 1st, but only a few pilot users were active in the first two weeks while the system was being validated. You want to remove this low-activity launch period and focus analysis on normal operations that began in mid-January.
**Settings:**
- Start Factor: 0.3
- End Factor: 0.1
**Result:**
The filter calculates that your mean daily event count is 500 events/day. With Start Factor = 0.3, it looks for the first day with at least 150 events (30% of mean). Days in early January with only 20-80 events are excluded. The analysis begins on January 14th when activity reached 150+ events. End trimming is minimal with End Factor = 0.1, removing only the very last days if activity dropped below 50 events/day.
**Insights:** This removes the pilot phase from your analysis, ensuring metrics reflect actual operational performance rather than early testing. Your cycle times, variant frequencies, and bottleneck analysis now represent real steady-state operations after the system was fully adopted.
### Example 2: Cleaning Year-End Data Collection
**Scenario:** Your data collection ended on December 31st, but activity naturally decreased in late December as staff took holiday time off. You also had a slow start in early January as operations ramped up. You want to analyze only the core operational period with normal staffing.
**Settings:**
- Start Factor: 0.2
- End Factor: 0.2
**Result:**
With balanced start and end factors, the filter trims both low-activity periods. If your mean daily events was 800, days with fewer than 160 events are excluded from both ends. The holiday slowdown in late December (maybe 50-100 events/day) is removed, as is the slow January ramp-up, leaving only fully-staffed operational periods for analysis.
**Insights:** Your analysis now reflects normal operational capacity without seasonal anomalies. Metrics like average case duration and resource utilization represent typical performance rather than being skewed by holiday periods with skeleton staff coverage.
### Example 3: Analyzing Mature System Operations
**Scenario:** You're analyzing a system that has been in production for years, but you want to exclude the most recent few days which might have incomplete data or ongoing cases. You want aggressive trimming at the start but gentle trimming at the end.
**Settings:**
- Start Factor: 0.5
- End Factor: 0.1
**Result:**
With Start Factor = 0.5, only days reaching at least 50% of mean activity are included from the start, aggressively cutting any slow periods. With End Factor = 0.1, almost all recent days are kept as long as they have at least 10% of mean activity. This gives you a mature operational period without cutting too much recent data.
**Insights:** The aggressive start trimming ensures you're analyzing a fully mature system, while the gentle end trimming preserves recent data for trend analysis. This balance is ideal when you have years of historical data and want to focus on recent stable operations.
### Example 4: Conservative Trimming for Complete Analysis
**Scenario:** You want to include as much data as possible while removing only the most extreme low-activity periods at the beginning and end of your log. You're analyzing a process with naturally variable activity levels and don't want to lose valid operational data.
**Settings:**
- Start Factor: 0.1
- End Factor: 0.1
**Result:**
With both factors at 0.1, only days with less than 10% of mean daily events are excluded. If mean daily events is 1000, only days with fewer than 100 events are trimmed. This conservative approach removes only the most obvious warm-up and wind-down periods while preserving all normal operational periods, even those with lower activity.
**Insights:** This minimal trimming ensures you don't lose valuable data from naturally quieter periods like weekends or holidays that are still legitimate operational time. Use this when your process has high variability or when you need comprehensive historical coverage.
## Output
This filter operates at the case level and uses date-based filtering:
- Automatically calculates optimal start and end dates based on activity thresholds
- Removes entire cases that fall outside the calculated date range
- Preserves all cases within the active period unchanged
- Does not modify event data, only filters cases by date
- Returns original data if activity calculation is not possible
The resulting dataset focuses on steady-state operations, excluding low-activity startup and shutdown periods that could skew your process mining analysis.
---
*This documentation is part of the mindzie Studio process mining platform.*
---
## Select Variants
Section: Filters
URL: https://docs.mindziestudio.com/mindzie_studio/filters/select-variants
Source: /docs-master/mindzieStudio/filters/select-variants/page.md
# Select Variants
## Overview
The Select Variants filter allows you to manually select specific process variants (activity sequences) from your event log. A variant represents a unique path through your business process - the specific sequence of activities that a case follows from start to finish. This filter keeps only the cases that match your selected variants, enabling you to focus your analysis on specific process behaviors or patterns that are relevant to your investigation.
This filter is particularly powerful when you want to analyze a subset of process paths without the complexity of the entire process, or when you've identified specific variants through exploratory analysis and want to examine them in detail.
## Common Uses
- **Conformance Analysis**: Select only the standard process variants to analyze how the "happy path" performs, excluding deviations.
- **Deviation Investigation**: Choose only non-standard variants to investigate why certain cases followed unusual process paths.
- **Performance Comparison**: Select specific variants to compare their performance metrics (duration, cost, resource usage).
- **Process Improvement**: Focus on high-frequency variants that represent the majority of your cases to maximize improvement impact.
- **Root Cause Analysis**: Isolate problematic variants (e.g., those with rework loops) to understand their root causes.
- **Process Documentation**: Select representative variants to document different process scenarios for training or compliance purposes.
## Settings
**Variant Names**: Select one or more process variants from the list. Each variant is displayed as a sequence of activities (e.g., "Create Order -> Approve Order -> Ship Order"). The list typically shows frequency information to help you identify the most common or relevant variants. You must select at least one variant for the filter to work.
> **Note**: The variant selection uses exact string matching with the case's variant property. Variants are case-sensitive and must match exactly.
## Examples
### Example 1: Analyzing Standard Purchase Order Process
**Scenario**: You want to analyze only purchase orders that followed the standard approval path, excluding expedited orders and those with rejections or rework.
**Settings**:
- Variant Names: ["Create PO -> Approve PO -> Send to Vendor -> Receive Goods -> Pay Invoice"]
**Result**: The filter keeps only cases that exactly match this variant sequence, removing all cases that followed different paths (such as those with additional approval steps, rejections, or skipped activities).
**Insights**: This allows you to establish baseline performance metrics for the standard process, such as average processing time and resource utilization, without the noise of exceptions and deviations.
### Example 2: Investigating Rework Cases
**Scenario**: You've identified several variants that contain rework loops and want to investigate why these cases required rework.
**Settings**:
- Variant Names:
- "Submit Claim -> Review Claim -> Request Info -> Submit Info -> Review Claim -> Approve Claim"
- "Submit Claim -> Review Claim -> Request Info -> Submit Info -> Review Claim -> Request Info -> Submit Info -> Review Claim -> Approve Claim"
**Result**: The filter returns only cases that followed these specific rework patterns, where additional information was requested one or more times.
**Insights**: By isolating these rework cases, you can analyze common attributes (claim type, reviewer, amount) to identify the root causes of rework and develop strategies to reduce it.
### Example 3: Comparing Fast-Track vs. Standard Processing
**Scenario**: Your process has both a standard path and a fast-track path for urgent orders. You want to compare their performance separately.
**Settings** (for fast-track analysis):
- Variant Names: ["Create Order -> Fast Track Approval -> Immediate Ship -> Express Delivery"]
**Result**: The filter keeps only cases that used the fast-track process.
**Insights**: You can now calculate the true cost and duration of fast-track processing separately from standard orders, helping you make informed decisions about when fast-tracking is justified.
### Example 4: Focusing on Top 3 Process Variants
**Scenario**: After running the Variant DNA calculator, you discovered that 3 variants account for 80% of all cases. You want to focus your improvement efforts on these high-volume paths.
**Settings**:
- Variant Names:
- "A -> B -> C -> D" (45% of cases)
- "A -> B -> E -> D" (25% of cases)
- "A -> C -> D" (10% of cases)
**Result**: The filter keeps the 80% of cases that follow these three common paths, removing the long tail of infrequent variants.
**Insights**: This focused view allows you to optimize the processes that affect the majority of your cases, maximizing the return on your improvement initiatives.
## Output
The filter returns a new dataset containing only the cases whose process variant matches one of the selected variant names. Each returned case preserves all its original events, attributes, and timestamps.
If no cases match any of the selected variants, the filter returns an empty result set.
## Technical Notes
- **Filter Type**: Case-level filter (removes entire cases, not individual events)
- **Variant Matching**: Uses exact string matching with the case's variant property
- **Selection Logic**: Cases are kept if they match ANY of the specified variant names (OR logic)
- **Validation**: The filter requires at least one variant to be selected and will throw an error if the variant list is empty
- **Helper Methods**: The filter provides helper methods to retrieve all unique variants and detailed variant information including frequency data
---
*This documentation is part of the mindzieStudio process mining platform.*
---
## Selected Activity Frequency
Section: Filters
URL: https://docs.mindziestudio.com/mindzie_studio/filters/selected-activity-frequency
Source: /docs-master/mindzieStudio/filters/selected-activity-frequency/page.md
# Selected Activity Frequency
## Overview
The Selected Activity Frequency filter identifies cases based on how many times a specific activity occurs within each case. This case-level filter counts activity occurrences and compares them against a threshold using various comparison operators (greater than, less than, equal to, etc.). The filter is invaluable for detecting rework patterns, repeated activities, quality issues, and process inefficiencies where activities occur more or less frequently than expected.
Unlike filters that check for activity presence or absence, this filter focuses on frequency patterns, allowing you to find cases with excessive repetition or insufficient activity occurrences. It supports both inclusion mode (keep cases matching the criteria) and exclusion mode (remove cases matching the criteria).
## Common Uses
- **Rework Detection**: Identify cases where approval or review activities were repeated multiple times, indicating rework or process inefficiencies.
- **Quality Analysis**: Find cases with multiple quality check activities, suggesting potential quality issues or excessive scrutiny.
- **Exception Handling**: Locate cases with frequent error-handling activities, highlighting problematic cases requiring attention.
- **Process Compliance**: Ensure certain activities occur exactly once or within acceptable frequency ranges for regulatory compliance.
- **Anomaly Detection**: Discover cases with unusual activity repetition patterns that deviate from normal process flow.
- **Efficiency Optimization**: Identify cases requiring multiple iterations of the same task, revealing bottlenecks or process improvement opportunities.
## Settings
**Activity**: Select the activity name you want to count occurrences of within each case. The dropdown menu shows available activity names with their frequency statistics.
**Comparison Operator**: Choose how to compare the activity count against the threshold:
- **Greater than**: Find cases where the activity occurs more than N times
- **Less than**: Find cases where the activity occurs fewer than N times
- **Equal to**: Find cases where the activity occurs exactly N times
- **Greater than or equal to**: Find cases where the activity occurs N or more times
- **Less than or equal to**: Find cases where the activity occurs N or fewer times
- **Not equal to**: Find cases where the activity occurs any number of times except N
**Count Threshold**: Enter the number to compare against (e.g., 1, 2, 3).
**Keep/Remove**: Choose whether to keep cases matching the criteria or remove them.
> **Note**: Activity name comparison is case-sensitive and requires exact matching. The filter's validation system will suggest corrections for misspelled activity names.
## Examples
### Example 1: Finding Cases with Multiple Approvals
**Scenario**: You want to identify purchase orders where the "Approve Purchase Order" activity occurred more than once, indicating rework or multiple approval rounds.
**Settings**:
- Activity: "Approve Purchase Order"
- Comparison Operator: Greater than
- Count Threshold: 1
- Keep/Remove: Keep matching cases
**Result**: The filter returns cases where "Approve Purchase Order" occurred 2 or more times.
**Insights**: These cases may indicate:
- Initial approval rejections requiring resubmission
- Changes to purchase orders requiring re-approval
- Process inefficiencies in the approval workflow
- Training opportunities for approvers
- Potential cost impacts from delayed approvals
### Example 2: Excluding Excessive Resubmissions
**Scenario**: You want to remove cases where "Submit Application" occurred more than 3 times, as these represent outliers with excessive resubmissions that may distort your analysis.
**Settings**:
- Activity: "Submit Application"
- Comparison Operator: Greater than
- Count Threshold: 3
- Keep/Remove: Remove matching cases
**Result**: The filter excludes cases with 4 or more "Submit Application" activities, keeping only cases with 0-3 submissions.
**Insights**: This helps:
- Focus analysis on typical cases
- Remove extreme outliers
- Identify a separate cohort for special investigation
- Improve average performance metrics
### Example 3: Verifying Single Payment Transactions
**Scenario**: You need to ensure that "Process Payment" occurred exactly once per case, as multiple payments could indicate refunds, corrections, or data quality issues.
**Settings**:
- Activity: "Process Payment"
- Comparison Operator: Equal to
- Count Threshold: 1
- Keep/Remove: Keep matching cases
**Result**: The filter returns only cases with exactly one "Process Payment" activity.
**Insights**: Cases excluded from this filter (with 0 or 2+ payments) should be investigated for:
- Missing payment activities
- Duplicate payment processing
- Refund or correction scenarios
- Data quality problems
### Example 4: Identifying Cases Requiring Quality Intervention
**Scenario**: Find cases where "Quality Check" occurred more than twice, suggesting products with quality issues requiring multiple inspections.
**Settings**:
- Activity: "Quality Check"
- Comparison Operator: Greater than
- Count Threshold: 2
- Keep/Remove: Keep matching cases
**Result**: The filter selects cases with 3 or more "Quality Check" activities.
**Insights**: These cases may reveal:
- Products with recurring quality defects
- Supplier quality issues
- Process capability problems
- Need for root cause analysis
- Training requirements for production staff
### Example 5: Finding Cases with At Least One Occurrence
**Scenario**: Identify all cases where "Send Reminder" occurred at least once, regardless of exact frequency.
**Settings**:
- Activity: "Send Reminder"
- Comparison Operator: Greater than
- Count Threshold: 0
- Keep/Remove: Keep matching cases
**Result**: The filter returns cases containing the "Send Reminder" activity one or more times.
**Insights**: This shows:
- Cases requiring follow-up reminders
- Customer responsiveness patterns
- Communication effectiveness
- Potential process delays
### Example 6: Excluding Cases Without Activity
**Scenario**: Remove cases where "Customer Contacted" never occurred (appears 0 times).
**Settings**:
- Activity: "Customer Contacted"
- Comparison Operator: Less than or equal to
- Count Threshold: 0
- Keep/Remove: Remove matching cases
**Result**: The filter removes cases with 0 occurrences of "Customer Contacted", keeping only cases where customer contact happened at least once.
**Insights**: This ensures your analysis focuses on cases with customer interaction, excluding:
- Automated processing cases
- System-generated cases
- Internal-only workflows
## Output
The filter returns a new dataset containing only the cases that match the specified frequency criteria. Each returned case preserves all its original events and attributes. The specified activity may appear 0, 1, or multiple times depending on the filter criteria.
If no cases match the criteria, the filter returns an empty result set.
The output can be further analyzed to understand patterns in activity repetition, such as:
- Average number of repetitions in matching cases
- Time between repeated activity occurrences
- Correlation between activity frequency and other attributes
- Impact of activity repetition on case duration or cost
---
*This documentation is part of the mindzieStudio process mining platform.*
---
## Single Activity Cases
Section: Filters
URL: https://docs.mindziestudio.com/mindzie_studio/filters/single-activity-cases
Source: /docs-master/mindzieStudio/filters/single-activity-cases/page.md
# Single Activity Cases
## Overview
The Single Activity Cases filter removes cases from your process log that contain only one event. This filter is designed to help you focus on complete process flows by excluding incomplete cases, system errors, or data quality issues that appear as single-event cases. By filtering out these single-step instances, you can analyze multi-step workflows more effectively and get more accurate insights into your actual process execution.
## Common Uses
- Remove incomplete case instances before analyzing process variants
- Clean data by excluding cases that may represent system errors or failed transactions
- Focus analysis on cases that represent actual multi-step process flows
- Improve process mining accuracy by removing noise from single-event entries
- Prepare data for workflow optimization by excluding isolated activities
- Enhance variant analysis by ensuring all cases have meaningful process sequences
## Settings
This filter has no configurable settings. It automatically removes all cases that contain exactly one event, keeping only cases with two or more events.
## Examples
### Example 1: Removing Incomplete Order Cases
**Scenario:** Your order fulfillment process should have multiple steps (Order Received, Payment Processed, Items Picked, Shipped, Delivered). However, some cases only show "Order Received" with no follow-up events, indicating incomplete or abandoned orders.
**Settings:**
- No settings required - filter automatically removes single-event cases
**Result:**
All cases with only one event are removed from the dataset. For example, if you had 1,000 cases total and 150 cases contained only "Order Received" with no other events, those 150 cases would be filtered out, leaving 850 multi-step cases for analysis.
**Insights:** This filter helps you focus on orders that progressed through your workflow, excluding abandoned or incomplete transactions. This gives you a clearer picture of your actual fulfillment process performance without noise from incomplete cases.
### Example 2: Cleaning Quality Check Data
**Scenario:** Your manufacturing process includes multiple quality checkpoints. Some cases show only a single quality check event, possibly representing spot checks or data entry errors, while complete manufacturing cases show the full production sequence.
**Settings:**
- No settings required - filter automatically removes single-event cases
**Result:**
Cases containing only one quality check event are excluded. If your dataset had 500 cases with 75 single-event quality checks, those 75 cases are removed, leaving 425 complete manufacturing cases that went through the full production workflow.
**Insights:** By removing single-event cases, you can analyze the complete manufacturing workflow without noise from isolated quality checks. This provides more accurate cycle times, bottleneck analysis, and variant frequencies.
### Example 3: Preparing Customer Journey Analysis
**Scenario:** Your customer journey data includes multiple touchpoints (Website Visit, Product View, Add to Cart, Checkout, Purchase). Some sessions only have "Website Visit" with no further interaction, while complete journeys show multiple steps.
**Settings:**
- No settings required - filter automatically removes single-event cases
**Result:**
All single-event sessions (bounce visits) are removed from your analysis. If you had 10,000 customer sessions with 4,500 single-event bounces, those are filtered out, leaving 5,500 multi-touchpoint journeys for analysis.
**Insights:** This filter lets you focus on engaged customer journeys that involved multiple interactions, excluding bounces and single-page visits. This provides better insights into how customers actually navigate through your conversion funnel.
## Output
This filter removes entire cases from your dataset. After applying the filter:
- All cases with exactly one event are excluded from the results
- All cases with two or more events remain in the dataset
- The total case count decreases by the number of single-event cases
- Event sequences and timestamps remain unchanged for retained cases
- All case and event attributes are preserved for multi-event cases
The filtered dataset contains only cases that represent actual process flows with multiple steps, making it ideal for process variant analysis, bottleneck detection, and workflow optimization.
---
*This documentation is part of the mindzie Studio process mining platform.*
---
## Text Search
Section: Filters
URL: https://docs.mindziestudio.com/mindzie_studio/filters/text-search
Source: /docs-master/mindzieStudio/filters/text-search/page.md
# Text Search
## Overview
The Text Search filter performs comprehensive text-based searching across your process data, allowing you to find cases or events containing specific text, numbers, or values. This intelligent filter automatically detects the data type of your search term (string, number, boolean, date) and searches through compatible columns in both case attributes and event attributes. It supports case-sensitive and case-insensitive searches, and can return either complete cases or individual matching events.
The filter is particularly powerful for exploratory analysis when you need to quickly find all occurrences of a specific value (like an order number, customer name, or error code) anywhere in your process data without needing to know which specific attribute contains it.
## Common Uses
- **Quick Search**: Rapidly locate cases or events containing a specific order number, invoice ID, or customer name without knowing which column it appears in.
- **Error Investigation**: Find all cases mentioning specific error codes, error messages, or exception text scattered across different attributes.
- **Customer Analysis**: Search for a customer name or ID across all customer-related fields to see their complete process history.
- **Value Tracing**: Track specific values (like part numbers, product codes, or account numbers) throughout the process regardless of which attribute contains them.
- **Data Validation**: Identify cases containing unexpected or incorrect values by searching for specific patterns or text.
- **Multi-Attribute Search**: Search across many attributes simultaneously without creating multiple individual filters.
## Settings
**Search Text**: The text, number, or value you want to search for. The filter automatically detects whether this is a string, integer, decimal number, boolean, or date/time value and searches through compatible column types accordingly. For text searches, the search looks for partial matches (contains).
**Search Source**: Determines where to search for the text:
- **Cases and Events** (default): Searches both case-level attributes and event-level attributes
- **Cases**: Searches only case-level attributes (case properties)
- **Events**: Searches only event-level attributes (activity properties)
**Filter Type**: Controls what the filter returns when searching events:
- **Case**: Returns complete cases that contain at least one matching event
- **Event**: Returns only the individual events that match the search criteria
**Case Sensitive**: When enabled, the search requires exact case matching. When disabled (default), the search is case-insensitive.
**Remove Filter**: When enabled, returns cases/events that do NOT match the search criteria instead of those that do match. This inverts the filter logic.
## Examples
### Example 1: Finding a Specific Order Number
**Scenario**: You need to find all data related to order number "ORD-12345" but you're not sure which attributes contain the order number (it might appear in OrderID, ReferenceNumber, CustomerOrderNumber, etc.).
**Settings**:
- Search Text: "ORD-12345"
- Search Source: Cases and Events
- Filter Type: Case
- Case Sensitive: No
- Remove Filter: No
**Result**: The filter returns all cases where "ORD-12345" appears in any case or event attribute, giving you the complete process history for that order.
**Insights**: This rapid search capability eliminates the need to manually check multiple attributes or create multiple filters. You instantly see all process data related to the order regardless of where the order number was recorded.
### Example 2: Investigating Error Messages
**Scenario**: Your system logs error messages in various fields, and you want to find all cases that encountered the error "Connection timeout" anywhere in the process.
**Settings**:
- Search Text: "Connection timeout"
- Search Source: Events
- Filter Type: Case
- Case Sensitive: No
- Remove Filter: No
**Result**: The filter returns all cases that have at least one event with "Connection timeout" in any event attribute.
**Insights**: This helps you:
- Identify how many cases were affected by this specific error
- Analyze patterns in when the error occurs
- See what activities or process paths lead to the timeout
- Determine the impact on case duration and outcomes
### Example 3: Finding High-Value Transactions
**Scenario**: You want to find all cases containing transactions over 10000 in any numeric field (amount, value, cost, price, etc.).
**Settings**:
- Search Text: "10000"
- Search Source: Cases and Events
- Filter Type: Case
- Case Sensitive: No
- Remove Filter: No
**Result**: The filter automatically detects "10000" as a numeric value and searches through all integer and decimal columns, returning cases where any numeric field contains values matching or containing 10000.
**Insights**: This broad numeric search helps identify high-value cases even when the value might be stored in different attributes across different process types or activities.
### Example 4: Excluding Test Cases
**Scenario**: Your event log contains test cases with "TEST" or "test" in various attributes, and you want to exclude all of them from your analysis.
**Settings**:
- Search Text: "test"
- Search Source: Cases and Events
- Filter Type: Case
- Case Sensitive: No
- Remove Filter: Yes
**Result**: The filter returns all cases that do NOT contain "test" in any attribute, effectively removing all test cases from your analysis.
**Insights**: The inverted logic (Remove Filter = Yes) provides a quick way to clean your data by removing unwanted cases without needing to know exactly which fields contain test markers.
### Example 5: Finding Events with Specific Resource
**Scenario**: You want to see only the individual events performed by a specific user "John Smith" across all cases, not the complete cases.
**Settings**:
- Search Text: "John Smith"
- Search Source: Events
- Filter Type: Event
- Case Sensitive: No
- Remove Filter: No
**Result**: The filter returns only the individual events that contain "John Smith" in any event attribute. Each returned event shows what activities this specific resource performed.
**Insights**: By using Filter Type = Event instead of Case, you get granular visibility into exactly what this resource did, which is useful for:
- Resource performance analysis
- Workload assessment
- Compliance checking
- Training needs identification
### Example 6: Case-Sensitive Document Type Search
**Scenario**: Your process uses document type codes where capitalization matters (e.g., "PO" for Purchase Order vs "po" for internal reference), and you need to find only cases with the official "PO" designation.
**Settings**:
- Search Text: "PO"
- Search Source: Cases
- Filter Type: Case
- Case Sensitive: Yes
- Remove Filter: No
**Result**: The filter returns only cases where "PO" appears with exact capitalization in case attributes, excluding cases with "po", "Po", or "pO".
**Insights**: Case-sensitive searching ensures precision when your data uses capitalization for semantic distinction, preventing false matches from similar but different values.
## Output
The filter returns a filtered dataset based on your settings:
- When **Filter Type = Case**: Returns complete cases (with all their events) where the search text was found in at least one attribute
- When **Filter Type = Event**: Returns only the individual events that match the search criteria
- When **Remove Filter = Yes**: Inverts the logic, returning cases/events that do NOT match the search criteria
The search automatically adapts based on the data type of your search text:
- **Text strings**: Searches all text columns using partial matching (contains)
- **Integers**: Searches integer, decimal, and text columns
- **Decimals**: Searches decimal and text columns
- **Booleans**: Searches boolean, decimal, and text columns
- **Dates/Times**: Searches text columns only
## Technical Notes
- **Filter Type**: Can operate at case level or event level depending on settings
- **Performance**: Optimized with automatic data type detection and targeted column selection
- **Search Behavior**: Uses "contains" matching for strings, allowing partial matches
- **Null Handling**: Null values are ignored and never match any search text
- **Data Type Detection**: Automatically converts search text to the most appropriate data type for optimal matching
- **Column Selection**: Intelligently selects which columns to search based on detected data type
---
*This documentation is part of the mindzieStudio process mining platform.*
---
## Time Between Activities
Section: Filters
URL: https://docs.mindziestudio.com/mindzie_studio/filters/time-between-activities
Source: /docs-master/mindzieStudio/filters/time-between-activities/page.md
# Time Between Activities
## Overview
The Time Between Activities filter selects cases based on the duration between two specific activities. This case-level filter calculates the time difference between a selected occurrence (first or last) of one activity and a selected occurrence (first or last) of another activity, then applies comparison logic to filter cases. The filter is useful for identifying cases with unusual processing times, detecting bottlenecks, ensuring compliance with time-based service level agreements (SLAs), and analyzing process performance.
The time calculation always uses the formula: (ActivityName2.Time - ActivityName1.Time), regardless of which activity occurred first chronologically. Cases where either activity is not found are automatically excluded from the results.
## Common Uses
- **SLA Compliance**: Identify cases where time between request and fulfillment exceeds SLA thresholds.
- **Bottleneck Detection**: Find cases with unusually long durations between process stages.
- **Fast-Track Identification**: Discover cases processed exceptionally quickly between key milestones.
- **Process Efficiency Analysis**: Compare time between activities across different case categories.
- **Quality Investigation**: Find cases where insufficient time elapsed between steps (potential quality shortcuts).
- **Workflow Optimization**: Analyze time patterns between activities to identify improvement opportunities.
## Settings
**First Activity Name**: Select the first activity in the time calculation. You can choose whether to use the first or last occurrence of this activity if it appears multiple times in a case.
**First Activity Occurrence**: Choose whether to use the First or Last occurrence of the first activity within each case.
**Second Activity Name**: Select the second activity in the time calculation. The time difference is calculated as the second activity's timestamp minus the first activity's timestamp.
**Second Activity Occurrence**: Choose whether to use the First or Last occurrence of the second activity within each case.
**Comparison Method**: Select how to compare the calculated time difference:
- Equal: Time difference exactly matches the specified value
- Greater Than: Time difference exceeds the specified value
- Greater Than or Equal: Time difference is at least the specified value
- Less Than: Time difference is below the specified value
- Less Than or Equal: Time difference does not exceed the specified value
- Between: Time difference falls within a specified range (inclusive minimum, exclusive maximum)
**Compare Value / Time Range**: Depending on the comparison method, specify either a single time threshold or minimum and maximum time boundaries.
## Examples
### Example 1: Finding Cases with Excessive Order-to-Delivery Time
**Scenario**: You want to identify purchase orders where the time from order creation to delivery exceeded 10 days, which violates your standard delivery SLA.
**Settings**:
- First Activity Name: "Create Order"
- First Activity Occurrence: First
- Second Activity Name: "Deliver Order"
- Second Activity Occurrence: Last
- Comparison Method: Greater Than
- Compare Value: 10 days
**Result**: The filter returns only cases where more than 10 days elapsed between the first "Create Order" event and the last "Deliver Order" event.
**Insights**: These cases represent SLA violations that may require investigation into supply chain delays, vendor performance issues, or processing bottlenecks.
### Example 2: Detecting Rush Processing
**Scenario**: Identify insurance claims processed in less than 2 hours from submission to approval, which might indicate insufficient review time.
**Settings**:
- First Activity Name: "Submit Claim"
- First Activity Occurrence: First
- Second Activity Name: "Approve Claim"
- Second Activity Occurrence: First
- Comparison Method: Less Than
- Compare Value: 2 hours
**Result**: The filter selects cases where less than 2 hours passed between claim submission and approval.
**Insights**: These fast-tracked cases might warrant quality review to ensure proper procedures were followed and all necessary documentation was reviewed.
### Example 3: Monitoring Payment Window Compliance
**Scenario**: Find invoices where payment occurred between 30 and 60 days after invoice receipt, representing cases that met payment terms without early payment discounts.
**Settings**:
- First Activity Name: "Receive Invoice"
- First Activity Occurrence: First
- Second Activity Name: "Process Payment"
- Second Activity Occurrence: Last
- Comparison Method: Between
- Minimum Time: 30 days
- Maximum Time: 60 days
**Result**: The filter returns cases with payment occurring 30 to 59 days after invoice receipt (the upper bound is exclusive).
**Insights**: This helps analyze payment timing patterns, optimize working capital, and identify opportunities for early payment discounts.
### Example 4: Analyzing Approval Turnaround Times
**Scenario**: Identify loan applications where approval decisions were made within exactly 24 hours of application submission.
**Settings**:
- First Activity Name: "Submit Application"
- First Activity Occurrence: First
- Second Activity Name: "Approval Decision"
- Second Activity Occurrence: First
- Comparison Method: Less Than or Equal
- Compare Value: 24 hours
**Result**: The filter selects cases where 24 hours or less elapsed between submission and decision.
**Insights**: These cases represent efficient processing that meets or exceeds customer expectations for quick turnaround.
### Example 5: Finding Stalled Manufacturing Cases
**Scenario**: Discover manufacturing cases where more than 48 hours passed between the last quality inspection and the first shipment preparation activity.
**Settings**:
- First Activity Name: "Quality Inspection"
- First Activity Occurrence: Last
- Second Activity Name: "Prepare Shipment"
- Second Activity Occurrence: First
- Comparison Method: Greater Than or Equal
- Compare Value: 48 hours
**Result**: The filter returns cases with at least 48 hours between the last inspection and shipment preparation start.
**Insights**: This reveals cases with delays in the post-inspection phase, potentially indicating inventory holding issues, resource constraints, or coordination problems.
### Example 6: Validating Minimum Review Periods
**Scenario**: Find contract reviews completed in less than 15 minutes between initial review start and final approval, which may indicate insufficient due diligence.
**Settings**:
- First Activity Name: "Start Review"
- First Activity Occurrence: First
- Second Activity Name: "Approve Contract"
- Second Activity Occurrence: Last
- Comparison Method: Less Than
- Compare Value: 15 minutes
**Result**: The filter selects cases where less than 15 minutes elapsed between starting the review and final approval.
**Insights**: These cases might represent rubber-stamped approvals that warrant additional scrutiny or process improvement.
## Output
The filter returns a new dataset containing only cases that meet the specified time criteria between the two activities. Cases where either activity is not found are automatically excluded from the results.
The filtered dataset preserves all original events and attributes for the selected cases. The comparison is performed at the case level, so entire cases are either included or excluded based on whether they meet the time threshold.
---
*This documentation is part of the mindzieStudio process mining platform.*
---
## Time Period
Section: Filters
URL: https://docs.mindziestudio.com/mindzie_studio/filters/time-period
Source: /docs-master/mindzieStudio/filters/time-period/page.md
# Time Period
## Overview
The Time Period filter selects or removes cases based on date and time criteria. It provides flexible options for filtering cases using specific dates, relative time periods (such as "last month" or "this week"), or date ranges. The filter can operate at both the case level (filtering entire cases) and event level (filtering individual events within cases).
This filter supports multiple comparison methods including contained periods, intersecting periods, cases that started or completed within a period, and filtering based on specific activities or custom date attributes.
## Common Uses
- Analyze process performance for the current quarter or fiscal year
- Compare cases from different time periods (e.g., this month vs. last month)
- Identify cases that started but haven't completed within a specific timeframe
- Filter out historical cases to focus on recent activity
- Analyze seasonal trends by selecting specific months or quarters
- Track active cases during a critical business period
- Exclude test or pilot cases that occurred before a specific go-live date
## Settings
**Start Date Mode**: Defines the beginning boundary of the time period. You can choose from three options:
- **Specific Date**: Select an exact date and time. The filter will include cases on or after this date.
- **Relative Period**: Go back a specified number of days, weeks, months, or years from today. For example, "3 weeks" means the start date will be 3 weeks before today. This dynamically updates each day.
- **Period Start**: Select the start of a week, month, or year. You can specify how many periods to go back. For instance, "Start of Month" with "2" periods goes back to the first day of the month 2 months ago.
**End Date Mode**: Defines the ending boundary of the time period. Uses the same three options as Start Date Mode:
- **Specific Date**: Select an exact date and time. The filter will include cases on or before this date.
- **Relative Period**: Go forward or back a specified number of days, weeks, months, or years from today.
- **Period End**: Select the end of a week, month, or year. For instance, "End of Month" with "1" period means the last day of last month.
**Time Period**: Specifies the number of periods to go back (or forward into the future) when using relative or period-based date modes. For example, entering "3" with "Months" means 3 months back from today.
**Filter Type**: Determines how cases are selected based on their relationship to the time period:
- **Active**: Selects cases that had any activity during the selected period. A case is active if it overlaps with the time period in any way.
- **Activity**: Selects cases where a specific activity occurred during the period. Requires you to specify which activity to check.
- **Attribute**: Selects cases where a custom date attribute value falls within the period. Useful for filtering based on due dates, approval dates, or other date fields.
- **Completed**: Selects cases that finished during the selected period (case end time within the range).
- **Contained**: Selects cases that both started and finished entirely within the selected period. Both case start and end times must be within the range.
- **Events**: Filters individual events within the time period and returns cases containing those events. This is event-level filtering rather than case-level.
- **Intersecting**: Selects cases that overlap with the time period in any way. Similar to Active but may use different date comparison logic.
- **Started**: Selects cases that began during the selected period (case start time within the range).

**Activity** (conditionally required): When Filter Type is set to "Activity", specify which activity to check for occurrence during the time period. The filter will select cases where this activity happened within the date range.
**Attribute** (conditionally required): When Filter Type is set to "Attribute", specify which date/time attribute to filter on. This must be a valid date attribute in your process data.
**Remove Selected Cases**: When checked, inverts the filter logic to exclude matching cases instead of including them. Use this to remove cases from your analysis rather than selecting them.
## Examples
### Example 1: Completed Cases in 2024
**Scenario**: You want to analyze all cases that were completed during the 2024 calendar year to understand annual performance.
**Settings**:
- Start Date Mode: Specific Date = January 1, 2024 00:00:00
- End Date Mode: Specific Date = December 31, 2024 23:59:59
- Filter Type: Completed
- Remove Selected Cases: Unchecked
**Result**: The filter selects all cases where the case end time falls between January 1, 2024 and December 31, 2024. Cases that started in 2023 but finished in 2024 are included. Cases that started in 2024 but haven't finished yet are excluded.
**Insights**: This helps you measure completed work for annual reporting, identify completion trends throughout the year, and calculate accurate throughput metrics for the full calendar year.
### Example 2: Cases Active Last Month
**Scenario**: You need to review all cases that had any activity during the previous month for monthly operational reporting.
**Settings**:
- Start Date Mode: Period Start = Start of Month, Time Period = 1 (past)
- End Date Mode: Period End = End of Month, Time Period = 1 (past)
- Filter Type: Active
- Remove Selected Cases: Unchecked
**Result**: The filter dynamically selects cases that were active during last month. If today is March 15th, it selects cases active during February 1st through February 28th (or 29th). Tomorrow it will still show last month's data.
**Insights**: This provides a rolling monthly view of active work. Use it to track monthly workload, identify cases that span multiple months, and monitor ongoing work volumes. The dynamic nature means the same filter configuration works month after month.
### Example 3: Recent Orders (Last 30 Days)
**Scenario**: You want to focus your analysis on recent activity by filtering cases where orders were created in the last 30 days.
**Settings**:
- Start Date Mode: Relative Period = Days, Time Period = 30 (past)
- End Date Mode: (leave empty/null to include all dates after the start)
- Filter Type: Activity
- Activity: Create Order
- Remove Selected Cases: Unchecked
**Result**: The filter selects cases where the "Create Order" activity occurred within the last 30 days. If today is June 15th, it includes cases where "Create Order" happened between May 16th and June 15th. Tomorrow the window shifts forward by one day.
**Insights**: This creates a rolling 30-day window focused on recent order creation. Use it to monitor recent order processing, identify current bottlenecks, and track real-time process performance without including historical data that might skew your analysis.
### Example 4: Q1 2024 Started Cases
**Scenario**: You want to analyze cases that started during the first quarter of 2024 to evaluate the beginning of year performance.
**Settings**:
- Start Date Mode: Specific Date = January 1, 2024 00:00:00
- End Date Mode: Specific Date = March 31, 2024 23:59:59
- Filter Type: Started
- Remove Selected Cases: Unchecked
**Result**: The filter selects all cases that began between January 1 and March 31, 2024. Cases may still be in progress or may have completed later in the year.
**Insights**: This helps analyze how work initiated during Q1 progressed, compare quarterly intake volumes, and assess whether Q1 cases met expected timelines.
### Example 5: Exclude Old Test Cases
**Scenario**: Your process went live on July 1, 2024, and you want to exclude all test cases that occurred before the go-live date.
**Settings**:
- Start Date Mode: (leave empty/null)
- End Date Mode: Specific Date = June 30, 2024 23:59:59
- Filter Type: Completed
- Remove Selected Cases: Checked (important!)
**Result**: The filter removes all cases that completed on or before June 30, 2024. Only cases completed after the go-live date remain in your dataset.
**Insights**: This cleanses your dataset by removing test and pre-production cases, ensuring your analysis reflects actual production process performance without contamination from test data.
### Example 6: Invoices Approved This Week
**Scenario**: You want to monitor invoices that were approved during the current week to track weekly approval volumes.
**Settings**:
- Start Date Mode: Period Start = Start of Week, Time Period = 0 (current week)
- End Date Mode: Period End = End of Week, Time Period = 0 (current week)
- Filter Type: Activity
- Activity: Approve Invoice
- Remove Selected Cases: Unchecked
**Result**: The filter selects cases where "Approve Invoice" occurred during the current week (Monday 00:00:00 to Sunday 23:59:59 of the current week).
**Insights**: This provides a rolling weekly view of approval activity. Use it to track weekly productivity, identify approval bottlenecks during the week, and monitor whether approvals are keeping pace with incoming invoices.
## Output
**Cases Included/Excluded**: Based on the Filter Type and date range, the filter either includes or excludes complete cases from your dataset.
**Event-Level Filtering**: When Filter Type is set to "Events", the filter operates on individual events rather than complete cases. Cases are reconstructed to include only events within the specified time period.
**Dynamic Updates**: Filters using relative time periods (like "last 30 days" or "this month") automatically update each day. The same filter configuration produces different results tomorrow because the reference point (today) has shifted.
**Case Timeline Impact**: The filter affects case timelines differently based on Filter Type:
- "Contained" requires both start and end within the period
- "Started" only checks case start time
- "Completed" only checks case end time
- "Active" checks for any overlap between case duration and the time period
- "Intersecting" checks for any overlap with potentially different comparison logic than Active
**Attribute Filtering**: When using Filter Type "Attribute", the filter checks custom date fields rather than case start/end times. This allows filtering based on business-specific dates like due dates, approval dates, or delivery dates.
**Inverted Logic**: When "Remove Selected Cases" is checked, all matching cases are excluded rather than included. This is useful for removing outliers, test data, or cases from specific problematic periods.
---
*This documentation is part of the mindzie Studio process mining platform.*
---
## Value Frequency
Section: Filters
URL: https://docs.mindziestudio.com/mindzie_studio/filters/value-frequency
Source: /docs-master/mindzieStudio/filters/value-frequency/page.md
# Value Frequency
## Overview
The Value Frequency filter selects cases based on how frequently their attribute values appear across the entire dataset. This case-level filter groups cases by their values in a specified attribute, counts how often each value occurs, and includes or excludes cases based on whether the frequency meets your specified threshold. You can set thresholds using either absolute counts (e.g., "at least 5 occurrences") or percentages (e.g., "in at least 20% of cases").
This filter is particularly useful for identifying common patterns, detecting rare outliers, focusing on high-volume categories, or filtering out infrequent edge cases that may skew analysis results.
## Common Uses
- **Focus on Major Categories**: Keep only cases where attribute values appear frequently enough to be statistically significant, eliminating rare outliers.
- **Outlier Detection**: Identify unusual or rare cases by filtering for attribute values that appear infrequently in the dataset.
- **Data Quality Analysis**: Find potentially problematic data by identifying values that appear exactly once, which may indicate data entry errors or duplicate records.
- **High-Volume Analysis**: Concentrate analysis on the most common regions, products, or customer segments by filtering for frequently occurring values.
- **Noise Reduction**: Remove edge cases and low-frequency variants that add complexity without adding meaningful insights.
- **Pattern Recognition**: Discover systematic issues by identifying values that appear with specific frequencies (e.g., exactly twice, suggesting systematic duplication).
## Settings
**Column Name**: Select the attribute to analyze for value frequency. The filter supports integer and text attributes. Hidden columns and case ID columns are not available.
**Compare Method**: Choose how to compare the frequency against your threshold:
- Equal: Keep cases where values appear exactly the specified number of times
- Greater Than: Keep cases where values appear more times than the threshold
- Greater Than or Equal: Keep cases where values appear at least the specified number of times
- Less Than: Keep cases where values appear fewer times than the threshold
- Less Than or Equal: Keep cases where values appear no more times than the threshold
- Not Equal: Keep cases where values do not appear exactly the specified number of times
**Threshold Type**: Specify whether the threshold represents:
- Count: An absolute number of occurrences
- Percent: A decimal percentage of total cases (0.0 to 1.0)
**Compare Threshold**: Enter the numeric threshold value. For Count mode, this is the number of occurrences. For Percent mode, enter a decimal (e.g., 0.4 for 40%).
## Examples
### Example 1: Focus on Major Regions
**Scenario**: Your process data includes cases from 15 different regions, but you want to focus analysis only on regions that represent significant volume. You decide to keep only regions that appear in at least 10% of all cases.
**Settings**:
- Column Name: Region
- Compare Method: Greater Than or Equal
- Threshold Type: Percent
- Compare Threshold: 0.1
**Result**: The filter keeps only cases from regions that appear in 10% or more of the dataset. If you have 1,000 cases, this means regions with at least 100 cases are included, while smaller regions are filtered out.
**Insights**: This focuses your analysis on the major regions while eliminating noise from small regional offices with minimal activity, making patterns and trends easier to identify.
### Example 2: Identify Unique Cases
**Scenario**: You suspect some cases have unique attribute values that may indicate data quality issues or special handling. You want to find all cases where the value appears exactly once in the entire dataset.
**Settings**:
- Column Name: Customer ID
- Compare Method: Equal
- Threshold Type: Count
- Compare Threshold: 1.0
**Result**: The filter returns only cases where the Customer ID appears exactly once across all cases.
**Insights**: These unique customers may represent:
- One-time customers who never returned
- Potential data entry errors with misspelled customer names
- Test cases that should be removed
- VIP customers requiring special attention
### Example 3: Find High-Frequency Products
**Scenario**: You want to analyze only your best-selling products that appear in at least 50 cases to understand successful product patterns.
**Settings**:
- Column Name: Product Name
- Compare Method: Greater Than or Equal
- Threshold Type: Count
- Compare Threshold: 50.0
**Result**: The filter keeps cases for products that were ordered at least 50 times in the dataset.
**Insights**: By focusing on high-volume products, you can identify patterns in successful product processing, common bottlenecks, and optimization opportunities that will have the greatest business impact.
### Example 4: Exclude Rare Process Variants
**Scenario**: Your process has many rare variants that make the process map cluttered. You want to remove cases where the starting activity is uncommon (appears in less than 5% of cases).
**Settings**:
- Column Name: ~calc~StartActivity
- Compare Method: Less Than
- Threshold Type: Percent
- Compare Threshold: 0.05
**Result**: The filter keeps only cases where the starting activity appears in less than 5% of all cases, effectively selecting the rare variants.
**Insights**: This helps identify unusual process entry points that may indicate exceptions, errors, or non-standard workflows requiring investigation.
### Example 5: Remove Duplicate Detection
**Scenario**: You want to identify potentially duplicated cases by finding attribute values that appear exactly twice, which might indicate systematic duplication issues.
**Settings**:
- Column Name: Order Number
- Compare Method: Equal
- Threshold Type: Count
- Compare Threshold: 2.0
**Result**: The filter returns cases where the Order Number appears exactly twice in the dataset.
**Insights**: These pairs of cases may represent:
- System errors causing duplicate order creation
- Split shipments for the same order
- Order amendments or revisions
- Data integration issues from multiple systems
### Example 6: Exclude Low-Frequency Outliers
**Scenario**: You want to clean your dataset by removing cases from categories that represent less than 2% of the total volume, as these are likely edge cases.
**Settings**:
- Column Name: Department
- Compare Method: Greater Than or Equal
- Threshold Type: Percent
- Compare Threshold: 0.02
**Result**: The filter keeps only cases from departments that handle at least 2% of all cases.
**Insights**: This creates a cleaner dataset focused on the core business operations while filtering out small departments or test departments that may not represent typical process behavior.
## Output
The filter returns a new dataset containing only cases that meet the specified frequency criteria for the selected attribute. All cases with the same attribute value are treated as a group - either the entire group is included, or the entire group is excluded, based on how many cases share that value.
For example, if "Region A" appears in 100 cases and meets your threshold, all 100 cases with "Region A" are included. The filter preserves all events and attributes for the included cases.
## Technical Notes
- **Filter Type**: Case-level filter (removes entire cases based on attribute value frequency)
- **Grouping Logic**: All cases are grouped by their values in the specified attribute, and each group's frequency is compared against the threshold
- **Null Handling**: Null values are treated as a distinct group and counted like any other value
- **Supported Data Types**: Integer (Int32, Int64) and text (String) attributes
- **Threshold Conversion**: When using Percent mode, the percentage is automatically converted to an absolute count by multiplying by the total number of cases
- **Validation**: The filter suggests similar column names if you misspell the attribute name
---
*This documentation is part of the mindzieStudio process mining platform.*
---
## Variant Frequency
Section: Filters
URL: https://docs.mindziestudio.com/mindzie_studio/filters/variant-frequency
Source: /docs-master/mindzieStudio/filters/variant-frequency/page.md
# Variant Frequency
## Overview
The Variant Frequency filter selects cases based on how frequently their process variant occurs within the dataset. It allows you to focus on either common patterns (high-frequency variants) or rare patterns (low-frequency variants) by setting minimum and maximum frequency thresholds as percentages of total cases. This case-level filter groups all cases by their process variant, counts how many cases follow each variant, and keeps only those variants whose case counts fall within your specified range.
Process variants represent unique sequences of activities that cases follow through your process. By filtering based on variant frequency, you can isolate standard workflows, identify exceptional paths, or exclude statistically insignificant patterns from your analysis.
## Common Uses
- **Focus on Standard Processes**: Filter to show only the most common variants to understand your typical process flows and standard operating procedures.
- **Identify Exceptional Cases**: Isolate rare variants that occur infrequently to detect unusual process paths, exceptions, or potential problems.
- **Exclude Noise**: Remove very rare variants that represent insignificant statistical outliers or one-off cases from your analysis.
- **Process Standardization**: Analyze how many cases follow standardized variants versus non-standard paths.
- **Compliance Analysis**: Find cases that follow uncommon process paths which might indicate non-compliant behavior.
- **Performance Optimization**: Focus analysis on the most frequent variants where process improvements will have the greatest impact.
## Settings
**Minimum Percent**: The minimum frequency threshold as a decimal percentage (0.0 to 1.0). Variants that occur in fewer cases than this percentage of the total will be filtered out. Must be greater than or equal to 0 and less than or equal to Maximum Percent.
**Maximum Percent**: The maximum frequency threshold as a decimal percentage (0.0 to 1.0). Variants that occur in more cases than this percentage of the total will be filtered out. Must be less than or equal to 1.0 and greater than or equal to Minimum Percent.
> **Note**: Percentages are expressed as decimals. For example, use 0.1 for 10%, 0.05 for 5%, and 1.0 for 100%.
## Examples
### Example 1: Analyzing Common Process Variants
**Scenario**: You want to focus your analysis on the most frequently occurring process paths to understand standard operations. You only want to see variants that occur in at least 10% of cases.
**Settings**:
- Minimum Percent: 0.1
- Maximum Percent: 1.0
**Result**: The filter keeps only cases whose variants occur in at least 10% of the total cases. If you have 1,000 cases total, only variants with at least 100 cases will be included.
**Insights**: This helps you concentrate on the main process flows while filtering out less common variations. By focusing on high-frequency variants, you can identify your standard operating procedures and ensure process improvements target the workflows that affect the most cases.
### Example 2: Finding Rare and Exceptional Variants
**Scenario**: You want to identify unusual process paths that only occur in a small percentage of cases to detect exceptions, errors, or non-standard workflows.
**Settings**:
- Minimum Percent: 0.0
- Maximum Percent: 0.05
**Result**: The filter keeps only cases whose variants occur in at most 5% of the total cases. If you have 1,000 cases, only variants with 50 or fewer cases will be included.
**Insights**: Rare variants often represent exceptions, errors, workarounds, or special handling procedures. Analyzing these cases can reveal:
- Process deviations that need investigation
- Compliance issues or unauthorized procedures
- System errors or data quality problems
- Opportunities to standardize exceptional handling
### Example 3: Excluding Extreme Outliers
**Scenario**: You want to analyze mid-range variants while excluding both the most common patterns and the rarest one-off cases to focus on moderate variation in your process.
**Settings**:
- Minimum Percent: 0.05
- Maximum Percent: 0.25
**Result**: The filter keeps only cases whose variants occur between 5% and 25% of the time. This excludes both the dominant variants and the statistical outliers.
**Insights**: This range helps you understand process variation in your middle tier of cases. These variants are significant enough to matter statistically but aren't part of your standard process, revealing:
- Secondary standard processes
- Seasonal or conditional workflows
- Process alternatives that occur regularly but not dominantly
### Example 4: Isolating High-Frequency Variants for Process Optimization
**Scenario**: You want to optimize your process by focusing on the top variants that represent at least 20% of all cases, ensuring your improvements affect a significant portion of your workload.
**Settings**:
- Minimum Percent: 0.2
- Maximum Percent: 1.0
**Result**: The filter keeps only cases whose variants occur in at least 20% of all cases. With 1,000 total cases, only variants with 200 or more cases are included.
**Insights**: By focusing on high-frequency variants, you ensure that:
- Process improvements will have maximum impact
- Analysis is statistically significant
- Resources are directed toward the most common workflows
- Standardization efforts target the right processes
## Output
The filter returns a new dataset containing only the cases whose process variants have frequencies within the specified range. Each case preserves all its original events and attributes. The variant structure and sequence of activities remain unchanged - only cases from qualifying variants are retained.
If no variants fall within the specified frequency range, the filter returns an empty result set.
## Technical Notes
- **Filter Type**: Case-level filter (removes entire cases, not individual events)
- **Grouping Logic**: Groups cases by variant, counts occurrences, then applies frequency thresholds
- **Frequency Calculation**: Converts percentage thresholds to absolute counts based on total case count
- **Range Inclusivity**: Both minimum and maximum thresholds are inclusive
- **Validation**: Ensures Minimum Percent is not greater than Maximum Percent and both are within valid ranges (0.0 to 1.0)
---
*This documentation is part of the mindzieStudio process mining platform.*
---
## And Filter
Section: Filters
URL: https://docs.mindziestudio.com/mindzie_studio/filters/and-filter
Source: /docs-master/mindzieStudio/filters/and-filter/page.md
# And Filter
## Overview
The And Filter is a logical filter that combines multiple filters using AND logic, where a case is included only if it matches ALL of the individual filter conditions. This powerful case-level filter allows you to create precise filtering scenarios by requiring cases to satisfy multiple criteria simultaneously. Unlike the OR filter where matching any condition is sufficient, the AND filter requires every condition to be met.
## Common Uses
- Find cases matching multiple specific attribute values
- Create complex business rules requiring all criteria
- Combine activity and attribute conditions
- Filter for cases in a specific state with specific characteristics
- Build precise compliance filters with multiple requirements
- Identify cases meeting all quality or performance thresholds
## Settings
**Filter List:** A collection of individual filters that will be combined using AND logic. Each filter in the list represents a condition, and a case is included only if it matches ALL of these conditions.
**How it works:**
1. The first filter is applied to the original dataset
2. Each subsequent filter is applied to the result of the previous filter
3. Cases are progressively narrowed down through each filter
4. The final result includes only cases that passed all filter conditions
**Note:** You can include 2 or more filters. With zero or one filter, the operation returns the input unchanged.
## Examples
### Example 1: Multi-Attribute Matching
**Scenario:** You want to find high-value orders from a specific region that are still in progress. All three conditions must be met.
**Settings:**
- Filter 1: Cases with Attribute "Region" equals "Western"
- Filter 2: Cases with Attribute "Order Value" greater than 10000
- Filter 3: Cases with Attribute "Status" equals "In Progress"
**Result:**
Only cases matching ALL conditions are included. Case #1001: Region=Western, Value=$15,000, Status=In Progress - INCLUDED. Case #1002: Region=Western, Value=$5,000, Status=In Progress - EXCLUDED (value too low). Case #1003: Region=Eastern, Value=$20,000, Status=In Progress - EXCLUDED (wrong region).
**Insights:** AND logic lets you define precise case populations for targeted analysis. The order of filters can affect performance but not results - put the most restrictive filter first for faster execution.
### Example 2: Activity and Resource Combination
**Scenario:** You want to analyze cases where a specific activity was performed by a specific resource. Both conditions must be true.
**Settings:**
- Filter 1: Cases with Activity "Manager Approval" present
- Filter 2: Cases with Attribute "Approver" equals "John Smith"
**Result:**
Cases where "Manager Approval" occurred AND it was performed by John Smith are included. This filters first for cases with the approval activity, then for cases where John performed it.
**Insights:** Combining activity and resource filters helps analyze individual performance, workload distribution, or identify training needs for specific activities.
### Example 3: Time and Value Thresholds
**Scenario:** You need to find cases that took longer than 30 days AND had a value over $50,000 for executive review.
**Settings:**
- Filter 1: Cases with Duration greater than 30 days
- Filter 2: Cases with Attribute "Case Value" greater than 50000
**Result:**
Only high-value, long-running cases are included. These represent the most critical cases requiring executive attention - they're both financially significant and experiencing delays.
**Insights:** Intersecting multiple criteria helps prioritize limited resources. These cases likely need immediate intervention as they combine both risk factors.
### Example 4: Compliance Multi-Check
**Scenario:** Your compliance audit requires cases that have all required approvals: manager approval, finance approval, AND legal review.
**Settings:**
- Filter 1: Cases with Activity "Manager Approval" present
- Filter 2: Cases with Activity "Finance Approval" present
- Filter 3: Cases with Activity "Legal Review" present
**Result:**
Only cases with all three approval activities are included. Cases missing any required approval are excluded from this compliant population.
**Insights:** This identifies your fully compliant case population. The inverse (cases NOT matching all conditions) would show compliance gaps requiring investigation.
### Example 5: Exclusion with AND Logic
**Scenario:** You want to find incomplete cases from a specific vendor that haven't been touched in the last 7 days.
**Settings:**
- Filter 1: Cases with Attribute "Status" not equal to "Completed"
- Filter 2: Cases with Attribute "Vendor" equals "Acme Corp"
- Filter 3: Cases with Last Activity Date before [7 days ago]
**Result:**
Cases matching all three criteria are flagged: they're from Acme, incomplete, and stale. These require immediate follow-up as they may be stuck or forgotten.
**Insights:** Combining status, attribute, and time-based filters helps identify specific problem populations requiring action.
## Comparison with OR Filter
| Aspect | AND Filter | OR Filter |
|--------|-----------|-----------|
| Logic | All conditions must match | Any condition can match |
| Result Size | Generally smaller (more restrictive) | Generally larger (more inclusive) |
| Use Case | Precise targeting | Broad capture |
| Execution | Sequential filtering | Union of results |
## Output
This filter operates at the case level using intersection logic:
- Applies filters sequentially, each narrowing the result set
- Returns only cases matching ALL filter conditions
- If any filter returns zero cases, the final result is empty
- Preserves all case and event attributes for included cases
- Filter order doesn't affect results but can affect performance
- Returns original dataset if zero or one filter is provided
Use AND filters to create precise, multi-criteria filtering rules where cases must satisfy every condition. This is ideal for compliance checking, targeted analysis, and identifying cases meeting specific complex criteria.
---
*This documentation is part of the mindzie Studio process mining platform.*
---
## Small Ends
Section: Filters
URL: https://docs.mindziestudio.com/mindzie_studio/filters/small-ends
Source: /docs-master/mindzieStudio/filters/small-ends/page.md
# Small Ends Filter
## Overview
The Small Ends filter automatically trims low-activity periods from the beginning and end of your event log. This intelligent case-level filter detects "warm-up" and "wind-down" periods where event volumes are significantly below average, then removes cases that fall entirely within these periods. It helps ensure your analysis focuses on periods of normal business activity rather than data collection artifacts or seasonal low points.
## Common Uses
- Remove data from system go-live periods before processes stabilized
- Exclude end-of-extraction periods where data may be incomplete
- Filter out holiday periods with reduced activity
- Eliminate data quality issues from log boundaries
- Focus analysis on periods with representative process behavior
- Clean event logs for accurate throughput and performance metrics
## Settings
**Start Factor:** A multiplier (0.0 to 1.0) applied to the mean daily event count. Days at the beginning of the log with event counts below (Start Factor x Mean Events Per Day) are trimmed. A lower value is more permissive (keeps more data); a higher value is more aggressive (removes more early data).
**End Factor:** A multiplier (0.0 to 1.0) applied to the mean daily event count. Days at the end of the log with event counts below (End Factor x Mean Events Per Day) are trimmed. Works the same as Start Factor but for the end of the log.
**Default Values:** Both factors default to 0.1 (10%), meaning days with less than 10% of the average daily activity are considered "small" and trimmed.
## Examples
### Example 1: Standard Cleanup
**Scenario:** Your event log starts with a system implementation period where few transactions occurred, and ends with incomplete data from the extraction date. You want to automatically trim these low-activity periods.
**Settings:**
- Start Factor: 0.1
- End Factor: 0.1
**Result:**
The filter calculates the average events per day across your entire log (e.g., 500 events/day). Days with fewer than 50 events are considered low-activity. If the first 5 days have 10, 25, 30, 45, and 80 events respectively, the filter starts from day 4 onward. Similarly, low-activity days at the end are trimmed.
**Insights:** This automatically handles data boundary issues without manual date selection, ensuring analysis covers only periods with representative activity levels.
### Example 2: Aggressive Start Trimming
**Scenario:** Your process data includes a lengthy pilot period before full rollout. You want to aggressively trim early data while preserving end-of-log data.
**Settings:**
- Start Factor: 0.3
- End Factor: 0.1
**Result:**
Days at the start with fewer than 30% of mean daily activity are trimmed. This removes more of the pilot/ramp-up period. The end uses the standard 10% threshold, preserving more recent data.
**Insights:** Asymmetric factors let you handle situations where the start and end of your log have different characteristics. Pilot periods often have longer ramp-up than wind-down.
### Example 3: Minimal Trimming
**Scenario:** You want to keep as much data as possible but still remove obvious data quality issues at log boundaries.
**Settings:**
- Start Factor: 0.05
- End Factor: 0.05
**Result:**
Only days with fewer than 5% of mean daily activity are trimmed. This catches only the most extreme low-activity periods while preserving the vast majority of data, including moderate seasonal variations.
**Insights:** Use low factors when your business has natural activity variation and you don't want to accidentally remove legitimate low-activity periods like weekends or seasonal dips.
### Example 4: Removing Seasonal Boundaries
**Scenario:** Your log spans a full year but includes December (holiday season) at both the beginning and end due to the extraction timing. You want to focus on non-holiday periods.
**Settings:**
- Start Factor: 0.4
- End Factor: 0.4
**Result:**
Days with fewer than 40% of average activity are trimmed from both ends. This effectively removes holiday periods where activity dropped significantly below normal levels.
**Insights:** Higher factors help exclude seasonal variations that might skew analysis. However, be cautious not to remove too much valid data.
### Example 5: New System Implementation
**Scenario:** Data was extracted from a new system that went live 3 months ago. The first month had very low activity as users were being trained and migrated.
**Settings:**
- Start Factor: 0.5
- End Factor: 0.1
**Result:**
The first portion of the log (implementation/training period with < 50% activity) is removed, while recent data is preserved with only minimal end trimming. This focuses analysis on the period after the system stabilized.
**Insights:** Implementation periods often show patterns that don't represent normal operations. Trimming them ensures your process metrics reflect actual operational performance.
## How It Works
1. **Calculate Daily Frequencies:** The filter counts events for each day in the log
2. **Compute Mean Activity:** Calculates the average events per day across the entire period
3. **Find Start Boundary:** Scans from the beginning to find the first day exceeding (Start Factor x Mean)
4. **Find End Boundary:** Scans from the end to find the last day exceeding (End Factor x Mean)
5. **Apply Date Range:** Filters to keep only cases within the calculated date boundaries
## Output
This filter operates at the case level based on temporal boundaries:
- Automatically calculates activity thresholds based on mean daily events
- Identifies the first day of "normal" activity at the log start
- Identifies the last day of "normal" activity at the log end
- Returns cases contained within the calculated normal activity period
- Preserves all case and event attributes for included cases
- Factors must be between 0 and 1 (exclusive)
Use the Small Ends filter to automatically clean event log boundaries, ensuring your analysis reflects normal business operations rather than implementation phases, data extraction artifacts, or seasonal anomalies.
---
*This documentation is part of the mindzie Studio process mining platform.*
---
## Duplicate Cases
Section: Filters
URL: https://docs.mindziestudio.com/mindzie_studio/filters/duplicate-cases
Source: /docs-master/mindzieStudio/filters/duplicate-cases/page.md
# Duplicate Cases Filter
## Overview
The Duplicate Cases filter identifies and selects cases that share identical values across multiple specified columns. This advanced case-level filter helps detect potential duplicate transactions, repeated submissions, or data quality issues where the same business entity appears multiple times in your process data.
## Common Uses
- Identify duplicate invoice submissions in accounts payable
- Find repeated customer orders with identical details
- Detect potential fraud through duplicate transaction patterns
- Discover data migration issues with replicated records
- Identify cases that should have been consolidated
- Analyze patterns in recurring submissions or requests
## Settings
**Column Names:** Select 2 to 5 columns to use for duplicate detection. Cases with identical values across ALL selected columns are considered duplicates. Only columns with comparable data types are available (String, Integer, DateTime, etc.).
**How It Works:**
1. Groups cases by the values in all selected columns
2. Identifies groups containing 2 or more cases
3. Returns all cases that belong to any duplicate group
4. Results are ordered by group size (largest duplicate groups first)
**Supported Column Types:** String, Int32, Int64, Double, Single, DateTime, TimeSpan
## Examples
### Example 1: Duplicate Invoice Detection
**Scenario:** You want to find potentially duplicate invoices in your accounts payable process by matching on vendor, amount, and invoice date.
**Settings:**
- Column Names: ["Vendor", "Invoice Amount", "Invoice Date"]
**Result:**
Cases where all three values match are grouped together. Group 1: 5 invoices from "Acme Corp" for $10,000 dated 2024-01-15. Group 2: 3 invoices from "Beta LLC" for $5,500 dated 2024-02-01. Single invoices with unique combinations are excluded.
**Insights:** Multiple invoices with identical vendor, amount, and date often indicate duplicate submissions that may result in duplicate payments. These require investigation and potentially blocking.
### Example 2: Customer Order Duplicates
**Scenario:** Your order management process may have duplicate orders when customers submit multiple times. You want to find orders with matching customer, product, and quantity.
**Settings:**
- Column Names: ["Customer ID", "Product Code", "Order Quantity"]
**Result:**
Orders with identical customer, product, and quantity are flagged. This catches scenarios where a customer accidentally submitted the same order multiple times within a short period.
**Insights:** Duplicate orders increase fulfillment costs, create inventory issues, and lead to customer dissatisfaction when they receive unwanted duplicates.
### Example 3: Transaction Pattern Analysis
**Scenario:** You're investigating potential fraud by looking for transactions with matching amounts, source accounts, and transaction times.
**Settings:**
- Column Names: ["Source Account", "Amount", "Transaction Hour"]
**Result:**
Transactions from the same account, with the same amount, during the same hour are grouped. This pattern might indicate automated fraud or system errors creating duplicate transactions.
**Insights:** Legitimate transactions rarely have identical characteristics across multiple fields. High duplicate rates warrant deeper investigation of specific accounts or time periods.
### Example 4: Data Migration Verification
**Scenario:** After migrating data from a legacy system, you want to verify that records weren't duplicated during the migration process.
**Settings:**
- Column Names: ["Legacy ID", "Creation Date"]
**Result:**
Records with the same legacy identifier and creation date are flagged as potential migration duplicates. Ideally, this should return no results if the migration was clean.
**Insights:** Migration duplicates can cause reporting inaccuracies, compliance issues, and operational confusion. Identifying them allows for data cleanup before they cause downstream problems.
### Example 5: Multiple Column Matching
**Scenario:** You want to find purchase orders that might be duplicates based on comprehensive matching: same vendor, same amount, same department, and same requested date.
**Settings:**
- Column Names: ["Vendor Name", "PO Amount", "Department", "Requested Date"]
**Result:**
Purchase orders matching on all four dimensions are identified. This strict matching reduces false positives while still catching true duplicates that slipped through procurement controls.
**Insights:** Using more columns makes matching stricter but more precise. Start with fewer columns if you're exploring, then add more to reduce false positives.
## Output
This filter operates at the case level using multi-column grouping:
- Groups cases by values across all specified columns
- Returns only cases that appear in groups of 2 or more
- Results ordered by duplicate group size (largest first)
- Requires 2-5 columns for duplicate detection
- Columns must contain comparable data types
- Hidden columns and case ID columns are excluded
- Preserves all case and event attributes for matched cases
Use the Duplicate Cases filter to identify potential data quality issues, detect duplicate submissions, or find cases that may represent the same business transaction entered multiple times.
---
*This documentation is part of the mindzie Studio process mining platform.*
---
## Due Date (Accounts Payable)
Section: Filters
URL: https://docs.mindziestudio.com/mindzie_studio/filters/due-date
Source: /docs-master/mindzieStudio/filters/due-date/page.md
# Due Date Filter
## Overview
The Due Date filter is a specialized Accounts Payable filter that selects cases based on when payment was made relative to the invoice due date. This process-specific filter helps identify late payments, early payments, or on-time payments by comparing the payment activity timestamp against the due date attribute, enabling focused analysis of payment timeliness patterns.
## Common Uses
- Identify late payments for supplier relationship analysis
- Find early payments that may miss discount opportunities
- Analyze on-time payment rates by vendor or department
- Measure payment timeliness KPIs
- Investigate factors contributing to payment delays
- Monitor payment performance against targets
## Settings
**Search Type:** Determines how payments are compared to due dates:
- **Activity Time Greater Than (Late - Full DateTime):** Finds cases where payment occurred AFTER the due date and time
- **Activity Date Greater Than (Late - Date Only):** Finds cases where payment occurred on a date AFTER the due date (ignores time component)
- **Activity Time Less Than (Early - Full DateTime):** Finds cases where payment occurred BEFORE the due date and time
- **Activity Date Less Than (Early - Date Only):** Finds cases where payment occurred on a date BEFORE the due date
- **Activity Time Same Day (On-Time):** Finds cases where payment occurred on the same date as the due date
**Remove Selected Cases:** When enabled, inverts the filter to exclude matching cases instead of including them.
**Note:** This filter uses the standard Accounts Payable activity "PayInvoice" and attribute "DueDate" automatically.
## Examples
### Example 1: Finding Late Payments
**Scenario:** You want to identify all invoices that were paid after their due date for supplier relationship management.
**Settings:**
- Search Type: Activity Date Greater Than (Late - Date Only)
- Remove Selected Cases: Unchecked
**Result:**
Cases where the payment date is after the due date are included. Invoice #1001 with Due Date 2024-01-15 and Payment Date 2024-01-20 is included (5 days late). Invoice #1002 with Due Date 2024-01-15 and Payment Date 2024-01-10 is excluded (early).
**Insights:** Late payments damage supplier relationships, may incur penalties, and indicate process bottlenecks. Analyzing late payment patterns helps identify root causes like approval delays, cash flow issues, or processing backlogs.
### Example 2: Identifying Early Payments
**Scenario:** You want to find payments made significantly early, which might indicate cash management inefficiencies (paying too early loses interest income).
**Settings:**
- Search Type: Activity Date Less Than (Early - Date Only)
- Remove Selected Cases: Unchecked
**Result:**
Cases where payment occurred before the due date are included. This might reveal opportunities to better time payments - paying at the optimal point to maximize cash flow while still meeting obligations.
**Insights:** Paying too early ties up working capital unnecessarily. Analyzing early payments helps identify where payment timing could be optimized without risking late fees.
### Example 3: On-Time Payment Analysis
**Scenario:** You want to analyze your on-time payment rate by finding cases paid exactly on the due date.
**Settings:**
- Search Type: Activity Time Same Day (On-Time)
- Remove Selected Cases: Unchecked
**Result:**
Cases where payment occurred on the same day as the due date are included. This shows your "just in time" payments - maximizing cash flow while meeting deadlines.
**Insights:** High rates of same-day payment may indicate good cash management or may suggest cutting it too close with risk of slipping late. Balance against early and late payments for a complete picture.
### Example 4: Excluding Late Payments
**Scenario:** You want to analyze your successful payment processes by focusing only on payments that were NOT late.
**Settings:**
- Search Type: Activity Date Greater Than (Late - Date Only)
- Remove Selected Cases: Checked
**Result:**
Late payments are excluded. The remaining cases (early and on-time payments) represent successful process execution. Analyze these to understand what makes timely payments possible.
**Insights:** By removing problematic cases, you can identify best practices from your successful payments that could be applied to improve late payment rates.
### Example 5: Precise Time-Based Analysis
**Scenario:** Your company defines "late" as any payment after the exact due date and time (not just date). You need this precision for contractual compliance.
**Settings:**
- Search Type: Activity Time Greater Than (Late - Full DateTime)
- Remove Selected Cases: Unchecked
**Result:**
Cases are evaluated against the full datetime. A payment at 2024-01-15 09:00 is on-time if the due datetime is 2024-01-15 17:00, but late if the due datetime is 2024-01-15 08:00.
**Insights:** Full datetime comparison is important when contracts specify exact payment times or when operating across time zones where date-only comparison might miscategorize payments.
## Required Data Structure
This filter is designed for Accounts Payable processes and requires:
- **Activity:** "PayInvoice" - The activity representing payment execution
- **Attribute:** "DueDate" - A datetime attribute on cases containing the payment due date
If your data uses different naming, you may need to use the general Deadline filter with custom activity and attribute names.
## Output
This filter operates at the case level comparing payment timing:
- Compares the PayInvoice activity timestamp against the DueDate attribute
- Supports both date-only and full datetime comparisons
- Can identify late, early, or on-time payments
- When "Remove Selected Cases" is unchecked: Returns matching cases
- When "Remove Selected Cases" is checked: Returns non-matching cases
- Preserves all case and event attributes for included cases
Use the Due Date filter to analyze payment timeliness in Accounts Payable processes, enabling root cause analysis of late payments and optimization of payment timing strategies.
---
*This documentation is part of the mindzie Studio process mining platform.*
---
## Overview
Section: Calculators
URL: https://docs.mindziestudio.com/mindzie_studio/calculators/overview
Source: /docs-master/mindzieStudio/calculators/overview/page.md
# Calculators
Calculators help you derive insights and metrics from your process data.
Choose from various calculator types to analyze performance, duration, frequency, and more.
There are 71 calculators available for you to choose from. Browse them all below.
★
Recommended Calculators
These calculators are most frequently used by our users and provide the greatest value for process analysis.
Start here for the best insights into your process data.
---
## Active Case Count By Day
Section: Calculators
URL: https://docs.mindziestudio.com/mindzie_studio/calculators/active-case-count-by-day
Source: /docs-master/mindzieStudio/calculators/active-case-count-by-day/page.md
# Active Case Count By Day
## Overview
The Active Case Count By Day calculator measures how many cases were actively in progress on each calendar day. A case is considered "active" on a given day if it has started but not yet completed - meaning the case has at least one event on or before that day and at least one event on or after that day.
This calculator is particularly valuable for understanding workload, identifying capacity constraints, and detecting bottlenecks. Unlike event-based calculators that count activities, this calculator counts unique cases that were in an ongoing state, providing insight into work-in-progress (WIP) levels over time.
**Note:** This is a hidden calculator in mindzie Studio, meaning it is not directly visible in the standard calculator menu but can be accessed programmatically or through advanced configurations.
## Common Uses
- Monitor work-in-progress (WIP) levels to identify capacity bottlenecks and resource constraints
- Detect periods of excessive case backlog that may indicate systemic issues
- Analyze seasonal workload patterns to optimize staffing and resource allocation
- Identify the impact of process changes on case throughput and cycle times
- Validate that case completion rates keep pace with case creation rates
- Support capacity planning by understanding historical active case volumes
- Detect anomalies such as sudden WIP spikes that may indicate process breakdowns
## Settings
This calculator has no configurable settings beyond the standard filter context. It automatically analyzes all cases in your filtered dataset by determining which cases were active (in progress) on each calendar day.
**How Active Cases Are Calculated:**
A case is counted as active on a specific date if:
- The case's first event occurred on or before that date (the case had started)
- The case's last event occurred on or after that date (the case had not yet completed)
- This means a case is active from its start date through its completion date (inclusive)
**Standard Fields:**
- **Title:** Optional custom title for the calculator output
- **Description:** Optional description for documentation purposes
## Examples
### Example 1: Identifying Capacity Bottlenecks
**Scenario:** Your order fulfillment process has been experiencing delays, and management wants to understand whether increasing case volumes are exceeding your team's processing capacity. You need to identify periods where active cases accumulate faster than they are being completed.
**Settings:**
- Title: "Order Fulfillment Work-in-Progress Analysis"
- Description: "Track active case levels to identify capacity constraints"
**Output:**
The calculator displays a table with two columns:
- **Date:** Each calendar day in your event log's time range
- **Active Case Count:** The number of cases that were in progress on that date
Example output:
```
Date Active Case Count
2024-01-15 487
2024-01-16 492
2024-01-17 501
2024-01-18 523
2024-01-19 558
2024-01-20 562
2024-01-21 559
2024-01-22 612
2024-01-23 648
2024-01-24 687
2024-01-25 724
```
**Insights:** The steadily increasing active case count from 487 to 724 over 10 days indicates that new cases are arriving faster than existing cases are being completed. This 49% increase in WIP suggests a capacity bottleneck. The acceleration in the rate of increase (from +5 cases/day early in the period to +37 cases/day later) shows the bottleneck is worsening. Management should investigate whether staffing levels are adequate or if a process issue is slowing case completion.
### Example 2: Evaluating Process Improvement Impact
**Scenario:** Your team implemented a process automation on March 15th designed to reduce manual approval steps and accelerate case throughput. You want to measure whether the automation successfully reduced work-in-progress levels.
**Settings:**
- Title: "Process Automation Impact Assessment"
- Description: "Compare WIP levels before and after automation deployment"
**Output:**
The output shows active case counts for two weeks before and after the automation deployment:
Before automation (March 1-14):
```
Date Active Case Count
2024-03-01 856
2024-03-05 871
2024-03-10 883
2024-03-14 892
```
After automation (March 16-30):
```
Date Active Case Count
2024-03-16 879
2024-03-20 823
2024-03-25 761
2024-03-30 698
```
**Insights:** The automation had a significant positive impact. Before deployment, active cases were trending upward from 856 to 892 (4% increase). After deployment, active cases declined from 879 to 698 (21% decrease). The reduction in WIP indicates that cases are now completing faster than they arrive, suggesting the automation successfully improved throughput. The steady decline over two weeks shows sustained improvement rather than a temporary effect.
### Example 3: Detecting Weekend and Holiday Patterns
**Scenario:** You're analyzing a customer service ticketing process and want to understand how weekends and holidays affect work-in-progress levels. This will help you determine whether to implement weekend coverage or allow natural fluctuations.
**Settings:**
- Title: "Customer Service WIP Weekly Pattern Analysis"
- Description: "Identify weekend accumulation patterns"
**Output:**
The calculator shows active case counts across a typical month. When visualized as a line chart, you observe:
- Active cases gradually increase Monday through Friday (from ~450 to ~520)
- Cases remain flat or slightly increase Saturday and Sunday (no work completed, but new cases may arrive)
- Monday shows a sharp spike (up to ~580) due to weekend accumulation
- The pattern repeats weekly
Sample data showing one week:
```
Date Active Case Count Day of Week
2024-02-12 452 Monday
2024-02-13 463 Tuesday
2024-02-14 478 Wednesday
2024-02-15 495 Thursday
2024-02-16 518 Friday
2024-02-17 527 Saturday
2024-02-18 531 Sunday
2024-02-19 587 Monday
```
**Insights:** The consistent weekly pattern shows that cases accumulate over the weekend (from 518 Friday to 531 Sunday, then spike to 587 Monday) because no cases complete but new tickets continue arriving. The Monday spike of 56 additional active cases (10% increase) creates a recurring capacity challenge. This pattern suggests either implementing limited weekend support to prevent accumulation, or ensuring adequate Monday staffing to handle the predictable spike. The consistent pattern across multiple weeks indicates this is a structural issue rather than a random variation.
### Example 4: Analyzing Seasonal Capacity Requirements
**Scenario:** Your accounts payable process handles significantly higher invoice volumes during quarter-end periods. You need to quantify the seasonal WIP variations to justify temporary staffing increases during peak periods.
**Settings:**
- Title: "Quarterly Accounts Payable Capacity Analysis"
- Description: "Compare WIP levels during normal and quarter-end periods"
**Output:**
The output shows active case counts across a full quarter, revealing distinct patterns:
Normal period (mid-quarter):
```
Date Active Case Count
2024-02-15 245
2024-02-20 238
2024-02-25 251
```
Quarter-end period (last week of quarter):
```
Date Active Case Count
2024-03-25 312
2024-03-26 367
2024-03-27 423
2024-03-28 489
2024-03-29 537
2024-03-30 582
2024-03-31 641
```
**Insights:** Normal mid-quarter WIP averages around 245 active cases. During the final week of the quarter, WIP more than doubles, peaking at 641 cases on the quarter's last day (162% increase). The dramatic acceleration in the final week (from 312 to 641 cases, adding 329 cases in 6 days) shows that quarter-end creates extreme capacity pressure. This data justifies requesting temporary staff during the last week of each quarter, or implementing a "soft close" policy to spread invoice processing more evenly throughout the month.
### Example 5: Identifying Data Quality Issues
**Scenario:** Your data engineering team recently migrated event log data from a legacy system. You want to verify that the migration correctly preserved case lifecycle information and didn't create artificial gaps in case continuity.
**Settings:**
- Title: "Data Migration Validation - Case Continuity Check"
- Description: "Verify active case counts are logical and continuous"
**Output:**
The calculator reveals an anomaly in the data:
```
Date Active Case Count
2024-01-10 1,247
2024-01-11 1,289
2024-01-12 1,312
2024-01-13 47
2024-01-14 52
2024-01-15 1,278
2024-01-16 1,301
```
**Insights:** The sudden drop from 1,312 active cases to 47 on January 13th, followed by an immediate recovery to 1,278 on January 15th, is impossible in real business operations. A 96% overnight decrease in WIP followed by a 2,359% increase the next day indicates a data migration issue. Most likely, events for January 13-14 were not properly migrated, causing cases to appear artificially completed on January 12th. The data engineering team should investigate the migration scripts for those specific dates and re-import the missing events.
## Output
The calculator produces a data table with the following columns:
**Date (DateTime):** The calendar date for each day in the event log's time range. The time component is always set to 00:00:00 (midnight) as the calculator groups by date only. Dates span from the earliest event timestamp to the latest event timestamp in your filtered dataset.
**Active Case Count (Number):** The count of unique cases that were in progress on that date. This includes all cases where the case start date is on or before the date, and the case end date is on or after the date. Cases are counted once per day regardless of how many events they had on that day.
The output can be visualized as:
- **Line charts:** Ideal for identifying trends, patterns, and anomalies in WIP levels over time
- **Area charts:** Effective for showing the volume of work-in-progress as a filled region
- **Bar charts:** Useful for comparing WIP levels across specific date ranges or time periods
- **Trend analysis:** Apply moving averages to smooth daily variations and identify underlying patterns
- **Statistical summaries:** Calculate mean, median, and standard deviation to understand typical WIP levels and variability
**Interpretation Tips:**
- **Increasing trend:** Cases are arriving faster than they complete (capacity issue or bottleneck)
- **Decreasing trend:** Cases are completing faster than they arrive (excess capacity or reduced demand)
- **Stable pattern:** Process is in equilibrium with balanced arrival and completion rates
- **Sudden spikes:** May indicate data quality issues, process breakdowns, or unusual events
- **Weekly patterns:** Often reveal weekend effects or staffing variations
- **Seasonal patterns:** Show cyclical business demands that require capacity planning
**Note:** Cases with missing start or end timestamps may be excluded from the analysis or counted incorrectly. Ensure your event log has valid timestamps for all events to get accurate active case counts.
---
*This documentation is part of the mindzie Studio process mining platform.*
---
## Activity Information
Section: Calculators
URL: https://docs.mindziestudio.com/mindzie_studio/calculators/activity-information
Source: /docs-master/mindzieStudio/calculators/activity-information/page.md
# Activity Information
## Overview
The Activity Information calculator provides comprehensive frequency statistics and metadata for each activity in your process. This calculator displays detailed information about activity occurrences, case coverage, and configuration settings.
## Common Uses
- View the number of cases each activity appears in
- See the total count of each activity occurrence
- Review activity display names and color configurations
- Identify derived activities vs. original data activities
- Analyze case coverage percentages for each activity
## Settings
There are no specific settings for this calculator beyond the standard title and description fields.
## Output
The Activity Information calculator displays the following columns for each activity:
**Activity:** The original name of the activity as it appears in the source data.
**Display Name:** The name of the activity as shown in calculators, filters, and visualizations.
**Case Count:** The number of unique cases in which this activity appears.
**Case Percent:** The percentage of total cases that contain this activity.
**Activity Count:** The total number of times this activity occurs across all cases.
**Derived:** Indicates whether the activity existed in the original dataset or was derived from other attributes.
**Color:** The color assigned to this activity in process maps and visualizations.
**Description:** Any description text associated with the activity (if provided during configuration).
## Example
### Analyzing Activity Coverage in an Order Process
When you create an Activity Information calculator for an order-to-cash process, you might see:
- "Create Order" appears in 100% of cases (high coverage)
- "Approve Discount" appears in only 15% of cases (exception path)
- "Send Invoice" has a higher activity count than case count (indicating some cases have multiple invoices)
This helps you understand which activities are core to your process and which represent exceptions or variations.
---
*This documentation is part of the mindzie Studio process mining platform.*
---
## AI Causal Analysis (Alpha)
Section: Calculators
URL: https://docs.mindziestudio.com/mindzie_studio/calculators/ai-causal-analysis
Source: /docs-master/mindzieStudio/calculators/ai-causal-analysis/page.md
# AI Causal Analysis (Alpha)
The **AI Causal Analysis** calculator uses machine learning to discover which case attributes most strongly drive a target outcome. Instead of just showing correlation, it isolates the features that have the greatest statistical impact on whether a case meets the outcome you define - so you can move from "what is happening" to "why it is happening."
> **Alpha Feature**: This calculator is part of the mindzie Alpha Program. It requires PreRelease to be enabled for your tenant. See [Alpha Features](/mindzie_studio/alpha/overview) for more information.

## Overview
AI Causal Analysis answers questions like:
- Why do some cases take longer than 7 days to complete?
- Which attributes make an invoice more likely to be paid late?
- What distinguishes cases that breach SLA from those that do not?
- Which facilities, teams, or product categories most influence a given outcome?
You define the outcome (the cases you want to explain), point the calculator at a set of input columns, and it returns a ranked list of the factors most responsible for those cases falling into the outcome group.
### How it compares to Root Cause Analysis
AI Causal Analysis shares a goal with the existing [Root Cause Analysis](/mindzie_studio/calculators/root-cause-analysis) calculator but takes a much more rigorous approach:
| Capability | Root Cause Analysis | AI Causal Analysis |
|------------|---------------------|--------------------|
| Finds single-attribute drivers | Yes | Yes |
| Finds multi-attribute conjunctions (up to 3 attributes per rule) | No | Yes |
| Distinguishes correlation from causation | No | Yes (causal graph + propensity adjustment) |
| Reports confidence intervals | No | Yes (95% Wilson CI on every rule) |
| Controls for multiple testing | No | Yes (Benjamini-Hochberg FDR) |
| Handles numeric / date / time attributes | No (strings only) | Yes (outcome-aware binning) |
| Plain-English narrative per driver | No | Yes |
Use **Root Cause Analysis** for a fast single-attribute scan, and **AI Causal Analysis** for any serious investigation - particularly when someone will act on the result.
## How to Add the Calculator
1. Open a notebook in mindzieStudio
2. Click **Add Calculator** and select **AI Causal Analysis (Alpha)**
3. Configure the outcome and input columns (see below)
4. Click **Create**
---
## Configuration
### Title
The display name of the calculator. Defaults to `AI Causal Analysis (Alpha)` - change it to something specific to the question you are answering, for example `Why are ICU stays long?` or `Drivers of Late Payment`.
### Description
Optional free-text notes. Useful for documenting the business question, the date range the analysis was run on, or the stakeholder who requested it.
### Outcome Definition
The outcome is the group of cases you want to explain. The calculator compares these cases against the rest of the dataset and identifies which input columns best separate the two groups.
Three modes are available for defining the outcome:
#### Filter Mode
Select the **Filter** tab and add one or more filter expressions. The calculator treats cases that match the filter as the "outcome" group.
- **Cases matching**: shown as a percentage and raw count, for example `11.2% of cases / 2,795 of 25,000`
- **Add Filter**: opens the standard filter builder - combine any number of conditions
- **Preview**: updates live as you build the filter so you can validate the selection before running the calculator
Filter mode is the most flexible option. Any condition you can express as a mindzie filter (duration thresholds, attribute matches, activity presence, and so on) can become an outcome. In the screenshot above, the filter `select cases where actual_los_days is greater than 7` defines "Long Cases" as the outcome.
#### Top N% Mode
Select the **Top N%** tab to use the highest (or lowest) values of a numeric attribute as the outcome. This is useful when you want to explain "the worst cases" or "the top performers" without having to pick a hard threshold. Example: the top 10% of cases by cycle time.
#### Threshold Mode
Select the **Threshold** tab to define the outcome with a single numeric cutoff on an attribute. Any case above (or below) the value becomes part of the outcome group. Example: cases where `invoice_amount` exceeds 50,000.
### Outcome Name
A short label that identifies the outcome group in the results, for example `Long Cases`, `Late Payments`, or `SLA Breach`. This name appears throughout the analysis output wherever the outcome group is referenced.
### Input Columns
The columns the model is allowed to use when searching for drivers of the outcome.
- **Column list**: every case attribute in the dataset is shown. Select one or more to include them in the analysis. The columns are highlighted when selected.
- **Auto-select** toggle: when enabled, mindzie automatically picks a sensible default set of input columns based on the dataset schema. Turn this off when you want full manual control - for example to exclude a column that is trivially correlated with the outcome (such as an ID that leaks the answer).
**Tips for choosing input columns:**
- Exclude columns that are downstream of the outcome. If `discharge_date` is used to compute `actual_los_days`, it will dominate the results without adding insight.
- Exclude high-cardinality identifiers (`person_id`, `order_id`) unless you specifically want per-entity effects.
- Include contextual attributes (facility, product category, priority, region) - these are usually where the interesting drivers live.
### Show Advanced Settings
Opens additional tuning options for the search. The defaults work well for most analyses - only override them when you have a specific reason.
| Setting | Default | Purpose |
|---------|---------|---------|
| **Beam width** | 50 | How many candidate rules are kept at each search depth. Higher = more exhaustive, slower. |
| **Max rule depth** | 3 | Longest rule allowed. `3` means rules of the form `A AND B AND C`. |
| **Min cases per rule** | 30 | Rules that would affect fewer than this many cases are discarded as too small to be actionable. |
| **Min lift** | 1.2 | The in-rule outcome rate must exceed the baseline by at least this factor (1.2 = at least 20% higher than baseline). |
| **FDR alpha** | 0.05 | Benjamini-Hochberg significance threshold for controlling false discoveries across the rule search. |
| **Max drivers returned** | 20 | Upper bound on the number of rules shown in the full-table view. |
| **Redundancy Jaccard** | 0.9 | Rules whose case sets overlap by more than this fraction are treated as duplicates and filtered. |
| **Sampling threshold** | 2,000,000 cases | Datasets above this size are deterministically sampled down using Floyd's combination algorithm. The output reports `WasSampled = true` and the actual sample size. |
### Switch to Advanced View
Switches the editor to advanced mode for fine-grained control over every model parameter. The guided view shown here is sufficient for the large majority of use cases.
---
## Typical Workflow
1. **Frame the question** - decide what outcome you want to explain. "What makes cases slow?" becomes a Filter outcome of `case_duration > 7 days`.
2. **Define the outcome** - use Filter, Top N%, or Threshold mode. Verify the **Preview** percentage looks sensible (too few cases will produce unstable results; too many means the outcome is not really distinctive).
3. **Name the outcome** - pick a concise label that will read well in results and reports.
4. **Select input columns** - start with Auto-select, then prune any columns that leak the answer or add noise.
5. **Create** - run the calculator. The result surfaces the ranked drivers of the outcome.
6. **Interpret** - review the top drivers, refine the outcome or input set if needed, and re-run.
---
## Example
A hospital operations team wants to understand why some inpatient stays run longer than 7 days.
| Setting | Value |
|---------|-------|
| Title | AI Causal Analysis (Alpha) |
| Filter mode | `select cases where actual_los_days is greater than 7` |
| Preview | 2,795 of 25,000 cases match (11.2%) |
| Outcome Name | Long Cases |
| Input columns | facility, subunit, bed, order_id, ... (auto-selected) |
After running, the calculator reports which combinations of facility, sub-unit, and care attributes most strongly distinguish long-stay cases from normal-stay cases. This points the team at specific units and workflows to investigate rather than leaving them to explore every attribute manually.
---
## Interpreting the Results
For each top driver, the calculator produces a plain-English narrative paragraph and an evidence badge describing the strength of the finding:
| Badge | Meaning | How to act |
|-------|---------|------------|
| **Causal** | Both the causal-graph signal and the confounder-adjusted effect are positive. | Strongest actionable evidence - safe to prioritise for intervention. |
| **Likely Causal** | The causal graph connects the rule to the outcome, but the effect weakens once we adjust for confounders. | Promising - investigate further before acting. |
| **Associated** | The effect survives adjustment, but the graph does not place the rule on a direct path to the outcome. | Real association, but likely indirect - may be a proxy for the true driver. |
| **Correlational** | There is an association but we cannot confirm a causal relationship. | Diagnostic signal only - do not act on it alone. |
Example narrative for a **Causal** rule:
> Channel = Online is a likely driver of Non-First Contact Resolution. Cases matching this rule show a 46.1% outcome rate vs. the 29.0% baseline (1.59x, 95% CI 1.51x - 1.68x, p < 0.001). It covers 2,518 cases, accounting for 34.7% of all Non-First Contact Resolution occurrences. The effect survived adjustment for other top drivers and sits on a direct path to the outcome in the learned causal graph.
The **Full Table** view adds the complete ranked list with coverage, lift, confidence interval, adjusted effect, p-value, and badge for every rule that survived the search and the significance filter.
---
## How the Algorithm Works
AI Causal Analysis runs a five-stage pipeline. Each stage has a specific job and is designed so the whole thing finishes in seconds even on million-case datasets.
### 1. Preparation and binning
- The calculator takes the cases in your outcome group and labels them `1`; all others are labelled `0`. This is the **baseline rate** you see in the output.
- **Categorical** attributes (strings, booleans, low-cardinality integers) are used directly. Each distinct value becomes a candidate **literal** (e.g., `facility = Memorial`).
- **Numeric and date/time** attributes are binned with an **MDL-optimal, outcome-aware binner**. Instead of picking equal-width or equal-frequency bins, the binner chooses cut-points that best separate outcome from non-outcome cases, then uses the Minimum Description Length principle to pick the number of bins automatically. This turns a numeric column like `actual_los_days` into a small set of meaningful buckets (e.g., `<= 3 days`, `4 - 7 days`, `> 7 days`).
### 2. Bitmap indexing
Every literal is stored as a **bitset** - one bit per case, `1` if the case matches the literal. Combining literals with `AND` becomes a fast bitwise intersection:
- `facility = Memorial AND priority = High` is computed as `bitset_A & bitset_B`.
- Coverage, outcome count, and lift for a candidate rule can be evaluated in microseconds regardless of rule depth.
Literals that cover fewer than **Min cases per rule** are dropped before the search begins.
### 3. Beam-search subgroup discovery
The calculator walks the space of rules breadth-first:
1. **Depth 1**: evaluate every single literal. Score each one using a quality measure (lift and Weighted Relative Accuracy) and keep the top `Beam width` (default 50).
2. **Depth 2**: extend every kept rule with every other compatible literal to form conjunctions like `A AND B`. Score them all and keep the top `Beam width` again.
3. **Depth 3**: repeat one more time. Stop at `Max rule depth`.
Rules that fall below `Min lift` or `Min cases per rule` are pruned at every level.
After the search, a **Jaccard redundancy filter** removes near-duplicate rules: if two rules cover essentially the same cases (overlap above `Redundancy Jaccard`, default 0.9), only the better one is kept.
### 4. Statistical significance
For each surviving rule the calculator computes:
- The **risk ratio** (in-rule outcome rate divided by baseline rate) and its **95% Wilson confidence interval**, which is well-behaved for small and extreme probabilities where the normal approximation fails.
- A **p-value** under the null hypothesis that the rule has no effect.
- A **Benjamini-Hochberg FDR correction** across all tested rules. `FDR alpha` (default 0.05) sets the expected false-discovery rate. Rules that do not survive FDR are not reported, which is what prevents the search from drowning you in spurious findings.
### 5. Causal adjudication
Significance alone still only tells you there is an association. Two extra signals decide whether a rule gets a **Causal** badge:
- **Causal-graph signal** - a lightweight Bayesian structural score learned from the attributes and the outcome. It asks: does this rule sit on a direct path to the outcome in the learned graph, or only on an indirect path through a confounder?
- **Propensity-score adjustment** - a ridge-regularised logistic regression models the probability that each case matches the rule, given all the other top drivers. The rule's effect is then re-estimated after weighting by that propensity. If the effect shrinks to zero, the rule was just a proxy for other drivers; if it persists, it has independent explanatory power.
The adjudicator combines both signals into the four evidence badges defined above.
### 6. Narrative generation
The final step composes the plain-English paragraph shown in the card view. It weaves together the rule definition, the in-rule and baseline outcome rates, the risk ratio and confidence interval, the p-value, the coverage, and the evidence badge into a sentence structure tuned to read naturally to a non-statistical reader.
---
## Performance
Measured on a development machine:
| Dataset | Time |
|---------|------|
| 100,000 cases x 4 columns | under 1 second |
| 200,000 cases x 20 columns | under 2 seconds |
| 1,000,000 cases x 50 columns | around 3 seconds |
Datasets above the sampling threshold (default 2,000,000 cases) are deterministically sampled using Floyd's combination algorithm. When this happens the output flags `WasSampled = true` and reports the actual sample size so the result is reproducible and the sampling is visible.
---
## Known Limitations (v1)
- **Binary outcomes only.** Multi-class outcomes (fast / medium / slow, for example) are not supported in this release. Define two-way splits as separate analyses.
- **No per-case explanations yet.** v1 answers "what drives this outcome across the dataset?" A future release will add "why did this specific case go wrong?" panels.
- **No temporal drift analysis.** If the drivers change between quarters, v1 will not split them over time. Run the calculator separately on each time slice when that matters.
- **Numeric binning is outcome-aware.** If you want fixed, human-chosen bins, pre-bucket the column with an enrichment before running the calculator.
---
## Use Cases
### Performance Drivers
Identify the attributes most associated with cases that breach SLA, exceed budget, or run past their expected duration. Works well with a Filter outcome built on a duration or KPI enrichment.
### Outcome Analysis
Compare successful cases against failed or cancelled ones. Use a Filter outcome on a status or outcome attribute to see which upstream attributes predict each outcome.
### Risk and Compliance
Point the calculator at cases flagged by a conformance or control enrichment to learn which contextual factors correlate with compliance failures.
### Top-Performer Analysis
Use Top N% mode to explain what makes your best cases, teams, or customers different from the rest. Feed the insights back into process design or training.
---
## Tips
- **Start simple**. A well-chosen Filter with two or three conditions plus auto-selected inputs usually produces the clearest results.
- **Watch the preview percentage**. If the outcome group is less than ~2% or more than ~50% of the dataset, the analysis becomes harder to interpret. Adjust the filter until the group is a meaningful minority.
- **Iterate on input columns**. Remove columns whose presence dominates results without insight (IDs, timestamps that leak the outcome), then re-run.
- **Name outcomes specifically**. `Long Cases` beats `Outcome 1` when you share results with stakeholders or compose them into reports.
- **Pair with the Decision Tree calculator** for a second view on the same question. Decision Tree shows the branching structure; AI Causal Analysis ranks overall feature impact.
---
## Related Calculators
- [Decision Tree](/mindzie_studio/calculators/decision-tree) - complementary view showing how attributes split cases into outcome groups
- [Root Cause Analysis](/mindzie_studio/calculators/root-cause-analysis) - deterministic statistical root-cause discovery for KPI deviations
- [Case Outcome By Category](/mindzie_studio/calculators/case-outcome-by-category) - compare outcome rates across a chosen categorical attribute
## Related Features
- [AI Studio (Alpha)](/mindzie_studio/alpha/ai-studio) - the broader predictive analytics workspace, including Feature Impact and Root Cause
- [Alpha Features Overview](/mindzie_studio/alpha/overview) - full list of features in the mindzie Alpha Program
---
## Providing Feedback
AI Causal Analysis is an Alpha feature and your input directly shapes how it evolves:
- **Email**: support@mindzie.com
- **Subject**: Include `Alpha Feedback: AI Causal Analysis`
- **Include**: the outcome definition you used, the input columns, what you expected, and what you got
---
## Attribute Activity Matrix
Section: Calculators
URL: https://docs.mindziestudio.com/mindzie_studio/calculators/attribute-activity-matrix
Source: /docs-master/mindzieStudio/calculators/attribute-activity-matrix/page.md
# Attribute-Activity Matrix
## Overview
The Attribute-Activity Matrix calculator provides a comprehensive cross-tabulation showing the relationship between attributes and activities in your event log. For each combination of attribute and activity, it displays the number of cases that have values, helping administrators understand data completeness patterns and identify data quality issues.
**IMPORTANT: This is an administrator-only calculator designed for technical analysis and data quality assessment.** It generates a matrix showing how attributes are populated across different activities, which is essential for understanding data extraction patterns, identifying missing data, and validating event log structure.
This calculator is primarily used by system administrators and data quality specialists who need to understand attribute population patterns across process activities for troubleshooting, validation, or dataset optimization.
## Common Uses
- Identify which activities populate specific attributes to understand data flow through the process
- Detect missing attribute values for specific activities that should have data
- Validate that critical attributes are populated at the expected process stages
- Diagnose data extraction issues by identifying systematic gaps in attribute population
- Understand attribute dependencies on specific activities for ETL design
- Document which activities contribute data to which attributes for technical specifications
## Settings
This calculator requires no specific configuration settings. When executed, it automatically generates a matrix showing all attributes (both case-level and event-level) against all activities, with cell values indicating the number of cases where that attribute has a value for that activity.
**Note:** For datasets with many attributes and activities, this matrix can be very large. The calculator displays the complete matrix, which may require scrolling to review all combinations.
## Examples
### Example 1: Validating Approval Data Completeness
**Scenario:** You have implemented a new approval tracking system and need to verify that approval-related attributes are being populated correctly at each approval stage in your purchase order process.
**Settings:**
- Title: "Approval Attribute Population Analysis"
- Description: "Validate approval data capture across P2P process"
**Output:**
The calculator displays a matrix with activities as columns and attributes as rows. For the approval-related attributes, you see:
| Attribute | Create PO | Submit for Approval | L1 Approval | L2 Approval | Finance Approval | Send to Vendor |
|-----------|-----------|---------------------|-------------|-------------|------------------|----------------|
| ApproverName | 0 | 0 | 1,847 | 456 | 234 | 0 |
| ApprovalLevel | 0 | 0 | 1,847 | 456 | 234 | 0 |
| ApprovalTimestamp | 0 | 0 | 1,847 | 456 | 234 | 0 |
| ApprovalComments | 0 | 0 | 1,523 | 398 | 189 | 0 |
| DelegatedBy | 0 | 0 | 234 | 67 | 23 | 0 |
**Insights:** The matrix confirms that approval attributes are correctly populated only during approval activities (L1, L2, and Finance Approval), with zero population during other activities as expected. All 1,847 cases that reach L1 Approval have ApproverName, ApprovalLevel, and ApprovalTimestamp populated, indicating complete data capture. However, ApprovalComments shows lower population (1,523 cases instead of 1,847 at L1), revealing that 324 cases lack approval comments - this may be acceptable if comments are optional, but warrants investigation. The DelegatedBy attribute appears only for a subset of approvals, correctly capturing delegation scenarios.
### Example 2: Identifying Data Extraction Gaps
**Scenario:** After merging data from multiple source systems in your order-to-cash process, you suspect that some attributes are not being populated consistently across all expected activities.
**Settings:**
- Title: "Multi-Source Data Completeness Check"
- Description: "Validate attribute population from CRM, ERP, and shipping systems"
**Output:**
| Attribute | Create Order | Credit Check | Pick Items | Pack Items | Ship | Generate Invoice | Receive Payment |
|-----------|--------------|--------------|------------|------------|------|------------------|-----------------|
| CustomerName | 2,456 | 2,456 | 2,456 | 2,456 | 2,456 | 2,456 | 2,456 |
| CreditScore | 2,456 | 2,456 | 2,456 | 2,456 | 2,456 | 2,456 | 2,456 |
| WarehouseLocation | 0 | 0 | 2,456 | 2,456 | 2,456 | 0 | 0 |
| CarrierName | 0 | 0 | 0 | 0 | 2,456 | 0 | 0 |
| TrackingNumber | 0 | 0 | 0 | 0 | 2,234 | 0 | 0 |
| InvoiceAmount | 0 | 0 | 0 | 0 | 0 | 2,456 | 2,456 |
| PaymentMethod | 0 | 0 | 0 | 0 | 0 | 0 | 1,987 |
**Insights:** The matrix reveals several data quality issues. CustomerName and CreditScore are case-level attributes (populated across all activities for all cases), which is expected. WarehouseLocation correctly appears only for warehouse activities (Pick, Pack, Ship). However, TrackingNumber shows only 2,234 cases instead of the expected 2,456 at Ship activity, revealing that 222 shipments lack tracking numbers - a critical gap requiring investigation. PaymentMethod shows only 1,987 cases at Receive Payment instead of the expected 2,456, indicating that 469 payments lack payment method data, suggesting an integration issue with the payment system.
### Example 3: Understanding Attribute Lifecycle
**Scenario:** You need to document when specific attributes become available during the process lifecycle to guide downstream analytics and reporting design.
**Settings:**
- Title: "Attribute Lifecycle Documentation"
- Description: "Map when each attribute is populated in invoice processing"
**Output:**
| Attribute | Receive Invoice | Validate Invoice | Match to PO | Approve Payment | Schedule Payment | Make Payment | Close Case |
|-----------|-----------------|------------------|-------------|-----------------|------------------|--------------|------------|
| InvoiceNumber | 3,456 | 3,456 | 3,456 | 3,456 | 3,456 | 3,456 | 3,456 |
| VendorID | 3,456 | 3,456 | 3,456 | 3,456 | 3,456 | 3,456 | 3,456 |
| PONumber | 0 | 0 | 3,456 | 3,456 | 3,456 | 3,456 | 3,456 |
| MatchStatus | 0 | 0 | 3,456 | 3,456 | 3,456 | 3,456 | 3,456 |
| ApprovedAmount | 0 | 0 | 0 | 3,456 | 3,456 | 3,456 | 3,456 |
| PaymentDate | 0 | 0 | 0 | 0 | 3,456 | 3,456 | 3,456 |
| ActualPaymentDate | 0 | 0 | 0 | 0 | 0 | 3,456 | 3,456 |
| ClosureReason | 0 | 0 | 0 | 0 | 0 | 0 | 3,456 |
**Insights:** This matrix clearly shows the attribute lifecycle. InvoiceNumber and VendorID are populated from the beginning (case-level attributes set at invoice receipt). PONumber and MatchStatus become available only after the Match to PO activity, making them unavailable for earlier process stages. ApprovedAmount appears at Approve Payment and persists through subsequent activities. PaymentDate (scheduled date) appears at Schedule Payment, while ActualPaymentDate only appears at Make Payment, distinguishing planned from actual dates. ClosureReason is populated only at the final activity. This lifecycle understanding is critical for designing analytics that depend on specific attributes.
### Example 4: Detecting Systematic Data Quality Issues
**Scenario:** Users report inconsistent data availability in analyses. You need to identify whether certain activities systematically fail to populate expected attributes.
**Settings:**
- Title: "Systematic Data Gap Analysis"
- Description: "Identify activities with missing attribute population"
**Output:**
| Attribute | Verify Request | Assign Resource | Start Work | Quality Check | Complete Work | Document Results |
|-----------|----------------|-----------------|------------|---------------|---------------|------------------|
| RequestID | 5,678 | 5,678 | 5,678 | 5,678 | 5,678 | 5,678 |
| AssignedTo | 0 | 5,678 | 5,678 | 5,678 | 5,678 | 5,678 |
| WorkCategory | 0 | 5,678 | 5,678 | 5,678 | 5,678 | 5,678 |
| StartTime | 0 | 0 | 5,678 | 5,678 | 5,678 | 5,678 |
| QualityScore | 0 | 0 | 0 | 4,234 | 4,234 | 4,234 |
| CompletionNotes | 0 | 0 | 0 | 0 | 5,678 | 5,678 |
| DocumentationLink | 0 | 0 | 0 | 0 | 0 | 3,456 |
**Insights:** The matrix reveals a critical data quality issue. QualityScore should be populated at Quality Check for all cases (5,678), but only 4,234 cases have this attribute, meaning 1,444 cases (25%) are missing quality scores. This is a systematic gap that could indicate a problem with the quality inspection system or data extraction. Additionally, DocumentationLink is missing for 2,222 cases (39%) at the Document Results activity, suggesting that documentation is being skipped for a significant portion of work. These systematic gaps need immediate attention to ensure data integrity.
### Example 5: Validating Multi-System Integration
**Scenario:** Your process integrates data from three different systems (CRM, ERP, and logistics), and you need to verify that attributes from each system are correctly associated with the appropriate activities.
**Settings:**
- Title: "Multi-System Integration Validation"
- Description: "Verify attribute population from CRM, ERP, and logistics systems"
**Output:**
| Attribute | Enter Order (CRM) | Reserve Inventory (ERP) | Allocate Stock (ERP) | Dispatch (Logistics) | Deliver (Logistics) | Confirm Receipt (CRM) |
|-----------|-------------------|------------------------|----------------------|----------------------|---------------------|----------------------|
| CustomerID (CRM) | 8,945 | 8,945 | 8,945 | 8,945 | 8,945 | 8,945 |
| SalesRepID (CRM) | 8,945 | 8,945 | 8,945 | 8,945 | 8,945 | 8,945 |
| SKU (ERP) | 8,945 | 8,945 | 8,945 | 8,945 | 8,945 | 8,945 |
| InventoryLocation (ERP) | 0 | 8,945 | 8,945 | 8,945 | 8,945 | 8,945 |
| StockLevel (ERP) | 0 | 8,945 | 8,945 | 8,945 | 8,945 | 8,945 |
| CarrierID (Logistics) | 0 | 0 | 0 | 8,945 | 8,945 | 8,945 |
| DeliveryStatus (Logistics) | 0 | 0 | 0 | 8,945 | 8,945 | 8,945 |
| ReceivedBy (CRM) | 0 | 0 | 0 | 0 | 0 | 7,234 |
**Insights:** The matrix validates that most system integrations are working correctly. CRM attributes (CustomerID, SalesRepID) are available throughout the process as expected for case-level attributes. ERP attributes (InventoryLocation, StockLevel) correctly appear starting from Reserve Inventory activity. Logistics attributes (CarrierID, DeliveryStatus) properly appear from Dispatch onward. However, there is a significant issue with ReceivedBy attribute - only 7,234 cases out of 8,945 have this populated at Confirm Receipt, meaning 1,711 deliveries (19%) lack confirmation of who received the order. This requires investigation into the CRM confirmation workflow.
### Example 6: Planning Attribute Enrichment Strategy
**Scenario:** You want to identify which attributes have sparse population and might benefit from enrichment with reference data or improved data capture processes.
**Settings:**
- Title: "Attribute Enrichment Opportunity Analysis"
- Description: "Identify sparse attributes needing enrichment"
**Output:**
| Attribute | Submit Claim | Review Documents | Assess Damage | Approve Amount | Issue Payment | Close Claim |
|-----------|--------------|------------------|---------------|----------------|---------------|-------------|
| ClaimNumber | 12,456 | 12,456 | 12,456 | 12,456 | 12,456 | 12,456 |
| PolicyNumber | 12,456 | 12,456 | 12,456 | 12,456 | 12,456 | 12,456 |
| AdjusterID | 0 | 12,456 | 12,456 | 12,456 | 12,456 | 12,456 |
| AdjusterName | 0 | 0 | 0 | 0 | 0 | 0 |
| DamageCategory | 0 | 0 | 12,456 | 12,456 | 12,456 | 12,456 |
| EstimatedCost | 0 | 0 | 12,456 | 12,456 | 12,456 | 12,456 |
| ApprovalReason | 0 | 0 | 0 | 12,456 | 12,456 | 12,456 |
| PaymentMethodCode | 0 | 0 | 0 | 0 | 12,456 | 12,456 |
| PaymentMethodName | 0 | 0 | 0 | 0 | 0 | 0 |
**Insights:** The matrix reveals excellent enrichment opportunities. AdjusterID is populated for all cases from Review Documents onward (12,456 cases), but AdjusterName is never populated. Enriching AdjusterID with adjuster names from an employee lookup table would make analyses more user-friendly. Similarly, PaymentMethodCode is populated for all payments (12,456 cases) but PaymentMethodName is missing. Enriching payment method codes with descriptive names would significantly improve reporting readability. These enrichments would add substantial value with minimal effort since the reference IDs are already present.
## Output
The Attribute-Activity Matrix calculator displays a comprehensive matrix table with the following structure:
**Rows:** Each row represents one attribute from your event log, including both case-level attributes (which apply to the entire case) and event-level attributes (which may vary by activity).
**Columns:** Each column represents one unique activity from your process.
**Cell Values:** Each cell contains a number representing how many cases have a value for that attribute at that activity. A value of 0 means the attribute is not populated for any cases at that activity.
### Understanding Cell Values
**Case-Level Attributes:** For case-level attributes (like CustomerID, OrderNumber, etc.), the cell value will be the same across all activities for that row, showing the total number of cases where the attribute has a value.
**Event-Level Attributes:** For event-level attributes (like ApproverName, WarehouseLocation, etc.), the cell values vary by activity, showing where in the process that attribute gets populated.
**Zero Values:** A cell value of 0 indicates that the attribute is never populated at that activity, which may be expected behavior or may indicate a data quality issue depending on your process.
### Interactive Features
**Sort and Filter:** Click column headers to sort the matrix by activity. Use browser search to quickly locate specific attributes of interest.
**Export Results:** Export the complete matrix to Excel or CSV for detailed offline analysis, documentation, or sharing with technical teams.
**Large Matrices:** For processes with many activities and attributes, the matrix may be very large. Consider using horizontal and vertical scrolling to navigate the full matrix.
### Interpreting Population Patterns
**Consistent Population:** If an attribute shows the same non-zero value across all activities, it is a case-level attribute populated early in the process.
**Progressive Population:** If an attribute shows zero values for early activities and non-zero values for later activities, it indicates the attribute is populated at a specific process stage.
**Partial Population:** If an attribute shows a value less than the total case count, some cases are missing that attribute, indicating potential data quality issues or optional fields.
**Activity-Specific Population:** If an attribute shows non-zero values only for specific activities, it is an event-level attribute relevant only to those activities.
### Performance Considerations
- **Large Datasets:** For datasets with hundreds of attributes and activities, this calculator may require significant time to process
- **Resource Usage:** The calculator scans all attribute-activity combinations, which is computationally intensive
- **Best Practices:** Run this calculator during off-peak hours for very large datasets
### Administrative Access
This calculator is restricted to users with Administrator role. Regular users who need to understand dataset characteristics should use the Dataset Information calculator instead, which provides summary metrics without the detailed attribute-activity breakdown.
---
*This documentation is part of the mindzie Studio process mining platform.*
---
## Automation
Section: Calculators
URL: https://docs.mindziestudio.com/mindzie_studio/calculators/automation
Source: /docs-master/mindzieStudio/calculators/automation/page.md
# Automation
## Overview
The Automation calculator identifies and ranks activities by their automation potential, helping you prioritize which manual tasks would benefit most from automation initiatives. This calculator analyzes activity frequency and cost to calculate an automation score for each activity, making it easy to focus your RPA (Robotic Process Automation) and automation investments on high-value opportunities.
## Common Uses
- Identify high-value automation opportunities across your process
- Prioritize RPA initiatives based on cost savings potential
- Build business cases for automation investments with quantified savings
- Discover repetitive manual tasks suitable for automation
- Track automation opportunities over time to measure initiative effectiveness
- Focus automation efforts on activities with highest return on investment
## Settings
This calculator requires no configuration settings. It automatically analyzes all activities in your current filtered data and calculates automation scores based on frequency and cost information.
**Optional Enhancement:** For cost-weighted automation scoring, configure estimated costs for each activity in your process. Without cost data, the calculator uses frequency-based scoring to identify repetitive activities.
## Examples
### Example 1: Discovering Top Automation Opportunities
**Scenario:** You want to identify which activities in your invoice processing workflow would benefit most from automation to reduce manual effort and costs.
**Settings:**
- No settings required (calculator runs automatically)
**Output:**
The calculator displays a ranked table of all activities:
| Activity | Automation Score | Activity Count | Total Cost |
|----------|-----------------|----------------|------------|
| Manual Data Entry | 37.50 | 3,000 | $45,000 |
| Document Review | 28.75 | 2,300 | $34,500 |
| Exception Handling | 22.40 | 1,400 | $21,000 |
| Approval Routing | 18.20 | 1,820 | $18,200 |
| Data Validation | 15.60 | 2,600 | $13,000 |
**Insights:** Manual Data Entry has the highest automation score (37.50), indicating it occurs frequently and has high cost. With 3,000 executions costing $45,000 total, automating this activity could save approximately $36,000 annually (assuming 80% reduction). This makes it the top priority for your RPA initiative.
Document Review is the second-highest opportunity with $34,500 in total costs. Together, these two activities represent $79,500 in potential savings, making a strong business case for automation investment.
### Example 2: Department-Specific Automation Planning
**Scenario:** Your organization wants to identify automation opportunities specifically within the Accounts Payable department to improve their efficiency.
**Step 1 - Filter to Department:**
Create a "Cases with Attribute" filter:
- Attribute: Department
- Value: Accounts Payable
**Step 2 - Run Automation Calculator:**
Add the Automation calculator to your analysis.
**Output:**
| Activity | Automation Score | Activity Count | Total Cost |
|----------|-----------------|----------------|------------|
| Match PO to Invoice | 42.30 | 4,500 | $67,500 |
| Vendor Validation | 31.20 | 3,900 | $39,000 |
| Payment Processing | 24.50 | 2,450 | $36,750 |
| GL Coding | 19.80 | 3,300 | $26,400 |
**Insights:** The Accounts Payable department's top automation opportunity is Match PO to Invoice, which occurs 4,500 times with a total cost of $67,500. This three-way matching process is highly repetitive and rule-based, making it an excellent candidate for RPA.
By focusing on the top three activities, the department could potentially automate processes costing $143,250 annually, likely achieving 70-90% reduction in manual effort. This targeted analysis helps build a department-specific automation roadmap.
### Example 3: Tracking Automation Initiative Success
**Scenario:** Six months ago you automated your top three manual activities. Now you want to measure the effectiveness of your automation initiative.
**Step 1 - Before Automation (6 months ago):**
Original Automation calculator results showed:
- Manual Invoice Entry: 5,200 occurrences, $78,000 total cost
- Document Classification: 3,800 occurrences, $45,600 total cost
- Data Extraction: 4,100 occurrences, $41,000 total cost
**Step 2 - After Automation (current):**
Run the Automation calculator on recent data:
| Activity | Automation Score | Activity Count | Total Cost |
|----------|-----------------|----------------|------------|
| Exception Handling | 28.50 | 1,900 | $28,500 |
| Complex Approvals | 22.10 | 1,470 | $22,050 |
| Manual Invoice Entry | 4.20 | 350 | $5,250 |
**Insights:** The automation initiative was highly successful. Manual Invoice Entry dropped from 5,200 occurrences to just 350 (a 93% reduction), and from $78,000 to $5,250 (a 93% cost reduction). The activity that was previously your top automation opportunity has moved down to third place, now handling only exceptions.
Document Classification and Data Extraction no longer appear in the top activities, indicating near-complete automation. Your focus can now shift to Exception Handling and Complex Approvals as the next automation priorities. The initiative delivered approximately $156,000 in annualized savings from these three activities alone.
### Example 4: Building an Automation Business Case
**Scenario:** Your CFO requests a data-driven business case for a proposed $150,000 RPA platform investment. You need to quantify the potential return on investment.
**Settings:**
- No settings required
**Analysis Workflow:**
1. Run the Automation calculator on your full process dataset
2. Review the top 10 activities by Automation Score
3. Assess technical feasibility for each activity
4. Calculate ROI based on Total Cost
**Output:**
Top 5 technically feasible automation candidates:
| Activity | Total Cost | Automation Potential |
|----------|-----------|---------------------|
| Invoice Data Entry | $125,000 | 90% automatable |
| PO Matching | $89,000 | 85% automatable |
| Vendor Lookup | $67,500 | 95% automatable |
| GL Code Assignment | $54,000 | 80% automatable |
| Payment Scheduling | $42,000 | 75% automatable |
**Business Case Calculation:**
- Total annual cost of top 5 activities: $377,500
- Average automation reduction: 85%
- Annual savings potential: $320,875
- RPA platform investment: $150,000
- Payback period: 5.6 months
- 3-year ROI: 541%
**Insights:** The Automation calculator identified $377,500 in annual costs from just five high-priority activities. With an average 85% automation rate, you can achieve $320,875 in annual savings. This provides a compelling business case showing payback in under 6 months and over 5x return in 3 years.
The calculator's Total Cost column makes it easy to quantify savings potential, turning automation from a technical initiative into a strategic business investment with measurable financial impact.
## Output
The calculator produces a ranked table with the following columns:
**Activity:** The name of each activity in your process.
**Automation Score:** A calculated score representing automation potential. Higher scores indicate better automation candidates. When activity cost data is configured, the score represents the average cost impact per case. Without cost data, it represents the average frequency per case.
**Activity Count:** The total number of times this activity occurs in your filtered dataset.
**Total Cost:** The cumulative cost of all executions of this activity. This value is calculated only when you have configured estimated costs for activities in your process metadata. Use this column to quantify potential savings from automation.
The table is automatically sorted by Automation Score (highest first), making your top automation opportunities immediately visible. Activities at the top of the list offer the best combination of frequency and cost, representing your highest-value automation targets.
**Pro Tip:** Focus on the top 10-20 activities for action planning. Combine Automation Score with Activity Count to balance high-impact opportunities (high score) with implementation complexity (high count may indicate more edge cases to handle).
---
*This documentation is part of the mindzie Studio process mining platform.*
---
## Average Value
Section: Calculators
URL: https://docs.mindziestudio.com/mindzie_studio/calculators/average-value
Source: /docs-master/mindzieStudio/calculators/average-value/page.md
# Average Value
## Overview
The Average Value calculator computes the mean value of a selected numerical attribute across all cases or events in your process. This calculator provides a single aggregate statistic that summarizes the central tendency of your data.
## Common Uses
- Calculate average payment timeliness across invoices
- Determine average invoice amounts
- Find average order values
- Measure average processing times
- Add average value metrics to dashboards
## Settings
**Attribute Name:** Select the numerical attribute for which you want to calculate the average value. This can be any case or event attribute containing numeric data.
## Examples
### Example 1: Average Payment Timeliness
**Scenario:** You want to know the average payment timeliness across all invoices to understand whether payments are typically early or late.
**Settings:**
- Attribute Name: PaymentTimeliness
**Output:**
The output shows a single value, such as "-16 days", indicating that on average, payments are made 16 days early (negative values indicate early payment).
**Insights:** This helps you understand payment behavior patterns and identify if early payment discounts are being utilized effectively.
### Example 2: Average Total Invoice Value
**Scenario:** You want to calculate the average invoice value to understand typical transaction sizes.
**Settings:**
- Attribute Name: Total Invoice Value
**Output:**
The calculator displays the mean invoice amount across all cases, helping you understand your typical transaction size.
**Insights:** This metric is useful for financial forecasting, identifying outlier transactions, and setting payment approval thresholds.
## Output
The calculator displays a single numerical value representing the arithmetic mean of the selected attribute across all applicable cases or events.
---
*This documentation is part of the mindzie Studio process mining platform.*
---
## Boolean Counts
Section: Calculators
URL: https://docs.mindziestudio.com/mindzie_studio/calculators/boolean-counts
Source: /docs-master/mindzieStudio/calculators/boolean-counts/page.md
# Boolean Counts
## Overview
The Boolean Counts calculator analyzes all boolean (true/false) attributes in your process data and displays how many cases have true values for each attribute. It shows both the count and percentage of cases where each boolean flag is set to true, helping you understand the prevalence of binary characteristics across your process.
This calculator automatically identifies all boolean columns in your case data and provides a comprehensive summary, making it easy to spot patterns in compliance flags, quality indicators, process completion markers, or any other yes/no characteristics.
## Common Uses
- Track compliance rates across multiple regulatory requirements
- Analyze feature adoption or option selection rates
- Monitor quality check pass rates across different inspection types
- Measure process completeness indicators (e.g., document received, approval obtained)
- Identify which boolean flags are most commonly true or false
- Compare prevalence of different binary characteristics in your process
## Settings
**Attribute Names (Optional):** Select specific boolean attributes to analyze. If left empty, the calculator will automatically analyze all boolean attributes in your case data.
Leave this setting empty to get a complete overview of all boolean flags, or select specific attributes when you want to focus on particular characteristics.
## Examples
### Example 1: Compliance Requirements Analysis
**Scenario:** Your procurement process has multiple compliance requirements tracked as boolean flags (e.g., ContractSigned, BudgetApproved, SecurityReviewed, ManagerApproved). You want to see which requirements are most commonly met and identify potential compliance gaps.
**Settings:**
- Attribute Names: (leave empty to analyze all boolean attributes)
**Output:**
The calculator displays a table with one row per boolean attribute:
- ContractSigned: 847 cases (94.2%)
- BudgetApproved: 782 cases (87.0%)
- SecurityReviewed: 623 cases (69.3%)
- ManagerApproved: 899 cases (100.0%)
**Insights:** Manager approval is consistently obtained (100%), but security reviews are only completed in 69% of cases, revealing a potential compliance gap. This suggests you may need to strengthen the security review process or investigate why it's being skipped in nearly one-third of procurement cases.
### Example 2: Quality Inspection Analysis
**Scenario:** Your manufacturing process tracks multiple quality checks as boolean flags (e.g., DimensionsPass, MaterialsPass, FinishPass, FunctionalPass). You want to identify which quality checks have the highest failure rates.
**Settings:**
- Attribute Names: DimensionsPass, MaterialsPass, FinishPass, FunctionalPass
**Output:**
The calculator shows pass rates for each quality check:
- DimensionsPass: 1,234 cases (98.7%)
- MaterialsPass: 1,189 cases (95.1%)
- FinishPass: 1,098 cases (87.8%)
- FunctionalPass: 1,242 cases (99.4%)
**Insights:** The finish quality check has the lowest pass rate at 87.8%, indicating this is where most quality issues occur. You should investigate the finishing process to understand why nearly 12% of items fail this inspection and implement improvements to reduce defects.
### Example 3: Document Completeness Dashboard
**Scenario:** Your loan application process requires various documents (e.g., IncomeProofReceived, IdentityVerified, CreditCheckCompleted, EmploymentConfirmed). You want to create a dashboard showing document collection rates.
**Settings:**
- Attribute Names: (leave empty to see all document flags)
**Output:**
The calculator displays collection rates for each document type:
- IncomeProofReceived: 456 cases (91.2%)
- IdentityVerified: 498 cases (99.6%)
- CreditCheckCompleted: 482 cases (96.4%)
- EmploymentConfirmed: 423 cases (84.6%)
**Insights:** Employment confirmation has the lowest completion rate at 84.6%, creating a bottleneck in the loan approval process. This suggests you may need to improve the employment verification process or provide better communication to applicants about this requirement. The high identity verification rate (99.6%) shows this step is working effectively.
## Output
The calculator produces a table with the following columns:
- **Attribute Name:** The display name of each boolean attribute
- **Case Count:** The number of cases where the attribute has a true value
- **Percentage:** The percentage of total cases where the attribute is true
Each row represents one boolean attribute, making it easy to compare prevalence rates across different characteristics. The results are sorted alphabetically by attribute name.
You can add this analysis to a dashboard to monitor boolean characteristics over time or use it as a starting point for deeper investigation by clicking on specific rows to see which cases have particular flags set.
---
*This documentation is part of the mindzie Studio process mining platform.*
---
## BPMN
Section: Calculators
URL: https://docs.mindziestudio.com/mindzie_studio/calculators/bpmn
Source: /docs-master/mindzieStudio/calculators/bpmn/page.md
# BPMN
## Overview
The BPMN calculator automatically generates Business Process Modeling Notation (BPMN) 2.0 standard diagrams from your event log data using advanced process discovery algorithms. It analyzes your process execution data and produces industry-standard BPMN XML files that can be opened in popular BPMN tools like Camunda Modeler, Signavio, and bpmn.io.
Unlike the interactive Process Map calculator which visualizes your process in mindzieStudio, the BPMN calculator creates formal, executable process models that conform to the BPMN 2.0 specification. This makes them suitable for process automation, formal verification, documentation, and sharing with stakeholders who use standard BPM tools.
## Common Uses
- Generate formal BPMN process models for process automation and workflow engine deployment
- Create standardized process documentation that can be edited and shared using industry-standard BPMN tools
- Discover process structures including gateways (XOR, AND, OR) and control flow patterns from event data
- Produce executable process models for BPM systems like Camunda, Flowable, or jBPM
- Compare discovered process models across different time periods, departments, or regions
- Export process models for regulatory compliance documentation and audit trails
- Identify parallel activities and concurrency patterns in manufacturing or approval workflows
## Settings
**Discovery Algorithm:** Select which process discovery algorithm to use for generating the BPMN model. Each algorithm has different strengths:
- **Split Miner (default):** Handles concurrency well, detects all gateway types (XOR, AND, OR), and models loops effectively. Best for complex processes with parallelism and real-world event logs with noise. Uses the Ebsilon and Eta parameters for tuning.
- **Inductive Miner:** Guarantees sound models (no deadlocks) and produces block-structured processes suitable for execution. Best for processes requiring formal verification, BPM system execution, and compliance checking. Does not use Ebsilon or Eta parameters.
**Ebsilon:** Controls concurrency detection sensitivity in the Split Miner algorithm. This parameter determines how the algorithm distinguishes between sequential and concurrent activities based on edge frequency ratios.
- Lower values (0.05-0.1): Require more balanced edge frequencies to declare concurrency, resulting in more sequential models
- Default value (0.1): Good starting point for balanced process models
- Higher values (0.2-0.3): Allow imbalanced frequencies, detecting more parallelism in the model
Only applies when Discovery Algorithm is set to Split Miner. Recommended range: 0.05 - 0.2 for most processes.
**Eta:** Controls edge filtering threshold in the Split Miner algorithm. This parameter determines how aggressively the algorithm prunes infrequent process paths by calculating a percentile threshold and removing edges below it.
- Lower values (0.2-0.3): Preserve more process variations but increase model complexity
- Default value (0.4): Filters approximately 40% of less frequent paths
- Higher values (0.6-0.8): Create simpler models by removing more infrequent paths
Only applies when Discovery Algorithm is set to Split Miner. Recommended range: 0.3 - 0.5 for balanced complexity.
**Diagram Orientation:** Controls whether the BPMN diagram flows horizontally (left to right) or vertically (top to bottom).
- **Horizontal (default):** Standard BPMN layout with process flowing left to right
- **Vertical:** Alternative layout with process flowing top to bottom, useful for tall narrow displays
**Border Label:** Optional text label to include in the BPMN diagram metadata. Use this to identify the process, specify the analysis context, or provide additional information about the discovered model. This label appears in BPMN visualization tools and helps distinguish between multiple process models.
## Examples
### Example 1: Discovering Purchase Order Approval Process for Automation
**Scenario:** Your IT team wants to automate the purchase order approval process using a BPM workflow engine. You need a formal, executable BPMN process model that accurately represents the actual approval workflow, not just the documented procedure. The model must be sound (no deadlocks) and ready for deployment in Camunda BPM.
**Settings:**
- Discovery Algorithm: Inductive Miner
- Ebsilon: 0.1 (not used by Inductive Miner)
- Eta: 0.4 (not used by Inductive Miner)
- Diagram Orientation: Horizontal
- Border Label: Purchase Order Approval - Production Model
**Output:**
The calculator generates a BPMN 2.0 XML file containing a block-structured process model. When opened in Camunda Modeler, the diagram shows:
- Start event: Process begins when PO is created
- Task: Create Purchase Order
- XOR Gateway (split): Route based on amount threshold
- Path 1 (amount < $5000): Manager Review -> Approve -> End
- Path 2 (amount >= $5000): Manager Review -> Finance Review -> Senior Manager Review -> Approve -> End
- End event: Process completes when PO is approved
The model includes proper BPMN elements like start/end events, tasks, exclusive gateways for decision points, and sequence flows connecting all elements. The XML file can be directly imported into Camunda BPM.
**Insights:** The Inductive Miner produces a guaranteed-sound process model suitable for workflow automation. The discovered model reveals that your approval process has a clear threshold-based decision point (the XOR gateway splitting on purchase amount), with high-value POs requiring additional review steps. This executable model can be imported into Camunda BPM, enhanced with business rules and human task assignments, and deployed for process automation. The soundness guarantee ensures the automated workflow will not encounter deadlocks or execution errors.
### Example 2: Analyzing Manufacturing Process Concurrency
**Scenario:** Your manufacturing process has several steps that you believe can be executed in parallel, but the documented process shows them as sequential. You want to discover the actual concurrency patterns from production data to optimize the process and reduce cycle time.
**Settings:**
- Discovery Algorithm: Split Miner
- Ebsilon: 0.25 (elevated to detect parallelism)
- Eta: 0.4 (standard filtering)
- Diagram Orientation: Horizontal
- Border Label: Manufacturing Process - Concurrency Analysis
**Output:**
The calculator generates a BPMN diagram showing the discovered process structure. When opened in a BPMN viewer, the model displays:
- Sequential start: Receive Order -> Check Inventory -> Allocate Materials
- AND Gateway (split): After materials are allocated, three activities occur in parallel
- Fork 1: Prepare Assembly Line
- Fork 2: Quality Pre-Check Equipment
- Fork 3: Generate Work Orders
- AND Gateway (join): All three parallel activities must complete
- Sequential continuation: Assemble Product -> Quality Inspection -> Package -> Ship
- Self-loop: Quality Inspection can loop back to Assemble Product for rework cases
The AND gateways clearly show which activities the algorithm detected as concurrent based on the event data.
**Insights:** The Split Miner algorithm with elevated Ebsilon (0.25) successfully detected parallelism in your manufacturing process. The AND gateways reveal that preparation of the assembly line, quality equipment checks, and work order generation actually happen concurrently in practice, even though the documented process shows them sequentially. This discovery indicates an opportunity to formalize this parallelism in your process design, potentially reducing cycle time by ensuring these activities always execute in parallel rather than waiting for sequential completion. The self-loop on Quality Inspection accurately models the rework pattern where failed inspections send products back to assembly.
### Example 3: Creating Simplified Process Documentation for Executives
**Scenario:** You need to create clean, high-level process documentation for executive presentation and regulatory compliance. The detailed event log contains many exceptional cases and variations that would make the diagram too complex. You want a simplified model showing only the main process flows that represent the majority of cases.
**Settings:**
- Discovery Algorithm: Split Miner
- Ebsilon: 0.1 (standard concurrency detection)
- Eta: 0.7 (aggressive filtering for simplification)
- Diagram Orientation: Horizontal
- Border Label: Invoice Processing - Executive Overview (Top 70% of Paths)
**Output:**
The calculator generates a simplified BPMN diagram focusing on the most frequent process paths. The model shows:
- Start: Receive Invoice
- Task: Match Invoice to Purchase Order
- XOR Gateway (split): Match result decision
- Path 1 (successful match - 85% of cases): Approve Payment -> Schedule Payment -> End
- Path 2 (match failed - 15% of cases): Request Vendor Correction -> Match Invoice to PO -> Approve Payment -> End
- End: Invoice Processed
The high Eta value (0.7) filtered out less common exceptional paths, leaving only the two main process variants that represent 70% or more of all cases.
**Insights:** By using aggressive edge filtering (Eta = 0.7), the algorithm removed infrequent exceptional paths and produced a clean, understandable process model suitable for executive presentation. The simplified diagram shows that most invoices (85%) follow a straight-through processing path, while 15% require vendor correction before payment. This high-level view is perfect for regulatory documentation and stakeholder communication without the visual complexity of dozens of edge cases. The BPMN XML can be imported into PowerPoint presentations or process documentation tools used by compliance teams.
### Example 4: Comparing Regional Process Variations
**Scenario:** Your organization has three regional offices (North America, Europe, Asia) that should all follow the same customer onboarding process. You suspect significant variation in how each region executes the process. You want to generate BPMN models for each region to identify structural differences and determine which region follows the most efficient process structure.
**Settings:**
- Discovery Algorithm: Split Miner
- Ebsilon: 0.1 (consistent across all regions)
- Eta: 0.4 (consistent across all regions)
- Diagram Orientation: Horizontal
- Border Label: Customer Onboarding - [Region Name]
Apply filters to segment your event log by region, then run the BPMN calculator three times (once per region) with identical settings.
**Output:**
North America BPMN model shows:
- Linear sequential process: Application -> Credit Check -> Document Review -> Approval -> Account Setup
- Simple structure with one main path
- Model file: bpmn_north_america.xml
Europe BPMN model shows:
- More complex structure with XOR gateways
- After Credit Check: XOR split based on credit score
- High score: Direct to Approval
- Low score: Additional Manager Review -> Approval
- Multiple decision points creating branching
- Model file: bpmn_europe.xml
Asia BPMN model shows:
- Highly complex with AND gateways showing parallelism
- After Application: AND split for concurrent activities
- Document Review (parallel)
- Credit Check (parallel)
- Reference Check (parallel)
- AND join before final Approval
- Model file: bpmn_asia.xml
**Insights:** The three BPMN models reveal significant regional process variation despite supposedly following the same procedure. North America follows a simple sequential process, while Europe has added decision logic based on credit scores, and Asia executes multiple activities in parallel. By comparing the models side-by-side in a BPMN tool, you can identify that Asia's parallel approach likely explains their faster average onboarding time (documented in other analyses). The North America model could be enhanced by adopting Asia's parallelism to reduce cycle time, while Europe's credit score decision logic could be valuable for all regions to adopt. These exported BPMN files provide concrete, visual evidence to support process standardization discussions.
### Example 5: Validating Process Redesign Implementation
**Scenario:** Six months ago, you redesigned the expense reimbursement process to eliminate unnecessary approval steps and enable parallel processing. You want to validate that the new process has been implemented as designed by comparing a BPMN model from current data against the intended BPMN design.
**Settings:**
- Discovery Algorithm: Inductive Miner (for sound, comparable model)
- Ebsilon: 0.1
- Eta: 0.4
- Diagram Orientation: Horizontal
- Border Label: Expense Reimbursement - Current State
Filter your event log to include only cases from the last three months (post-redesign period).
**Output:**
The calculator generates a BPMN model from recent event data showing:
- Start: Submit Expense Report
- AND Gateway (split): Parallel processing
- Path 1: Policy Compliance Check
- Path 2: Receipt Validation
- AND Gateway (join): Both checks must complete
- XOR Gateway (split): Based on amount
- Amount < $500: Auto-Approve -> Payment -> End
- Amount >= $500: Manager Review -> Approve -> Payment -> End
- End: Reimbursement Complete
You can now compare this discovered model against your intended redesign specifications.
**Insights:** The discovered BPMN model confirms that the process redesign has been successfully implemented. The AND gateways show that policy compliance checks and receipt validation now occur in parallel as designed, rather than sequentially as in the old process. The XOR gateway confirms the new automated approval threshold for expenses under $500 is working correctly. By comparing this discovered model with the theoretical redesign BPMN created six months ago, you can validate conformance to the new process design. Any structural differences between the intended and discovered models would indicate implementation gaps or process drift that requires correction.
## Output
The BPMN calculator generates a complete BPMN 2.0 XML file named "bpmn.xml" that you can download from the calculator results.
**BPMN XML File:**
- Standard BPMN 2.0 compliant XML format
- Contains both process logic (tasks, gateways, events, sequence flows) and visual layout (coordinates, shapes, edges)
- Includes proper namespace declarations for compatibility with BPMN tools
- Can be imported into Camunda Modeler, Signavio, bpmn.io, and other BPMN editors
- File encoding: UTF-8
**Directly-Follows Graph Table:**
- Shows the underlying process structure as a table with From, To, and Count columns
- Displays the frequency of each transition between activities
- Provides raw data that the algorithm used to discover the BPMN model
**Diagnostic Information:**
- Performance metrics showing execution time for each algorithm step (DFG creation, loop detection, gateway discovery, etc.)
- Warning messages if the algorithm encountered unusual process structures or convergence issues
- Informational messages about algorithm behavior and decisions
**Visual Elements in BPMN Tools:**
When you open the generated XML in a BPMN tool, you will see:
- **Tasks:** Rectangular boxes representing activities from your event log
- **Gateways:** Diamond shapes representing decision points (XOR), parallel execution (AND), or inclusive choices (OR)
- **Events:** Circles representing process start and end points
- **Sequence Flows:** Arrows connecting elements showing process flow
- **Layout:** Automatically positioned elements in horizontal or vertical orientation based on your setting
The exported BPMN file can be further edited in BPMN tools to add business rules, assign human tasks, configure service tasks, and deploy to workflow engines for process automation.
---
*This documentation is part of the mindzie Studio process mining platform.*
---
## Breakdown By Categories
Section: Calculators
URL: https://docs.mindziestudio.com/mindzie_studio/calculators/breakdown-by-categories
Source: /docs-master/mindzieStudio/calculators/breakdown-by-categories/page.md
# Breakdown by Categories
## Overview
The Breakdown by Categories calculator analyzes data by grouping it into selected categorical attributes. This powerful calculator allows you to perform cross-tabulation analysis, showing how different categories relate to various metrics in your process.
## Common Uses
- Identify top customers by total invoice value
- See the number of activities performed by different resources
- Identify the number of late deliveries by vendor
- Analyze case volumes by product category
- Compare performance metrics across different organizational units
## Settings
**First Category Attribute:** Select the primary categorical attribute for your breakdown (e.g., 'Resource', 'Customer', 'Vendor').
**Second Category Attribute (optional):** Select an additional categorical attribute for cross-tabulation analysis. For example, select 'Resource' as the first category and 'Activity Name' as the second to see which activities each resource performs.
**Aggregate Function:** Choose how to aggregate the data:
- **Case Count:** Count the number of cases per category
- **Event Count:** Count the number of activities per category
- **Sum:** Calculate the total of a selected attribute
- **Average:** Calculate the mean of a selected attribute
- **Minimum:** Find the minimum value
- **Maximum:** Find the maximum value
**Value Attribute:** For aggregate functions like Sum or Average, select the numerical attribute you want to analyze (e.g., 'Case Duration', 'Invoice Amount').
**Max Categories:** Specify the maximum number of categories to display in the output (e.g., set to 10 to see only the top 10 categories).
**Category Ordering:** Choose whether to sort results in:
- **Descending order:** Show highest values first (default)
- **Ascending order:** Show lowest values first
## Examples
### Example 1: Top 10 Customers by Total Invoice Value
**Scenario:** You want to identify your most valuable customers based on total invoice amounts.
**Settings:**
- First Category Attribute: Customer
- Aggregate Function: Sum
- Value Attribute: Total Invoice Value
- Max Categories: 10
- Category Ordering: Descending
**Output:**
The calculator provides multiple visualization options:
1. **Grid (default):** Tabular view showing each customer and their total invoice value. Click on a customer name to drill down into their specific data.
2. **Horizontal Bar Chart:** Visual comparison of customer values, making it easy to see relative differences.
3. **Pie Chart:** Proportion view showing each customer's share of total invoice value.
**Insights:** This helps you identify key accounts that require special attention and relationship management.
### Example 2: Activity Executions by Resource
**Scenario:** You want to see which activities are performed by your top 10 most active resources.
**Settings:**
- First Category Attribute: Resource
- Second Category Attribute: Activity Name
- Aggregate Function: Event Count
- Max Categories: 10
- Category Ordering: Descending
**Output:**
The calculator provides multiple visualization options:
1. **Tree Map (default):** Hierarchical visualization showing resources as large blocks, with activities as nested blocks within each resource. Click on a resource to see the breakdown of activities they perform.
2. **Vertical Grid:** Matrix view showing resources and their activity distribution.
3. **Grid:** Tabular view with drill-down capabilities.
**Insights:** This reveals workload distribution, specialization patterns, and potential bottlenecks in resource allocation.
## Output
The calculator supports multiple output formats that can be selected from the dropdown in the top right corner:
- Grid view (tabular data with drill-down)
- Bar charts (horizontal or vertical)
- Pie chart
- Tree map (for two-category breakdowns)
All outputs support interactive filtering and drill-down capabilities to explore your data in detail.
---
*This documentation is part of the mindzie Studio process mining platform.*
---
## Case Count
Section: Calculators
URL: https://docs.mindziestudio.com/mindzie_studio/calculators/case-count
Source: /docs-master/mindzieStudio/calculators/case-count/page.md
# Case Count
## Overview
The Case Count calculator counts the total number of cases in your event log. This is one of the most fundamental metrics in process mining, showing the volume of process instances in your dataset.
## Common Uses
- See the total number of cases in your process
- Add case volume metrics to dashboards
- Monitor process volume over time
- Validate data extraction completeness
- Track workload volume
## Settings
There are no specific settings for this calculator beyond the standard title and description fields.
## Output
The calculator displays a single numerical value representing the total count of unique cases in the event log.
## Example
### Tracking Total Order Volume
**Scenario:** You want to display the total number of orders processed in your order-to-cash process.
**Settings:**
- Title: "Total Orders"
- Description: "Total number of orders in the system"
**Output:**
The calculator shows a single number, such as "1,247", representing the total case count.
**Usage:** Click "Add to Dashboard" to display this metric on your main dashboard for quick reference.
**Insights:** This fundamental metric helps you understand process volume and can be combined with filters to show specific case counts (e.g., only completed cases, only cases from a specific customer).
---
*This documentation is part of the mindzie Studio process mining platform.*
---
## Case Duration
Section: Calculators
URL: https://docs.mindziestudio.com/mindzie_studio/calculators/case-duration
Source: /docs-master/mindzieStudio/calculators/case-duration/page.md
# Case Duration
## Overview
The calculator shows the basic statistics about the case duration.
## Common Uses
To analyze the basic duration statistics of your cases.
## Settings
The Case Duration calculator automatically calculates:
- Average (mean) duration
- Median duration
- Minimum and maximum duration
- Standard deviation
## Example
When you add the Case Duration calculator to your analysis, it will display statistics showing how long cases take from start to finish. This helps identify if processes are running within expected timeframes.
---
*This documentation is part of the mindzie Studio process mining platform.*
---
## Case Explorer
Section: Calculators
URL: https://docs.mindziestudio.com/mindzie_studio/calculators/case-explorer
Source: /docs-master/mindzieStudio/calculators/case-explorer/page.md
# Case Explorer
## Overview
The Case Explorer calculator displays case and event attributes in a customizable table format, allowing you to explore process data in detail. This calculator is your primary tool for viewing raw process data, inspecting specific cases, and understanding the exact attribute values that drive your process analytics.
Unlike analytical calculators that aggregate and summarize data, the Case Explorer shows the actual rows of data - either at the case level (one row per case) or at the event level (one row per activity), depending on which columns you select. You control which attributes appear, how the data is sorted, and how many rows to display.
## Common Uses
- Inspect individual cases to understand specific process instances and their attribute values
- View event-level details to see the complete activity sequence and timestamps for cases
- Investigate outliers or exceptions identified by other calculators by examining their raw data
- Validate data quality by reviewing actual attribute values and identifying missing or incorrect data
- Create focused data views for export to Excel or sharing with stakeholders
- Build custom reports by selecting specific columns and sorting by key metrics
- Debug process issues by examining the exact sequence of events and their attributes
## Settings
**Columns to Display:** Select which case attributes and event attributes you want to include in the output table. You can choose any combination of columns from your event log.
- If you select only case-level attributes (like Case ID, Customer Name, Total Cost), the output shows one row per case
- If you include any event-level attributes (like Activity Name, Resource, Timestamp), the output automatically shows one row per event
- Columns appear in the output table in the order you select them
- Column names must exactly match the attribute names in your event log
**Sort Column:** Choose which column to use for sorting the results. The sort column must be one of the columns you selected to display. If you don't specify a sort column, the data appears in its natural order from the event log.
**Sort Direction:** When a sort column is specified, choose the sort order:
- **Ascending:** Sorts from lowest to highest (A-Z, 0-9, oldest to newest dates)
- **Descending:** Sorts from highest to lowest (Z-A, 9-0, newest to oldest dates)
- **Unsorted:** Maintains the original event log order (default if no sort column specified)
**Maximum Rows:** Specify how many rows to display in the output table. The default is 100 rows to ensure fast performance. Set to a higher value if you need to see more data, or lower if you only want to view the top few results.
- Values typically range from 10 to 1000 rows
- The row limit applies after sorting, so you can use this to show "top N" results
- For example: Sort by duration descending + limit to 20 rows = "20 slowest cases"
- Lower values improve performance when working with large datasets
**Custom Export Settings:** (Optional) Configure a custom Excel template for formatted exports. This advanced feature allows you to create branded reports with predefined formatting and layout.
## Examples
### Example 1: Inspecting High-Value Purchase Orders
**Scenario:** Your analysis identified purchase orders with unusually high costs. You want to examine the top 25 highest-value orders to understand what makes them different and validate the data.
**Settings:**
- Columns to Display: Case ID, Supplier Name, Total Cost, Purchase Category, Approval Date, Status
- Sort Column: Total Cost
- Sort Direction: Descending
- Maximum Rows: 25
**Output:**
The calculator displays a table with 6 columns and up to 25 rows, showing the purchase orders with the highest costs at the top:
| Case ID | Supplier Name | Total Cost | Purchase Category | Approval Date | Status |
|---------|--------------|------------|------------------|---------------|--------|
| PO-2024-8821 | Acme Manufacturing | $485,200 | Equipment | 2024-09-15 | Completed |
| PO-2024-9334 | TechSystems Global | $412,800 | IT Infrastructure | 2024-10-02 | Completed |
| PO-2024-7892 | Industrial Parts Inc | $387,500 | Manufacturing Supplies | 2024-08-28 | Completed |
| ... | ... | ... | ... | ... | ... |
**Insights:** By examining the top 25 cases, you immediately see that high-value orders span multiple categories (Equipment, IT, Manufacturing Supplies) and involve different suppliers. This case-level view helps you understand whether high costs are concentrated with specific suppliers or categories. You can also verify that the data is accurate by checking if the approval dates and statuses make sense for these large purchases.
### Example 2: Reviewing Event Sequence for Delayed Cases
**Scenario:** Several cases are taking much longer than expected. You want to see the complete sequence of events for the 10 slowest cases to understand where time is being lost and which resources are involved.
**Settings:**
- Columns to Display: Case ID, Activity Name, Resource, Timestamp, Duration Since Previous Event
- Sort Column: Timestamp
- Sort Direction: Ascending
- Maximum Rows: 200
**Output:**
Because you included event-level attributes (Activity Name, Resource, Timestamp), the output shows individual events rather than cases. For 10 cases with an average of 15-20 events each, you'll see approximately 150-200 event rows:
| Case ID | Activity Name | Resource | Timestamp | Duration Since Previous Event |
|---------|--------------|----------|-----------|------------------------------|
| CS-1234 | Create Purchase Request | John Smith | 2024-10-01 08:15 | 0 hours |
| CS-1234 | Manager Review | Sarah Johnson | 2024-10-01 14:30 | 6.25 hours |
| CS-1234 | Procurement Review | (empty) | 2024-10-08 09:15 | 162.75 hours |
| CS-1234 | Supplier Selection | Mike Chen | 2024-10-08 11:30 | 2.25 hours |
| CS-5678 | Create Purchase Request | Alice Wong | 2024-10-02 09:00 | 0 hours |
| ... | ... | ... | ... | ... |
**Insights:** The event-level view reveals the complete story of each delayed case. In case CS-1234, you can see that the Procurement Review step took 162.75 hours (nearly 7 days) and had no assigned resource, suggesting this is where the delay occurred. By examining multiple cases, you can identify whether delays consistently happen at the same process step or involve the same resources, pointing you toward systemic bottlenecks.
### Example 3: Data Quality Validation for Customer Attributes
**Scenario:** Before running your main analysis, you want to validate that customer data is complete and correct. You'll review a sample of cases to check for missing values, formatting issues, or inconsistent data.
**Settings:**
- Columns to Display: Case ID, Customer ID, Customer Name, Customer Region, Customer Segment, Order Date
- Sort Column: Customer Name
- Sort Direction: Ascending
- Maximum Rows: 100
**Output:**
A table showing case-level data sorted alphabetically by customer name:
| Case ID | Customer ID | Customer Name | Customer Region | Customer Segment | Order Date |
|---------|------------|--------------|----------------|------------------|-----------|
| ORD-5634 | CUST-0042 | (empty) | North | Enterprise | 2024-09-15 |
| ORD-8821 | (empty) | Acme Industries | West | SMB | 2024-10-02 |
| ORD-3421 | CUST-0156 | Global Manufacturing Co | East | Enterprise | 2024-08-28 |
| ... | ... | ... | ... | ... | ... |
**Insights:** Sorting by Customer Name immediately reveals data quality issues. Some cases have missing customer names (shown as empty), while others have missing Customer IDs. This type of inspection helps you understand the extent of data completeness problems before running analytical calculators that might produce misleading results due to missing data. You might decide to filter out incomplete cases or investigate the source systems to fix the data extraction.
### Example 4: Identifying Rework Patterns in Manufacturing
**Scenario:** You want to identify cases where the "Quality Check" activity was repeated multiple times, suggesting quality issues or rework. You'll display events for cases sorted by Case ID to see all events for each case grouped together.
**Settings:**
- Columns to Display: Case ID, Activity Name, Timestamp, Quality Inspector, Defect Code, Status
- Sort Column: Case ID
- Sort Direction: Ascending
- Maximum Rows: 500
**Output:**
Event-level table with events grouped by case:
| Case ID | Activity Name | Timestamp | Quality Inspector | Defect Code | Status |
|---------|--------------|-----------|------------------|-------------|--------|
| MFG-1001 | Production Start | 2024-10-01 08:00 | n/a | n/a | Started |
| MFG-1001 | Quality Check | 2024-10-01 14:30 | Jane Lee | QDEF-45 | Failed |
| MFG-1001 | Rework | 2024-10-01 15:00 | Bob Smith | n/a | In Progress |
| MFG-1001 | Quality Check | 2024-10-02 09:15 | Jane Lee | (empty) | Passed |
| MFG-1001 | Packaging | 2024-10-02 10:30 | n/a | n/a | Completed |
| MFG-1002 | Production Start | 2024-10-01 08:15 | n/a | n/a | Started |
| MFG-1002 | Quality Check | 2024-10-01 14:45 | John Davis | (empty) | Passed |
| ... | ... | ... | ... | ... | ... |
**Insights:** By sorting by Case ID, all events for each case appear together in chronological order. You can clearly see that case MFG-1001 had a failed quality check (with defect code QDEF-45), went through rework, and then passed on the second quality check. In contrast, case MFG-1002 passed quality check on the first attempt. This pattern analysis helps identify which defect codes are most common and which inspectors are finding the most issues.
### Example 5: Creating Executive Summary of Recent Approvals
**Scenario:** The CFO wants to see the 50 most recent invoice approvals with key information about amounts, departments, and approvers for a weekly executive summary.
**Settings:**
- Columns to Display: Invoice Number, Invoice Date, Department, Invoice Amount, Approver Name, Approval Date
- Sort Column: Approval Date
- Sort Direction: Descending
- Maximum Rows: 50
**Output:**
Case-level table showing the most recent approvals first:
| Invoice Number | Invoice Date | Department | Invoice Amount | Approver Name | Approval Date |
|---------------|-------------|-----------|---------------|---------------|---------------|
| INV-2024-9845 | 2024-10-18 | Marketing | $12,450 | Sarah Johnson | 2024-10-19 |
| INV-2024-9832 | 2024-10-17 | Operations | $8,920 | Mike Chen | 2024-10-18 |
| INV-2024-9801 | 2024-10-16 | IT | $45,200 | Sarah Johnson | 2024-10-18 |
| ... | ... | ... | ... | ... | ... |
**Insights:** This focused view provides exactly what the CFO needs: a chronological list of recent approvals showing who approved what and for which departments. The descending sort by Approval Date ensures the most recent activity appears first. The 50-row limit keeps the report manageable while covering roughly one week of approval activity. This data can be exported to Excel for inclusion in executive reports.
### Example 6: Comparing Resource Performance Across Cases
**Scenario:** You want to analyze how different customer service representatives handle cases by examining their assigned cases and key metrics.
**Settings:**
- Columns to Display: Case ID, Assigned Agent, Case Type, Priority, Resolution Time, Customer Satisfaction Score
- Sort Column: Assigned Agent
- Sort Direction: Ascending
- Maximum Rows: 300
**Output:**
Case-level table grouped by agent:
| Case ID | Assigned Agent | Case Type | Priority | Resolution Time | Customer Satisfaction Score |
|---------|---------------|-----------|----------|----------------|---------------------------|
| CS-2234 | Alice Johnson | Technical Support | High | 2.5 hours | 4.8 |
| CS-2456 | Alice Johnson | Billing Inquiry | Medium | 1.2 hours | 5.0 |
| CS-2789 | Alice Johnson | Technical Support | High | 4.1 hours | 4.2 |
| CS-1923 | Bob Martinez | Account Setup | Low | 0.8 hours | 4.9 |
| CS-2034 | Bob Martinez | Technical Support | High | 8.5 hours | 3.5 |
| ... | ... | ... | ... | ... | ... |
**Insights:** Sorting by Assigned Agent groups all cases for each agent together, making it easy to see patterns in their work. For Alice Johnson, you can see she handles both technical and billing cases with consistently high satisfaction scores and reasonable resolution times. Bob Martinez shows more variation, with one technical support case taking much longer (8.5 hours) and resulting in a lower satisfaction score (3.5). This case-by-case view helps managers identify coaching opportunities or understand workload distribution.
## Output
The Case Explorer calculator displays an interactive data table containing the exact columns you selected, sorted according to your specifications, and limited to the number of rows you defined.
### Table Structure
**Column Headers:** Display the friendly names of the attributes you selected, making the table easy to read and understand.
**Data Types:** Each column preserves its original data type from the event log (dates, numbers, text, etc.) and formats values appropriately.
**Row Count:** The table shows up to the Maximum Rows value you specified. If your event log contains fewer matching rows, all available rows are displayed.
**Sort Order:** Rows appear in the order specified by your Sort Column and Sort Direction settings. If no sorting is specified, rows appear in their natural event log order.
### Display Behavior
**Case-Level vs. Event-Level:**
- When you select only case attributes, the table shows one row per case
- When you include any event attributes, the table automatically switches to event-level display, showing one row per event/activity
- The calculator automatically detects which mode to use based on your column selections
**Empty Values:** Missing or null attribute values appear as empty cells in the table, helping you identify data quality issues.
**Large Numbers:** Numeric values format with appropriate thousands separators and decimal places for readability.
**Dates and Times:** Timestamp columns display in a human-readable format showing both date and time.
### Interactive Features
**Click-Through:** Click on individual rows to drill down into case details and explore the underlying events and attributes in more depth.
**Export to Excel:** Export the displayed table to Excel for offline analysis, reporting, or sharing with stakeholders who don't have access to mindzieStudio.
**Custom Export Templates:** If Custom Export Settings are configured, you can generate formatted Excel reports using predefined templates that include branding, formatting, and layout.
**Copy Data:** Select and copy data from the table for pasting into other applications or documents.
### Performance Notes
**Row Limits Improve Speed:** Using smaller Maximum Rows values (10-100) provides faster results, especially with large event logs containing millions of events.
**Event Queries Are Slower:** Displaying event-level data (by including event attributes) requires more processing time than case-level data, particularly for event logs with many events per case.
**Sorting Performance:** Sorting is performed before the row limit is applied, so sorting large datasets may take a few moments. Consider filtering your data with other calculators first if you're working with very large event logs.
### Common Output Patterns
**Top N Analysis:** Sort by a metric column (descending for highest, ascending for lowest) + set Maximum Rows to N = "Top N" or "Bottom N" results
**Data Validation:** Sort alphabetically by key attributes + review for missing values, duplicates, or formatting inconsistencies
**Case Investigation:** Select specific Case IDs (using filters first) + include event columns + sort by Timestamp = Complete case timeline
**Executive Reporting:** Select key business metrics + sort by date descending + limit to recent rows = Weekly/monthly summary for stakeholders
**Resource Analysis:** Include resource attributes + sort by resource name + include performance metrics = Resource workload and performance review
### Usage Tips
**Start Simple:** Begin by selecting just a few essential columns to understand the data structure, then add more columns as needed.
**Combine with Filters:** Use filter calculators upstream to narrow down to specific cases of interest before displaying them in the Case Explorer.
**Verify Column Names:** Column names must exactly match the attribute names in your event log (case-sensitive). Use the column picker in the calculator settings to avoid typos.
**Test Row Limits:** Start with a small Maximum Rows value (like 10 or 20) to see the table structure quickly, then increase if you need more data.
**Event-Level Trade-offs:** Remember that including even one event attribute switches the entire table to event-level display, which shows many more rows and may take longer to process.
**Export for Sharing:** When creating reports for stakeholders, use the Case Explorer to create focused, sorted views, then export to Excel for professional formatting and distribution.
The Case Explorer is your window into the raw process data, providing the transparency and detail needed to validate analytics, investigate specific cases, and understand the exact attribute values that drive your process mining insights.
---
*This documentation is part of the mindzie Studio process mining platform.*
---
## Case Outcome By Category
Section: Calculators
URL: https://docs.mindziestudio.com/mindzie_studio/calculators/case-outcome-by-category
Source: /docs-master/mindzieStudio/calculators/case-outcome-by-category/page.md
# Case Outcome by Category
## Overview
The Case Outcome by Category calculator analyzes success rates across different categories in your process data. This powerful calculator lets you define what constitutes a successful outcome (using attribute filters), then breaks down that success rate by any categorical attribute. It answers questions like "What is the on-time delivery rate by region?" or "What is the approval rate by department?"
## Common Uses
- Compare success rates across regions, departments, or vendors
- Analyze compliance rates by business unit
- Measure on-time performance by product category
- Compare quality metrics across suppliers
- Identify high and low performing segments
- Benchmark process outcomes across organizational units
## Settings
**Attribute Name:** Select the categorical attribute to group by. The calculator will show outcome percentages for each unique value of this attribute. Only columns with suitable data types are available (String, Boolean, Integer).
**Attribute Filter:** Define what constitutes a "successful" outcome using filter criteria:
- **Column Name:** The attribute to evaluate for success
- **Compare Method:** How to compare (Equal, Contains, Greater Than, etc.)
- **Compare Value:** The value that indicates success
- **For array comparisons:** Use "Is One Of" with multiple values
## Example
### On-Time Delivery Rate by Region
**Scenario:** You want to compare on-time delivery performance across different sales regions.
**Setup:**
1. Attribute Name: "Region"
2. Attribute Filter: "Delivery Status" equals "On Time"
**Output:**
| Region | Percentage | On-Time Cases | Total Cases |
|--------|------------|---------------|-------------|
| Western | 92% | 460 | 500 |
| Eastern | 87% | 435 | 500 |
| Northern | 78% | 312 | 400 |
| Southern | 85% | 340 | 400 |
**Interpretation:**
- Western region has the highest on-time rate at 92%
- Northern region has the lowest at 78%
- This 14-percentage-point gap represents significant performance variation
**Insights:** The regional variation suggests different processes, resources, or challenges in each area. Northern region may need investigation - is it a capacity issue, supplier issue, or geographic challenge?
### Approval Rate by Department
**Scenario:** You want to analyze which departments have the highest purchase order approval rates.
**Setup:**
1. Attribute Name: "Department"
2. Attribute Filter: "Status" equals "Approved"
**Output:**
| Department | Percentage | Approved | Total |
|------------|------------|----------|-------|
| Marketing | 95% | 285 | 300 |
| IT | 88% | 352 | 400 |
| Operations | 82% | 410 | 500 |
| R&D | 76% | 228 | 300 |
**Insights:** R&D has the lowest approval rate, possibly due to more experimental purchases, budget constraints, or stricter review requirements. This could be expected based on business context or may indicate process issues worth investigating.
### Compliance Rate by Vendor
**Scenario:** You want to identify which vendors have the highest rates of compliance issues.
**Setup:**
1. Attribute Name: "Vendor"
2. Attribute Filter: "Compliance Issue" equals "Yes"
**Output:**
| Vendor | Percentage | With Issues | Total |
|--------|------------|-------------|-------|
| Vendor A | 15% | 45 | 300 |
| Vendor B | 8% | 32 | 400 |
| Vendor C | 3% | 9 | 300 |
| Vendor D | 22% | 110 | 500 |
**Insights:** Vendor D has a 22% compliance issue rate - significantly higher than others. This vendor may require additional oversight, contract renegotiation, or replacement consideration.
## Advanced Filter Configurations
### Multiple Success Values
Use "Is One Of" to define success with multiple acceptable values:
**Setup:**
- Attribute Name: "Product Category"
- Attribute Filter: "Quality Rating" is one of ["A", "A+", "Excellent"]
This captures cases with any of the acceptable quality ratings.
### Numeric Thresholds
Use comparison operators for numeric outcomes:
**Setup:**
- Attribute Name: "Customer Segment"
- Attribute Filter: "Order Value" greater than 1000
This shows high-value order rates by customer segment.
### Boolean Attributes
For boolean outcome attributes:
**Setup:**
- Attribute Name: "Sales Rep"
- Attribute Filter: "Deal Closed" equals "True"
This shows close rates by sales representative.
## Interactive Features
### Drill-Down to Cases
Click on any row to see the underlying cases:
- Click on the "Total" column to see all cases in that category
- Click on the "Category" value to see cases matching the outcome filter
### Sorting
Results can be sorted by:
- Percentage (highest/lowest success rates first)
- Total count (largest/smallest categories first)
- Category name (alphabetically)
By default, results are sorted by Percentage descending to highlight best performers first.
## Use Cases by Industry
### Financial Services
- Loan approval rates by branch
- Claim acceptance rates by policy type
- Investment return rates by portfolio category
### Manufacturing
- Quality pass rates by production line
- On-time completion rates by product type
- Defect rates by supplier
### Healthcare
- Treatment success rates by facility
- Readmission rates by department
- Patient satisfaction by service line
### Retail
- Return rates by product category
- Fulfillment success by warehouse
- Customer retention by segment
## Best Practices
### Choosing the Right Category
- Select attributes with manageable cardinality (5-50 unique values)
- Very high cardinality (100+ values) makes comparison difficult
- Consider grouping detailed values into broader categories first
### Defining Clear Outcomes
- Use binary or clearly categorical success definitions
- Ensure outcome data quality is consistent across categories
- Document what "success" means for your analysis
### Interpreting Variations
- Consider baseline rates: is 85% good or bad in context?
- Account for sample sizes: categories with few cases may show extreme percentages
- Look for actionable differences: can you actually influence the factors?
## Output
The calculator produces a data table with:
- **Category:** Each unique value of the grouping attribute
- **Percentage:** Success rate (outcome cases / total cases) displayed as percentage
- **Count:** Number of cases meeting the outcome criteria
- **Total:** Total number of cases in the category
Results are:
- Sorted by percentage descending (default)
- Formatted with percentage display
- Interactive with drill-down capability
- Exportable for reporting
Use this calculator to compare process outcomes across organizational dimensions, identify high and low performers, and prioritize improvement efforts where they'll have the greatest impact.
---
*This documentation is part of the mindzie Studio process mining platform.*
---
## Case Stage Performance
Section: Calculators
URL: https://docs.mindziestudio.com/mindzie_studio/calculators/case-stage-performance
Source: /docs-master/mindzieStudio/calculators/case-stage-performance/page.md
# Case Stage Performance
## Overview
The Case Stage Performance calculator monitors the performance of specific process stages and identifies cases that remain in a stage longer than expected. A process stage is defined as the time between two selected events, allowing you to track how long cases spend in critical phases of your workflow. This calculator helps you detect bottlenecks, identify at-risk cases, and monitor stage-specific SLAs.
## Common Uses
- Monitor the time cases spend in approval stages and identify those exceeding approval SLAs
- Track cases stuck in "pending documentation" or "waiting for customer response" stages
- Analyze the duration of critical production or manufacturing stages
- Identify cases that have been in a review stage beyond acceptable timeframes
- Alert on cases requiring escalation due to extended stage duration
- Measure stage-specific performance across different case categories
## Settings
**Stage Start Event Attribute:** Select the attribute that defines the beginning of the stage (typically 'Activity Name').
**Stage Start Value:** Select the specific event value that marks when cases enter the stage (e.g., "Submit for Approval").
**Stage End Event Attribute:** Select the attribute that defines the end of the stage (typically 'Activity Name').
**Stage End Value:** Select the specific event value that marks when cases exit the stage (e.g., "Approval Completed").
**Threshold Duration:** Specify the maximum acceptable duration for cases to remain in this stage. Cases exceeding this threshold will be highlighted for attention.
**Threshold Unit:** Select the time unit for the threshold:
- Hours
- Days
- Weeks
**Group By (optional):** Select a categorical attribute to analyze stage performance across different categories (e.g., by Department, Product Type, or Priority Level).
## Examples
### Example 1: Monitoring Approval Stage Performance
**Scenario:** You want to monitor how long purchase orders spend in the approval stage and identify those that have been waiting for approval for more than 3 days.
**Settings:**
- Stage Start Event Attribute: Activity Name
- Stage Start Value: Submit for Approval
- Stage End Event Attribute: Activity Name
- Stage End Value: Approval Completed
- Threshold Duration: 3
- Threshold Unit: Days
**Output:**
The calculator displays performance metrics for the approval stage:
**Summary Statistics:**
- Total cases in stage: 1,245
- Average stage duration: 1.8 days
- Median stage duration: 1.2 days
- Cases exceeding threshold: 87 cases (7%)
**Cases Exceeding Threshold:**
A detailed list of the 87 purchase orders that have been in approval for more than 3 days, including:
- Case ID
- Current duration in stage
- Days over threshold
- Additional case attributes for context
**Insights:**
This reveals that while most purchase orders are approved within 1-2 days, 7% are experiencing delays beyond the 3-day threshold. The list of specific cases enables immediate action:
- Route delayed cases to management for escalation
- Identify patterns in delayed approvals (large amounts, specific approvers, certain vendors)
- Measure the impact of approval delays on overall case duration
- Set up automated alerts for cases approaching or exceeding the threshold
### Example 2: Production Stage Analysis by Product Category
**Scenario:** You want to analyze how long different product types spend in the manufacturing stage and identify which categories consistently exceed the standard 5-day production window.
**Settings:**
- Stage Start Event Attribute: Activity Name
- Stage Start Value: Production Started
- Stage End Event Attribute: Activity Name
- Stage End Value: Production Completed
- Threshold Duration: 5
- Threshold Unit: Days
- Group By: Product Category
**Output:**
The calculator breaks down production stage performance by product category:
| Product Category | Cases | Avg Duration | Cases Over Threshold | % Over Threshold |
|-----------------|-------|--------------|---------------------|------------------|
| Electronics | 450 | 6.2 days | 210 | 47% |
| Furniture | 320 | 4.1 days | 45 | 14% |
| Textiles | 280 | 3.8 days | 32 | 11% |
| Hardware | 195 | 7.4 days | 145 | 74% |
**Insights:**
The category breakdown reveals significant variation in production stage performance:
- **Hardware products** have the highest failure rate (74% exceed threshold), with an average duration of 7.4 days - indicating possible capacity constraints or process complexity issues
- **Electronics** also struggle, with 47% exceeding the 5-day window
- **Furniture and Textiles** perform better, staying within the threshold for most cases
This analysis enables targeted improvements:
- Investigate why Hardware takes longest and has highest threshold violation rate
- Consider adjusting thresholds by category to reflect realistic production timelines
- Allocate additional resources to problematic categories
- Implement category-specific process improvements
### Example 3: Customer Response Wait Time Monitoring
**Scenario:** You're managing a customer service process and want to identify support tickets that have been waiting for customer response for more than 48 hours, which triggers an automatic close policy.
**Settings:**
- Stage Start Event Attribute: Activity Name
- Stage Start Value: Awaiting Customer Response
- Stage End Event Attribute: Activity Name
- Stage End Value: Customer Response Received
- Threshold Duration: 48
- Threshold Unit: Hours
**Output:**
The calculator identifies tickets at risk of automatic closure:
**Current Status:**
- Total tickets awaiting response: 234
- Average wait time: 18.5 hours
- Tickets over 48 hours: 23 tickets (9.8%)
**Critical Tickets List:**
The 23 tickets that have exceeded 48 hours and are candidates for automatic closure, showing:
- Ticket ID and customer name
- Hours waiting (e.g., 52 hours, 67 hours, 118 hours)
- Original issue category
- Last contact timestamp
**Insights:**
This analysis supports proactive customer relationship management:
- Identify which customers may lose access to their support tickets
- Send final reminder emails before auto-closure
- Recognize patterns in non-responsive customers (specific issue types, customer segments)
- Measure the effectiveness of customer communication
- Adjust auto-close policies based on actual response patterns
The calculator helps balance operational efficiency (closing inactive tickets) with customer satisfaction (ensuring adequate response time before closure).
## Output
The calculator provides comprehensive stage performance analytics:
**Summary Metrics:**
- Total number of cases currently in or having passed through the stage
- Average, median, minimum, and maximum stage durations
- Count and percentage of cases exceeding the threshold
- Stage completion rate
**Threshold Violation Details:**
- Complete list of cases exceeding the threshold
- Sortable by duration, days over threshold, or any case attribute
- Drill-down capability to examine individual case details
- Export functionality for further analysis or alerting workflows
**Visual Representations:**
- Distribution histogram showing stage duration frequency
- Trend charts showing stage performance over time
- Category comparisons (when Group By is used)
**Interactive Filtering:**
- Click on any case to view its complete process path
- Filter the case list by various attributes
- Export violation list for escalation or reporting
This calculator is particularly valuable for operational monitoring, SLA compliance, and proactive case management in time-sensitive processes.
---
*This documentation is part of the mindzie Studio process mining platform.*
---
## Chair Usage
Section: Calculators
URL: https://docs.mindziestudio.com/mindzie_studio/calculators/chair-usage
Source: /docs-master/mindzieStudio/calculators/chair-usage/page.md
# Chair Usage
## Overview
The Chair Usage calculator analyzes treatment room and chair utilization in healthcare facilities by comparing scheduled appointments against actual patient occupancy. It creates time-based visualizations showing how efficiently your facility uses available capacity throughout the day, helping you optimize scheduling, reduce wait times, and identify opportunities to serve more patients without adding resources.
This is an administrator-only calculator designed specifically for hospital and healthcare processes where tracking infusion chairs, dialysis stations, treatment rooms, or examination rooms is critical for operational efficiency.
## Common Uses
- Identify peak utilization periods to optimize staffing and resource allocation in infusion centers, dialysis units, or procedure rooms
- Compare scheduled appointments versus actual patient occupancy to quantify the impact of no-shows and late cancellations
- Detect underutilized time slots where additional appointments could be scheduled without adding capacity
- Analyze zone-specific utilization patterns to balance patient load across multiple treatment areas
- Support capacity planning decisions with data-driven insights on whether to expand facilities or redistribute existing resources
- Monitor utilization trends across different days of the week to identify optimal scheduling patterns
## Settings
**Appointment DateTime Column:** Select the case attribute containing the scheduled appointment date and time. This represents when the patient is scheduled to arrive or when treatment is planned to begin. Must be a DateTime column.
**Scheduled Duration Column:** Select the case attribute containing the planned duration of the appointment or treatment. This can be a numeric column (representing minutes, hours, etc.) or a TimeSpan column with direct duration values.
**Scheduled Duration Unit:** When using a numeric Scheduled Duration Column, specify the time unit (Minutes, Hours, Days, etc.). This tells the calculator how to interpret the numeric values. If your Scheduled Duration Column is already a TimeSpan, this setting is ignored.
**Treatment Start DateTime Column:** Select the case attribute containing the actual treatment start date and time. This represents when the patient actually checked in or when treatment actually began. Must be a DateTime column.
**Treatment End DateTime Column:** Select the case attribute containing the actual treatment end date and time. This represents when the patient checked out or when treatment actually ended. Must be a DateTime column.
**Bin Size:** Specify the time interval for grouping utilization data (default: 15 minutes). Each bin represents a time slice during the day. Smaller bins (5-10 minutes) provide more granular detail but increase processing time. Common values are 15 minutes, 30 minutes, or 1 hour.
**Capacity Groups:** Define the number of available chairs or rooms and their availability periods. Each capacity group specifies a start time, end time, and number of chairs available during that period. Leave empty to auto-calculate capacity based on peak scheduled appointments. Use manual configuration when capacity varies throughout the day (e.g., 8 chairs from 8 AM to noon, 12 chairs from noon to 5 PM).
**Zone Column:** Select the case attribute that identifies the treatment zone or area (e.g., "Adult Zone 1", "Pediatric Unit", "West Wing"). Only needed when analyzing a specific zone.
**Selected Zone:** Specify which zone to analyze. Works together with Zone Column and Selected Day to filter data. Use this when you want to analyze utilization for one specific treatment area.
**Selected Day:** Choose a specific date to analyze. The calculator requires all visits to occur on the same day. Use this setting when performing day-specific zone analysis.
**Filters:** Apply standard mindzie filters to pre-filter cases before calculating utilization (e.g., filter by appointment type, patient category, or provider).
## Examples
### Example 1: Infusion Center Daily Utilization
**Scenario:** A hospital infusion center has 10 treatment chairs and operates from 8 AM to 6 PM. The nursing director wants to understand if the facility is efficiently utilizing available chairs and whether there's capacity to accept more patients. They've noticed that some time periods seem overcrowded while others have empty chairs.
**Settings:**
- Appointment DateTime Column: APPOINTMENT_TIME
- Scheduled Duration Column: SCHEDULED_DURATION_MINUTES
- Scheduled Duration Unit: Minutes
- Treatment Start DateTime Column: CHECKIN_TIME
- Treatment End DateTime Column: CHECKOUT_TIME
- Bin Size: 15 minutes
- Capacity Groups: (empty - auto-calculate)
- Zone Column: (not used)
- Selected Zone: (not used)
- Selected Day: (not used)
**Output:**
The calculator generates a time-binned table showing scheduled appointments, actual occupancy, and capacity for each 15-minute interval:
| Time | Scheduled | Actual | Capacity |
|------|-----------|--------|----------|
| 08:00 | 3 | 2 | 10 |
| 08:15 | 5 | 4 | 10 |
| 08:30 | 7 | 6 | 10 |
| 08:45 | 8 | 7 | 10 |
| 09:00 | 9 | 8 | 10 |
| 09:15 | 10 | 9 | 10 |
| 09:30 | 10 | 8 | 10 |
| ... | ... | ... | ... |
| 15:00 | 8 | 6 | 10 |
| 15:15 | 6 | 5 | 10 |
| 15:30 | 4 | 3 | 10 |
Overall Metrics:
- Scheduled Utilization: 78%
- Actual Utilization: 68%
- Scheduled Visits: 42
- Actual Visits: 38
**Insights:** The infusion center is scheduled at 78% capacity, indicating relatively efficient booking. However, actual utilization is only 68%, revealing a 10-percentage-point gap caused by patient no-shows or cancellations. The morning period (9:00-10:00 AM) shows peak utilization at 90-100%, suggesting this is the most popular appointment time. Afternoon periods (3:00-5:00 PM) show lower utilization (40-60%), indicating opportunities to schedule additional appointments without adding chairs.
**Action Items:**
- Implement a reminder system to reduce the 10% gap between scheduled and actual attendance
- Offer incentives for afternoon appointments to balance utilization throughout the day
- Consider adding overflow capacity during 9:00-10:00 AM peak period or spreading appointments more evenly
- The facility can likely handle 10-15% more patients by better utilizing afternoon time slots
### Example 2: Multi-Zone Treatment Area Analysis
**Scenario:** A large cancer treatment center has three infusion zones (Adult Zone 1, Adult Zone 2, and Pediatric Zone). Leadership wants to compare utilization across zones to determine if patient load is balanced or if some zones are over-scheduled while others sit idle.
**Settings:**
- Appointment DateTime Column: APPOINTMENT_TIME
- Scheduled Duration Column: SCHEDULED_DURATION_MINUTES
- Scheduled Duration Unit: Minutes
- Treatment Start DateTime Column: CHECKIN_TIME
- Treatment End DateTime Column: CHECKOUT_TIME
- Bin Size: 30 minutes
- Capacity Groups: (auto-calculate)
- Zone Column: ZONE
- Selected Zone: Adult Zone 1
- Selected Day: 2024-11-22
**Output for Adult Zone 1:**
| Time | Scheduled | Actual | Capacity |
|------|-----------|--------|----------|
| 08:00 | 4 | 4 | 8 |
| 08:30 | 6 | 5 | 8 |
| 09:00 | 7 | 7 | 8 |
| 09:30 | 8 | 7 | 8 |
| 10:00 | 8 | 8 | 8 |
| ... | ... | ... | ... |
Overall Metrics:
- Scheduled Utilization: 92%
- Actual Utilization: 87%
- Scheduled Visits: 28
- Actual Visits: 26
Running the same analysis for Adult Zone 2 and Pediatric Zone:
**Adult Zone 2:**
- Scheduled Utilization: 73%
- Actual Utilization: 68%
**Pediatric Zone:**
- Scheduled Utilization: 58%
- Actual Utilization: 54%
**Insights:** Adult Zone 1 is operating near maximum capacity at 92% scheduled utilization, with actual utilization of 87% indicating excellent patient show-up rates. This zone is likely experiencing scheduling constraints and may not be able to accommodate urgent add-on appointments. Adult Zone 2 at 73% is well-utilized but has room for additional patients. The Pediatric Zone at 58% shows significant underutilization, with nearly half of available chairs idle during the day.
**Action Items:**
- Redistribute adult patients between Zone 1 and Zone 2 to balance capacity and reduce strain on Zone 1
- Investigate why Pediatric Zone utilization is low (lower patient volumes, longer appointment durations, or scheduling gaps)
- Consider converting some Pediatric Zone capacity to adult use during low-demand periods
- Monitor Zone 1 for potential bottlenecks or patient experience issues caused by overcrowding
### Example 3: Variable Capacity Scheduling
**Scenario:** An outpatient dialysis clinic operates with different staffing levels throughout the day due to shift schedules. They have 8 stations from 6 AM to 2 PM (morning shift), then increase to 12 stations from 2 PM to 10 PM (afternoon/evening shift) when more nurses are available. The clinic director wants to verify that appointments are being scheduled to match staff availability.
**Settings:**
- Appointment DateTime Column: APPOINTMENT_TIME
- Scheduled Duration Column: TREATMENT_HOURS
- Scheduled Duration Unit: Hours
- Treatment Start DateTime Column: ACTUAL_START
- Treatment End DateTime Column: ACTUAL_END
- Bin Size: 30 minutes
- Capacity Groups:
- Group 1: Start Time: 06:00:00, End Time: 14:00:00, Number of Chairs: 8
- Group 2: Start Time: 14:00:00, End Time: 22:00:00, Number of Chairs: 12
- Zone Column: (not used)
- Selected Zone: (not used)
- Selected Day: (not used)
**Output:**
| Time | Scheduled | Actual | Capacity |
|------|-----------|--------|----------|
| 06:00 | 5 | 5 | 8 |
| 06:30 | 7 | 6 | 8 |
| 07:00 | 8 | 8 | 8 |
| ... | ... | ... | ... |
| 13:30 | 7 | 6 | 8 |
| 14:00 | 9 | 8 | 12 |
| 14:30 | 11 | 10 | 12 |
| 15:00 | 12 | 11 | 12 |
| ... | ... | ... | ... |
Overall Metrics:
- Scheduled Utilization: 85%
- Actual Utilization: 79%
**Insights:** The dialysis clinic is efficiently utilizing its variable capacity model. Morning shift (6 AM - 2 PM) shows 85-100% utilization of the 8 available stations, indicating the facility is maximizing capacity with existing staff. The afternoon/evening shift (2 PM - 10 PM) shows 75-92% utilization of 12 stations, suggesting the expanded capacity is appropriate for higher patient demand during these hours. The 6-percentage-point gap between scheduled and actual utilization indicates most patients are showing up for their appointments, which is typical for dialysis where treatments are medically necessary.
**Action Items:**
- The current staffing model aligns well with patient demand patterns
- Consider adding 1-2 additional stations during afternoon shift based on 92% peak utilization
- Monitor morning shift closely as it's operating at maximum capacity with no buffer for emergencies
- Maintain current scheduling practices as they effectively match capacity to demand
## Output
The calculator produces a comprehensive utilization analysis with the following components:
**Time-Binned Table:** A data table with columns for Time, Scheduled chairs occupied, Actual chairs occupied, and Capacity available. Each row represents one time interval (bin) showing how many chairs were scheduled, how many were actually in use, and how many were available during that period.
**Overall Utilization Metrics:**
- Scheduled Utilization (percentage): The proportion of available capacity that was scheduled for use
- Actual Utilization (percentage): The proportion of available capacity that was actually used
- Scheduled Visit Count: Total number of appointments scheduled
- Actual Visit Count: Total number of treatments completed
**Time Range Information:**
- Start Time: Beginning of the analysis period (time of day)
- End Time: End of the analysis period (time of day)
- Bin Size: Duration of each time interval
**Capacity Configuration:** The capacity groups used for the calculation, showing when chairs were available and in what quantities.
You can visualize this output as:
- **Line chart:** Three lines showing scheduled occupancy, actual occupancy, and capacity over time
- **Stacked area chart:** Visual representation of capacity utilization throughout the day
- **Bar chart:** Side-by-side comparison of scheduled versus actual occupancy for each time bin
- **Heat map:** Color-coded visualization of utilization intensity across different time periods
- **Gauge charts:** Single-value displays for overall scheduled and actual utilization percentages
---
*This documentation is part of the mindzie Studio process mining platform.*
---
## Column Info
Section: Calculators
URL: https://docs.mindziestudio.com/mindzie_studio/calculators/column-info
Source: /docs-master/mindzieStudio/calculators/column-info/page.md
# Column Info
## Overview
The Column Info calculator provides detailed metadata and statistics about all attributes (columns) in your event log dataset. This administrative tool displays comprehensive information about each attribute including data types, value distributions, null counts, and sample values.
**IMPORTANT: This is an administrator-only calculator designed for technical analysis and research purposes.** It is not optimized for production use and may take significant time to process large datasets. Regular users should use the Dataset Information calculator for general dataset overview needs.
This calculator is primarily used by system administrators, data analysts, and technical users who need deep insights into data structure and quality for troubleshooting, data validation, or dataset optimization.
## Common Uses
- Perform comprehensive data quality audits across all attributes in the event log
- Identify attributes with high percentages of null or missing values
- Analyze data type consistency and detect potential type conversion issues
- Review attribute cardinality (number of unique values) to identify candidates for categorical analysis
- Validate data extraction results by examining attribute-level statistics
- Diagnose performance issues by identifying attributes with unexpected value distributions
- Document dataset schema and characteristics for technical specifications
## Settings
This calculator requires no specific configuration settings. When executed, it automatically scans all attributes in the current dataset (both case-level and event-level) and generates comprehensive statistics for each.
**Note:** Processing time depends on dataset size and the number of attributes. For very large datasets, this calculator may take several minutes to complete.
## Examples
### Example 1: Data Quality Audit After ETL
**Scenario:** You have just completed an ETL process to extract order-to-cash data from your ERP system. Before releasing the dataset to business users, you need to verify that all attributes were extracted correctly and assess data completeness.
**Settings:**
- Title: "Post-ETL Data Quality Validation"
- Description: "O2C dataset - January 2025 extraction"
**Output:**
The calculator displays a comprehensive table with the following information for each attribute:
| Attribute Name | Type | Total Values | Null Count | Null % | Unique Values | Sample Values |
|---------------|------|--------------|------------|--------|---------------|---------------|
| CaseID | Case | 2,456 | 0 | 0% | 2,456 | ORD-001, ORD-002, ORD-003 |
| CustomerName | Case | 2,456 | 12 | 0.5% | 847 | Acme Corp, TechStart Inc, Global... |
| OrderAmount | Case | 2,456 | 0 | 0% | 1,823 | 1250.00, 3400.50, 875.25 |
| Region | Case | 2,456 | 156 | 6.4% | 4 | North, South, East, West |
| ActivityName | Event | 18,945 | 0 | 0% | 15 | Create Order, Approve Order, Ship... |
| Timestamp | Event | 18,945 | 0 | 0% | 18,893 | 2025-01-15 08:23:00, 2025-01-15... |
| ApprovalLevel | Event | 18,945 | 8,234 | 43.5% | 3 | L1, L2, L3 |
| Department | Event | 18,945 | 3,456 | 18.2% | 8 | Sales, Finance, Operations... |
**Insights:** The audit reveals several data quality concerns. The Region attribute has 6.4% null values affecting 156 cases - these cases need manual review or data correction. More critically, the ApprovalLevel attribute has 43.5% null values, which may indicate that not all activities require approval (expected) or that approval data is missing for activities that should have it (requires investigation). The low null count in CustomerName (0.5%) is acceptable and may represent test orders. All critical identifiers (CaseID, Timestamp) have zero nulls, confirming data integrity.
### Example 2: Performance Troubleshooting
**Scenario:** Users are reporting slow performance when filtering on certain attributes. You need to identify which attributes have high cardinality (many unique values) that might be causing inefficient filtering.
**Settings:**
- Title: "Attribute Cardinality Analysis"
- Description: "Investigating filter performance issues"
**Output:**
| Attribute Name | Type | Total Values | Unique Values | Cardinality Ratio | Data Type |
|---------------|------|--------------|---------------|-------------------|-----------|
| CaseID | Case | 45,678 | 45,678 | 100% | String |
| TransactionID | Event | 367,824 | 367,824 | 100% | String |
| UserComments | Event | 367,824 | 89,234 | 24.3% | String |
| ProductSKU | Event | 367,824 | 12,456 | 3.4% | String |
| Status | Case | 45,678 | 8 | 0.02% | String |
| Priority | Case | 45,678 | 3 | 0.007% | String |
**Insights:** The analysis reveals a wide range of cardinality across attributes. CaseID and TransactionID have 100% cardinality (every value is unique), making them excellent for case identification but poor candidates for categorical filtering. UserComments has unexpectedly high cardinality (24.3%), suggesting it contains free-form text rather than standardized values - filtering on this attribute will be slow and may benefit from full-text search optimization. In contrast, Status (8 values) and Priority (3 values) are ideal for efficient filtering. This analysis helps optimize filter design and guides users toward high-performance attribute selections.
### Example 3: Schema Documentation for Integration
**Scenario:** You need to provide technical documentation to a third-party vendor who will be integrating with your process mining environment. They need detailed information about available attributes, data types, and expected value ranges.
**Settings:**
- Title: "Purchase-to-Pay Schema Documentation"
- Description: "Technical specification for API integration"
**Output:**
| Attribute Name | Attribute Type | Data Type | Total Values | Unique Values | Null Count | Sample Values |
|---------------|----------------|-----------|--------------|---------------|------------|---------------|
| PO_Number | Case | String | 8,945 | 8,945 | 0 | PO-2025-00001, PO-2025-00002 |
| Vendor_ID | Case | String | 8,945 | 234 | 0 | V12345, V67890, V45678 |
| Total_Amount | Case | Decimal | 8,945 | 7,823 | 0 | 15750.50, 2340.00, 987.25 |
| Currency | Case | String | 8,945 | 3 | 12 | USD, EUR, GBP |
| RequestDate | Case | DateTime | 8,945 | 2,456 | 0 | 2025-01-15, 2025-01-16 |
| Activity | Event | String | 71,560 | 12 | 0 | Create PO, Approve PO, Send... |
| Resource | Event | String | 71,560 | 145 | 234 | john.smith, sarah.jones... |
| Cost_Center | Event | String | 71,560 | 67 | 1,234 | CC-1001, CC-2045, CC-3012 |
**Insights:** The schema documentation shows that PO_Number is the primary case identifier with guaranteed uniqueness and no nulls. All monetary values use the Total_Amount field (decimal type) with Currency specified separately. The process supports three currencies (USD, EUR, GBP) with 12 cases missing currency data that need correction. Resource information is available for 145 unique users but has 234 null values at the event level, indicating some automated activities. The Cost_Center attribute has 1.7% null values, suggesting incomplete data entry for certain activities. This comprehensive view enables accurate integration planning.
### Example 4: Detecting Data Type Inconsistencies
**Scenario:** After merging data from multiple source systems, you suspect there may be data type inconsistencies that could cause calculation errors or unexpected behavior in analyses.
**Settings:**
- Title: "Data Type Consistency Check"
- Description: "Multi-source data validation"
**Output:**
| Attribute Name | Detected Type | Total Values | Type Conflicts | Sample Inconsistent Values |
|---------------|---------------|--------------|----------------|---------------------------|
| OrderDate | DateTime | 5,678 | 0 | - |
| OrderValue | Mixed | 5,678 | 23 | "1250.50", "$1,250.50", "1250,50" |
| QuantityOrdered | Integer | 5,678 | 8 | "100", "100.0", "100 units" |
| CustomerID | String | 5,678 | 0 | - |
| IsRush | Mixed | 5,678 | 145 | "Yes", "Y", "1", "true", "TRUE" |
**Insights:** The analysis uncovered critical data type inconsistencies. The OrderValue attribute contains mixed formatting - some values include currency symbols and different decimal separators (comma vs period), requiring data cleansing before calculations. QuantityOrdered shows 8 instances where text was appended ("100 units"), which will cause errors in numeric aggregations. The IsRush flag has five different representations of boolean values, requiring standardization to "true/false" or "1/0" for reliable filtering. These issues must be resolved in the ETL process before the data can be used reliably.
### Example 5: Identifying Enrichment Opportunities
**Scenario:** You want to identify attributes with low cardinality that would benefit from enrichment with additional descriptive information to make analyses more user-friendly.
**Settings:**
- Title: "Enrichment Opportunity Analysis"
- Description: "Identifying candidates for lookup enrichment"
**Output:**
| Attribute Name | Type | Unique Values | Null % | Sample Values | Enrichment Potential |
|---------------|------|---------------|--------|---------------|---------------------|
| ProductCode | Event | 45 | 0% | P001, P002, P003 | HIGH - Add product names |
| StatusCode | Case | 8 | 0% | ST-01, ST-02, ST-03 | HIGH - Add status descriptions |
| RegionCode | Case | 4 | 0% | R1, R2, R3, R4 | HIGH - Add region names |
| CurrencyCode | Case | 3 | 0% | USD, EUR, GBP | MEDIUM - Generally understood |
| EmployeeID | Event | 234 | 2.1% | E12345, E67890 | HIGH - Add employee names |
**Insights:** Several attributes contain codes that would benefit from enrichment. With only 45 unique product codes, adding product names would make analyses far more readable for business users. The 8 status codes should be enriched with plain-language descriptions to avoid users needing to reference code sheets. Employee IDs should be enriched with names while maintaining privacy compliance. These enrichments will significantly improve the user experience without adding substantial data volume.
### Example 6: Monitoring Data Completeness Trends
**Scenario:** You run regular data extractions and want to monitor whether data completeness is improving or degrading over time by comparing current extraction statistics with previous baselines.
**Settings:**
- Title: "Data Completeness Monitoring - February 2025"
- Description: "Compare with January baseline"
**Output:**
| Attribute Name | Type | Jan Null % | Feb Null % | Change | Trend |
|---------------|------|-----------|-----------|--------|-------|
| ApproverName | Event | 5.2% | 3.1% | -2.1% | IMPROVED |
| Department | Case | 8.4% | 8.9% | +0.5% | DEGRADED |
| CostCenter | Event | 12.3% | 18.7% | +6.4% | DEGRADED |
| Priority | Case | 1.2% | 1.1% | -0.1% | STABLE |
| DueDate | Case | 15.6% | 9.2% | -6.4% | IMPROVED |
**Insights:** The comparison reveals mixed data quality trends. ApproverName null percentages decreased from 5.2% to 3.1%, indicating improved data capture at the approval stage - possibly due to recent process changes requiring explicit approver selection. However, CostCenter null percentages increased significantly from 12.3% to 18.7%, suggesting a degradation in cost center assignment that requires immediate attention. The dramatic improvement in DueDate completeness (from 15.6% to 9.2%) reflects the successful implementation of mandatory due date entry. These trends guide ongoing data quality initiatives.
## Output
The Column Info calculator displays a comprehensive table with detailed statistics for every attribute in your event log. The table includes both case-level and event-level attributes with the following information:
**Attribute Name:** The name of the attribute as it appears in the dataset.
**Attribute Type:** Indicates whether this is a Case-level attribute (one value per case) or Event-level attribute (one value per event/activity).
**Data Type:** The detected data type of the attribute (String, Integer, Decimal, DateTime, Boolean, etc.).
**Total Values:** The total number of values present for this attribute (total cases for case attributes, total events for event attributes).
**Null Count:** The number of null or missing values for this attribute.
**Null Percentage:** The percentage of values that are null or missing, calculated as (Null Count / Total Values) * 100.
**Unique Values:** The number of distinct unique values in this attribute.
**Cardinality Ratio:** The ratio of unique values to total values, expressed as a percentage. High cardinality (close to 100%) indicates mostly unique values; low cardinality indicates many repeated values.
**Sample Values:** A representative sample of actual values from the attribute, typically showing 3-5 distinct values to illustrate the data format and content.
**Min Value:** For numeric and date attributes, the minimum (smallest/earliest) value.
**Max Value:** For numeric and date attributes, the maximum (largest/latest) value.
### Interactive Features
**Sort and Filter:** Click column headers to sort by any metric. Use the search box to filter to specific attributes of interest.
**Export Results:** Export the complete attribute analysis to Excel or CSV for documentation, comparison, or sharing with technical teams.
**Drill-down Analysis:** Click on an attribute name to see additional detailed statistics including value frequency distribution and more comprehensive sample values.
### Performance Considerations
- **Large Datasets:** For datasets with millions of events or hundreds of attributes, this calculator may require several minutes to complete analysis
- **Resource Usage:** The calculator performs comprehensive scans of all attribute values, which is memory and CPU intensive
- **Best Practices:** Run this calculator during off-peak hours for very large datasets, or use filters to reduce dataset size before execution
### Administrative Access
This calculator is restricted to users with Administrator role. Regular users who need dataset overview information should use the Dataset Information calculator instead, which provides key metrics without the performance overhead of comprehensive column analysis.
---
*This documentation is part of the mindzie Studio process mining platform.*
---
## Conformance Counts
Section: Calculators
URL: https://docs.mindziestudio.com/mindzie_studio/calculators/conformance-counts
Source: /docs-master/mindzieStudio/calculators/conformance-counts/page.md
# Conformance Counts
## Overview
The Conformance Counts calculator analyzes all conformance issues in your process data and displays how many cases are affected by each type of conformance violation. This calculator automatically identifies boolean attributes marked as conformance issues and provides a comprehensive summary of process compliance problems.
Conformance issues represent violations of process rules or standards, such as missing approvals, skipped steps, out-of-sequence activities, or policy violations. By counting how many cases have each type of issue, this calculator helps you prioritize which compliance problems to address first.
## Common Uses
- Identify the most frequent conformance violations in your process
- Measure overall process compliance by counting cases with versus without issues
- Prioritize compliance improvement initiatives based on issue frequency
- Track conformance trends over time by comparing counts across periods
- Create conformance dashboards showing the distribution of different violation types
- Drill down into specific conformance issues to analyze affected cases
## Settings
This calculator has no configurable settings. It automatically discovers and analyzes all boolean attributes that have been marked as conformance issues in your process data.
**Standard Fields:**
- **Title:** Optional custom title for the calculator output
- **Description:** Optional description for documentation purposes
**How It Works:**
The calculator scans your case data for boolean columns flagged as "ConformanceIssue" type. These columns are typically created by:
- Enrichments that detect process violations (for example, "Missing Approval" or "Late Payment")
- Filters that flag non-compliant cases
- Data extraction logic that captures compliance flags from source systems
- Process mining analysis that identifies standard violations
Each conformance issue column should contain true/false values where "true" indicates the violation is present in that case.
## Examples
### Example 1: Analyzing Purchase Order Compliance
**Scenario:** Your Procure to Pay process has several enrichments that flag conformance issues like missing approvals, maverick buying, and policy violations. You want to understand which compliance problems are most prevalent.
**Settings:**
- Title: "P2P Conformance Issues Summary"
- Description: "Overview of all compliance violations"
**Output:**
The calculator displays a table with one row per conformance issue:
| Conformance Issue | Case Count | Case Percent |
|-------------------|------------|--------------|
| Missing Three-Way Match | 847 | 18.4% |
| Purchase Order Above Approval Threshold | 623 | 13.5% |
| Maverick Buying (Non-Catalog Supplier) | 412 | 8.9% |
| Missing Budget Approval | 267 | 5.8% |
| Late Payment to Supplier | 189 | 4.1% |
| Invoice Price Mismatch | 143 | 3.1% |
| Duplicate Invoice | 87 | 1.9% |
**Insights:**
The most significant compliance issue is missing three-way match validation, affecting 847 cases (18.4% of all purchase orders). This creates audit risk and potential payment errors. The second most common issue is purchase orders exceeding approval thresholds without proper authorization, affecting 623 cases.
Together, these two issues account for nearly one-third of all purchase orders, making them the highest priority for process improvement initiatives. You can click on any row to filter your process map and case data to show only cases with that specific conformance issue.
### Example 2: Measuring Overall Compliance Rate
**Scenario:** You want to create a high-level compliance metric showing what percentage of cases are fully compliant versus having at least one issue.
**Settings:**
- Title: "Invoice Processing Compliance Rate"
- Description: "Cases with any conformance issue"
**Output:**
The calculator shows all conformance issues detected:
| Conformance Issue | Case Count | Case Percent |
|-------------------|------------|--------------|
| Missing Approval | 423 | 12.3% |
| Late Processing | 387 | 11.2% |
| Incorrect Routing | 234 | 6.8% |
| Missing Documentation | 156 | 4.5% |
**Insights:**
Looking across all issues, approximately 1,200 of your 3,450 invoices (about 35%) have at least one conformance issue, meaning your overall compliance rate is approximately 65%. This provides a baseline metric you can track month-over-month to measure the impact of process improvements.
To calculate exact compliance rate, you would combine this data with Case Count calculator results. The fact that percentages don't sum to 35% indicates some cases have multiple conformance issues - this is important to know when planning remediation efforts.
### Example 3: Comparing Conformance Across Time Periods
**Scenario:** You implemented process improvements last quarter and want to measure their impact on conformance rates.
**Settings:**
- Run the calculator twice: once filtered to Q3 data, once filtered to Q4 data
- Title (First): "Q3 2024 Conformance Issues"
- Title (Second): "Q4 2024 Conformance Issues"
**Output:**
Q3 2024 Results:
| Conformance Issue | Case Count | Case Percent |
|-------------------|------------|--------------|
| Missing Approval | 423 | 12.3% |
| Late Processing | 387 | 11.2% |
Q4 2024 Results:
| Conformance Issue | Case Count | Case Percent |
|-------------------|------------|--------------|
| Missing Approval | 267 | 8.1% |
| Late Processing | 298 | 9.0% |
**Insights:**
Your approval process improvements in Q4 reduced missing approvals from 12.3% to 8.1% - a significant 34% reduction in this conformance issue. Late processing also improved from 11.2% to 9.0%. These results demonstrate measurable improvement in process compliance following your intervention.
You can add both calculator outputs to a dashboard for side-by-side comparison, or use the "Selected Cases by Category Over Time" calculator to show how these conformance rates trend across all months.
### Example 4: Prioritizing Compliance Initiatives by Business Impact
**Scenario:** You have multiple conformance issues but limited resources to address them. You want to prioritize based on frequency and business impact.
**Settings:**
- Title: "Accounts Payable Conformance Issues - Impact Analysis"
- Description: "Frequency and severity of compliance violations"
**Output:**
| Conformance Issue | Case Count | Case Percent | Business Impact |
|-------------------|------------|--------------|-----------------|
| Late Payment (Beyond Terms) | 1,234 | 24.5% | Lost early payment discounts, supplier relationship damage |
| Missing Three-Way Match | 847 | 16.8% | Audit risk, potential payment errors |
| Duplicate Payment Risk | 156 | 3.1% | Direct financial loss |
| Missing Purchase Order | 423 | 8.4% | Compliance risk, lack of budget control |
**Insights:**
While duplicate payment risk affects only 3.1% of cases, its business impact (direct financial loss) may warrant immediate attention. Meanwhile, late payments affect nearly a quarter of all invoices and result in both financial losses (missed discounts) and relationship damage with suppliers.
This analysis suggests a two-track approach: implement automated duplicate detection to prevent high-impact losses, while simultaneously addressing the high-frequency late payment issue through process optimization and resource allocation.
The conformance counts data, combined with business context about each violation type, enables data-driven prioritization of your compliance improvement roadmap.
### Example 5: Drilling Down into Specific Conformance Issues
**Scenario:** The Conformance Counts calculator shows that 847 cases have "Missing Three-Way Match" issues. You want to analyze these cases in detail.
**Settings:**
- Title: "All Conformance Issues"
- Description: "Process compliance overview"
**Output:**
The calculator shows all conformance issues including "Missing Three-Way Match" with 847 cases (18.4%).
**Next Steps:**
1. Click on the "Missing Three-Way Match" row in the output table
2. This filters your entire analysis to show only the 847 cases with this conformance issue
3. Use additional calculators to analyze these filtered cases:
- Case Explorer: See the specific purchase orders with missing three-way match
- Breakdown by Categories: Analyze by supplier, department, or amount range
- Root Cause Analysis: Use AI to identify common characteristics of these cases
- Process Map: Visualize the actual process flows for non-compliant cases
**Insights:**
The Conformance Counts calculator serves as a starting point for deeper analysis. By clicking on specific conformance issues, you can progressively narrow your focus from "what are all the issues" to "which cases have this specific issue" to "why do these cases have this problem" to "how do we fix it."
This drill-down workflow is essential for moving from compliance measurement to compliance improvement.
## Output
The calculator produces a table with the following structure:
**Column Name (Text):** The display name of each conformance issue attribute. This describes the specific type of process violation or compliance problem.
**Case Count (Number):** The number of cases affected by this conformance issue. This represents how many process instances have this particular violation flagged as "true" in the data.
**Case Percent (Percentage):** The percentage of total cases affected by this conformance issue, expressed as a decimal (0.184 = 18.4%). This helps you understand the relative prevalence of different conformance problems.
**Interactive Features:**
- **Row Filtering:** Click on any row to filter the entire analysis to show only cases with that specific conformance issue
- **Sorting:** Click column headers to sort by issue name, frequency, or percentage
- **Dashboard Export:** Add the calculator to dashboards for ongoing conformance monitoring
- **Case View Access:** Each row contains a hidden CaseView object that enables the filtering functionality
**Interpretation Notes:**
- **High percentages (above 20%):** Indicate systemic process problems affecting a large portion of cases. These require process redesign or policy changes.
- **Medium percentages (5-20%):** Common issues that should be addressed through targeted improvements, training, or automated controls.
- **Low percentages (below 5%):** May represent edge cases or specific scenario failures. Consider whether prevention is cost-effective.
- **Zero counts:** Conformance issues that exist in your data model but are not currently occurring. This is good - it means that particular compliance rule is being followed.
**Empty Results:**
If the calculator returns an empty table, this means:
- No boolean columns are marked as conformance issues in your data, OR
- All conformance issue columns contain only "false" values (no violations detected)
To use this calculator effectively, you must first create conformance issue attributes through enrichments or data extraction that flag specific process violations as boolean true/false values.
---
*This documentation is part of the mindzie Studio process mining platform.*
---
## Concurrent Activities (Alpha)
Section: Calculators
URL: https://docs.mindziestudio.com/mindzie_studio/calculators/concurrent-activities
Source: /docs-master/mindzieStudio/calculators/concurrent-activities/page.md
# Concurrent Activities (Alpha)
The Concurrent Activities calculator identifies activity pairs that run concurrently (overlapping in time) within cases. This is useful for understanding parallelism in your processes and identifying activities that commonly execute simultaneously.
> **Alpha Feature**: This calculator is part of the mindzie Alpha Program. It requires PreRelease to be enabled for your tenant. See [Alpha Features](/mindzie_studio/alpha/overview) for more information.
## Overview
This calculator analyzes your event log to find activities that overlap in time within the same case. It produces two outputs:
1. **Concurrent Activities Table** - Lists all activity pairs that occur concurrently, with frequency metrics
2. **Concurrency Matrix** - A matrix view showing concurrency relationships between activities
## How Concurrency is Detected
The detection method depends on whether your event log includes activity start times:
**With Start Times Available:**
- True temporal overlap detection
- Two activities are concurrent if: Activity1.Start < Activity2.End AND Activity2.Start < Activity1.End
**Without Start Times:**
- Falls back to same-timestamp detection
- Activities occurring at the exact same timestamp are considered concurrent
## Configuration Options
### Case Percent Threshold
Sets the minimum percentage of cases that must contain a concurrent pair for it to be included in the output.
- **Default**: 5%
- **Range**: 0% to 100%
- **Purpose**: Filters out rare concurrency patterns that may be noise
Lower values show more pairs (including rare ones), higher values show only the most common concurrent patterns.
### Include Self-Loops
Controls whether the same activity can be concurrent with itself (e.g., two instances of "Review Document" running at the same time).
- **Default**: Yes (included)
- **Options**: Yes / No
## Output Tables
### Concurrent Activities Table
| Column | Description |
|--------|-------------|
| Activity Pair | Combined name showing both activities (e.g., "Activity A <-> Activity B") |
| Activity1 | First activity in the pair |
| Activity2 | Second activity in the pair |
| Concurrency Count | Total number of times this pair occurred concurrently across all cases |
| Case Count | Number of cases where this pair occurred concurrently |
| Case Percent | Percentage of total cases containing this concurrent pair |
Results are sorted by Case Count (descending), then by Concurrency Count.
### Concurrency Matrix
A square matrix where:
- Rows and columns represent activities
- Cell values show the case count where those two activities were concurrent
- Only activities meeting the threshold are included
## Use Cases
### Identifying Parallel Work
Find activities that naturally occur in parallel, which may indicate:
- Parallel approval workflows
- Concurrent processing streams
- Multi-tasking patterns
### Resource Contention Analysis
When the same resource performs concurrent activities, it may indicate:
- Workload balancing issues
- Need for additional resources
- Process bottlenecks
### Process Discovery Validation
Use concurrency data to validate process models:
- Confirm expected parallel gateways
- Identify unexpected parallelism
- Verify process design assumptions
## Example
Given a process where "Technical Review" and "Business Review" often happen simultaneously:
**Concurrent Activities Table:**
| Activity Pair | Concurrency Count | Case Count | Case Percent |
|---------------|-------------------|------------|--------------|
| Technical Review <-> Business Review | 1,247 | 892 | 45.2% |
| Data Entry <-> Validation | 534 | 423 | 21.4% |
This shows that Technical Review and Business Review run concurrently in 45.2% of cases.
## Tips
- **Start with a higher threshold** (e.g., 10-20%) to see the most significant patterns, then lower it to explore less common concurrency
- **Compare with process model** - concurrent activities should correspond to parallel gateways in your BPMN
- **Consider resource implications** - high concurrency with shared resources may indicate bottlenecks
- **Use with Same Time Pairs calculator** for additional perspective on temporal relationships
## Related Calculators
- [Same Time Pairs](/mindzie_studio/calculators/same-time-pairs) - Finds activities that occur at exactly the same timestamp
- [Process Map](/mindzie_studio/calculators/process-map) - Visualize process flow including parallel paths
- [Time Between All Activity Pairs](/mindzie_studio/calculators/time-between-all-activity-pairs) - Analyze timing between activity pairs
## Technical Details
- **Algorithm**: O(n * e^2) where n = cases, e = events per case
- **Memory**: Stores unique activity pairs with counts
- **Similar to**: PM4PY's `pm4py.statistics.concurrent_activities`
---
## Daily Activity Count
Section: Calculators
URL: https://docs.mindziestudio.com/mindzie_studio/calculators/daily-activity-count
Source: /docs-master/mindzieStudio/calculators/daily-activity-count/page.md
# Daily Activity Count
## Overview
The Daily Activity Count calculator tracks how many times each activity occurs on each calendar day, providing a detailed breakdown of activity frequency over time. Unlike the Daily Event Count calculator which shows total event counts per day, this calculator separates counts by activity type, allowing you to identify patterns and anomalies for specific activities in your process.
This calculator operates at the event level and groups data by both activity name and date, making it particularly valuable for understanding workload distribution, identifying data quality issues for specific activities, and monitoring operational patterns for individual process steps.
## Common Uses
- Identify which activities experience volume spikes or drops on specific days
- Detect data quality issues affecting specific activities (missing activity data on certain dates)
- Analyze workload patterns for individual process steps across time
- Monitor staffing needs by tracking activity-specific workload by day
- Validate data extraction completeness for critical activities
- Compare activity frequency trends to identify process changes or bottlenecks
- Track seasonal or cyclical patterns for specific process activities
## Settings
**Time Period:** While the setting includes a time period option, the calculator currently groups all data by calendar day (the date component only, ignoring the time). This means all activity counts are aggregated to the daily level regardless of when during the day they occurred.
**Standard Fields:**
- **Title:** Optional custom title for the calculator output
- **Description:** Optional description for documentation purposes
## Examples
### Example 1: Detecting Activity-Specific Data Issues
**Scenario:** Your invoice processing team reports that "Approve Invoice" activities seem to be missing from certain days in your event log. You want to verify whether this is a data extraction issue or if approvals genuinely didn't occur on those days.
**Settings:**
- Title: "Approval Activity Daily Tracking"
- Description: "Verify completeness of invoice approval data"
**Output:**
The calculator displays a table with three columns:
- **Date:** Each calendar day in your event log
- **Activity Name:** The name of each activity that occurred
- **Count:** How many times that activity occurred on that date
Example output:
```
Date Activity Name Count
2024-03-10 Submit Invoice 234
2024-03-10 Approve Invoice 198
2024-03-10 Pay Invoice 156
2024-03-11 Submit Invoice 248
2024-03-11 Approve Invoice 0
2024-03-11 Pay Invoice 12
2024-03-12 Submit Invoice 241
2024-03-12 Approve Invoice 215
2024-03-12 Pay Invoice 187
```
**Insights:** On March 11th, "Approve Invoice" shows zero occurrences while submissions and payments continued. This pattern indicates a data extraction problem rather than a genuine business pause, since you cannot have payments (156 the previous day, 12 on March 11th) without prior approvals. The dramatic drop from 198 approvals to 0, followed by recovery to 215 the next day, confirms a one-day data gap that needs investigation.
### Example 2: Analyzing Activity Workload Patterns
**Scenario:** You're managing a customer service process and want to understand the daily volume patterns for different types of customer interactions to optimize staffing levels.
**Settings:**
- Title: "Customer Service Activity Volume Analysis"
- Description: "Track daily volumes for staffing optimization"
**Output:**
The output shows daily counts for activities like "Create Case," "Update Case," "Escalate Case," and "Close Case" across multiple weeks. When visualized as a line chart with one line per activity, you can identify:
- "Create Case" peaks on Mondays (backlog from weekend)
- "Close Case" peaks on Fridays (weekly cleanup efforts)
- "Escalate Case" shows consistent low volume except for month-end spikes
- "Update Case" remains relatively stable across all weekdays
**Insights:** The Monday spike in new case creation (often 40-50% higher than other weekdays) suggests you need additional staff on Mondays for case intake. The Friday peak in closures indicates staff prioritize completing cases before the weekend. Month-end escalation spikes align with customer urgency around billing cycles, suggesting you should schedule senior staff availability during these periods.
### Example 3: Identifying Process Changes Over Time
**Scenario:** Your organization implemented a new procurement approval workflow on June 1st. You want to verify whether the new "Pre-Approval Review" activity is being used consistently and whether it replaced or supplemented the existing "Standard Approval" activity.
**Settings:**
- Title: "Procurement Workflow Transition Analysis"
- Description: "Track adoption of new pre-approval step"
**Output:**
The calculator shows daily counts for both approval activities across May and June:
Before June 1st:
```
Date Activity Name Count
2024-05-28 Standard Approval 145
2024-05-28 Pre-Approval Review 0
2024-05-29 Standard Approval 152
2024-05-29 Pre-Approval Review 0
```
After June 1st:
```
Date Activity Name Count
2024-06-01 Standard Approval 89
2024-06-01 Pre-Approval Review 58
2024-06-02 Standard Approval 72
2024-06-02 Pre-Approval Review 78
2024-06-03 Standard Approval 45
2024-06-03 Pre-Approval Review 103
```
**Insights:** The new Pre-Approval Review activity appeared immediately on June 1st and its volume increased daily (58, 78, 103) as staff adopted the new process. Meanwhile, Standard Approval counts decreased (145 to 89 to 72 to 45), showing the workflow change is working as intended. The combined total (147 on June 3rd) is similar to pre-change volumes (145-152), indicating the new step is supplementing rather than creating additional work. By mid-June, you'd expect Pre-Approval Review to handle most cases with Standard Approval limited to exceptions.
## Output
The calculator produces a data table with the following columns:
**Date (DateTime):** The calendar date for each group of activity occurrences. The time component is always set to 00:00:00 (midnight) as the calculator groups by date only.
**Activity Name (Text):** The exact name of the activity as it appears in your event log. Activity names are case-sensitive and must match exactly to be grouped together.
**Count (Number):** The number of times this specific activity occurred on this specific date. This is always a positive whole number representing individual event occurrences.
The output can be visualized as:
- **Line charts:** Show trends for multiple activities over time (one line per activity)
- **Stacked bar charts:** Compare the composition of daily activity volumes
- **Heat maps:** Display activity intensity across dates and activity types in a calendar grid
- **Pivot tables:** Group by activity to see date-range totals, or by date to see activity distribution
- **Filtered views:** Focus on specific activities or date ranges of interest
**Note:** If an activity did not occur on a specific date, there will be no row for that activity-date combination in the output (the count will not appear as zero). Only actual occurrences are recorded. Events with missing timestamps or null activity names may be excluded or grouped together, depending on data quality.
---
*This documentation is part of the mindzie Studio process mining platform.*
---
## Daily Event Count
Section: Calculators
URL: https://docs.mindziestudio.com/mindzie_studio/calculators/daily-event-count
Source: /docs-master/mindzieStudio/calculators/daily-event-count/page.md
# Daily Event Count
## Overview
The Daily Event Count calculator analyzes event frequency patterns by grouping events by their date, providing daily event count distribution and percentage analysis. This calculator counts how many events occurred on each calendar day across your entire event log, making it useful for identifying data quality issues, workload patterns, and system activity trends.
Unlike case-level calculators, this operates at the event level, meaning it counts individual activities or transactions rather than complete process instances.
## Common Uses
- Identify data extraction gaps or missing days in your event log
- Detect unusual spikes or drops in system activity that may indicate data quality issues
- Analyze workload distribution across calendar days
- Understand weekend versus weekday activity patterns
- Identify seasonal trends and patterns in process execution
- Validate data completeness and consistency over time
## Settings
This calculator has no configurable settings. It automatically analyzes all events in your filtered dataset by grouping them by the date component of their timestamp.
**Standard Fields:**
- **Title:** Optional custom title for the calculator output
- **Description:** Optional description for documentation purposes
## Examples
### Example 1: Detecting Data Extraction Issues
**Scenario:** You're validating a new data extraction from your ERP system and want to ensure that events are being captured every business day without gaps.
**Settings:**
- Title: "Daily Event Distribution"
- Description: "Verify completeness of data extraction"
**Output:**
The calculator displays a table with three columns:
- **Date:** Each calendar day found in the event log
- **Count:** The number of events that occurred on that day
- **Percent:** The percentage of total events that occurred on that day (as a decimal)
Example output:
```
Date Count Percent
2024-01-15 1,247 0.0523
2024-01-16 1,189 0.0499
2024-01-17 42 0.0018
2024-01-18 1,312 0.0551
```
**Insights:** In this example, January 17th shows only 42 events compared to the typical 1,200+ events on surrounding days. This dramatic drop (less than 2% of normal volume) indicates a potential data extraction problem or system outage that should be investigated. Look for missing days (gaps in the date sequence) or days with unusually low counts that might indicate incomplete data.
### Example 2: Weekend vs Weekday Analysis
**Scenario:** You want to understand whether your invoice processing activities occur seven days a week or only on business days.
**Settings:**
- Title: "Invoice Processing Activity Calendar"
- Description: "Identify processing patterns across the week"
**Output:**
The daily distribution shows event counts for each day. When visualized as a chart, you can identify:
- Days with zero events (likely weekends and holidays)
- Consistent weekday patterns
- Monday spikes (common in many business processes)
- End-of-month peaks
**Insights:** If you see near-zero event counts on Saturdays and Sundays, your invoice processing is primarily a weekday activity. If you see activity seven days a week, you may have automated processing or international operations. Significant Monday spikes often indicate backlog processing from the weekend.
### Example 3: Identifying System Upgrade Impact
**Scenario:** Your IT department performed a system upgrade on March 15th, and you want to verify whether it impacted transaction processing volume.
**Settings:**
- Title: "March System Activity Analysis"
- Description: "Before and after upgrade comparison"
**Output:**
The calculator shows event counts for each day in March. You can compare the average daily count before March 15th with the average daily count after March 15th.
Example pattern:
```
Date Count Percent
2024-03-12 2,450 0.0334
2024-03-13 2,387 0.0325
2024-03-14 2,512 0.0342
2024-03-15 876 0.0119 <- Upgrade day
2024-03-16 2,398 0.0327
2024-03-17 2,441 0.0332
```
**Insights:** The significantly lower event count on March 15th (876 vs typical 2,400+) shows reduced system activity during the upgrade window. The return to normal volumes on March 16th indicates the system recovered successfully. If low counts continued for several days, it would suggest post-upgrade issues requiring investigation.
## Output
The calculator produces a data table with the following columns:
**Date (DateTime):** The calendar date (without time-of-day component) for each group. Results are ordered chronologically from earliest to latest date.
**Count (Number):** The total number of events that occurred on that specific date. This counts all activities/events in your event log for that day.
**Percent (Decimal):** The percentage of total events represented by that date, shown as a decimal value (for example, 0.15 represents 15% of all events).
The output can be visualized as:
- **Line charts:** Ideal for showing daily trends over time
- **Bar charts:** Effective for comparing activity levels across specific date ranges
- **Calendar heat maps:** Visual representation of activity intensity by date
- **Time series analysis:** For identifying trends and patterns over longer periods
**Note:** Events with missing or invalid timestamps are excluded from the analysis. Only events with valid date/time information are counted.
---
*This documentation is part of the mindzie Studio process mining platform.*
---
## Data Selector
Section: Calculators
URL: https://docs.mindziestudio.com/mindzie_studio/calculators/data-selector
Source: /docs-master/mindzieStudio/calculators/data-selector/page.md
# Data Selector
## Overview
The Data Selector calculator is a data post-processing tool that selects specific columns from another calculator's output and optionally sorts and limits the results. This calculator is essential for creating focused data views by choosing relevant columns, ordering the data, and displaying only the top N rows.
Unlike most calculators that analyze process data directly, Data Selector works with the output tables from other calculators, making it ideal for refining analysis results for dashboards, reports, and exports.
## Common Uses
- Prepare specific data subsets for email delivery or export to stakeholders
- Create simplified dashboard views showing only key metrics from complex analysis
- Select and sort top N results from large analysis outputs (e.g., top 10 slowest cases)
- Focus reports on relevant columns by removing unnecessary detail
- Transform comprehensive analysis results into executive-friendly summaries
- Create data pipelines by chaining multiple calculators and selecting specific outputs at each stage
## Settings
**Source Calculator:** Select the calculator block whose output you want to work with. This calculator must have already been executed in the current notebook.
**Source Table:** Choose which table to use if the source calculator produces multiple result tables. Most calculators produce a single table (index 0), but some calculators return multiple tables with different types of information.
**Columns to Include:** Select which columns from the source table should appear in the output. You can select multiple columns, and they will appear in the order you specify. Column names must match exactly as they appear in the source calculator output.
**Sort Column:** Optionally choose a column to sort the results by. If you don't specify a sort column, the data will maintain the same order as the source calculator output.
**Sort Direction:** When sorting is enabled, choose whether to sort in:
- **Ascending order:** Lowest to highest (A-Z, 0-9, oldest to newest)
- **Descending order:** Highest to lowest (Z-A, 9-0, newest to oldest)
**Maximum Rows:** Specify the maximum number of rows to include in the output. Set to 0 or leave blank for no limit. When combined with sorting, this allows you to select "top N" results (e.g., top 20 slowest cases when sorted by duration descending).
## Examples
### Example 1: Top 10 Slowest Purchase Orders for Executive Report
**Scenario:** Your Case Duration calculator has analyzed 2,500 purchase orders, but you want to create an executive dashboard showing only the 10 slowest cases for immediate attention.
**Settings:**
- Source Calculator: "Purchase Order Duration Analysis"
- Source Table: 0 (primary results table)
- Columns to Include: ["Case ID", "Supplier Name", "Duration", "Total Value"]
- Sort Column: Duration
- Sort Direction: Descending
- Maximum Rows: 10
**Output:**
The calculator displays a focused table with exactly 4 columns and 10 rows:
| Case ID | Supplier Name | Duration | Total Value |
|---------|--------------|----------|-------------|
| PO-2024-8821 | Acme Manufacturing | 47.3 days | $125,400 |
| PO-2024-9156 | Global Supplies Inc | 42.8 days | $89,200 |
| PO-2024-7633 | TechParts Ltd | 38.5 days | $156,800 |
| ... | ... | ... | ... |
**Insights:** By selecting only the essential columns and limiting to 10 rows, you've created an actionable dashboard that highlights problematic cases without overwhelming executives with 2,500 rows of data. The sorting by duration ensures the most urgent cases appear first. The inclusion of Total Value shows the financial impact of these delays.
### Example 2: Weekly Activity Summary for Email Distribution
**Scenario:** You run a weekly activity frequency analysis that generates detailed statistics for 45 different activities. You want to email the process owner just the top 15 most frequent activities with simplified metrics.
**Settings:**
- Source Calculator: "Weekly Activity Frequency Report"
- Source Table: 0
- Columns to Include: ["Activity Name", "Event Count", "Percentage of Total Events"]
- Sort Column: Event Count
- Sort Direction: Descending
- Maximum Rows: 15
**Output:**
A clean, focused table perfect for email:
| Activity Name | Event Count | Percentage of Total Events |
|--------------|-------------|---------------------------|
| Create Purchase Requisition | 1,847 | 18.2% |
| Manager Approval | 1,823 | 17.9% |
| Vendor Selection | 1,792 | 17.6% |
| ... | ... | ... |
**Insights:** This simplified view removes columns like "First Occurrence" and "Last Occurrence" that clutter the email, while keeping the essential metrics that show which activities dominate the process. The recipient immediately sees that the top 3 activities account for over half of all process events.
### Example 3: Customer Analysis Dashboard Simplification
**Scenario:** Your Breakdown by Categories calculator analyzed customers across 12 different metrics, but your dashboard widget only has space to show 5 columns for the top 20 customers.
**Settings:**
- Source Calculator: "Customer Performance Analysis"
- Source Table: 0
- Columns to Include: ["Customer Name", "Case Count", "Average Duration", "Total Revenue", "On-Time Percentage"]
- Sort Column: Total Revenue
- Sort Direction: Descending
- Maximum Rows: 20
**Output:**
Dashboard-ready table with focused metrics:
| Customer Name | Case Count | Average Duration | Total Revenue | On-Time Percentage |
|--------------|-----------|------------------|---------------|-------------------|
| MegaCorp Industries | 487 | 8.2 days | $4,850,000 | 92% |
| TechStart Solutions | 356 | 7.5 days | $3,240,000 | 95% |
| Global Systems Inc | 298 | 9.1 days | $2,870,000 | 88% |
| ... | ... | ... | ... | ... |
**Insights:** You've transformed a comprehensive 12-column analysis into a dashboard-friendly 5-column view showing exactly what stakeholders need to know: which customers generate the most revenue, how many orders they place, how long processing takes, and their delivery performance. Sorting by revenue ensures the most important customers are visible at a glance.
### Example 4: Variant Analysis - Top Variants by Frequency
**Scenario:** Your variant analysis identified 284 unique process variants. You want to focus your improvement efforts on the top 25 most common variants, which typically represent 80% of your case volume.
**Settings:**
- Source Calculator: "Process Variant Analysis"
- Source Table: 0
- Columns to Include: ["Variant ID", "Frequency", "Cumulative Percentage", "Average Duration", "Contains Rework"]
- Sort Column: Frequency
- Sort Direction: Descending
- Maximum Rows: 25
**Output:**
| Variant ID | Frequency | Cumulative Percentage | Average Duration | Contains Rework |
|-----------|-----------|---------------------|-----------------|----------------|
| VAR-001 | 1,245 | 24.8% | 6.2 days | No |
| VAR-002 | 876 | 42.2% | 8.5 days | Yes |
| VAR-003 | 623 | 54.6% | 5.8 days | No |
| ... | ... | ... | ... | ... |
**Insights:** The top 25 variants represent the core of your process, and the cumulative percentage column shows that focusing on these variants covers the majority of cases. The "Contains Rework" column immediately flags which common variants include inefficient rework steps, helping prioritize improvement opportunities.
### Example 5: Date Range Analysis for Trending
**Scenario:** Your rate-over-time calculator generated daily statistics for 90 days, but you want to display just the key metrics in chronological order without any row limits for a complete trend analysis.
**Settings:**
- Source Calculator: "90-Day Completion Rate Analysis"
- Source Table: 0
- Columns to Include: ["Date", "Cases Completed", "Completion Rate"]
- Sort Column: Date
- Sort Direction: Ascending
- Maximum Rows: 0 (no limit)
**Output:**
All 90 rows displayed in chronological order:
| Date | Cases Completed | Completion Rate |
|------|----------------|----------------|
| 2024-10-01 | 23 | 87.4% |
| 2024-10-02 | 28 | 91.2% |
| 2024-10-03 | 31 | 89.7% |
| ... | ... | ... |
**Insights:** By sorting by date ascending and not limiting rows, you maintain the complete time series for charting or export. You've simplified the output by removing statistical columns (like "Standard Deviation" and "Min/Max") that aren't needed for basic trend visualization, making the data cleaner for graphing tools.
### Example 6: Multi-Table Source Selection
**Scenario:** Your conformance checker returns two tables: table 0 contains summary statistics, and table 1 contains detailed violation listings. You want to create a report from the detailed violations table.
**Settings:**
- Source Calculator: "Standard Process Conformance Check"
- Source Table: 1 (detail table, not summary)
- Columns to Include: ["Case ID", "Violation Type", "Activity Name", "Timestamp"]
- Sort Column: Violation Type
- Sort Direction: Ascending
- Maximum Rows: 100
**Output:**
| Case ID | Violation Type | Activity Name | Timestamp |
|---------|----------------|---------------|-----------|
| CS-1234 | Missing Required Step | Invoice Approval | 2024-11-15 14:22 |
| CS-5678 | Missing Required Step | Purchase Approval | 2024-11-16 09:15 |
| CS-9012 | Out of Sequence | Goods Receipt | 2024-11-16 11:45 |
| ... | ... | ... | ... |
**Insights:** By selecting table 1 instead of the default table 0, you access the detailed violation data rather than just summary counts. Sorting by violation type groups similar problems together, making it easier to identify patterns. The 100-row limit ensures the report remains manageable while covering the most important violations.
## Output
The Data Selector calculator displays a table with the exact columns you specified, in the order you selected them. The table structure is dynamic and depends on your column selections.
### Output Characteristics
**Column Structure:** Only the columns you selected from "Columns to Include" appear in the output. Column names, data types, and formatting are preserved from the source calculator.
**Row Count:** Determined by the Maximum Rows setting:
- If Maximum Rows = 0 or blank: All rows from the source table
- If Maximum Rows > 0: Up to that many rows (may be fewer if source has fewer rows)
**Row Order:** Determined by sorting settings:
- If no sort column specified: Maintains the same order as the source calculator
- If sort column specified: Rows are ordered according to the sort column and direction
### Interactive Features
**Click on rows:** In many cases, clicking on a row will drill down to show the underlying cases or details, just as you could in the source calculator.
**Export capabilities:** The refined output can be exported to Excel or CSV files, making it ideal for sharing with stakeholders who don't have access to the mindzie platform.
**Email integration:** This calculator's output is commonly used with automated email delivery to send focused data subsets to process owners and executives on a scheduled basis.
**Dashboard widgets:** The simplified, focused output is perfect for embedding in dashboard widgets where space is limited.
### Usage Tips
- Always ensure the source calculator has executed successfully before running Data Selector
- Use the preview feature in the calculator configuration to see available columns from your source
- Column names are case-sensitive - they must match exactly as they appear in the source
- When combining sorting with row limits, sorting is applied first, then the row limit (enabling "top N" selections)
- If the source calculator has no results or an error, Data Selector will produce an empty table
- Multiple Data Selector calculators can be used in sequence to progressively refine data
### Common Patterns
**Dashboard Pattern:** Complex calculator -> Data Selector (select key columns, top N rows) -> Dashboard widget
**Email Pattern:** Analysis calculator -> Data Selector (focus on actionable data) -> Automated email delivery
**Export Pattern:** Comprehensive analysis -> Data Selector (simplify for external stakeholders) -> Excel export
**Pipeline Pattern:** Calculator A -> Data Selector 1 (refine) -> Calculator B (further analysis) -> Data Selector 2 (final output)
The Data Selector is particularly valuable when you need to present analysis results to stakeholders who need focused, actionable information rather than comprehensive analytical detail. It bridges the gap between detailed process mining analysis and clear, decision-ready reporting.
---
*This documentation is part of the mindzie Studio process mining platform.*
---
## Decision Tree
Section: Calculators
URL: https://docs.mindziestudio.com/mindzie_studio/calculators/decision-tree
Source: /docs-master/mindzieStudio/calculators/decision-tree/page.md
# Decision Tree
## Overview
The Decision Tree calculator uses AI-driven statistical analysis to identify root causes of specific process behaviors. This powerful calculator compares cases with a target outcome against all cases to discover which attribute values most strongly correlate with that outcome. It automatically calculates risk ratios, likelihood scores, and fraction explained metrics to rank potential root causes by their explanatory power.
This is an AI-powered calculator that requires defining an outcome through filters, then automatically analyzes your data to discover what drives that behavior.
## Common Uses
- Identify factors contributing to late payments
- Understand root causes of rework and repeated activities
- Discover what leads to case escalations
- Analyze patterns that cause compliance violations
- Find out what drives extended case durations
- Investigate quality issues and their contributing factors
- Understand customer complaint patterns
## Settings
### Outcome Definition
**Number of Filters:** The number of pre-existing filters that define your target outcome. When set to 0, use the Filter List below to define the outcome.
**Filter List:** When Number of Filters is 0, define filters that select cases exhibiting the behavior you want to analyze. For example, create a filter for "Cases with Rework" or "Cases taking longer than 30 days".
### Input Configuration
**Input Column Names:** Manually specify which case attributes to analyze as potential root causes.
**Auto Input:** When enabled, automatically selects appropriate columns for analysis based on data types and cardinality.
### Analysis Thresholds
**Minimum Percent:** The minimum fraction of cases that must have an attribute value for it to be considered (default: 0.1% of cases).
**Minimum Case Count:** The minimum number of cases required for an attribute value to be considered (default: 3 cases).
**Likelihood Increase Threshold:** The minimum risk ratio required for a root cause to be reported (default: 1.01, meaning 1% increased likelihood).
**Percent Explained Threshold:** The minimum fraction of outcome cases that must have the attribute value (default: 1%).
**Maximum Root Causes:** The maximum number of root causes to return (default: 20).
## Example
### Finding Causes of Payment Delays
**Scenario:** You want to understand why some invoices are paid late while others are paid on time.
**Setup:**
1. Create a filter defining "late payments" (e.g., Payment Date > Due Date)
2. Set the Decision Tree calculator to use this filter as the outcome
3. Select attributes to analyze: Vendor, Department, Invoice Amount, Payment Terms
4. Run the analysis
**Output:**
The calculator generates results showing:
| Attribute | Value | Cases with Value | Outcome Likelihood | Risk Ratio | Fraction Explained |
|-----------|-------|------------------|-------------------|------------|-------------------|
| Vendor Category | International | 15% of all cases | 45% are late | 3.2x | 35% of late payments |
| Invoice Amount | > $50,000 | 8% of all cases | 38% are late | 2.7x | 18% of late payments |
| Department | Procurement B | 12% of all cases | 32% are late | 2.3x | 22% of late payments |
**Interpretation:**
- **International vendors** are 3.2x more likely to have late payments than the baseline
- **35% of all late payments** involve international vendors
- High-value invoices and a specific department also show elevated risk
**Insights:** The analysis reveals that international vendors, especially for high-value invoices, need different payment processes. The decision tree helps prioritize which process improvements will have the biggest impact.
## Understanding the Metrics
### Risk Ratio (Likelihood Increase)
The Risk Ratio compares the probability of the outcome when an attribute value is present versus absent:
```
Risk Ratio = P(Outcome | Value Present) / P(Outcome | Value Absent)
```
- Risk Ratio = 1.0: The attribute value has no effect
- Risk Ratio = 2.0: Cases with this value are 2x more likely to have the outcome
- Risk Ratio = 0.5: Cases with this value are 50% less likely to have the outcome
### Fraction Explained
The Fraction Explained shows what percentage of outcome cases have the attribute value:
```
Fraction Explained = (Cases with Outcome AND Value) / (Total Cases with Outcome)
```
This helps prioritize: a root cause with high risk ratio but low fraction explained only affects a small portion of your problem cases.
### Priority Ranking
Root causes are ranked as High, Medium, or Low priority based on a combination of:
- Likelihood increase (risk ratio)
- Fraction of outcome explained
- Statistical significance (case volume)
## Display Modes
### Sentence View
Displays human-readable explanations of each root cause:
*"Cases where Vendor Category = International are 3.2 times more likely to be late payments. This attribute explains 35% of all late payments."*
### Statistics Grid
Shows all calculated metrics in a sortable table for detailed analysis.
### Outcome Likelihood View
Focuses on attribute values with the highest risk ratios - what most dramatically increases the chance of the outcome.
### Outcome Value View
Focuses on attribute values that affect the most cases - where improvements would have the broadest impact.
## How It Works
1. **Frequency Calculation:** Counts occurrences of each attribute value across all cases and outcome cases
2. **Likelihood Comparison:** For each value, calculates the outcome probability when present vs absent
3. **Risk Ratio:** Computes the ratio of these probabilities
4. **Fraction Explained:** Calculates what portion of outcome cases have each value
5. **Threshold Filtering:** Removes results below configured thresholds
6. **Ranking:** Sorts by explanatory power (combination of risk ratio and fraction explained)
## Best Practices
### Defining Good Outcomes
- Be specific: "Payments more than 7 days late" is better than "Late payments"
- Ensure sufficient case volume: Need enough outcome cases for statistical validity
- Test different definitions to see if root causes change
### Selecting Input Columns
- Include categorical attributes (vendor, department, status)
- Include discretized numeric attributes (amount ranges, duration categories)
- Exclude columns with too many unique values (IDs, free text)
- Start with auto-selection, then refine based on results
### Interpreting Results
- Look for high risk ratio AND high fraction explained together
- Consider business context: is the identified root cause actionable?
- Validate findings with process experts before acting
- Use drill-down to examine underlying cases
## Output
The calculator provides multiple output formats:
- **Decision Tree Table:** All root causes ranked by explanatory power
- **Outcome Likelihood Table:** Highest risk ratio values with case drill-down
- **Outcome Value Table:** Most impactful values by case count with drill-down
- **Chat Text:** Human-readable summary for presentations
Interactive features:
- Click on rows to see underlying cases
- Sort by different metrics
- Export findings for further analysis
- Create recommendations from identified root causes
---
*This documentation is part of the mindzie Studio process mining platform.*
---
## Dataset Information
Section: Calculators
URL: https://docs.mindziestudio.com/mindzie_studio/calculators/dataset-information
Source: /docs-master/mindzieStudio/calculators/dataset-information/page.md
# Dataset Information
## Overview
The Dataset Information calculator provides a comprehensive statistical summary of your entire process dataset. It displays key metrics including time ranges, case and event counts, activity statistics, and data structure information in a single, easy-to-read overview.
This calculator requires no configuration and is ideal for quickly understanding the scope and characteristics of your process data.
## Common Uses
- Understand the scope of a new dataset before beginning analysis
- Validate that data extraction captured the expected volume and time range
- Compare datasets by reviewing their statistical profiles side-by-side
- Monitor process volume trends by tracking case and event counts over time
- Verify data quality by checking case duration ranges and event distributions
- Generate dataset metadata for reports and presentations
## Settings
There are no specific settings for this calculator beyond the standard title and description fields. The calculator automatically analyzes the entire dataset and displays all available metrics.
## Examples
### Example 1: Initial Process Discovery
**Scenario:** You have just imported a new purchase-to-pay dataset and want to understand its characteristics before starting your analysis.
**Settings:**
- Title: "Purchase-to-Pay Dataset Overview"
- Description: "Q4 2024 procurement data"
**Output:**
The calculator displays a comprehensive table with the following metrics:
- Start Dataset Time: 2024-10-01 00:00:00
- End Dataset Time: 2024-12-31 23:59:59
- Dataset Timespan: 92 days
- Min Case Time: 2 hours
- Max Case Time: 45 days
- Average Case Time: 8.5 days
- Median Case Time: 6.2 days
- Total Case Count: 1,847
- Total Activity Count: 14,776
- Average activities per case: 8.0
- Activities: 23 unique activities
- Case Columns: 15 attributes
- Activity Columns: 12 attributes
**Insights:** This dataset covers a full quarter with nearly 1,900 purchase orders. The average case duration of 8.5 days is reasonable for a procurement process, though some cases take up to 45 days, suggesting potential delays worth investigating. With an average of 8 activities per case across 23 unique activities, the process shows moderate complexity with some variation in execution paths.
### Example 2: Comparing Filtered vs. Unfiltered Data
**Scenario:** You want to understand how applying a time filter affects your dataset characteristics.
**Settings:**
- Create two Dataset Information calculators:
- "Full Dataset Overview" (no filters)
- "Last 30 Days Overview" (with time period filter)
**Output:**
Full Dataset:
- Total Case Count: 1,847
- Dataset Timespan: 92 days
- Average Case Time: 8.5 days
Last 30 Days:
- Total Case Count: 623
- Dataset Timespan: 30 days
- Average Case Time: 9.2 days
**Insights:** The filtered view shows that about one-third of cases fall within the most recent month. Interestingly, the average case duration increased from 8.5 to 9.2 days in the most recent period, suggesting process performance may be declining and warranting further investigation.
### Example 3: Data Quality Validation
**Scenario:** After completing a data extraction, you need to verify that all expected data was captured correctly.
**Settings:**
- Title: "Data Quality Check"
- Description: "Validation of January 2025 extraction"
**Output:**
- Start Dataset Time: 2025-01-01 00:00:00
- End Dataset Time: 2025-01-31 23:59:59
- Total Case Count: 412
- Total Activity Count: 3,296
- Activities: 18 unique activities
**Insights:** The dataset correctly spans the entire month of January 2025 as expected. The case count of 412 aligns with the expected monthly volume. All 18 standard activities are present in the data, confirming that the extraction captured all activity types. The average of 8 activities per case is consistent with historical patterns.
### Example 4: Performance Baseline Documentation
**Scenario:** You need to document baseline metrics for your process before implementing improvement initiatives.
**Settings:**
- Title: "Pre-Improvement Baseline Metrics"
- Description: "Invoice processing baseline - January 2025"
**Output:**
- Total Case Count: 2,156
- Average Case Time: 12.3 days
- Median Case Time: 9.5 days
- Min Case Time: 4 hours
- Max Case Time: 67 days
- Average activities per case: 11.2
**Insights:** Current invoice processing averages 12.3 days with significant variation (4 hours to 67 days). The gap between average (12.3 days) and median (9.5 days) suggests that a subset of invoices with very long processing times is pulling up the average. These metrics establish a clear baseline for measuring improvement after implementing process changes.
## Output
The Dataset Information calculator displays a single table with two columns:
**Name:** The name of each metric
**Value:** The corresponding value for that metric
### Metrics Included
**Time Metrics:**
- Start Dataset Time: The timestamp of the earliest event in the dataset
- End Dataset Time: The timestamp of the latest event in the dataset
- Dataset Timespan: The total time period covered by the dataset
**Case Duration Metrics:**
- Min Case Time: The shortest case duration in the dataset
- Max Case Time: The longest case duration in the dataset
- Average Case Time: The mean duration across all cases
- Median Case Time: The median (middle value) case duration
**Volume Metrics:**
- Total Case Count: The number of unique cases in the dataset
- Total Activity Count: The total number of events across all cases
- Average activities per case: The mean number of events per case
**Structure Metrics:**
- Activities: The number of unique activity types in the process
- Case Columns: The number of attributes at the case level
- Activity Columns: The number of attributes at the event level
All time values are displayed in a readable format (e.g., "8.5 days" or "2 hours 30 minutes"). The output can be added to dashboards for ongoing monitoring or exported for documentation purposes.
---
*This documentation is part of the mindzie Studio process mining platform.*
---
## Days Of Sales Outstanding DPO
Section: Calculators
URL: https://docs.mindziestudio.com/mindzie_studio/calculators/days-of-sales-outstanding-dpo
Source: /docs-master/mindzieStudio/calculators/days-of-sales-outstanding-dpo/page.md
# Days Of Sales Outstanding / Days Of Payment Outstanding
## Overview
The Days Of Sales Outstanding (DSO) / Days Of Payment Outstanding (DPO) calculator measures how many days of sales or purchases are represented by current outstanding invoices. This critical financial metric helps organizations monitor working capital efficiency, cash flow health, and collection or payment performance.
For Accounts Receivable processes, DSO indicates how quickly your organization converts credit sales to cash. For Accounts Payable processes, DPO shows how long your organization takes to pay suppliers. Both metrics are essential components of the cash conversion cycle and working capital management.
## Common Uses
- Monitor accounts receivable collection efficiency and identify deteriorating trends
- Track accounts payable payment timing and optimize cash retention
- Analyze working capital health and identify cash flow improvement opportunities
- Compare performance against payment terms and industry benchmarks
- Support credit policy decisions with data-driven insights
- Forecast cash flow by understanding typical collection or payment cycles
## Settings
**Date Filter:** Specify the time period used to calculate average daily sales or purchases. The start date of this filter establishes the beginning of the period used to calculate the daily rate. The calculator uses the date range from the start date to your dataset's current date to determine average activity per day.
**Is Invoice Outstanding Attribute:** Select the boolean attribute that indicates whether an invoice is currently outstanding (unpaid). The attribute should contain true for outstanding invoices and false for paid invoices. The calculator sums values for all invoices marked as outstanding.
**Value Attribute:** Select the numeric attribute containing the invoice amount or value. This attribute must contain numeric data and will be used to calculate both outstanding totals and period totals.
## Examples
### Example 1: Monitoring Accounts Receivable Performance
**Scenario:** Your finance team wants to monitor how efficiently the organization is collecting payments from customers. They need to track DSO monthly to identify trends and compare against the standard 30-day payment terms.
**Settings:**
- Date Filter: Last 90 days (to establish a stable baseline)
- Is Invoice Outstanding Attribute: Is Outstanding
- Value Attribute: Invoice Amount
**Output:** 42.5 days
**Insights:**
This DSO of 42.5 days reveals that your organization has approximately 42.5 days worth of sales tied up in outstanding invoices. Since your payment terms are 30 days, this indicates:
- **Collection lag:** Customers are paying an average of 12.5 days beyond terms
- **Working capital impact:** More cash is tied up in receivables than optimal
- **Potential issues:** May indicate collection process inefficiencies or customer payment difficulties
**Actions to consider:**
- Review aging analysis to identify which customers are paying late
- Strengthen collection processes for invoices approaching or exceeding terms
- Consider offering early payment discounts to improve cash flow
- Investigate if specific customer segments or regions have longer collection times
### Example 2: Optimizing Accounts Payable Timing
**Scenario:** Your procurement team wants to understand current payment timing and evaluate opportunities to improve cash retention without damaging supplier relationships.
**Settings:**
- Date Filter: Last 60 days
- Is Invoice Outstanding Attribute: Not Yet Paid
- Value Attribute: Total Amount
**Output:** 35.2 days
**Insights:**
This DPO of 35.2 days shows that your organization currently holds onto cash for approximately 35 days before paying suppliers. If typical payment terms are 45 days, this reveals:
- **Early payment:** Paying an average of 10 days before terms are due
- **Working capital opportunity:** Could retain cash longer without violating terms
- **Relationship strength:** May be building goodwill by paying early
**Strategic considerations:**
- Evaluate if early payment discounts justify the current timing
- Consider extending payment timing closer to terms to improve working capital
- Assess which suppliers offer early payment discounts worth taking
- Balance cash retention with maintaining strong supplier relationships
### Example 3: Comparing DSO Trends Over Time
**Scenario:** Your CFO wants to understand whether collection performance is improving or deteriorating by comparing DSO across different time periods.
**Settings for Current Quarter:**
- Date Filter: Last 90 days
- Is Invoice Outstanding Attribute: Outstanding
- Value Attribute: Invoice Value
**Output:** 38.7 days
**Settings for Previous Quarter:**
- Date Filter: 90 days ending 90 days ago
- Is Invoice Outstanding Attribute: Outstanding
- Value Attribute: Invoice Value
**Output:** 33.2 days
**Insights:**
The increase from 33.2 days to 38.7 days represents a 16.6% deterioration in collection performance. This trend suggests:
- **Weakening collections:** Taking longer to convert sales to cash
- **Cash flow pressure:** More working capital tied up in receivables
- **Potential causes:** Economic conditions, process changes, customer mix shifts, or seasonal effects
**Recommended analysis:**
- Drill down by customer segment to identify where deterioration is occurring
- Review process changes that may have impacted collection timing
- Examine economic indicators that might affect customer payment behavior
- Set up monthly DSO monitoring to catch trends early
### Example 4: Cash Flow Forecasting with DSO
**Scenario:** Your finance team is building a cash flow forecast and needs to estimate when current outstanding receivables will convert to cash.
**Settings:**
- Date Filter: Last 30 days
- Is Invoice Outstanding Attribute: Is Outstanding
- Value Attribute: Amount
**Output:** 28.5 days
**Insights:**
With a DSO of 28.5 days and current outstanding receivables of $2.5 million (from Sum of Values calculator), you can estimate:
- **Daily collection rate:** $2,500,000 / 28.5 = approximately $87,719 per day
- **Cash flow timing:** Expect most outstanding receivables to convert within 30 days
- **Forecast accuracy:** Historical DSO provides baseline for predicting future collections
This insight helps finance:
- Build more accurate short-term cash flow forecasts
- Plan for adequate liquidity to meet obligations
- Time major expenditures based on expected cash inflows
- Set realistic collection targets for the team
## Output
The calculator returns a single numeric value representing the number of days of sales (DSO) or purchases (DPO) that are currently outstanding.
**Interpreting DSO (Accounts Receivable):**
- Lower values indicate faster collection and better cash flow
- Values near payment terms suggest collecting according to terms
- Values significantly above terms indicate collection issues
- Industry benchmarks typically range from 30-60 days
**Interpreting DPO (Accounts Payable):**
- Higher values indicate retaining cash longer
- Values near payment terms suggest paying on time
- Very low values may indicate missing early payment discounts
- Very high values may damage supplier relationships
**Best Practices:**
- Monitor trends over time rather than focusing on single values
- Compare against payment terms to assess compliance
- Consider seasonal variations in business cycles
- Benchmark against industry standards for context
- Use consistent time periods for trend analysis
---
*This documentation is part of the mindzie Studio process mining platform.*
---
## Duplicate Cases
Section: Calculators
URL: https://docs.mindziestudio.com/mindzie_studio/calculators/duplicate-cases
Source: /docs-master/mindzieStudio/calculators/duplicate-cases/page.md
# Duplicate Cases
## Overview
The Duplicate Cases calculator identifies cases with identical values across selected attributes. This powerful data quality tool helps you find duplicate entries, system errors, and data integrity issues in your process data.
## Common Uses
- Find cases that have been entered more than once
- Identify cases duplicated due to system errors
- Detect potential double-payment scenarios
- Find duplicate orders or invoices
- Validate data migration integrity
## Settings
**Column Names:** Select the list of attributes that will be used to identify duplicate cases. Cases with identical values for all selected attributes will be flagged as duplicates.
**Max Rows:** Specify the maximum number of rows to display in the output.
## Example
### Identifying Potentially Duplicate Invoices
**Scenario:** You want to identify invoices that may have been entered multiple times with the same vendor, amount, and date.
**Settings:**
- Column Names: Vendor Name, Invoice Amount, Invoice Date
- Max Rows: 100
**Output:**
The calculator displays two view options:
1. **Duplicate Cases View (default):**
- Shows one row per unique combination of the selected attributes
- The last column displays the count of cases matching that combination
- Entries with a count greater than 1 are potential duplicates
2. **Expanded View (select from top-right dropdown):**
- Shows all individual cases grouped by matching attribute values
- Displays additional attributes not specified in settings
- Reveals that cases in the same group may differ in other attributes (e.g., different Invoice IDs despite matching amounts)
**Insights:**
The expanded view is particularly useful because it shows that cases grouped as "duplicates" based on your selected attributes might actually be legitimate separate cases with different values in other columns. For example:
- Same vendor, amount, and date might be two different invoices (check Invoice ID)
- Legitimate duplicate payments vs. data entry errors
- System-generated duplicate records vs. actual business duplicates
This helps you distinguish between true duplicates requiring correction and similar cases that are legitimately separate.
---
*This documentation is part of the mindzie Studio process mining platform.*
---
## Duration Case Above Threshold Grouped By Attribute
Section: Calculators
URL: https://docs.mindziestudio.com/mindzie_studio/calculators/duration-case-above-threshold-grouped-by-attribute
Source: /docs-master/mindzieStudio/calculators/duration-case-above-threshold-grouped-by-attribute/page.md
# Duration - Case above threshold grouped by attribute
## Overview
The Duration - Case above threshold grouped by attribute calculator identifies and analyzes cases that exceed a specified duration threshold, with results grouped by a categorical attribute. This calculator helps you understand which categories of cases are experiencing delays and measure the extent of those delays beyond acceptable timeframes.
Unlike the basic Case Duration calculator that shows overall duration statistics, this calculator focuses specifically on problematic cases that breach your performance thresholds, allowing you to segment the analysis by business-relevant categories such as customer, product type, region, or resource.
## Common Uses
- Identify which customers or vendors have the most cases exceeding SLA targets
- Analyze delayed orders by product category to find systematic issues
- Measure the extent of delays by regional office or processing center
- Compare SLA breach rates across different case types or priority levels
- Track improvement initiatives by monitoring threshold breaches in specific categories over time
- Identify resource or team performance issues by grouping delayed cases by assigned resource
## Settings
**Duration Threshold:** Specify the maximum acceptable case duration. Cases exceeding this threshold will be included in the analysis. Enter the threshold in the appropriate time unit (hours, days, weeks, etc.).
**Grouping Attribute:** Select the categorical attribute to group the results by. This allows you to see which categories have the most cases exceeding the threshold. Common choices include Customer, Vendor, Product Type, Region, Resource, or any custom case attribute.
**Statistics to Display:** Choose which metrics to calculate for each category:
| Statistic | Description |
|-----------|-------------|
| Count | Number of cases exceeding the threshold in each category |
| Average Excess Duration | Mean amount of time cases exceed the threshold |
| Total Excess Duration | Sum of all excess durations for cases in the category |
| Maximum Excess Duration | Largest duration breach in the category |
| Percentage of Total | Proportion of all threshold-breaching cases in each category |
**Maximum Categories to Display:** Limit the output to show only the top N categories with the most threshold breaches. This helps focus on the most problematic areas.
**Sort Order:** Choose whether to sort categories by:
- Count (most frequent threshold breaches first)
- Average excess duration (longest average delays first)
- Total excess duration (greatest cumulative delay first)
## Examples
### Example 1: Identifying Customers with Chronic Order Delays
**Scenario:** Your company has an SLA requiring order completion within 5 days. You want to identify which customers are experiencing the most delayed orders and understand the severity of these delays.
**Settings:**
- Duration Threshold: 5 days
- Grouping Attribute: Customer Name
- Statistics to Display: Count, Average Excess Duration, Total Excess Duration
- Maximum Categories to Display: 20
- Sort Order: Count (descending)
**Output:**
The calculator displays a table showing your top 20 customers by number of delayed orders:
| Customer | Cases Over Threshold | Avg Excess Duration | Total Excess Duration |
|----------|---------------------|---------------------|----------------------|
| Acme Corp | 47 cases | 3.2 days | 150.4 days |
| Global Industries | 38 cases | 2.1 days | 79.8 days |
| TechStart Inc | 31 cases | 5.7 days | 176.7 days |
**Insights:** While Acme Corp has the most delayed orders (47), TechStart Inc actually has more severe delays averaging 5.7 days beyond the threshold. This suggests different root causes - Acme may have volume or priority issues, while TechStart may have complex requirements or processing problems. The total excess duration helps quantify the cumulative impact on customer experience.
### Example 2: Regional Performance Analysis for Invoice Processing
**Scenario:** Your accounts payable process operates across four regional processing centers. You've set a 10-day target for invoice processing, and management wants to understand which regions are struggling most with timely processing.
**Settings:**
- Duration Threshold: 10 days
- Grouping Attribute: Processing Region
- Statistics to Display: Count, Average Excess Duration, Percentage of Total, Maximum Excess Duration
- Maximum Categories to Display: 10
- Sort Order: Average Excess Duration (descending)
**Output:**
| Region | Cases Over Threshold | Avg Excess | % of Total Breaches | Max Excess |
|--------|---------------------|------------|---------------------|------------|
| APAC | 127 cases | 8.4 days | 35% | 45 days |
| EMEA | 89 cases | 6.2 days | 24% | 38 days |
| Americas East | 78 cases | 4.1 days | 21% | 29 days |
| Americas West | 71 cases | 3.8 days | 20% | 22 days |
**Insights:** The APAC region shows both the highest volume of delayed invoices and the longest average delays (8.4 days beyond the 10-day threshold). This accounts for 35% of all delayed invoices company-wide. The maximum excess of 45 days suggests serious outliers that need immediate attention. This analysis indicates APAC may need additional resources, process improvements, or investigation into systemic issues.
### Example 3: Product Type Analysis for Manufacturing Lead Times
**Scenario:** Your manufacturing facility produces multiple product types with a standard 14-day production lead time. You want to identify which product types consistently exceed this target and by how much.
**Settings:**
- Duration Threshold: 14 days
- Grouping Attribute: Product Type
- Statistics to Display: Count, Average Excess Duration, Total Excess Duration
- Maximum Categories to Display: 15
- Sort Order: Total Excess Duration (descending)
**Output:**
| Product Type | Cases Over Threshold | Avg Excess | Total Excess |
|--------------|---------------------|------------|--------------|
| Custom Assembly A | 23 cases | 12.3 days | 282.9 days |
| Standard Widget B | 64 cases | 3.1 days | 198.4 days |
| Premium Unit C | 18 cases | 9.7 days | 174.6 days |
**Insights:** While Standard Widget B has the most cases exceeding the threshold (64), Custom Assembly A has the most severe individual delays (averaging 12.3 days over target). The total excess duration metric reveals that Custom Assembly A represents the greatest cumulative production delay impact (282.9 days). This suggests that custom products may need revised time estimates, additional resources, or process redesign to meet customer expectations.
### Example 4: Resource Workload and Performance Analysis
**Scenario:** Your customer service team handles support cases with a 2-day resolution target. You want to identify which team members have the most cases exceeding this threshold and whether they're experiencing workload issues or performance challenges.
**Settings:**
- Duration Threshold: 2 days
- Grouping Attribute: Assigned Resource
- Statistics to Display: Count, Average Excess Duration, Maximum Excess Duration
- Maximum Categories to Display: 25
- Sort Order: Count (descending)
**Output:**
| Resource | Cases Over Threshold | Avg Excess | Max Excess |
|----------|---------------------|------------|------------|
| Sarah Chen | 34 cases | 1.8 days | 12 days |
| Mike Patel | 31 cases | 2.4 days | 18 days |
| Lisa Wong | 28 cases | 1.2 days | 6 days |
| John Smith | 12 cases | 8.7 days | 45 days |
**Insights:** Sarah Chen has the most delayed cases but relatively modest average delays (1.8 days), suggesting possible workload issues. John Smith has far fewer delayed cases (12) but much higher average delays (8.7 days) with an extreme outlier at 45 days - this pattern suggests individual performance issues or assignment of particularly complex cases. Lisa Wong shows the best performance among high-volume handlers with only 1.2 days average excess, making her a potential model for best practices.
## Output
The calculator provides results in a tabular format showing:
**Category Column:** The values of the selected grouping attribute (e.g., customer names, regions, product types).
**Statistical Columns:** One or more columns based on your selected statistics, showing metrics like count of delayed cases, average excess duration, total excess duration, and percentages.
**Visualization Options:** Results can be viewed as:
- Grid view (default) - Detailed tabular data with sorting capabilities
- Bar charts - Visual comparison of categories by selected metric
- Pie charts - Proportional view showing each category's contribution to total delays
**Interactive Features:**
- Click on any category to drill down into the specific cases that exceeded the threshold
- Sort by any column to reorder the analysis
- Export data for further analysis or reporting
---
*This documentation is part of the mindzie Studio process mining platform.*
---
## Event Count
Section: Calculators
URL: https://docs.mindziestudio.com/mindzie_studio/calculators/event-count
Source: /docs-master/mindzieStudio/calculators/event-count/page.md
# Event Count
## Overview
The Event Count calculator counts the total number of events (activities) in your event log. Unlike the Case Count calculator which counts process instances, this calculator shows the total volume of individual activities performed across all cases. This fundamental metric helps you understand process activity volume and execution intensity.
## Common Uses
- Display total activity volume across your process
- Calculate average events per case when combined with case count
- Monitor data extraction completeness by verifying expected event volumes
- Track workload intensity and processing activity levels
- Add event volume metrics to operational dashboards
- Validate data loads by comparing expected versus actual event counts
## Settings
There are no specific settings for this calculator beyond the standard title and description fields.
## Examples
### Example 1: Measuring Process Activity Volume
**Scenario:** You want to display the total number of activities performed in your procurement process to understand overall process activity.
**Settings:**
- Title: "Total Activities Processed"
- Description: "Total number of activities performed across all purchase orders"
**Output:**
The calculator shows a single number, such as "45,823", representing the total event count in your log.
**Insights:** This metric shows the total volume of work performed. When combined with case count, you can calculate the average number of activities per case to understand process complexity. For example, if you have 45,823 events and 5,247 cases, that's an average of 8.7 activities per purchase order.
### Example 2: Data Validation After Extraction
**Scenario:** After extracting data from your source system, you want to verify that all expected events were loaded correctly.
**Settings:**
- Title: "Event Count Validation"
- Description: "Verify complete data extraction"
**Output:**
The calculator displays "156,429" events.
**Insights:** You can compare this count against your source system's record count to ensure data completeness. If your source system shows 156,429 records and the calculator shows the same count, you've successfully loaded all events. Any discrepancy indicates data extraction issues that need investigation.
### Example 3: Calculating Process Intensity
**Scenario:** You want to understand how activity-intensive your process is by comparing event count to case count.
**Settings:**
- Add Event Count calculator with title "Total Events"
- Add Case Count calculator with title "Total Cases"
- Place both on the same dashboard
**Output:**
Event Count shows "89,456" and Case Count shows "12,134".
**Insights:** Dividing events by cases gives you 7.4 events per case on average. This metric helps you understand process complexity. A higher ratio indicates more complex processes with many steps, while a lower ratio suggests simpler, streamlined processes. You can filter by different time periods or process variants to see how this intensity metric changes.
## Output
The calculator displays a single numerical value representing the total count of events (activities) in the event log. This count includes all activity instances across all cases in the current filtered dataset.
---
*This documentation is part of the mindzie Studio process mining platform.*
---
## Extraction Time
Section: Calculators
URL: https://docs.mindziestudio.com/mindzie_studio/calculators/extraction-time
Source: /docs-master/mindzieStudio/calculators/extraction-time/page.md
# Extraction Time
## Overview
The Extraction Time calculator displays the date and time when your dataset was last successfully extracted from data sources. This essential metadata calculator helps you verify data freshness and ensures you're making decisions based on current information.
Unlike other calculators that analyze your process data, Extraction Time simply retrieves and displays a timestamp from the dataset's metadata. This timestamp is set automatically when data is imported or refreshed through your ETL pipeline.
## Common Uses
- **Verify data freshness:** Confirm how current your analysis data is before making business decisions
- **Dashboard timestamps:** Display "as of" dates on dashboards and reports to inform stakeholders
- **Data quality monitoring:** Identify stale datasets that need to be refreshed
- **Audit trails:** Track when data was loaded for compliance and troubleshooting purposes
- **User awareness:** Help analysts understand the recency of data they're working with
- **ETL pipeline monitoring:** Verify that scheduled data extractions are running successfully
## Settings
This calculator has no configuration settings. It automatically retrieves and displays the extraction timestamp from your dataset's metadata.
The only standard fields available are:
**Title:** Optional custom title for the calculator output (defaults to "Extraction Time")
**Description:** Optional description to provide context about this metric
## Examples
### Example 1: Dashboard Data Freshness Indicator
**Scenario:** Your operations team uses a process mining dashboard to monitor daily invoice processing. They need to know how current the data is to make informed decisions about workload allocation.
**Settings:**
- Title: "Data Last Updated"
- Description: "Timestamp of most recent data extraction from SAP"
**Output:**
The calculator displays a single timestamp value, such as:
```
2025-10-19 06:30 AM EST
```
This shows when the data was last extracted from your source systems.
**Insights:** The team can see that data was refreshed this morning at 6:30 AM, meaning they're looking at yesterday's completed work. If the timestamp showed last week's date, they would know to request a data refresh before making operational decisions.
### Example 2: Report Audit Trail
**Scenario:** Your compliance team generates quarterly process mining reports that must include metadata about when the underlying data was extracted, ensuring report accuracy and traceability.
**Settings:**
- Title: "Source Data Extraction Date"
- Description: "Q4 2024 Accounts Payable Analysis"
**Output:**
The report header displays:
```
Process Mining Report - Q4 2024
Report Generated: 2025-01-15 2:30 PM
Data Extracted: 2025-01-14 11:45 PM
Data Age: 14 hours 45 minutes
```
**Insights:** The report clearly documents that it's based on data extracted on January 14th, providing full transparency about data currency. Auditors can verify the timeline between data extraction and report generation, ensuring the analysis reflects the stated time period.
### Example 3: Stale Data Detection
**Scenario:** Your process mining platform should alert users when they're viewing outdated data that hasn't been refreshed on schedule. The weekly data refresh from your ERP system failed, but users may not realize they're looking at old information.
**Settings:**
- Title: "Last Data Refresh"
- Description: "Weekly extraction from Oracle ERP"
**Output:**
The calculator shows:
```
2025-10-05 03:00 AM UTC
```
Current date: October 19, 2025
**Insights:** The data is 14 days old, indicating the weekly extraction process has failed for two consecutive weeks. The system can automatically display a warning banner: "Data is 14 days old - refresh needed" and alert the data team to investigate the ETL pipeline failure. Users are informed not to rely on this data for current operational decisions.
### Example 4: Multi-Region Global Dashboard
**Scenario:** Your multinational company has process mining users across US, Europe, and Asia who need to see the data extraction time in their local timezone for better understanding of data currency.
**Settings:**
- Title: "Data Extraction Time"
- Description: "Global Order-to-Cash Process"
**Output:**
The calculator automatically converts the UTC timestamp to the configured timezone for each region:
- **US East Coast Office:** 2025-10-19 06:30 AM EST
- **London Office:** 2025-10-19 11:30 AM GMT
- **Tokyo Office:** 2025-10-19 08:30 PM JST
All showing the same extraction event in local time.
**Insights:** Global teams can immediately understand data freshness in their local context. Tokyo users see that data was extracted this evening (their time), while New York users see it was extracted this morning. This prevents confusion about whether "yesterday's data" means yesterday in New York or yesterday in Tokyo.
### Example 5: Automated ETL Monitoring
**Scenario:** Your data engineering team needs to monitor that the nightly data extraction pipeline completes successfully. If today's extraction hasn't run by 8 AM, they need to be alerted.
**Settings:**
- Title: "Latest Extraction"
- Description: "Nightly ETL Pipeline Status"
**Output:**
The monitoring system queries this calculator and compares the timestamp:
```
Expected: 2025-10-19 (today)
Actual: 2025-10-18 03:00 AM
Status: FAILED - extraction is 1 day overdue
```
**Insights:** The automated monitoring system detects that the extraction timestamp is still showing yesterday's date when today's extraction should have completed. It automatically sends an alert to the data engineering team to investigate the pipeline failure. This proactive monitoring prevents users from making decisions on outdated data.
## Output
The calculator returns a single timestamp value showing when the dataset was last successfully extracted from source systems.
**Timezone Display:**
- If a timezone is configured in your dataset settings, the timestamp is displayed in that local time
- If no timezone is configured, the timestamp displays in UTC (Coordinated Universal Time)
- The timezone abbreviation or offset is typically shown with the time (EST, GMT, UTC, etc.)
**Format:**
The timestamp typically displays in a human-readable format such as:
- "October 19, 2025 6:30 AM EST"
- "2025-10-19 06:30:00"
The exact format may vary based on your system's display preferences.
**Handling Missing Data:**
If the extraction timestamp is not available (which can occur with manually created test datasets or very old datasets), the calculator may display "Unknown" or an empty value. In production systems with properly configured ETL pipelines, this should always have a valid timestamp.
**Dashboard Integration:**
This calculator is commonly added to dashboard headers to provide constant visibility of data freshness. It can also be included in automated reports, monitoring systems, and audit logs.
---
*This documentation is part of the mindzie Studio process mining platform.*
---
## Find Date Outliers
Section: Calculators
URL: https://docs.mindziestudio.com/mindzie_studio/calculators/find-date-outliers
Source: /docs-master/mindzieStudio/calculators/find-date-outliers/page.md
# Find Date Outliers
## Overview
The Find Date Outliers calculator identifies date and timestamp values in your event log that fall outside normal expected ranges, helping you detect data quality issues before they impact your process analysis. This specialized data quality calculator automatically scans all date and timestamp attributes across your entire event log to find values that are clearly invalid, such as dates in the distant past, far future, or zero values.
Unlike manual data inspection, this calculator systematically examines every date field in your process data to highlight potential problems that could distort your process mining analysis, such as incorrect activity timestamps, malformed data imports, or default placeholder values that were never updated.
## Common Uses
- Validate data quality after importing event logs from legacy systems or new data sources
- Detect placeholder dates or default values that indicate incomplete data entry
- Identify system clock errors or timezone conversion problems that create impossible timestamps
- Find dates from test data that accidentally made it into production event logs
- Verify that timestamp data falls within expected business operation periods
- Quickly assess overall date field quality across all attributes before detailed analysis
## Settings
This calculator requires no configuration settings. It automatically examines all date and timestamp attributes in your event log and identifies outlier values based on predefined rules for what constitutes unrealistic or problematic dates.
**Standard Fields:**
- **Title:** Optional custom title for the calculator output
- **Description:** Optional description for documentation purposes
**Detection Rules:**
The calculator identifies date outliers by checking for:
- **Dates before 1990:** Values earlier than January 1, 1990 are flagged as likely data errors or placeholders
- **Dates after 2040:** Values beyond January 1, 2040 are considered unrealistic for current business processes
- **Zero or null dates:** Missing, null, or zero timestamp values that indicate incomplete data
- **Invalid date formats:** Malformed date values that cannot be properly parsed
## Examples
### Example 1: Validating Legacy System Migration
**Scenario:** Your organization recently migrated invoice processing data from a 20-year-old legacy ERP system to a modern platform. Before performing process mining analysis, you want to verify that all date fields were correctly converted and no placeholder or default dates remain in the dataset.
**Settings:**
- Title: "Invoice Data Migration Validation"
- Description: "Check for date conversion issues from legacy system"
**Output:**
The calculator produces a table showing problematic date values grouped by attribute. Each row represents a specific attribute where outliers were found:
| Attribute Name | Outlier Count | Example Outlier Value | Issue Type |
|----------------|---------------|----------------------|------------|
| Invoice_Date | 847 | 1900-01-01 | Before 1990 |
| Payment_Due_Date | 847 | 1900-01-01 | Before 1990 |
| Last_Modified_Date | 23 | 2099-12-31 | After 2040 |
| Approval_Timestamp | 156 | NULL | Zero/Null |
**Insights:**
The output reveals significant data quality issues from the migration. The 847 invoices with dates of January 1, 1900 are clearly placeholder values from the legacy system that weren't properly converted - this date was commonly used as a default "empty" value in older systems. The 23 records with a 2099 date on Last_Modified_Date suggest these were test records that accidentally migrated to production. The 156 null Approval_Timestamp values indicate incomplete records that are missing critical process timing information.
Before performing any process analysis, you should:
1. Work with the data team to correct or remove the 847 records with placeholder dates
2. Filter out the 23 test records with 2099 dates
3. Investigate why 156 invoices lack approval timestamps
This validation saved you from drawing incorrect conclusions about invoice processing times and approval patterns based on corrupted date data.
### Example 2: Detecting System Clock Issues
**Scenario:** Users have reported that some timestamps in your order fulfillment process "don't make sense," with activities appearing to happen in the wrong order. You suspect there may be server clock synchronization issues or timezone conversion problems affecting event timestamps.
**Settings:**
- Title: "Order Fulfillment Timestamp Validation"
- Description: "Identify clock synchronization or timezone issues"
**Output:**
The calculator shows outliers in the activity timestamp fields:
| Attribute Name | Outlier Count | Example Outlier Value | Issue Type |
|----------------|---------------|----------------------|------------|
| Activity_Timestamp | 1,247 | 2043-08-15 14:23:00 | After 2040 |
| Event_Start_Time | 1,247 | 2043-08-15 14:23:00 | After 2040 |
**Insights:**
The 1,247 events all have timestamps in August 2043 - exactly 20 years in the future. This is a classic sign of a system clock error on one of your application servers or a time zone conversion bug that added decades instead of hours. The fact that both Activity_Timestamp and Event_Start_Time show identical outlier counts and values confirms these are the same events being captured by multiple fields.
Investigation reveals that a warehouse management system server had its clock incorrectly set after a maintenance window, and all events processed through that server for a 6-hour period received timestamps 20 years in the future. These 1,247 events represent critical order processing activities (picking, packing, shipping) that need to be corrected to restore proper process flow analysis.
Without this calculator, these timestamp errors would have caused your process maps to show activities completely out of sequence, making it impossible to accurately analyze order fulfillment performance for the affected time period.
### Example 3: Pre-Analysis Data Quality Check
**Scenario:** You're about to perform a comprehensive process mining analysis of your purchase-to-pay process spanning three years of data. As a best practice, you run the Find Date Outliers calculator first to ensure your dataset is clean before investing time in detailed analysis.
**Settings:**
- Title: "Purchase-to-Pay Data Quality Scan"
- Description: "Pre-analysis validation check"
**Output:**
The calculator returns a table showing all attributes have valid date ranges with no outliers detected.
**Result:** No outliers found in any date attributes.
**Insights:**
This is the best possible outcome - a clean bill of health for your date data. The calculator examined all timestamp and date fields across your entire three-year purchase-to-pay event log and found no values before 1990, after 2040, or that are null/zero. This gives you confidence to proceed with your process mining analysis knowing that:
- All timestamps accurately reflect when activities occurred
- No placeholder dates will distort your time-based metrics
- No test data accidentally contaminated your production dataset
- System clocks were properly synchronized throughout the data collection period
You can now trust the temporal ordering of activities in process maps, the accuracy of duration calculations, and the reliability of time-based insights. This upfront validation saves countless hours of troubleshooting confusing results that would have been caused by corrupt date data.
### Example 4: Identifying Incomplete Data Entry
**Scenario:** Your customer service ticketing system allows support agents to manually enter certain dates, and you suspect that many tickets have missing or incomplete timestamp information that could affect your case resolution time analysis.
**Settings:**
- Title: "Support Ticket Date Completeness Check"
- Description: "Identify tickets with missing date information"
**Output:**
| Attribute Name | Outlier Count | Example Outlier Value | Issue Type |
|----------------|---------------|----------------------|------------|
| First_Response_Date | 3,456 | NULL | Zero/Null |
| Resolution_Date | 892 | NULL | Zero/Null |
| Escalation_Date | 12,034 | NULL | Zero/Null |
| Follow_Up_Date | 8,721 | 1970-01-01 | Before 1990 |
**Insights:**
The analysis reveals significant data entry gaps. The high number of null values indicates that agents are not consistently recording critical dates:
- **3,456 tickets with no First_Response_Date:** These cases cannot be included in response time SLA analysis
- **892 tickets with no Resolution_Date:** It's impossible to calculate resolution time for these cases
- **12,034 tickets with no Escalation_Date:** This is actually acceptable - most tickets shouldn't be escalated, so null is expected here
- **8,721 tickets with 1970-01-01 as Follow_Up_Date:** This Unix epoch date (January 1, 1970) is a classic default value indicating the field was never properly set
The most concerning issue is the 3,456 tickets missing first response dates, as this represents 15% of your ticket volume and directly impacts your ability to measure customer service responsiveness. You should:
1. Update your ticketing system to make First_Response_Date a required field
2. Provide agent training on the importance of complete date entry
3. Consider automated timestamp capture rather than manual entry where possible
4. Filter out the 892 unresolved tickets from completed case analysis
This validation helped you understand that your case resolution metrics have been understated because they excluded tickets with missing data, giving management a falsely optimistic view of support team performance.
## Output
The calculator produces a data table that lists all date and timestamp attributes containing outlier values. The table is designed to help you quickly identify and prioritize data quality issues:
**Attribute Name (Text):** The name of the case or event attribute field that contains date outliers. This allows you to identify exactly which fields have problems.
**Outlier Count (Number):** The number of cases or events that have problematic date values in this attribute. Higher counts indicate more severe data quality issues requiring urgent attention.
**Example Outlier Value (DateTime):** A sample of one of the problematic date values found in the attribute, helping you understand the nature of the issue (e.g., "1900-01-01" suggests placeholder dates, while "2050-01-15" suggests clock errors).
**Issue Type (Category):** The type of outlier detected - "Before 1990", "After 2040", or "Zero/Null" - helping you understand whether the problem is placeholder dates, future dates, or missing values.
**Interactive Analysis:**
The output table is fully interactive - you can:
- Click on any row to drill down into the specific cases containing those outlier values
- Sort by Outlier Count to prioritize which attributes need correction first
- Filter the results to focus on specific types of issues
- Export the outlier list to share with data quality teams
**Best Practices:**
- Run this calculator as the first step in any new process mining project
- Re-run after any data imports or system migrations
- Address outliers before creating process maps or calculating performance metrics
- Use the calculator regularly on ongoing data feeds to catch quality degradation early
**Note:** The calculator only examines attributes with date or timestamp data types. Text fields containing dates are not analyzed. If no outliers are found, the calculator will display "No date outliers detected" - this indicates your data quality is excellent.
---
*This documentation is part of the mindzie Studio process mining platform.*
---
## Find Duplicate Invoices
Section: Calculators
URL: https://docs.mindziestudio.com/mindzie_studio/calculators/find-duplicate-invoices
Source: /docs-master/mindzieStudio/calculators/find-duplicate-invoices/page.md
# Find Duplicate Invoices
## Overview
The Find Duplicate Invoices calculator identifies and summarizes invoices that may have been entered multiple times in your accounts payable process. This specialized tool detects various types of duplicate patterns, from exact matches to invoices with subtle differences in amounts, dates, or due dates. It provides actionable insights for duplicate payment prevention, accounts payable auditing, and data quality improvement.
**IMPORTANT:** This calculator requires the Find Duplicate Invoices enrichment operator to be applied first. The enrichment operator performs the actual duplicate detection, while the calculator presents the results in an organized, actionable format.
## Common Uses
- Prevent duplicate payments before they occur by identifying invoices entered multiple times
- Conduct accounts payable audits by reviewing and resolving duplicate invoice issues
- Assess data quality in invoice processing systems and quantify duplicate entry problems
- Track financial exposure by calculating the total value of unresolved duplicate invoices
- Monitor resolution progress through workflow tracking of duplicate investigation and remediation
- Analyze duplicate patterns to identify root causes such as system errors or process gaps
## Settings
**Invoice Number:** Select the case attribute containing the invoice number or document number. This field is used for display purposes and calculating statistics about duplicate groups.
**Vendor:** Select the case attribute containing the vendor or supplier name. This helps identify which vendors have duplicate invoice issues and provides context for duplicate groups.
**Invoice Amount:** Select the case attribute containing the invoice amount or total value. When specified, the calculator computes the total monetary value of all duplicate invoices, helping quantify the financial risk exposure.
**Invoice Date:** Select the case attribute containing the invoice document date. This field provides additional context for understanding when duplicates were created and helps distinguish between legitimate recurring invoices and true duplicates.
**Due Date:** Select the case attribute containing the invoice payment due date. When specified, the calculator identifies the closest upcoming payment deadline among all duplicate invoices, helping prioritize which duplicates to resolve first.
**Max Rows:** Specify the maximum number of duplicate groups to display in the output table.
## Examples
### Example 1: Identifying High-Value Duplicate Invoices
**Scenario:** Your accounts payable team needs to identify potential duplicate invoices before the next payment run. You want to understand both the number of duplicates and the total financial exposure to prioritize which duplicates to investigate first.
**Settings:**
- Invoice Number: InvoiceNumber
- Vendor: VendorName
- Invoice Amount: InvoiceAmount
- Invoice Date: InvoiceDate
- Due Date: PaymentDueDate
- Max Rows: 100
**Output:**
The calculator displays three key summary metrics at the top:
1. **Total Duplicate Value:** $284,750.00 - This represents the total monetary value of all invoices identified as potential duplicates across all groups.
2. **Number of Duplicates:** 47 invoices - This is the total count of individual invoice cases flagged as duplicates.
3. **Closest Due Date:** 2025-10-25 - This shows the earliest upcoming payment deadline among all duplicate invoices, helping you prioritize urgent reviews.
The main table shows one row per duplicate group with these columns:
- **Group Name:** Unique identifier for each set of duplicate invoices (e.g., "ACME_Corp_INV-12345")
- **Match Type:** The type of duplicate detected (Exact, Invoice Amount Change, Invoice Date Change, Invoice Due Date Change)
- **Group Count:** Number of invoices in this duplicate group (e.g., 2, 3, or more)
- **Group Value:** Total invoice amount for all invoices in this group
- **Resolution Status:** Indicates whether the duplicate has been reviewed and resolved
- **Resolved By:** Name of the person who investigated the duplicate
- **Resolved Time:** When the duplicate was marked as resolved
**Insights:**
The summary metrics immediately reveal significant financial exposure from duplicates. With nearly $285,000 in potential duplicate payments and a due date just days away, this requires urgent attention.
Looking at the Match Type column helps prioritize investigation:
- "Exact" matches (same vendor, invoice number, amount, and date) are most likely true duplicates requiring immediate action
- "Invoice Amount Change" matches may indicate legitimate invoice corrections or adjustments
- "Invoice Date Change" or "Invoice Due Date Change" matches might be data entry errors worth investigating
The Group Count shows how many times each invoice appears. A count of 2 suggests a simple duplicate entry, while higher counts (3, 4, or more) may indicate systemic issues like automated processes creating repeated entries.
By filtering the results to show only unresolved duplicates with due dates in the next week, you can create a prioritized action list for your team to investigate before payment processing.
### Example 2: Tracking Duplicate Resolution Progress
**Scenario:** Your organization ran the duplicate detection last month and assigned team members to investigate each duplicate group. Now you want to monitor resolution progress and ensure all duplicates are addressed before month-end closing.
**Settings:**
- Invoice Number: InvoiceNumber
- Vendor: VendorName
- Invoice Amount: InvoiceAmount
- Invoice Date: InvoiceDate
- Due Date: PaymentDueDate
- Max Rows: 500
**Output:**
The main table includes resolution tracking columns that show the workflow status:
- Invoices with "Resolved By" and "Resolved Time" values show completed investigations
- Empty resolution fields indicate duplicates still pending review
- The "Not A Duplicate" flag shows cases marked as false positives (legitimate invoices incorrectly flagged)
You can calculate the resolution rate: If 35 out of 47 duplicates have been resolved, that's 74% completion with 12 duplicates still requiring attention.
**Insights:**
Resolution tracking transforms duplicate detection from a one-time analysis into an ongoing workflow. Team members can be assigned specific duplicate groups to investigate, and their progress is visible in the output.
The "Not A Duplicate" flag is particularly valuable for understanding false positive patterns. For example:
- Recurring invoices from the same vendor for the same amount (like monthly service contracts) may legitimately appear as duplicates
- Volume purchase agreements might result in multiple invoices with identical amounts
- Different invoice numbers that look similar but represent separate transactions
By reviewing cases marked "Not A Duplicate," you can refine the duplicate detection criteria to reduce false positives in future runs, making the analysis more accurate over time.
The Resolved Time column helps identify bottlenecks. If duplicates assigned two weeks ago remain unresolved, you may need to reallocate resources or escalate specific complex cases.
### Example 3: Analyzing Duplicate Patterns for Root Cause Analysis
**Scenario:** After identifying numerous duplicates, you want to understand what's causing them. Are they data entry errors, system integration issues, or process problems? Analyzing the match types and patterns will help you implement preventive measures.
**Settings:**
- Invoice Number: InvoiceNumber
- Vendor: VendorName
- Invoice Amount: InvoiceAmount
- Invoice Date: InvoiceDate
- Due Date: PaymentDueDate
- Max Rows: 200
**Output:**
The Match Type column reveals distinct patterns:
- 65% "Exact" matches - Same vendor, invoice number, amount, and date
- 20% "Invoice Amount Change" - Same vendor and invoice number, different amounts
- 10% "Invoice Date Change" - Same vendor, invoice number, and amount, different dates
- 5% "Invoice Due Date Change" - All fields match except due date
**Insights:**
The high percentage of "Exact" matches suggests duplicate entry is the primary issue. This could result from:
- Invoices being entered in multiple systems without proper synchronization
- Users manually entering invoices that were already imported via EDI or API
- Batch import processes running multiple times without duplicate checking
The "Invoice Amount Change" pattern often indicates legitimate invoice corrections. For example:
- A vendor sends an invoice for $5,000
- An error is discovered and a corrected invoice for $4,850 is sent
- Both invoices exist in the system with the same invoice number
These require investigation but may not be true duplicates. The original invoice should be voided rather than simply flagged as a duplicate.
The "Invoice Date Change" pattern may reveal scanning or OCR issues where the same physical invoice is scanned multiple times with slightly different date interpretations.
By grouping duplicates by vendor, you might discover that 80% of duplicates come from just 3 vendors. This suggests targeted solutions like improved EDI integration with those specific vendors or additional validation rules in the invoice entry screen for high-volume suppliers.
This pattern analysis transforms duplicate detection from reactive cleanup into proactive process improvement, helping you address root causes rather than just symptoms.
## Output
The calculator produces a summary table with one row per duplicate group, along with three key performance indicators displayed at the top of the output.
### Summary Metrics
**Total Duplicate Value:** The total monetary value of all invoices identified as duplicates across all groups. This metric helps quantify the financial risk exposure from potential duplicate payments. Only calculated when Invoice Amount is specified in settings.
**Number of Duplicates:** The total count of individual invoice cases flagged as part of duplicate groups. This metric indicates the scope of the duplicate issue in your dataset.
**Closest Due Date:** The earliest upcoming payment deadline among all duplicate invoices. This metric helps prioritize which duplicates require urgent investigation. Only calculated when Due Date is specified in settings.
### Duplicate Groups Table
Each row in the main table represents one group of duplicate invoices:
**Group Name:** Unique identifier for each set of duplicates, typically combining vendor name and invoice number.
**Match Type:** Indicates the type of duplicate pattern detected:
- "Exact" - All fields match identically
- "Invoice Amount Change" - Same vendor and invoice number with different amounts
- "Invoice Date Change" - Same vendor, invoice number, and amount with different invoice dates
- "Invoice Due Date Change" - All core fields match with different due dates
**Group Count:** The number of invoice cases in this duplicate group (e.g., 2 for a simple duplicate, 3+ for multiple entries of the same invoice).
**Group Value:** The total invoice amount for all invoices in this specific duplicate group.
**Resolution Workflow Columns:**
- **Not A Duplicate:** User-marked flag indicating the group was reviewed and determined to be a false positive
- **Is Resolved:** Indicates whether the duplicate has been investigated and addressed
- **Resolved By:** The name or identifier of the person who resolved the duplicate
- **Resolved Time:** The timestamp when the resolution occurred
### Visualization Options
The calculator output can be used to create various visualizations:
- **KPI Dashboard:** Display the three summary metrics (Total Duplicate Value, Number of Duplicates, Closest Due Date) as prominent indicators
- **Match Type Breakdown:** Create a bar chart showing the distribution of different duplicate types to identify patterns
- **Resolution Progress:** Build a progress indicator showing the percentage of duplicate groups that have been resolved
- **Vendor Analysis:** Group results by vendor to identify which suppliers have the most duplicate invoice issues
- **Timeline View:** Plot duplicate creation dates versus resolution dates to track processing time
---
*This documentation is part of the mindzie Studio process mining platform.*
---
## Find Text In Attributes
Section: Calculators
URL: https://docs.mindziestudio.com/mindzie_studio/calculators/find-text-in-attributes
Source: /docs-master/mindzieStudio/calculators/find-text-in-attributes/page.md
# Find Text In Attributes
## Overview
The Find Text In Attributes calculator searches across all attributes in your event log to locate text patterns. This powerful search tool scans both case-level and event-level attributes, helping you quickly locate specific values, identifiers, or text fragments anywhere in your process data.
Unlike simple filters that work on individual attributes, this calculator performs a comprehensive search across your entire dataset and returns all matching locations, making it ideal for data exploration and investigation tasks.
## Common Uses
- Locate cases containing specific order numbers, invoice numbers, or transaction IDs
- Find all instances of a customer name or vendor name across multiple attributes
- Search for error messages or status codes across different process stages
- Investigate data quality issues by searching for unexpected values or patterns
- Discover which attributes contain specific text when you're unsure where to look
- Track the propagation of key identifiers through different process attributes
## Settings
**Search Text:** Enter the text string you want to search for across all attributes. The search is case-sensitive by default and will find exact matches of the text anywhere within attribute values.
**Search Mode:** Choose how the search should match text:
- **Contains:** Finds attributes where the search text appears anywhere in the value (default)
- **Exact Match:** Finds attributes where the value exactly matches the search text
- **Starts With:** Finds attributes where the value begins with the search text
- **Ends With:** Finds attributes where the value ends with the search text
**Include Case Attributes:** When enabled, searches through all case-level attributes (default: enabled).
**Include Event Attributes:** When enabled, searches through all event-level attributes (default: enabled).
**Case Sensitive:** When enabled, the search distinguishes between uppercase and lowercase letters (default: enabled).
## Examples
### Example 1: Finding a Specific Order Number
**Scenario:** A customer called about order "ORD-2024-15847" and you need to quickly locate this order in your system without knowing which attribute contains the order number.
**Settings:**
- Search Text: ORD-2024-15847
- Search Mode: Contains
- Include Case Attributes: Enabled
- Include Event Attributes: Enabled
- Case Sensitive: Enabled
**Output:**
The calculator displays a table showing all matches:
| Attribute Name | Attribute Type | Match Count | Sample Values |
|---------------|----------------|-------------|---------------|
| OrderID | Case | 1 | ORD-2024-15847 |
| ReferenceNumber | Event | 3 | Payment for ORD-2024-15847 |
| Description | Event | 2 | Shipped ORD-2024-15847 |
**Insights:** The order number appears in three different attributes across the process. The single match in OrderID confirms one case exists, while the event-level matches show this reference appears in payment and shipping descriptions. You can click on any row to see the specific cases and events containing this value.
### Example 2: Investigating Customer Complaints
**Scenario:** You received complaints about a vendor named "Acme Corp" and want to find all process instances involving this vendor, regardless of which attribute stores the vendor name.
**Settings:**
- Search Text: Acme Corp
- Search Mode: Contains
- Include Case Attributes: Enabled
- Include Event Attributes: Enabled
- Case Sensitive: Disabled
**Output:**
| Attribute Name | Attribute Type | Match Count | Sample Values |
|---------------|----------------|-------------|---------------|
| VendorName | Case | 47 | Acme Corp |
| Supplier | Case | 47 | ACME CORP |
| ProcessedBy | Event | 142 | Acme Corp Distribution Center |
| Notes | Event | 23 | Contacted Acme Corp regarding delay |
**Insights:** The search found 47 cases involving Acme Corp. The vendor appears under both "VendorName" and "Supplier" attributes, with slight variations in capitalization. Event-level matches reveal specific touchpoints with this vendor throughout the process. This comprehensive view helps you quickly filter to all Acme Corp-related cases for detailed analysis.
### Example 3: Tracking Error Codes Across the Process
**Scenario:** You want to understand where error code "ERR-503" appears in your process to identify which activities or stages are affected.
**Settings:**
- Search Text: ERR-503
- Search Mode: Contains
- Include Case Attributes: Enabled
- Include Event Attributes: Enabled
- Case Sensitive: Enabled
**Output:**
| Attribute Name | Attribute Type | Match Count | Sample Values |
|---------------|----------------|-------------|---------------|
| ErrorCode | Event | 38 | ERR-503 |
| SystemResponse | Event | 38 | Service Unavailable ERR-503 |
| ValidationStatus | Case | 12 | Failed with ERR-503 |
| Comments | Event | 15 | Retry after ERR-503 |
**Insights:** Error code ERR-503 appears in 38 events across the process, affecting 12 cases overall (shown in ValidationStatus). The error appears primarily in event-level attributes, suggesting it occurs at specific process steps rather than affecting entire cases. By drilling into these matches, you can identify which activities generate this error and when retry attempts occur.
### Example 4: Data Quality Investigation
**Scenario:** During data validation, you notice some records may contain the placeholder text "NULL" or "N/A" instead of actual values. You want to identify which attributes contain these placeholders.
**Settings:**
- Search Text: NULL
- Search Mode: Exact Match
- Include Case Attributes: Enabled
- Include Event Attributes: Enabled
- Case Sensitive: Disabled
**Output:**
| Attribute Name | Attribute Type | Match Count | Sample Values |
|---------------|----------------|-------------|---------------|
| ManagerApproval | Event | 156 | NULL |
| CostCenter | Case | 89 | NULL |
| Department | Case | 89 | NULL |
| ApprovalComments | Event | 203 | NULL |
**Insights:** Several attributes contain "NULL" values, indicating incomplete data. The 89 cases missing CostCenter and Department data suggest a data extraction issue for these attributes. The 203 events with NULL ApprovalComments may be legitimate (comments are optional), but the 156 events missing ManagerApproval require investigation as this may be a required field. This analysis helps prioritize data quality improvements.
### Example 5: Finding Invoice Amounts
**Scenario:** You need to locate all references to a specific invoice amount of "15,750.00" across your accounts payable process to investigate a disputed charge.
**Settings:**
- Search Text: 15750
- Search Mode: Contains
- Include Case Attributes: Enabled
- Include Event Attributes: Enabled
- Case Sensitive: Enabled
**Output:**
| Attribute Name | Attribute Type | Match Count | Sample Values |
|---------------|----------------|-------------|---------------|
| InvoiceAmount | Case | 3 | 15750.00 |
| TotalAmount | Event | 3 | $15,750.00 |
| PaymentValue | Event | 2 | 15750.00 USD |
| LineItemTotal | Event | 8 | Item subtotal: 15750.00 |
**Insights:** The amount 15,750 appears in 3 different invoices (case-level), with a total of 8 line items across various events. The discrepancy between 3 invoices and 8 line items suggests some invoices have multiple line items totaling this amount. This comprehensive search helps you identify whether you're dealing with one invoice or multiple invoices with the same amount.
### Example 6: Case-Insensitive Customer Search
**Scenario:** You want to find all cases involving customer "TechStart Inc" but the customer name might be entered with different capitalizations across your system.
**Settings:**
- Search Text: techstart
- Search Mode: Contains
- Include Case Attributes: Enabled
- Include Event Attributes: Enabled
- Case Sensitive: Disabled
**Output:**
| Attribute Name | Attribute Type | Match Count | Sample Values |
|---------------|----------------|-------------|---------------|
| CustomerName | Case | 28 | TechStart Inc, TECHSTART INC, Techstart Inc. |
| BillingEntity | Case | 28 | TechStart Inc |
| ContactName | Event | 45 | John Smith - TechStart, Sarah Lee (TechStart Inc) |
| EmailDomain | Event | 156 | techstart.com |
**Insights:** With case-insensitive search, you found all 28 cases for TechStart regardless of how the name was capitalized. The variation in naming (with/without "Inc", different capitalization) reveals data standardization issues. The EmailDomain matches show even more touchpoints (156 events) since any email from techstart.com was caught. This helps you create comprehensive filters while also identifying data quality improvements needed.
## Output
The Find Text In Attributes calculator displays results in a searchable table with the following columns:
**Attribute Name:** The name of the attribute containing the search text.
**Attribute Type:** Indicates whether this is a Case attribute (applies to entire cases) or Event attribute (applies to individual activities).
**Match Count:** The number of times the search text appears in this attribute. For case attributes, this represents the number of cases. For event attributes, this represents the number of events.
**Sample Values:** Example values showing how the search text appears in this attribute, displaying up to 3 unique values.
### Interactive Features
**Click on a row:** Drill down to see all specific cases and events containing the search text in that particular attribute.
**Sort capabilities:** Click column headers to sort by attribute name, match count, or attribute type.
**Export functionality:** Export the search results to Excel or CSV for documentation or further analysis.
**Create filter from results:** After finding relevant attributes, you can create targeted filters to isolate cases containing specific text patterns.
### Usage Tips
- Use "Contains" mode with partial text for exploratory searches when you're unsure of exact values
- Use "Exact Match" mode when searching for specific codes or identifiers
- Disable case sensitivity when searching for names or text that might have inconsistent capitalization
- Start with broad searches to understand data structure, then refine with more specific criteria
- Review sample values to understand how the search text appears in context before drilling down
The calculator is particularly valuable during initial data exploration, allowing you to quickly understand where specific information is stored across your process attributes without manually checking each field.
---
*This documentation is part of the mindzie Studio process mining platform.*
---
## Follows Graphs
Section: Calculators
URL: https://docs.mindziestudio.com/mindzie_studio/calculators/follows-graphs
Source: /docs-master/mindzieStudio/calculators/follows-graphs/page.md
# Follows Graphs
**Note:** This is an administrator-only calculator designed for testing and data quality analysis. Most users should use the Process Map calculator for visual process analysis.
## Overview
The Follows Graphs calculator generates detailed data about how activities relate to each other in your process. It calculates two types of relationships: directly follows relationships where one activity immediately follows another, and eventually follows relationships where one activity occurs before another at any point in the case regardless of intervening activities.
Unlike the Process Map calculator which provides interactive visualizations, Follows Graphs performs complete graph calculations and outputs structured data tables suitable for detailed analysis, testing, performance benchmarking, and data quality validation. This calculator is primarily used by administrators and process mining analysts who need access to raw graph data for technical analysis or export to external tools.
## Common Uses
- Test and validate graph calculation algorithms for correctness and performance
- Benchmark calculation performance across different dataset sizes and complexities
- Identify data quality issues where events have identical timestamps
- Export detailed graph data for external analysis in tools like R, Python, or Gephi
- Analyze duration distributions for specific activity pairs in detail
- Validate process mining algorithms during development and regression testing
## Settings
This calculator has no configurable settings. It processes all cases and events to generate complete graph data every time it runs.
## Examples
### Example 1: Identifying Data Quality Issues with Identical Timestamps
**Scenario:** You suspect your event log has timestamp precision issues where multiple activities have identical timestamps, making it impossible to determine their correct order. You want to identify which activity pairs are affected and how frequently this occurs.
**Settings:**
No settings required.
**Output:**
The calculator generates five data tables. Tables 2 and 3 show indeterminate pairs where events have identical timestamps:
DirectlyFollows-Indeterminate table:
- Create Invoice and Send Invoice: 127 occurrences
- Receive Payment and Record Payment: 89 occurrences
- Approve Request and Notify Approver: 45 occurrences
EventuallyFollows-Indeterminate table shows the same pairs plus any additional eventually-follows relationships with zero duration.
The Stats table shows:
- Calculation Time: 2,347 milliseconds
- Fill Tables Time: 156 milliseconds
- Total Calculations: 1,247,893
**Insights:** The high number of indeterminate pairs indicates significant timestamp precision problems in your event log. The most common issue occurs with Create Invoice and Send Invoice happening at exactly the same time in 127 cases. This suggests these events are either being recorded with date-only precision or are being timestamped simultaneously by your source system. You should investigate whether these activities truly occur simultaneously or if your data extraction process is losing time-of-day information. This data quality issue could impact process analysis accuracy and should be resolved by improving timestamp precision in your source data.
### Example 2: Performance Benchmarking Across Dataset Sizes
**Scenario:** You are optimizing your process mining infrastructure and need to understand how graph calculation performance scales with dataset size. You want to measure calculation time for different data volumes to plan resource allocation.
**Settings:**
No settings required.
**Output:**
Running the calculator on progressively larger datasets and examining the Stats table:
10,000 cases dataset:
- Calculation Time: 847 milliseconds
- Total Calculations: 186,234
50,000 cases dataset:
- Calculation Time: 4,521 milliseconds
- Total Calculations: 931,170
100,000 cases dataset:
- Calculation Time: 9,234 milliseconds
- Total Calculations: 1,862,340
The DirectlyFollows table has 156 unique activity pairs while the EventuallyFollows table has 2,847 pairs, showing the comprehensive nature of eventually follows relationships.
**Insights:** The calculation time scales roughly linearly with the number of cases for this dataset where cases have a consistent average number of events. However, the total number of calculations shows that eventually follows graph computation is significantly more expensive than directly follows computation, as expected from the algorithm's quadratic complexity for cases with many events. For datasets exceeding 100,000 cases, you should consider filtering to the most relevant cases before running this calculator, or allocating additional computational resources. The Fill Tables Time remains consistently low across all dataset sizes, indicating that table conversion is not a bottleneck.
### Example 3: Exporting Process Data for External Research Analysis
**Scenario:** You are collaborating with a university research team studying process optimization algorithms. They need raw process graph data in a standardized format to test their new analysis approach. You want to export your process relationships with complete duration statistics.
**Settings:**
No settings required.
**Output:**
The calculator generates the DirectlyFollows table with 243 unique activity pairs:
Sample rows from DirectlyFollows table:
- Submit Claim -> Validate Documents: Count=1,847, Mean=2.3 days, Median=1.8 days, StDev=3.2 days
- Validate Documents -> Approve Claim: Count=1,245, Mean=4.7 days, Median=3.1 days, StDev=6.8 days
- Validate Documents -> Request Additional Info: Count=602, Mean=1.2 days, Median=0.9 days, StDev=2.1 days
The EventuallyFollows table contains 4,892 pairs showing all possible activity relationships including non-consecutive ones.
**Insights:** You can export the DirectlyFollows table to CSV format and provide it to the research team. The table includes all the essential information for process mining research: activity names, relationship frequencies, and comprehensive duration statistics including mean, median, standard deviation, minimum, and maximum values. The EventuallyFollows table provides an even more complete picture of activity relationships for researchers studying long-distance dependencies in processes. The structured output format makes it easy to import into analysis tools like R or Python for statistical modeling.
### Example 4: Validating Process Mining Algorithm Changes
**Scenario:** Your development team has modified the graph calculation algorithm to improve performance. You need to verify that the changes produce identical results to the previous version to ensure no regression has occurred.
**Settings:**
No settings required.
**Output:**
Running both the old and new algorithm versions on a known test dataset with 5 cases and 11 events:
DirectlyFollows table (both versions):
- 8 unique activity pairs
- Identical counts for each pair
- Identical duration statistics
EventuallyFollows table (both versions):
- 28 unique activity pairs
- All counts match exactly
- All duration statistics match within floating-point precision
Stats table comparison:
- Old algorithm: 89 milliseconds
- New algorithm: 42 milliseconds
- Both: 138 total calculations
**Insights:** The validation confirms that the algorithm optimization successfully reduced calculation time by 53 percent without changing any output values. All activity pairs, counts, and duration statistics match exactly between versions, proving no regression occurred. The consistent calculation count confirms both algorithms process the same event pairs. This type of validation is essential when making performance improvements to ensure accuracy is maintained. You can now confidently deploy the optimized algorithm to production.
### Example 5: Analyzing Duration Variability for Specific Activity Pairs
**Scenario:** Your operations team reports inconsistent processing times between document validation and approval activities. You want detailed duration statistics for this specific activity pair to understand the variability and identify if there are multiple distinct patterns.
**Settings:**
No settings required.
**Output:**
Examining the DirectlyFollows table for the "Validate Documents -> Approve" pair:
Activity1: Validate Documents
Activity2: Approve
Count: 3,247 occurrences
Mean Duration: 5.8 days
Median Duration: 2.3 days
Standard Deviation: 12.4 days
Min Duration: 0.2 days
Max Duration: 87.3 days
The large difference between mean and median suggests a right-skewed distribution with some extreme outliers. The high standard deviation indicates significant variability.
**Insights:** The dramatic difference between median duration (2.3 days) and mean duration (5.8 days) indicates that while most cases process relatively quickly, a subset of cases takes much longer and pulls the average up. The maximum duration of 87.3 days shows extreme outliers that warrant investigation. The minimum of 0.2 days suggests some cases are fast-tracked. This variability pattern suggests you should segment the cases to identify what distinguishes fast, normal, and slow processing. You can drill down into the raw event pair data to identify specific cases with extreme durations and investigate their characteristics.
## Output
The Follows Graphs calculator generates five structured data tables containing comprehensive process graph information:
**Table 0: DirectlyFollows**
Shows all directly follows relationships where one activity immediately follows another with no intervening activities.
Columns: Key (activity pair identifier), Activity1 (first activity), Activity2 (second activity), Count (frequency), MeanDuration, MedianDuration, StdevDuration, MinDuration, MaxDuration
This table typically contains fewer relationships than EventuallyFollows as it only includes consecutive activity pairs.
**Table 1: EventuallyFollows**
Shows all eventually follows relationships where one activity occurs before another at any point in the case.
Columns: Same structure as DirectlyFollows table
This table is significantly larger as it includes all possible activity pairs regardless of intervening activities. For a case with 10 events, this captures 45 possible pairs compared to just 9 directly follows pairs.
**Table 2: DirectlyFollows-Indeterminate**
Identifies directly follows pairs where events have identical timestamps, making ordering indeterminate.
Columns: Key (undirected pair identifier), Activity1, Activity2, Count
A well-structured event log with precise timestamps should have zero or very few indeterminate pairs. High counts indicate data quality issues.
**Table 3: EventuallyFollows-Indeterminate**
Identifies eventually follows pairs with identical timestamps.
Columns: Same structure as DirectlyFollows-Indeterminate table
Typically contains the same pairs as DirectlyFollows-Indeterminate since timestamp issues affect both relationship types.
**Table 4: Stats**
Contains performance metrics for the calculation.
Columns: CalculationTime (milliseconds to compute graphs), FillTablesTime (milliseconds to convert to tables), Calculations (total event pair comparisons)
Use this table to track performance and identify when datasets become too large for efficient processing.
**Data Export Options:**
All tables can be exported to CSV or Excel format for further analysis in external tools. The structured format makes it easy to import into statistical software, graph visualization tools, or custom analysis scripts.
---
*This documentation is part of the mindzieStudio process mining platform.*
---
## General 3 Way Match
Section: Calculators
URL: https://docs.mindziestudio.com/mindzie_studio/calculators/general-3-way-match
Source: /docs-master/mindzieStudio/calculators/general-3-way-match/page.md
# General 3 Way Match
## Overview
The General 3 Way Match calculator validates three-way matching across any process by comparing quantity and value data from three different activities. This powerful compliance tool identifies discrepancies and mismatches between expected and actual quantities or values, helping you detect control failures, errors, and potential fraud.
While commonly used in Accounts Payable processes (comparing Purchase Orders, Goods Receipts, and Invoices), this calculator is flexible enough to support any process requiring three-way validation.
## Common Uses
- Validate Purchase-to-Pay three-way matching compliance (PO, Receipt, Invoice)
- Identify cases where ordered, received, and invoiced quantities don't match
- Detect value discrepancies that may indicate pricing errors or fraud
- Monitor compliance with organizational matching policies
- Analyze patterns of matching failures by type (which document is typically wrong)
- Support audit requirements for procurement and payment processes
## Settings
**First Activity Name:** Select the first activity in your three-way comparison (e.g., "Create Purchase Order" or "PO"). The calculator will sum all quantity and value data from events with this activity name.
**Second Activity Name:** Select the second activity in your three-way comparison (e.g., "Goods Receipt" or "Receipt"). This typically represents the physical receipt of goods where actual quantities are recorded.
**Third Activity Name:** Select the third activity in your three-way comparison (e.g., "Invoice Received" or "Invoice"). This typically represents the vendor invoice with final billing amounts.
**Quantity Column Name:** Select the column containing quantity data to compare across the three activities. Must be a numeric field. The calculator sums all quantity values within each activity per case.
**Value Column Name:** Select the column containing monetary value data to compare across the three activities. Must be a numeric field. The calculator sums all values within each activity per case.
**Value Threshold:** Specify the acceptable tolerance for differences (default: 0). If set to 0, any difference greater than 0.01 is flagged as a mismatch. If set to a percentage (e.g., 0.01 for 1%), differences must exceed this percentage to be flagged. This allows for minor rounding differences or acceptable variance.
## Examples
### Example 1: Purchase-to-Pay Three-Way Match Validation
**Scenario:** Your organization requires that Purchase Orders, Goods Receipts, and Invoices match within acceptable tolerances. You need to identify cases where these documents don't align, categorized by which document contains the discrepancy.
**Settings:**
- First Activity Name: Create Purchase Order
- Second Activity Name: Goods Receipt
- Third Activity Name: Invoice Received
- Quantity Column Name: Quantity
- Value Column Name: Amount
- Value Threshold: 0.02 (allow 2% variance)
**Output:**
The calculator provides four key views accessible from the dropdown in the top right corner:
1. **Value Summary (default):**
- Shows aggregate statistics for value mismatches
- Rows represent different mismatch types:
- "Activity Wrong 1": Cases where the PO value differs while Receipt and Invoice match
- "Activity Wrong 2": Cases where the Receipt value differs while PO and Invoice match
- "Activity Wrong 3": Cases where the Invoice value differs while PO and Receipt match
- "All Wrong": Cases where no two activities have matching values
- Columns show the count of cases, total difference amount, and sum of absolute values from each activity
- Click on any row to drill down into the specific cases with that mismatch type
2. **Quantity Summary:**
- Same structure as Value Summary but for quantity mismatches
- Identifies cases where ordered, received, and invoiced quantities don't align
- Shows which stage in the process typically has quantity discrepancies
3. **Value Details:**
- Lists individual cases with value mismatches
- Shows the specific values from each activity (PO amount, Receipt amount, Invoice amount)
- Displays the calculated difference value
- Ordered by highest differences first to prioritize investigation
- Click on case identifiers to explore the full case timeline
4. **Quantity Details:**
- Lists individual cases with quantity mismatches
- Shows specific quantities from each activity
- Enables investigation of individual problematic cases
**Insights:**
This analysis reveals several actionable insights:
- **Control Effectiveness:** If most mismatches show "Activity Wrong 3" (Invoice), it suggests vendors frequently bill incorrectly, requiring better invoice validation controls.
- **Process Quality:** High counts in "All Wrong" indicate systemic process issues where basic data entry or system integration is failing.
- **Fraud Detection:** Large value differences in the "Value Details" view may indicate fraudulent manipulation of amounts between documents.
- **Root Cause Patterns:** By analyzing which activity is typically wrong, you can focus improvement efforts on specific process stages (purchasing, receiving, or invoice processing).
- **Audit Support:** The detailed case lists provide audit trails showing exactly which cases violated three-way matching requirements.
### Example 2: Manufacturing Quality Control Validation
**Scenario:** In a manufacturing process, you need to validate that production orders, actual production output, and quality inspection results all align on quantities and defect counts.
**Settings:**
- First Activity Name: Production Order Created
- Second Activity Name: Production Completed
- Third Activity Name: Quality Inspection
- Quantity Column Name: Units
- Value Column Name: DefectCount
- Value Threshold: 0 (zero tolerance for discrepancies)
**Output:**
The Quantity Summary shows:
- Cases where ordered production quantity doesn't match completed quantity (rework or waste)
- Cases where completed quantity doesn't match inspected quantity (missing inspections)
The Value Summary shows:
- Cases where defect counts vary across activities, indicating data quality issues
**Insights:**
- Identifies production batches with unexplained quantity variances
- Highlights quality control gaps where defect counts aren't consistently recorded
- Supports traceability requirements by flagging incomplete documentation
- Enables investigation of specific batches with quality or quantity issues
## Output
The calculator provides four views, selectable from the dropdown menu:
**Value Summary:** Aggregate statistics showing counts and totals for each type of value mismatch. Provides a high-level overview of matching compliance.
**Quantity Summary:** Aggregate statistics showing counts and totals for each type of quantity mismatch. Helps identify whether quantity or value issues are more prevalent.
**Value Details:** Detailed list of individual cases with value mismatches, showing specific amounts from each activity and the calculated difference. Sorted by highest discrepancies first.
**Quantity Details:** Detailed list of individual cases with quantity mismatches, showing specific quantities from each activity and the calculated difference. Enables case-by-case investigation.
All views support interactive filtering and drill-down capabilities. Click on summary rows to filter to specific mismatch types, or click on case identifiers in detail views to explore the full case timeline.
**Note:** Only cases containing all three specified activities are included in the analysis. Cases missing any activity are automatically excluded.
---
*This documentation is part of the mindzie Studio process mining platform.*
---
## Histogram
Section: Calculators
URL: https://docs.mindziestudio.com/mindzie_studio/calculators/histogram
Source: /docs-master/mindzieStudio/calculators/histogram/page.md
# Histogram
## Overview
The Histogram calculator shows the distribution of values for a selected attribute across defined ranges (bins). This visualization helps you understand the shape, central tendency, and spread of your data, making it essential for identifying patterns, outliers, and data distributions.
## Common Uses
- See the distribution of invoice payments (early, on-time, or late)
- Analyze the distribution of case durations
- View the distribution of processing times
- Identify peak activity hours throughout the day
- Analyze purchase order value distributions
## Settings
**Attribute:** Select the attribute you wish to analyze (e.g., Case Duration, Invoice Amount, Time of Day).
**Aggregate Function:** Choose how to aggregate the data within each bin:
| Function | Description |
|----------|-------------|
| Case Count | Returns the number of cases in each bin (most common) |
| Max | Returns the maximum value for each bin |
| Median | Returns the median value for each bin |
| Min | Returns the minimum value for each bin |
| Sum | Returns the sum of values for each bin |
**Number of Bins:** Specify the number of bins (ranges/groups/intervals) to distribute the data into. More bins provide finer granularity, fewer bins show broader patterns.
**Calculation Mode:** Choose how the histogram ranges are determined:
| Mode | Description | When to Use |
|------|-------------|-------------|
| Auto Mode | Automatically selects appropriate values and units | Best starting point for most analyses |
| Full Range Mode | Includes the complete range of values, including outliers | When you need to see all data including extreme values |
| Manual Mode | Manually specify min/max values and units | When you want to focus on a specific range or exclude outliers |
**Manual Mode Settings:**
- **Min Value:** Specify the lowest value to include
- **Max Value:** Specify the highest value to include
- **Duration Units:** For time-based attributes, specify units (minutes, hours, days, weeks)
## Examples
### Example 1: Activity Distribution Throughout the Day
**Scenario:** You want to see when cases are started throughout the day to understand peak activity hours.
**Settings:**
- Attribute: Time of Day
- Aggregate Function: Case Count
- Number of Bins: 24 (one per hour)
- Calculation Mode: Manual
- Min Value: 0 (midnight)
- Max Value: 24 (end of day)
**Output:**
The histogram shows that most cases start between 6am and 3pm, with some cases falling outside typical working hours.
**Insights:** This reveals staffing patterns, identifies after-hours activity that may require investigation, and shows peak processing times.
### Example 2: Purchase Order Value Distribution
**Scenario:** You want to analyze the distribution of total costs for purchase orders.
**Settings:**
- Attribute: Total Cost
- Aggregate Function: Case Count
- Calculation Mode: Auto
**Output:**
The histogram shows that most purchase orders are on the lower end, below $1,000.
**Insights:** This helps you understand typical transaction sizes and identify appropriate approval thresholds.
### Example 3: Focused Analysis of Lower-Value Orders
**Scenario:** To analyze the lower-value purchase orders more closely, use manual mode to zoom into a specific range.
**Settings:**
- Attribute: Total Cost
- Calculation Mode: Manual
- Max Value: 500
**Output:**
The histogram now shows finer detail for purchase orders under $500, revealing more granular distribution patterns in this range.
**Insights:** Manual mode lets you focus on specific ranges of interest by excluding outliers or high-value transactions.
---
*This documentation is part of the mindzie Studio process mining platform.*
---
## LLM Prompts
Section: Calculators
URL: https://docs.mindziestudio.com/mindzie_studio/calculators/llm-prompts
Source: /docs-master/mindzieStudio/calculators/llm-prompts/page.md
# LLM Prompts
## Overview
The LLM Prompts calculator generates comprehensive, AI-ready summaries of your process mining data that can be consumed by Large Language Models (LLMs). This calculator serves as the data bridge between mindzieStudio and AI chatbot systems, powering features like mindzie Copilot.
**IMPORTANT: This is an administrator-only calculator designed for AI integration and chatbot functionality.** It creates structured prompts containing process statistics, activity patterns, and performance metrics specifically formatted for consumption by AI assistants. Regular users interact with AI capabilities through the mindzie Copilot interface rather than using this calculator directly.
This calculator intelligently controls data sharing through five privacy levels, ensuring you maintain control over what information is shared with external LLM services while enabling natural language analysis of your process data.
## Common Uses
- Power AI chatbot assistants that answer natural language questions about your process data
- Enable users to ask questions like "Which activity causes the most delays?" and get AI-generated insights
- Provide context to Large Language Models for automated process analysis and recommendations
- Generate comprehensive dataset summaries optimized for AI consumption and interpretation
- Control privacy by limiting what process data is shared with external LLM services
- Support different trust levels for on-premise versus cloud-based AI services
## Settings
**Data Level:** Controls how much process data is shared with the LLM. This is the primary privacy control.
- **Level 0 (Off)** - Disables AI capabilities entirely. No data shared with LLM services.
- **Level 1 (No Data)** - AI can answer generic process mining questions but has no access to your dataset.
- **Level 2 (Activity and Attribute Names)** - Shares only column names and data types. AI understands your dataset structure but not values.
- **Level 3 (Activities, Attributes, and Calculated Values)** - Shares aggregated statistics like durations and frequencies. No raw case data.
- **Level 4 (All Data)** - Complete statistical profile including all calculated metrics. Maximum AI capability. Note: Raw case records are never shared at any level.
**Include Activities and Attributes:** When enabled, shares activity names with case counts and percentages, plus complete lists of case and event attributes with data types. Active at data levels 2, 3, and 4. This helps the AI understand what activities and attributes exist in your process.
**Include Attribute Breakdown:** When enabled, provides detailed value distributions for categorical attributes, showing counts and percentages for each value. Active at data levels 3 and 4. Attributes with over 100 categories are automatically skipped to avoid overwhelming the AI with too much detail.
**Include Time Between Activities:** When enabled, shares activity pair performance data including time between activities, case counts, percentages, and mean durations. Limited to the top 100 activity pairs. Active at data levels 3 and 4. This helps the AI identify bottlenecks and delays in your process.
**Include Duration Histogram:** When enabled, provides the distribution of case durations organized into buckets. Active at data levels 3 and 4. This helps the AI understand typical versus outlier case durations in your process.
**Include Dataset Information:** When enabled, shares overall dataset statistics including start and end times, case counts, event counts, duration statistics, and attribute counts. Active at data levels 3 and 4. This gives the AI a high-level view of your dataset's scope and characteristics.
**Include Start and End Frequencies:** When enabled, shows which activities cases start and end with, along with percentages. Active at data levels 3 and 4. This helps the AI understand process entry and exit points and identify common starting and ending patterns.
**Include Resource Frequency:** When enabled, provides case percentages for each resource, limited to the top 100 resources. Active at data levels 3 and 4. Only included if a Resource column exists in your dataset. This helps the AI identify workload distribution and potential resource bottlenecks.
**Include Variant Information:** When enabled, provides process variant statistics including variant sequences, case percentages, and mean durations for each variant. Limited to the top 100 variants. Active at data levels 3 and 4. This helps the AI understand which process paths are most common and their relative performance.
**Prefix Text:** Optional text to prepend to the generated prompt. Can be used to add custom context or instructions before the main data sections. Currently stored but not actively used in the main calculation.
**Postfix Text:** Optional text to append to the generated prompt. Can be used to add custom context or instructions after the main data sections. Currently stored but not actively used in the main calculation.
## Examples
### Example 1: Enabling AI-Powered Process Analysis
**Scenario:** You want to enable the mindzie Copilot AI assistant to answer natural language questions about your order-to-cash process. You trust the LLM service provider and want to share comprehensive process statistics to maximize the AI's analytical capabilities.
**Settings:**
- Data Level: Level 4 (All Data)
- Include Activities and Attributes: Enabled
- Include Attribute Breakdown: Enabled
- Include Time Between Activities: Enabled
- Include Duration Histogram: Enabled
- Include Dataset Information: Enabled
- Include Start and End Frequencies: Enabled
- Include Resource Frequency: Enabled
- Include Variant Information: Enabled
**Output:**
The calculator generates a comprehensive prompt containing:
Dataset Information:
- 2,456 cases covering October 1 to December 31, 2024
- Average case duration: 8.5 days
- 18 unique activities
- 15 case attributes and 12 event attributes
Activity Statistics:
- Create Order: 100% of cases
- Check Inventory: 98% of cases
- Ship: 95% of cases
- Invoice: 94% of cases
- Payment: 89% of cases
Time Between Activities (showing delays):
- Invoice to Payment: Mean 4.2 days
- Check Inventory to Ship: Mean 3.1 days
- Create Order to Check Inventory: Mean 1.8 days
Variant Analysis:
- Top variant (32% of cases): Create Order, Check Inventory, Ship, Invoice, Payment - 3.2 days average
- Second variant (28% of cases): Create Order, Check Inventory, Backorder, Ship, Invoice, Payment - 8.5 days average
Resource Distribution:
- Order Processing Team: 45% of cases
- Warehouse Team: 38% of cases
- Finance Team: 35% of cases
Estimated tokens: 6,200 tokens (4.8% of 128K LLM capacity)
**Insights:** With all data sections enabled, the AI assistant has comprehensive context about your order-to-cash process. Users can now ask questions like "Why do some orders take twice as long as others?" and the AI can identify that the second variant includes a backorder step that adds 5.3 days on average. The AI can spot that the Invoice-to-Payment delay of 4.2 days represents nearly half the average case duration, suggesting payment collection as an improvement opportunity. The token count of 6,200 represents only 5% of modern LLM capacity, leaving ample room for conversation history and complex questions.
### Example 2: Privacy-Aware Metadata Sharing
**Scenario:** Your company policy requires that sensitive process data cannot be shared with external cloud-based LLM services. However, you want to enable basic AI assistance that can guide users on how to use mindzieStudio features based on understanding your dataset structure without seeing actual values.
**Settings:**
- Data Level: Level 2 (Activity and Attribute Names)
- Include Activities and Attributes: Enabled
- All other sections: Disabled (automatically excluded at Level 2)
**Output:**
The calculator generates a minimal prompt containing:
Activity Names:
- Create Invoice (2,156 cases - 100%)
- Match PO (2,089 cases - 96.9%)
- Match Receipt (1,867 cases - 86.6%)
- Approve Invoice (2,145 cases - 99.5%)
- Pay Invoice (2,001 cases - 92.8%)
Case Attributes:
- Invoice_Number (String)
- Vendor_Name (String)
- Invoice_Amount (Decimal)
- Currency (String)
- Payment_Terms (String)
- Department (String)
Event Attributes:
- Activity (String)
- Timestamp (DateTime)
- Resource (String)
- Approval_Level (String)
Estimated tokens: 450 tokens
**Insights:** At Level 2, the AI can understand your dataset structure and help users navigate mindzieStudio features. For example, when a user asks "How can I analyze invoice processing by vendor?", the AI can see that a Vendor_Name attribute exists and recommend using the Breakdown by Categories calculator with Vendor_Name as the category. However, the AI cannot answer questions about specific vendors or actual processing statistics because no values or calculated metrics are shared. This privacy-aware approach enables helpful guidance while maintaining data confidentiality and complying with strict data governance policies.
### Example 3: Selective Data Sharing for Performance
**Scenario:** You want to enable AI analysis focused on process flow and bottleneck identification, but you want to minimize token usage to reduce LLM API costs and improve response times. You don't need resource or attribute analysis for your current use case.
**Settings:**
- Data Level: Level 3 (Activities, Attributes, and Calculated Values)
- Include Activities and Attributes: Enabled
- Include Attribute Breakdown: Disabled
- Include Time Between Activities: Enabled
- Include Duration Histogram: Enabled
- Include Dataset Information: Enabled
- Include Start and End Frequencies: Enabled
- Include Resource Frequency: Disabled
- Include Variant Information: Enabled
**Output:**
The calculator generates a focused prompt containing process flow data:
Dataset Overview:
- 1,847 purchase orders
- October 1 - December 31, 2024
- Average duration: 8.5 days
Time Between Activities:
- Submit Request to First Approval: Mean 3.2 days (bottleneck identified)
- First Approval to Second Approval: Mean 1.1 days
- Second Approval to PO Creation: Mean 0.8 days
- PO Creation to Vendor Confirmation: Mean 2.4 days
Duration Histogram:
- 0-3 days: 412 cases (22%)
- 3-7 days: 628 cases (34%)
- 7-14 days: 521 cases (28%)
- 14+ days: 286 cases (16%)
Process Variants:
- Standard approval path (65%): 7.2 days average
- Expedited path (20%): 3.1 days average
- Escalation path (15%): 15.8 days average
Estimated tokens: 2,100 tokens (67% reduction from full data)
**Insights:** By disabling Attribute Breakdown and Resource Frequency sections, you reduce token consumption by 67% while maintaining full capability for process flow analysis. The AI can still identify that the Submit-to-First-Approval delay of 3.2 days is the primary bottleneck, and that escalation cases take more than twice as long as standard cases. This selective sharing approach reduces LLM API costs from approximately $0.062 per query to $0.021 per query (assuming $0.01 per 1,000 tokens), making AI-assisted analysis more cost-effective for organizations processing thousands of queries monthly.
### Example 4: Token Budget Management and Cost Estimation
**Scenario:** As a system administrator, you need to understand the token consumption and estimated costs for different data sharing configurations before enabling AI features organization-wide.
**Settings:**
- Data Level: Level 4 (All Data)
- All sections: Enabled
**Output:**
The calculator provides comprehensive token metrics:
Section Breakdown:
- Activities and Attributes: 1,240 tokens (3,100 characters)
- Attribute Breakdown: 2,341 tokens (5,852 characters)
- Time Between Activities: 892 tokens (2,230 characters)
- Duration Histogram: 324 tokens (810 characters)
- Dataset Information: 187 tokens (468 characters)
- Start and End Frequencies: 156 tokens (390 characters)
- Resource Frequency: 412 tokens (1,030 characters)
- Variant Information: 621 tokens (1,552 characters)
Total Statistics:
- Total characters: 15,432
- Total words: 3,124
- Estimated tokens: 6,173 tokens
- Capacity used: 4.8% of 128K token window
- Estimated cost per query: $0.062 (at $0.01 per 1K tokens)
**Insights:** The token usage analysis reveals that Attribute Breakdown is the most expensive section at 2,341 tokens, consuming 38% of the total budget. If cost reduction is needed, disabling this single section would cut token usage by 38% while maintaining process flow analysis capabilities. The 6,173 token prompt uses less than 5% of modern LLM context windows (128K tokens for GPT-4 or Claude), leaving ample capacity for conversation history and complex multi-turn interactions. At an estimated $0.062 per query with current OpenAI pricing, an organization expecting 1,000 AI queries per month should budget approximately $62 monthly for LLM API costs, not including response tokens.
### Example 5: Troubleshooting AI Assistant Responses
**Scenario:** Users report that the AI assistant cannot answer questions about resource workload distribution. You need to verify what data the AI has access to and identify the issue.
**Settings:**
- Data Level: Level 4 (All Data)
- Include Resource Frequency: Disabled (this is the problem)
- All other sections: Enabled
**Output:**
When the calculator runs without resource frequency data, the generated prompt contains:
Resource Information:
- "There are no resources selected for this dataset."
**Insights:** The diagnostic output reveals why the AI cannot answer resource-related questions - the Include Resource Frequency toggle is disabled. Even at Level 4 (All Data), individual sections must be explicitly enabled to be shared with the AI. After enabling the Include Resource Frequency setting, the calculator generates comprehensive resource statistics showing that Jane Smith handles 42% of all cases while other resources average only 12%, explaining the workload imbalance users were asking about. This highlights that the Data Level setting controls the privacy boundary, while the individual section toggles control which specific analyses are available to the AI within that privacy level.
### Example 6: Monitoring AI Data Sharing in Regulated Industries
**Scenario:** Your healthcare organization uses mindzieStudio to analyze patient treatment processes. Compliance requires that no patient-identifiable information or specific case data be shared with external AI services, but you want to enable AI assistance for aggregate process analysis that could improve patient care efficiency.
**Settings:**
- Data Level: Level 3 (Activities, Attributes, and Calculated Values)
- Include Activities and Attributes: Enabled
- Include Attribute Breakdown: Disabled (avoids sharing specific attribute values)
- Include Time Between Activities: Enabled
- Include Duration Histogram: Enabled
- Include Dataset Information: Enabled
- Include Start and End Frequencies: Enabled
- Include Resource Frequency: Disabled (avoids sharing clinician names)
- Include Variant Information: Enabled
**Output:**
The calculator generates a compliance-friendly prompt:
Dataset Summary:
- 845 treatment episodes
- January 1 - March 31, 2025
- Average duration: 4.2 days
Process Flow:
- Patient Registration to Initial Assessment: Mean 2.1 hours
- Initial Assessment to Treatment Plan: Mean 8.4 hours
- Treatment Plan to Treatment Start: Mean 14.2 hours
Variant Analysis:
- Standard treatment path (72%): 3.8 days average
- Complex care path (18%): 7.2 days average
- Emergency accelerated path (10%): 1.5 days average
No patient names, case identifiers, or resource names are included in the prompt.
**Insights:** This configuration enables the AI to identify that the Treatment-Plan-to-Treatment-Start delay of 14.2 hours represents a significant bottleneck in patient care, potentially delaying treatment initiation. The AI can recommend focusing improvement efforts on this specific transition without ever receiving patient-identifiable information. By operating at Level 3 with Attribute Breakdown and Resource Frequency disabled, the organization complies with healthcare data privacy regulations while still benefiting from AI-powered process analysis. The AI can suggest "Focus on reducing the 14-hour delay between treatment planning and treatment initiation" without knowing which specific patients experienced delays or which clinicians were involved, enabling evidence-based process improvement while maintaining patient confidentiality.
## Output
The LLM Prompts calculator generates a structured output designed for consumption by AI assistants and Large Language Models:
**Message Sections:** The calculator organizes data into multiple named sections, each with its own statistics. Each section includes metadata about word count, character count, and estimated token consumption. This modular structure allows the AI to understand which type of information comes from which analysis.
**Comprehensive Statistics:** At the bottom of the output, the calculator displays aggregate metrics including total word count, total character count, and estimated token count. These metrics help administrators understand the capacity requirements and estimate API costs when integrating with commercial LLM services.
**Token Estimation:** The calculator estimates token consumption using a 2.5 characters per token ratio, which is empirically accurate for English text mixed with JSON data structures. This estimation helps organizations budget for LLM API costs and ensure prompts fit within the context window limits of their chosen AI service (typically 128,000 tokens for modern models like GPT-4 or Claude).
**JSON-Formatted Tables:** All data sections are formatted as JSON structures that LLMs can easily parse and understand. This structured format enables the AI to accurately interpret activity frequencies, duration statistics, variant information, and other process metrics without ambiguity.
**Capacity Indicators:** For sections with large volumes of data (resources, variants, activity pairs), the calculator automatically limits output to the top 100 items and includes a note explaining the limitation. This prevents overwhelming the LLM with excessive detail while focusing on the most significant process elements.
**Privacy Status Messages:** When Data Level is set to Level 0 or Level 1, the calculator generates a message stating "The settings do not allow to share any data with the Copilot" instead of process statistics. This makes it clear to both administrators and AI systems why no data is available.
**Section-Specific Content:** Depending on the Data Level and enabled sections, the output may include activities and attribute names (Level 2+), attribute value distributions (Level 3+), time between activities (Level 3+), duration histograms (Level 3+), dataset summary statistics (Level 3+), process start and end patterns (Level 3+), resource workload distribution (Level 3+), and variant performance metrics (Level 3+).
**Interactive Integration:** While this calculator's output is designed for AI consumption, the results appear in mindzieStudio's standard calculator output format. Administrators can review the generated prompts to understand exactly what information is being shared with LLM services and verify compliance with data governance policies.
---
*This documentation is part of the mindzie Studio process mining platform.*
---
## Main Duration Pairs
Section: Calculators
URL: https://docs.mindziestudio.com/mindzie_studio/calculators/main-duration-pairs
Source: /docs-master/mindzieStudio/calculators/main-duration-pairs/page.md
# Main Duration Pairs
## Overview
The Main Duration Pairs calculator analyzes the time between activities in your most common process variants. Unlike the Time Between All Activity Pairs calculator which shows every possible activity combination, this calculator focuses on the main paths that your cases actually follow by filtering out low-frequency activities and rare variants.
This calculator helps you identify the most impactful bottlenecks by concentrating on the activity pairs that matter most to your process performance.
## Common Uses
- Focus on duration analysis for the most common process paths
- Identify bottlenecks in your main process flows without noise from rare activities
- Analyze time between directly-following activities in high-frequency variants
- Compare performance across the most traveled process routes
- Prioritize improvement efforts on activity pairs that affect the most cases
- Filter out rare variants and uncommon activities to see the big picture
## Settings
**Min. Activity Case Frequency (%):** Specify the minimum percentage of cases that must contain an activity for it to be included in the analysis.
For example, if set to 10%, only activities that appear in at least 10% of cases will be considered. This filters out rare activities that don't represent normal process behavior.
**Variant Case Coverage (%):** Specify what percentage of cases should be covered by the selected variants.
For example, if set to 90%, the calculator will select enough top variants to cover 90% of all cases. This ensures you're analyzing the most representative process flows.
**Max Variant Count:** Specify the maximum number of variants to include in the analysis.
This setting works together with Variant Case Coverage to limit the analysis scope. The calculator will use whichever limit is reached first - either the target case coverage percentage or the maximum variant count.
**Min. Pair Case (%):** Specify the minimum percentage of cases that must contain an activity pair for it to be included in the output.
For example, if set to 25%, only activity pairs that occur in at least 25% of cases will appear in the results. This filters out uncommon transitions and focuses on the main process paths.
## Examples
### Example 1: Analyzing Main Process Bottlenecks
**Scenario:** You want to identify bottlenecks in your order fulfillment process, but you want to focus only on the most common activities and process paths to avoid getting overwhelmed by rare edge cases.
**Settings:**
- Min. Activity Case Frequency (%): 10
- Variant Case Coverage (%): 90
- Max Variant Count: 100
- Min. Pair Case (%): 25
**Output:**
The calculator produces a table showing activity pairs with the following columns:
| Column | Description |
|--------|-------------|
| Activity Pair | The two activities in the format "Activity1-Activity2" |
| Activity1 | The first activity in the pair |
| Activity2 | The second activity in the pair |
| Count | Number of times this pair occurs across all cases |
| Case Count | Number of distinct cases containing this pair |
| Case Percent | Percentage of total cases containing this pair |
| Mean Duration | Average time between the two activities |
| Median Duration | Middle value of durations (less affected by outliers) |
| Maximum Duration | Longest observed duration for this pair |
| Stdev Duration | Standard deviation of durations |
| Total Duration | Sum of all durations for this pair |
| Median Absolute Deviation | Measure of duration variability |
**Insights:**
With these settings, you'll see:
- Only activities that appear in at least 10% of cases (filtering out rare exceptions)
- Only activity pairs that occur in at least 25% of cases (focusing on main paths)
- Variants covering 90% of your cases (or up to 100 variants, whichever comes first)
This filtered view helps you identify the most impactful bottlenecks. For example, if "Check Credit-Approve Order" shows a high mean duration and appears in 60% of cases, improving this transition will have a significant impact on overall process performance.
The high Case Percent values indicate which transitions affect the most customers, while the duration metrics show where time is being spent. Focus improvement efforts on pairs with both high case percentages and long durations for maximum impact.
### Example 2: Focused Analysis for Process Improvement
**Scenario:** Your process has many variations and uncommon activities due to exceptions. You want to analyze only the core process flow that represents the majority of cases.
**Settings:**
- Min. Activity Case Frequency (%): 20
- Variant Case Coverage (%): 80
- Max Variant Count: 50
- Min. Pair Case (%): 30
**Output:**
The table shows a highly filtered view of your process, displaying only:
- Activities that occur in at least 20% of cases
- Activity pairs that occur in at least 30% of cases
- The top variants that cover 80% of cases (up to 50 variants maximum)
**Insights:**
These more restrictive settings provide an even cleaner view of your core process. You might see only 10-15 activity pairs representing the absolute main process flow, making it easy to identify the 2-3 transitions that are causing the most delay.
For example, in a procurement process, you might discover that the transition from "Request Approval" to "Manager Approves" has a median duration of 5 days but only appears in 45% of cases, while "Manager Approves" to "Create PO" has a median of 2 days but appears in 80% of cases. This tells you that approval delays affect fewer cases but might warrant attention, while PO creation is a universal step that could benefit from optimization.
## Output
The Main Duration Pairs calculator provides a comprehensive table with statistical measures for each activity pair that meets your filtering criteria.
**Key Features:**
- **Filtered Focus:** Only shows activity pairs from common variants and frequent activities
- **Case Impact:** Shows what percentage of cases are affected by each transition
- **Duration Statistics:** Multiple metrics (mean, median, max, etc.) to understand timing patterns
- **Clickable Rows:** Click any row to filter your analysis to cases containing that specific activity pair
**Interpreting Results:**
- Look for pairs with high Case Percent and high Mean/Median Duration - these are your biggest improvement opportunities
- Compare Mean vs. Median - large differences indicate outliers that may need investigation
- Use Stdev and MAD to understand consistency - high variation suggests unpredictable processes
- Total Duration shows cumulative impact across all cases
This calculator is ideal when you want to cut through process complexity and focus on optimizing the paths that matter most to your business outcomes.
---
*This documentation is part of the mindzie Studio process mining platform.*
---
## Maximum Value
Section: Calculators
URL: https://docs.mindziestudio.com/mindzie_studio/calculators/maximum-value
Source: /docs-master/mindzieStudio/calculators/maximum-value/page.md
# Maximum Value
## Overview
The Maximum Value calculator finds the highest value of a selected numerical attribute across all cases or events. This calculator is useful for identifying peak values, outliers, and upper bounds in your process data.
## Common Uses
- Calculate the maximum duration of all cases
- Find the longest idle time
- Identify the highest invoice amount
- Determine peak processing times
- Add maximum value metrics to dashboards
## Settings
**Attribute Name:** Select the numerical attribute for which you want to calculate the maximum value.
## Examples
### Example 1: Maximum Case Duration
**Scenario:** You want to identify the longest case duration to understand worst-case processing times.
**Settings:**
- Attribute Name: Case Duration
**Output:**
The output shows the duration in format Day.Hour:Min:Sec.
Click "Add to Dashboard" to display this metric on your dashboard with automatic formatting.
**Insights:** This helps you identify outlier cases that take significantly longer than average, which may require investigation.
### Example 2: Maximum Total Invoice Value
**Scenario:** You want to find the highest invoice amount to understand peak transaction values.
**Settings:**
- Attribute Name: Total Invoice Value
**Output:**
The calculator displays the maximum invoice amount found in the dataset.
Click "Add to Dashboard" to add this metric with appropriate formatting.
**Insights:** Useful for understanding the range of transaction values and identifying unusually large orders that may require special handling.
---
*This documentation is part of the mindzie Studio process mining platform.*
---
## Median Value
Section: Calculators
URL: https://docs.mindziestudio.com/mindzie_studio/calculators/median-value
Source: /docs-master/mindzieStudio/calculators/median-value/page.md
# Median Value
## Overview
The Median Value calculator finds the middle value of a selected numerical attribute across all cases or events in your process. Unlike the average, the median is not affected by extreme outliers, making it a more robust measure of central tendency when your data contains unusual values. The median represents the 50th percentile - half of all values are below it, and half are above it.
## Common Uses
- Calculate median invoice amounts when outliers might skew the average
- Determine median processing times for realistic performance expectations
- Find median payment timeliness to understand typical payment behavior
- Measure median order values for more accurate forecasting
- Identify the middle point of attribute distributions when data is skewed
- Add median value metrics to dashboards for outlier-resistant analysis
## Settings
**Attribute Name:** Select the numerical attribute for which you want to calculate the median value. This can be any case or event attribute containing numeric data.
## Examples
### Example 1: Median Payment Timeliness
**Scenario:** Your accounts payable process has a few invoices with extremely early payments (special discounts) and some very late payments (disputed invoices). You want to understand typical payment behavior without these extremes skewing your results.
**Settings:**
- Attribute Name: PaymentTimeliness
**Output:**
The output shows a single value, such as "-5 days", indicating that the median payment is made 5 days early (negative values indicate early payment). This differs from the average of "-16 days" because a few very early payments (30-60 days early) were pulling the average down.
**Insights:** The median reveals that most payments are actually only slightly early, while the average was heavily influenced by a small number of exceptionally early payments. This gives you a more realistic picture of typical payment behavior and helps you set appropriate payment scheduling policies.
### Example 2: Median Invoice Processing Time
**Scenario:** Your invoice processing times range from 1 day to 45 days, with most invoices processed within a week but a few stuck in approval loops. You want to know the typical processing time without being misled by these outlier cases.
**Settings:**
- Attribute Name: Case Duration
**Output:**
The calculator displays "3.10:24:15" (3 days, 10 hours, 24 minutes, 15 seconds), showing that half of all invoices are processed faster than this, and half take longer. This is much more representative than the average of 7 days, which was inflated by the few cases stuck for 30-45 days.
**Insights:** This median value helps you set realistic SLAs and customer expectations. You now know that typical cases complete in about 3.5 days, and can investigate the outliers separately without them distorting your understanding of normal operations.
### Example 3: Median Order Value in E-commerce
**Scenario:** Your online store has order values ranging from $10 to $5,000. A few very large corporate orders are making the average order value misleading for marketing analysis.
**Settings:**
- Attribute Name: Total Order Value
**Output:**
The calculator shows a median of $87, while the average is $245. This reveals that most customers spend around $87, but a few large orders are dramatically increasing the average.
**Insights:** Use the median value of $87 for more accurate marketing decisions, such as setting free shipping thresholds or designing promotional offers. The average of $245 was misleading because it was skewed by a small number of high-value orders.
### Example 4: Median Time to First Response
**Scenario:** Your customer service process tracks time from case creation to first response. Most responses occur within 2 hours, but some cases received during off-hours wait until the next business day.
**Settings:**
- Attribute Name: Time To First Response
**Output:**
The median value is "0.01:45:00" (1 hour, 45 minutes), showing that half of all customers receive their first response within this timeframe. The average was 4.5 hours due to overnight cases.
**Insights:** The median provides a better performance metric for your team's responsiveness during business hours. You can now set SLAs based on typical performance and handle after-hours cases separately.
## Output
The calculator displays a single numerical value representing the median (middle value) of the selected attribute across all applicable cases or events. When the dataset has an even number of values, the median is calculated as the average of the two middle values.
The median is particularly valuable when:
- Your data contains outliers or extreme values
- You need a robust measure that's resistant to unusual cases
- You want to understand typical performance rather than overall performance
- Your data distribution is skewed rather than normally distributed
---
*This documentation is part of the mindzie Studio process mining platform.*
---
## Metadata
Section: Calculators
URL: https://docs.mindziestudio.com/mindzie_studio/calculators/metadata
Source: /docs-master/mindzieStudio/calculators/metadata/page.md
# Metadata
## Overview
The Metadata calculator displays comprehensive technical information about how your dataset was generated, extracted, and configured. This zero-configuration calculator provides essential metadata including versioning details, ETL configuration, timezone settings, and core column mappings.
Unlike calculators that analyze process data, Metadata reveals the technical foundation of your dataset - when it was extracted, which versions of the ETL pipeline were used, how timestamps are interpreted, and what column names map to core process mining concepts like case ID and activity.
## Common Uses
- Verify data freshness by checking extraction timestamp and hours since last update
- Troubleshoot timezone issues by reviewing timezone configuration and local time settings
- Document data lineage for compliance and audit requirements
- Validate ETL configuration by confirming transformer version and settings
- Support technical troubleshooting by identifying core column names for custom scripts
- Track dataset versioning across multiple environments (development, test, production)
## Settings
This calculator requires no configuration. It automatically retrieves all metadata from your dataset and displays it in a comprehensive table.
The only standard fields available are:
**Title:** Optional custom title for the output (defaults to "Metadata")
**Description:** Optional description to provide context about this metadata view
## Examples
### Example 1: Verifying Data Freshness for Decision-Making
**Scenario:** Your finance team is preparing for a monthly business review meeting and needs to confirm they're analyzing the most current accounts payable data. Stale data could lead to incorrect conclusions about payment performance.
**Settings:**
- Title: "Data Currency Check"
- Description: "AP Process - Monthly Review"
**Output:**
The calculator displays a two-column table showing all dataset metadata. Key metrics for data freshness include:
- Last successful data extraction: 2025-10-19 6:00:00 AM
- Hours since last extraction: 2.5
- Extraction Version: 3.2.1
- Current Time: 2025-10-19 8:30:00 AM
- TimeZoneName: Eastern Standard Time
- ProcessDisplayName: Accounts Payable Process
**Insights:** The data was extracted just 2.5 hours ago at 6:00 AM this morning, confirming it reflects yesterday's completed work. The team can confidently proceed with their analysis knowing they're working with current data. If the "Hours since last extraction" had shown several days, they would need to request a data refresh before the meeting.
### Example 2: Troubleshooting Timezone Discrepancies
**Scenario:** Users report that process timestamps don't match the times they see in the source ERP system. Some cases appear to start at 4:00 AM when the business doesn't open until 8:00 AM. You suspect a timezone configuration issue.
**Settings:**
- Title: "Timezone Configuration Review"
- Description: "Investigating timestamp interpretation issues"
**Output:**
The Metadata calculator reveals the timezone configuration:
- TimeZoneName: UTC
- IsLocalTime: False
- Current Time: 2025-10-19 12:30:00 PM
- Start Time: StartTime
- End Time: EndTime
- UseDateOnlySorting: False
**Insights:** The dataset is configured to use UTC time, not local time (IsLocalTime: False), which explains the 4-hour discrepancy. The business operates in Eastern Time (UTC-4), so what appears as 4:00 AM in the data is actually 8:00 AM local time. The team needs to either reconfigure the ETL to use Eastern Time or educate users that all times are displayed in UTC. This prevents misinterpretation of process timing and performance metrics.
### Example 3: Data Lineage Documentation for Audit Compliance
**Scenario:** Your company's internal audit team requires documentation of data sources, extraction methods, and versioning for all process mining analyses used in compliance reporting. They need to verify the traceability and reliability of your invoice processing analysis.
**Settings:**
- Title: "Data Lineage - Q4 2025 Compliance Report"
- Description: "Invoice Processing Analysis Metadata"
**Output:**
The Metadata table provides comprehensive lineage information:
- ProcessDisplayName: Invoice Processing
- TransformerFilename: InvoiceProcessing_SAP_Config.json
- TransformerVersion: 2.1.0
- Extraction Version: 1.8.3
- EngineAttributeVersion: 8.0.2
- ProcessAttributeVersion: 3.4.1
- Last successful data extraction: 2025-10-15 11:45:00 PM
- Etl Notes: Full extraction from SAP ECC Production
- Description: Q4 2025 invoice processing for compliance reporting
- BaseCurrency: USD
**Insights:** The audit team can now trace exactly how the data was generated: extracted from SAP ECC Production on October 15th using transformer configuration version 2.1.0 and extraction pipeline version 1.8.3. The documented versions allow them to verify that approved, validated ETL processes were used. The "Etl Notes" confirm the data source was the production environment, not a test system. This complete lineage trail satisfies audit requirements for data provenance.
### Example 4: Supporting Custom Python Script Development
**Scenario:** A data analyst is developing a custom Python script to export specific case attributes for further analysis in R. They need to know the exact column names used in the dataset to write correct queries.
**Settings:**
- Title: "Column Mapping Reference"
- Description: "Core column names for custom scripts"
**Output:**
The Metadata calculator displays the core column mappings:
- CaseId: PurchaseOrderNumber
- Activity: ProcessStep
- Start Time: EventTimestamp
- End Time: EventTimestamp
- Resource: PerformedBy
- ExpectedOrder: StepSequence
**Insights:** The analyst discovers that this dataset uses custom column names rather than defaults. The case identifier is stored in "PurchaseOrderNumber" (not "CaseId"), activities are in "ProcessStep" (not "Activity"), and resources are in "PerformedBy" (not "Resource"). Armed with these exact column names, the analyst can write accurate SQL queries and Python scripts that reference the correct fields. Without this information, the script would fail with column-not-found errors.
### Example 5: Version Compatibility Check Across Environments
**Scenario:** Your organization maintains three process mining environments: development, test, and production. Before promoting a new dashboard to production, you need to verify that all environments use compatible versions of the data extraction pipeline to ensure consistent behavior.
**Settings:**
- Title: "Version Compatibility - Production Environment"
- Description: "Pre-deployment verification"
**Output:**
Production environment metadata shows:
- Derived Attribute Version: 2.3.1
- Extraction Version: 1.9.0
- ProcessAttributeVersion: 3.5.0
- EngineAttributeVersion: 8.1.0
- TransformerVersion: 2.2.0
Compared against test environment (from a separate Metadata calculator):
- Derived Attribute Version: 2.3.1 (MATCH)
- Extraction Version: 1.9.0 (MATCH)
- ProcessAttributeVersion: 3.4.1 (MISMATCH - Production newer)
- EngineAttributeVersion: 8.1.0 (MATCH)
- TransformerVersion: 2.2.0 (MATCH)
**Insights:** The environments are largely compatible, with four out of five versions matching exactly. However, production has a newer ProcessAttributeVersion (3.5.0 vs 3.4.1), indicating that production has additional or modified process-specific attributes. Before deploying the dashboard from test to production, the team needs to verify whether it depends on attributes that exist in test but may have changed in production. This proactive check prevents deployment failures and ensures consistent analysis across environments.
### Example 6: Monitoring Automated ETL Pipeline Health
**Scenario:** Your data engineering team runs a nightly ETL job that should refresh process mining data by 6:00 AM each morning. The operations team needs a way to quickly verify the pipeline ran successfully without checking log files.
**Settings:**
- Title: "ETL Pipeline Status"
- Description: "Nightly extraction monitoring - Order-to-Cash"
**Output:**
The Metadata calculator shows:
- Last successful data extraction: 2025-10-18 5:45:00 AM
- Hours since last extraction: 26.5
- Extraction Version: 1.9.0
- Etl Notes: Incremental extraction completed successfully
- Current Time: 2025-10-19 8:15:00 AM
**Insights:** The "Hours since last extraction" shows 26.5 hours, meaning the last successful extraction was yesterday morning, not this morning. The nightly job has failed. The operations team immediately investigates and discovers a database connection timeout that prevented last night's extraction from completing. By catching this early in the morning, they can rerun the extraction before business users notice they're looking at day-old data. Without this monitoring, users might make operational decisions based on stale information without realizing it.
## Output
The Metadata calculator produces a single table with two columns displaying all available dataset metadata.
**Table Structure:**
**Name:** The name of each metadata property or configuration setting
**Value:** The corresponding value for that property
### Categories of Information
The metadata is organized into several logical groups:
**Versioning Information:**
- Derived Attribute Version: Version of derived attributes schema
- Extraction Version: Version identifier from ETL extraction
- ProcessAttributeVersion: Process-specific attribute schema version
- EngineAttributeVersion: Engine attribute schema version
- TransformerVersion: Version of the data transformer used
**Process Configuration:**
- ProcessName: Internal process identifier
- ProcessDisplayName: Human-readable process name
- BaseCurrency: Currency used for monetary calculations
**Time Configuration:**
- TimeZoneName: Configured timezone for the dataset
- IsLocalTime: Whether timestamps are in local time (versus UTC)
- Current Time: Current time based on timezone settings
- UseDateOnlySorting: Whether events are sorted by date only (ignoring time)
**Core Column Mapping:**
- CaseId: Name of the case identifier column
- Activity: Name of the activity column
- Start Time: Name of the start time column
- End Time: Name of the end time column
- Resource: Name of the resource column
- ExpectedOrder: Name of the expected order column
**ETL Configuration:**
- TransformerFilename: Name of the transformer/configuration file
- Order Event Algorithm: Algorithm used for event ordering
- Last successful data extraction: Timestamp of last successful ETL run
- Hours since last extraction: Calculated age of the data
- Etl Notes: Notes from the ETL process
- Notes: General dataset notes
- Description: Dataset description
### Understanding the Output
**Data Freshness:** Check "Hours since last extraction" to determine if your data is current. Values over 24-48 hours may indicate ETL pipeline issues requiring investigation.
**Timezone Interpretation:** The combination of "TimeZoneName" and "IsLocalTime" determines how timestamps are displayed. If IsLocalTime is False, all times are shown in UTC regardless of the TimeZoneName setting.
**Version Tracking:** All version fields (Extraction Version, TransformerVersion, etc.) help track which ETL pipeline and schema versions generated the data. This is critical for troubleshooting issues across environment deployments.
**Column Names:** The core column mappings show the actual column names used in your dataset, which may differ from standard defaults if custom mapping was configured during data extraction.
**Null Values:** Some properties may show empty values or "Unknown" if that information wasn't available during extraction or hasn't been configured.
---
*This documentation is part of the mindzie Studio process mining platform.*
---
## Minimum Value
Section: Calculators
URL: https://docs.mindziestudio.com/mindzie_studio/calculators/minimum-value
Source: /docs-master/mindzieStudio/calculators/minimum-value/page.md
# Minimum Value
## Overview
The Minimum Value calculator finds the lowest value of a selected numerical attribute across all cases or events. This calculator helps you identify minimum processing times, smallest transaction values, and lower bounds in your process data.
## Common Uses
- Calculate the minimum duration of all cases
- Find the smallest invoice amount
- Identify fastest processing times
- Determine lower bounds for performance metrics
- Add minimum value metrics to dashboards
## Settings
**Attribute Name:** Select the numerical attribute for which you want to calculate the minimum value.
## Examples
### Example 1: Minimum Case Duration
**Scenario:** You want to identify the shortest case duration to understand best-case processing times.
**Settings:**
- Attribute Name: Case Duration
**Output:**
The output shows the duration in format Day.Hour:Min:Sec.
Click "Add to Dashboard" to display this metric on your dashboard with automatic formatting.
**Insights:** This reveals the fastest possible processing time under ideal conditions, which can serve as a benchmark for process optimization.
### Example 2: Minimum Total Invoice Value
**Scenario:** You want to find the smallest invoice amount to understand the lower range of transaction values.
**Settings:**
- Attribute Name: Total Invoice Value
**Output:**
The calculator displays the minimum invoice amount found in the dataset.
Dashboard view shows the value with appropriate formatting.
**Insights:** Useful for setting minimum order values, understanding transaction ranges, and identifying potentially erroneous low-value entries.
---
*This documentation is part of the mindzie Studio process mining platform.*
---
## Pivot Table
Section: Calculators
URL: https://docs.mindziestudio.com/mindzie_studio/calculators/pivot-table
Source: /docs-master/mindzieStudio/calculators/pivot-table/page.md
# Pivot Table
## Overview
The Pivot Table calculator creates a cross-tabulation view that organizes and summarizes your process data by multiple dimensions simultaneously. This powerful analytical tool allows you to pivot case or event attributes across columns while aggregating metrics such as counts, sums, averages, or other statistical measures. Unlike the Breakdown by Categories calculator which shows one or two categorical breakdowns, the Pivot Table creates a traditional spreadsheet-style pivot table with rows and columns.
The calculator transforms raw process data into an organized summary table where you can analyze relationships between different categorical dimensions and understand how various metrics distribute across those dimensions.
## Common Uses
- Create financial summary reports showing costs or revenues by department and time period
- Analyze resource workload distribution across different activities and organizational units
- Compare performance metrics across multiple categorical dimensions
- Generate compliance reports showing conformance rates by category and subcategory
- Build executive dashboards with multi-dimensional process metrics
- Perform cross-tabulation analysis to identify patterns across multiple process attributes
## Settings
**Row Attribute:** Select the case or event attribute that will form the rows of your pivot table. Each unique value of this attribute becomes a row in the output table.
**Column Attribute (optional):** Select a second attribute that will form the columns of your pivot table. Each unique value creates a separate column. If not specified, the pivot table displays a single-column summary.
**Aggregate Function:** Choose how to aggregate the data at each row-column intersection:
| Function | Description | Use When |
|----------|-------------|----------|
| Count | Counts the number of cases or events | You want to know how many items fall into each category |
| Sum | Adds up values of a selected attribute | You need totals (e.g., total costs, total revenue) |
| Average | Calculates the mean of a selected attribute | You want typical values (e.g., average processing time) |
| Minimum | Finds the smallest value | You need to identify lowest values in each category |
| Maximum | Finds the largest value | You need to identify highest values in each category |
| Median | Calculates the middle value | You want the typical value less affected by outliers |
**Value Attribute:** For aggregate functions other than Count (such as Sum or Average), select the numerical attribute you want to aggregate. This field is not needed for Count operations.
**Sort Order:** Choose whether to sort rows:
- **Ascending:** Sort alphabetically or numerically from lowest to highest
- **Descending:** Sort from highest to lowest (useful for identifying top categories)
**Max Rows:** Specify the maximum number of rows to display. This is useful when you have many unique values but only want to see the top N categories. Leave empty to show all rows.
## Examples
### Example 1: Resource Activity Summary
**Scenario:** You want to create a summary table showing how many times each resource performed each activity in your process. This helps you understand workload distribution and identify resource specialization patterns.
**Settings:**
- Row Attribute: Resource
- Column Attribute: Activity Name
- Aggregate Function: Count
- Max Rows: 20
**Output:**
The calculator produces a pivot table with resources as rows and activities as columns. Each cell shows the number of times that resource performed that activity:
| Resource | Create Order | Approve Order | Process Payment | Ship Items | Close Order | Total |
|----------|--------------|---------------|-----------------|------------|-------------|-------|
| Alice Johnson | 245 | 189 | 0 | 0 | 234 | 668 |
| Bob Smith | 0 | 0 | 456 | 0 | 0 | 456 |
| Carol White | 123 | 145 | 234 | 0 | 198 | 700 |
| David Brown | 0 | 0 | 0 | 567 | 0 | 567 |
| Emma Davis | 189 | 234 | 123 | 0 | 212 | 758 |
**Insights:** This pivot table reveals clear activity specialization patterns. Bob Smith exclusively handles payment processing (456 events), while David Brown specializes in shipping operations (567 events). Alice, Carol, and Emma handle multiple activities, suggesting they are generalists. Emma has the highest total activity count (758), indicating she is your most active resource. The pivot format makes it easy to identify workload imbalances - for example, only three resources handle order approval (Alice, Carol, Emma), which could be a bottleneck. You can click on any cell to drill down into the specific cases where that resource performed that activity.
### Example 2: Department Cost Analysis by Month
**Scenario:** You need to create a financial report showing total costs by department across different months, helping you track spending patterns and identify departments with unusual cost variations.
**Settings:**
- Row Attribute: Department
- Column Attribute: Case Start Month
- Aggregate Function: Sum
- Value Attribute: Total Cost
- Sort Order: Descending
**Output:**
The calculator creates a pivot table with departments as rows and months as columns, showing total costs for each combination:
| Department | January | February | March | April | May | Row Total |
|------------|---------|----------|-------|-------|-----|-----------|
| Operations | $456,789 | $478,234 | $502,456 | $489,123 | $495,678 | $2,422,280 |
| Sales | $234,567 | $245,678 | $256,789 | $267,890 | $278,901 | $1,283,825 |
| IT | $189,234 | $195,678 | $198,234 | $201,456 | $205,678 | $990,280 |
| HR | $89,234 | $92,345 | $87,234 | $91,456 | $93,678 | $453,947 |
| Finance | $67,890 | $71,234 | $69,345 | $72,456 | $74,567 | $355,492 |
**Insights:** The pivot table provides a clear financial overview. Operations has the highest total costs at $2.4M over five months, which is expected for the largest department. Operations shows a steady upward trend from $456K in January to $495K in May, indicating either growing activity or increasing costs per case. Sales also shows consistent month-over-month growth ($234K to $278K), possibly reflecting business expansion. IT costs are relatively stable around $195-205K per month. HR shows slight variation (dip in March to $87K), which might warrant investigation. This pivot format makes it easy to spot both total spending by department (row totals) and monthly trends across all departments (column totals).
### Example 3: Conformance Analysis by Variant and Department
**Scenario:** You want to understand which process variants have conformance issues and how this varies across different departments. This helps you target process improvement efforts.
**Settings:**
- Row Attribute: Process Variant
- Column Attribute: Department
- Aggregate Function: Count
- Max Rows: 10
**Output:**
| Variant | Sales | Operations | Customer Service | Total |
|---------|-------|------------|------------------|-------|
| Standard Path | 1,234 | 2,456 | 1,789 | 5,479 |
| Skip Approval | 234 | 67 | 456 | 757 |
| Rework Loop | 123 | 345 | 234 | 702 |
| Express Processing | 456 | 189 | 234 | 879 |
| Manual Override | 89 | 234 | 123 | 446 |
**Insights:** The Standard Path is most common across all departments (5,479 cases total), which is positive. However, the "Skip Approval" variant appears 757 times across all departments, with the highest occurrence in Customer Service (456 cases). This suggests Customer Service may be under pressure to bypass approval steps. The "Rework Loop" variant appears 702 times, with Operations showing the highest count (345), indicating possible quality issues in that department. Sales shows high usage of "Express Processing" (456 cases), which may be legitimate expedited handling or could indicate shortcuts. By clicking on specific cells, you can drill down to investigate individual cases and understand why these non-standard variants are occurring.
### Example 4: Average Case Duration by Activity Combination
**Scenario:** You want to identify which combinations of first and last activities result in the longest average case durations, helping you understand which process paths are slowest.
**Settings:**
- Row Attribute: First Activity
- Column Attribute: Last Activity
- Aggregate Function: Average
- Value Attribute: Case Duration (Days)
- Sort Order: Descending
**Output:**
| First Activity | Standard Close | Manual Close | Cancelled | Exception Close | Average |
|----------------|----------------|--------------|-----------|-----------------|---------|
| Manual Entry | 12.5 days | 18.7 days | 8.3 days | 23.4 days | 15.7 days |
| Auto Import | 6.2 days | 14.3 days | 5.1 days | 19.8 days | 11.4 days |
| Web Submission | 5.8 days | 13.9 days | 4.8 days | 18.2 days | 10.7 days |
| Email Receipt | 8.9 days | 16.5 days | 6.7 days | 21.3 days | 13.4 days |
**Insights:** Cases starting with Manual Entry take the longest on average (15.7 days), suggesting this entry method may introduce complexity or errors. The "Exception Close" path is consistently the slowest regardless of how the case starts (ranging from 18.2 to 23.4 days), which makes sense as exceptions require special handling. Manual Entry cases that end in Exception Close have the worst combination at 23.4 days average duration. Auto Import and Web Submission cases are fastest overall (11.4 and 10.7 days average), indicating these digital channels may have better data quality. The pivot table format makes it easy to compare all combinations and identify the highest-impact improvement opportunities - focusing on reducing Manual Entry cases or streamlining Exception Close handling could significantly improve average durations.
### Example 5: Resource Performance Scorecard
**Scenario:** You need to create a performance scorecard showing average case duration for each resource across different case complexity categories.
**Settings:**
- Row Attribute: Resource
- Column Attribute: Case Complexity
- Aggregate Function: Average
- Value Attribute: Case Duration (Hours)
- Sort Order: Ascending
- Max Rows: 15
**Output:**
| Resource | Simple | Medium | Complex | Very Complex | Overall Average |
|----------|--------|--------|---------|--------------|-----------------|
| Alice Chen | 2.3 hrs | 5.7 hrs | 12.4 hrs | 28.5 hrs | 12.2 hrs |
| Bob Martinez | 2.8 hrs | 6.2 hrs | 13.1 hrs | 31.2 hrs | 13.3 hrs |
| Carol Taylor | 2.1 hrs | 5.4 hrs | 11.8 hrs | 26.7 hrs | 11.5 hrs |
| David Wilson | 3.1 hrs | 6.8 hrs | 14.5 hrs | 34.2 hrs | 14.7 hrs |
| Emma Johnson | 2.2 hrs | 5.6 hrs | 12.1 hrs | 27.8 hrs | 11.9 hrs |
**Insights:** Carol Taylor shows the best performance across all complexity categories with an overall average of 11.5 hours, while David Wilson takes the longest at 14.7 hours. The consistency of Carol's performance across all complexity levels (2.1 to 26.7 hours) suggests strong skills regardless of case difficulty. All resources show appropriate duration scaling from Simple to Very Complex cases, which validates that the complexity categorization is meaningful. David's performance on Very Complex cases (34.2 hours) is notably higher than Carol's (26.7 hours), suggesting he might benefit from additional training or support on complex cases. This pivot table format makes it easy to identify both top performers (Carol, Emma, Alice) and those who might need additional support (David), while also showing that the team appropriately allocates more time to complex cases.
### Example 6: Quality Metrics Dashboard
**Scenario:** You want to create a quality dashboard showing the percentage of cases with quality issues across different product lines and customer segments.
**Settings:**
- Row Attribute: Product Line
- Column Attribute: Customer Segment
- Aggregate Function: Average
- Value Attribute: Quality Score (0-100)
**Output:**
| Product Line | Enterprise | Mid-Market | Small Business | Consumer | Average |
|--------------|------------|------------|----------------|----------|---------|
| Premium | 94.5 | 92.3 | 89.7 | 87.2 | 90.9 |
| Standard | 89.2 | 87.6 | 84.3 | 82.1 | 85.8 |
| Economy | 85.7 | 83.4 | 79.8 | 77.5 | 81.6 |
| Custom | 96.2 | 94.8 | 91.2 | 88.9 | 92.8 |
**Insights:** Custom products show the highest quality scores across all customer segments (92.8 average), likely due to personalized attention and quality control. Premium products also perform well (90.9 average). There is a clear quality gradient across customer segments - Enterprise customers receive higher quality (94.5 for Premium) compared to Consumer customers (87.2 for Premium), which might reflect different service levels or SLAs. Economy products show the lowest quality scores overall (81.6 average), particularly for Consumer segment (77.5), which is approaching concerning levels. The 17.5 point gap between Custom/Enterprise (96.2) and Economy/Consumer (77.5) suggests significant process differences. This pivot table helps you prioritize improvement efforts - focus on Economy products for Consumer and Small Business segments where quality is lowest.
## Output
The Pivot Table calculator displays a spreadsheet-style table with rows corresponding to unique values of your row attribute and columns corresponding to unique values of your column attribute (if specified). Each cell contains the aggregated value for that row-column combination.
**Row Totals:** When column attributes are specified, the calculator typically includes a row total column showing the aggregate across all columns for each row.
**Column Totals:** A total row at the bottom shows the aggregate across all rows for each column.
**Interactive Features:** Click on any cell value to drill down and view the specific cases that contribute to that cell's value. This enables detailed investigation of any category combination.
**Export Options:** Export the pivot table to Excel or CSV for further analysis, reporting, or sharing with stakeholders.
**Visualization:** Depending on your data, the pivot table can be visualized as a heat map with color coding to highlight high and low values, making patterns easier to spot visually.
**Large Tables:** For pivot tables with many rows or columns, use horizontal and vertical scrolling to navigate the full table. Consider using the Max Rows setting to focus on top categories.
---
*This documentation is part of the mindzie Studio process mining platform.*
---
## Process Map
Section: Calculators
URL: https://docs.mindziestudio.com/mindzie_studio/calculators/process-map
Source: /docs-master/mindzieStudio/calculators/process-map/page.md
# Process Map
## Overview
The Process Map calculator creates an interactive visual representation of how cases flow through your process. It displays activities as nodes and transitions between activities as edges, with frequencies and performance metrics overlaid on the visualization. This provides an intuitive, at-a-glance understanding of your actual process flow compared to your intended process design.
The process map automatically identifies all unique activities, calculates how frequently each transition occurs, and highlights the most common process variants. Unlike static process diagrams, the interactive map allows you to explore different process paths, drill down into specific transitions, and filter the view to focus on relevant patterns.
## Common Uses
- Visualize the actual process flow to understand how work moves through your organization
- Identify bottlenecks by examining where cases slow down or accumulate
- Discover process deviations and non-standard workflows that bypass controls
- Compare actual process execution against intended process design
- Focus on high-frequency paths to prioritize improvement efforts
- Explore rework loops and identify where cases cycle back through activities
- Present process findings to stakeholders using clear, visual representations
## Settings
**Default Number of Top Variants:** Specify how many of the most common process variants should be highlighted when the map initially loads. This setting helps simplify complex processes by focusing on the paths that account for the majority of cases.
The default value is 5 variants, which typically balances comprehensiveness with clarity. You can set this to a lower number (1-3) for executive dashboards requiring simple views, or a higher number (10-20) for detailed process analysis sessions. Users can adjust this interactively in the map after it loads.
**Legacy Map Mode:** An optional setting for maintaining consistency with older historical notebooks. When enabled, the visualization uses older rendering algorithms and styling. This is typically left disabled (false) for all new analysis work.
## Examples
### Example 1: Discovering Purchase Order Approval Bottlenecks
**Scenario:** Your procurement team reports that purchase orders are taking too long to approve, but you are not sure where the delays occur. You want to visualize the approval process to identify the bottleneck activities.
**Settings:**
- Default Number of Top Variants: 5
- Legacy Map Mode: false
**Output:**
The process map displays your purchase order flow with nodes representing activities and edges showing transitions. The visualization reveals:
- Create PO -> Submit for Approval (1,847 cases, avg 2 hours)
- Submit for Approval -> Manager Review (1,847 cases, avg 3 days - highlighted in red as slow)
- Manager Review -> Finance Review (1,245 cases, avg 1 day)
- Manager Review -> Reject (602 cases, avg 4 hours)
- Finance Review -> Approve (1,098 cases, avg 2 hours)
- Finance Review -> Senior Manager Review (147 cases, avg 5 days - highlighted in red)
The map shows the top 5 variants, with the happy path (Create -> Submit -> Manager -> Finance -> Approve) representing 59% of all cases.
**Insights:** The visualization immediately identifies two bottleneck activities: Manager Review takes an average of 3 days, and Senior Manager Review takes 5 days. The transition from Submit for Approval to Manager Review is highlighted in red, indicating it contributes most significantly to overall duration. Additionally, 32% of cases (602 out of 1,847) get rejected at Manager Review, suggesting either poor PO quality or unclear approval criteria. By filtering the map to show only rejected cases, you can explore what distinguishes them from approved cases.
### Example 2: Visualizing Invoice Processing Compliance
**Scenario:** Your finance department must follow a three-way match process for invoice payments, but you suspect some invoices bypass this control. You want to visualize the actual process flow to identify where compliance breaks down.
**Settings:**
- Default Number of Top Variants: 8
- Legacy Map Mode: false
**Output:**
The process map shows your invoice processing with multiple diverging paths:
- Standard compliant path (68% of cases): Receive Invoice -> Match PO -> Match Receipt -> Approve -> Pay
- Non-compliant path 1 (18% of cases): Receive Invoice -> Match PO -> Approve -> Pay (skips receipt matching)
- Non-compliant path 2 (8% of cases): Receive Invoice -> Approve -> Pay (skips all matching)
- Rework path (6% of cases): Receive Invoice -> Match PO -> Match Receipt -> Rework -> Match PO -> Approve -> Pay
Edge thickness indicates frequency, making the non-compliant paths visually obvious as distinct branches from the main flow.
**Insights:** Only 68% of invoices follow the compliant three-way match process. The map clearly shows where compliance breaks down - 26% of invoices bypass either receipt matching or both matching steps entirely. By clicking on the non-compliant paths, you can identify which departments or vendors are most frequently associated with these violations. The rework loop affecting 6% of cases suggests data quality issues in either purchase orders or receipt documentation that warrant investigation.
### Example 3: Simplifying a Complex Process for Executive Review
**Scenario:** You need to present your customer onboarding process to executives who want a high-level understanding without overwhelming detail. Your process has 87 different variants.
**Settings:**
- Default Number of Top Variants: 2
- Legacy Map Mode: false
**Output:**
The process map displays only the two most common paths, which together account for 73% of all cases:
- Variant 1 (48%): Application -> Credit Check -> Document Upload -> Review -> Approve -> Account Setup
- Variant 2 (25%): Application -> Credit Check -> Document Upload -> Review -> Request Additional Info -> Document Upload -> Review -> Approve -> Account Setup
The simplified view removes the visual clutter of 85 other variants, focusing on the paths that represent nearly three-quarters of all customer onboarding.
**Insights:** The clean, two-variant view is perfect for executive presentation. It shows that just under half of customers move smoothly through onboarding, while a quarter require additional information. The map makes it immediately obvious where the additional information request loop occurs, helping executives understand the impact of incomplete initial applications. During the presentation, you can interactively increase the number of visible variants to explore edge cases if questions arise.
### Example 4: Analyzing Regional Process Variation
**Scenario:** Your organization has five regional offices that should all follow the same order fulfillment process, but you suspect significant variation in how they execute it. You want to compare process maps across regions.
**Settings:**
- Create five separate process map blocks, each preceded by a region filter
- Default Number of Top Variants: 10 for each region
- Legacy Map Mode: false
**Output:**
Region A process map:
- 12 unique variants visible
- Top variant represents 72% of cases
- Standard path dominates the visualization
- Average case duration: 4.2 days
Region B process map:
- 43 unique variants visible
- Top variant represents only 31% of cases
- Many diverging paths creating a complex web
- Average case duration: 8.7 days
Regions C, D, and E fall between these extremes.
**Insights:** The visual comparison immediately reveals that Region B lacks process standardization compared to Region A. Region B's complex process map with many variants correlates directly with their longer average duration (8.7 days vs 4.2 days). This suggests Region A's standardized approach should be studied and potentially adopted by other regions. You can click through the specific variants in Region B to understand what drives their complexity - it may be legitimate differences in customer types, or it may indicate training gaps or local workarounds that should be addressed.
### Example 5: Identifying Rework Patterns in Quality Control
**Scenario:** Your manufacturing quality control process shows high variation in case duration, and you suspect rework loops are the cause. You want to visualize where rework occurs and how frequently.
**Settings:**
- Default Number of Top Variants: 15
- Legacy Map Mode: false
**Output:**
The process map displays your quality control flow with several circular patterns indicating rework:
- Standard path (42%): Inspect -> Pass -> Package -> Ship (avg 1.2 days)
- Single rework (28%): Inspect -> Fail -> Repair -> Inspect -> Pass -> Package -> Ship (avg 3.4 days)
- Double rework (15%): Inspect -> Fail -> Repair -> Inspect -> Fail -> Repair -> Inspect -> Pass -> Package -> Ship (avg 5.8 days)
- Triple rework (8%): Inspect -> Fail -> Repair -> Inspect -> Fail -> Repair -> Inspect -> Fail -> Repair -> Inspect -> Pass -> Package -> Ship (avg 8.9 days)
The circular edges from Inspect back to Repair are visually prominent, with edge labels showing how many times cases loop through each cycle.
**Insights:** The process map makes rework loops visually obvious through the circular patterns. Only 42% of cases pass inspection on the first try, meaning 58% of cases require at least one repair cycle. The duration increases nearly linearly with each rework cycle (1.2 -> 3.4 -> 5.8 -> 8.9 days). By clicking on the Inspect -> Fail edge, you can drill down to see which specific defect types or product categories are most commonly associated with failures, helping target root cause analysis on the biggest contributors to rework.
## Output
The Process Map calculator generates an interactive visualization with the following features:
**Visual Elements:**
- **Nodes:** Represent activities in your process, sized according to frequency
- **Edges:** Show transitions between activities, with thickness indicating how many cases follow each path
- **Colors:** Highlight process performance, with red indicating slow transitions and green indicating fast transitions
- **Variant highlighting:** The most common process paths are emphasized based on your Default Number of Top Variants setting
**Interactive Capabilities:**
- **Zoom and pan:** Navigate complex process maps with mouse or touch controls
- **Click on nodes:** See detailed statistics about a specific activity, including frequency, average duration, and resources
- **Click on edges:** Examine specific transitions between activities, including case counts and time distributions
- **Filter variants:** Adjust the number of visible variants interactively to simplify or expand the view
- **Drill down to cases:** From any node or edge, view the specific cases that followed that path
- **Export:** Save the process map visualization as an image for presentations or documentation
**Metrics Displayed:**
- Case counts for each activity and transition
- Percentages showing what proportion of cases follow each path
- Average durations for transitions between activities
- Performance indicators highlighting bottlenecks and delays
The process map integrates seamlessly with filters, so you can create focused views by first filtering to specific case subsets (such as cases from a particular time period, department, or outcome) and then generating the process map for that filtered view.
---
*This documentation is part of the mindzie Studio process mining platform.*
---
## Process Performance Matrix
Section: Calculators
URL: https://docs.mindziestudio.com/mindzie_studio/calculators/process-performance-matrix
Source: /docs-master/mindzieStudio/calculators/process-performance-matrix/page.md
# Process Performance Matrix
## Overview
The Process Performance Matrix calculator creates a comprehensive view of your process health by plotting cases based on two critical dimensions: conformance to process standards and performance category. This matrix visualization helps you identify which segments of your process need attention by showing the distribution of cases across eight distinct categories (conformance status x performance level).
The calculator groups cases into a 2x4 matrix where rows represent whether cases have conformance issues (yes/no) and columns represent performance categories (Extreme, Slow, Normal, Fast). Each cell shows the percentage and count of cases, allowing you to quickly identify problematic areas such as slow cases with conformance violations or extremely fast cases that might be cutting corners.
## Common Uses
- Identify process segments that require immediate attention (slow performance + conformance issues)
- Detect potential quality shortcuts where cases are fast but have conformance violations
- Balance process improvement efforts between speed optimization and compliance enhancement
- Segment cases for targeted root cause analysis based on combined performance and conformance profiles
- Monitor the overall health of process execution across both efficiency and quality dimensions
- Prioritize improvement initiatives by focusing on high-impact segments (large percentages in problem quadrants)
## Settings
**Conformance Issue Attribute:** Select the boolean case attribute that indicates whether a case has conformance issues. This is typically created by the Conformance Rules enrichment operator. The default is the standard conformance column created when you define process rules. Cases marked "true" have violations, while "false" indicates compliance.
**Performance Attribute Name:** Select the string case attribute that categorizes cases by performance. This attribute must contain only valid performance category values: "Fast," "Normal," "Slow," or "Extreme." This is typically created by the Duration Categorization enrichment operator, which assigns categories based on case duration thresholds you define.
## Examples
### Example 1: Analyzing Order Fulfillment Process Health
**Scenario:** Your order fulfillment process has defined duration thresholds (Fast: under 2 days, Normal: 2-5 days, Slow: 5-10 days, Extreme: over 10 days) and conformance rules (required activities, correct sequence). You want to understand the overall health of the process and identify which segments need improvement.
**Settings:**
- Conformance Issue Attribute: ConformanceIssue
- Performance Attribute Name: CasePerformance
**Output:**
The matrix displays eight cells showing the distribution of your 10,000 cases:
**No Conformance Issues:**
- Extreme (over 10 days): 2% (200 cases)
- Slow (5-10 days): 8% (800 cases)
- Normal (2-5 days): 45% (4,500 cases)
- Fast (under 2 days): 25% (2,500 cases)
**Has Conformance Issues:**
- Extreme (over 10 days): 5% (500 cases)
- Slow (5-10 days): 10% (1,000 cases)
- Normal (2-5 days): 4% (400 cases)
- Fast (under 2 days): 1% (100 cases)
**Insights:** This output reveals several important findings. First, 80% of your cases (8,000) have no conformance issues, which is positive. However, the 5% of cases in the "Extreme + Conformance Issues" category (500 cases) should be your top priority - these are both slow and non-compliant. The 10% in "Slow + Conformance Issues" (1,000 cases) is also concerning. Interestingly, 1% of cases are Fast but have conformance issues - these may represent shortcuts where steps are being skipped to achieve speed. The matrix helps you prioritize: focus first on the 15% of cases that are both slow and non-compliant (1,500 cases total), then investigate why fast cases have conformance violations.
### Example 2: Invoice Processing Performance Segmentation
**Scenario:** You've categorized invoice processing cases by duration and applied conformance rules checking for required approvals, correct document matching, and proper sequencing. You want to segment cases for targeted improvement initiatives.
**Settings:**
- Conformance Issue Attribute: ConformanceIssue
- Performance Attribute Name: InvoiceDurationCategory
**Output:**
The matrix shows your 5,000 invoice cases distributed across performance and conformance:
**No Conformance Issues:**
- Extreme: 3% (150 cases) - Very slow but compliant
- Slow: 12% (600 cases) - Slower than target but compliant
- Normal: 50% (2,500 cases) - Target performance, compliant
- Fast: 20% (1,000 cases) - Better than target, compliant
**Has Conformance Issues:**
- Extreme: 8% (400 cases) - Very slow and non-compliant
- Slow: 5% (250 cases) - Slower than target, non-compliant
- Normal: 1.5% (75 cases) - Normal speed but non-compliant
- Fast: 0.5% (25 cases) - Fast but non-compliant
**Insights:** This matrix reveals that 85% of your invoices (4,250 cases) are processed without conformance issues, which is good. However, the 8% in the "Extreme + Conformance Issues" category (400 cases) represents your biggest problem area - these invoices are taking too long AND have process violations. You can click on this cell to drill down and investigate common patterns. The 5% in "Slow + Conformance Issues" (250 cases) also needs attention. The small percentage (0.5%) of fast invoices with conformance issues suggests some processors may be skipping approval steps. The 3% of extremely slow but compliant cases (150) might indicate complex invoices that require special handling - these are following the rules but taking a long time, suggesting a process design issue rather than compliance problem.
### Example 3: Prioritizing Process Improvement Resources
**Scenario:** Your process improvement team has limited resources and needs to prioritize which process segments to address first. You use the Process Performance Matrix to make data-driven decisions about where to focus improvement efforts.
**Settings:**
- Conformance Issue Attribute: ConformanceIssue
- Performance Attribute Name: CasePerformanceCategory
**Output:**
Matrix showing 8,000 cases:
**No Conformance Issues:**
- Extreme: 1% (80 cases)
- Slow: 15% (1,200 cases)
- Normal: 55% (4,400 cases)
- Fast: 18% (1,440 cases)
**Has Conformance Issues:**
- Extreme: 3% (240 cases)
- Slow: 6% (480 cases)
- Normal: 1.5% (120 cases)
- Fast: 0.5% (40 cases)
**Insights:** This matrix helps you prioritize improvement efforts strategically. The "Extreme + Conformance Issues" segment (3%, 240 cases) is your highest priority - these cases have both quality and speed problems. Next, address the "Slow + Conformance Issues" segment (6%, 480 cases). Together, these two segments represent 9% of cases (720 total) that need both performance and compliance improvements. After addressing these critical segments, you can focus on the 15% of slow but compliant cases (1,200) - these might benefit from process optimization while maintaining quality. The 1% of extremely slow compliant cases (80) might be edge cases requiring different handling. The small percentage of fast cases with conformance issues (0.5%, 40 cases) suggests isolated incidents of shortcuts that can be addressed through training. By using this matrix, you can allocate resources efficiently: assign your senior analysts to the 9% with both issues, process improvement specialists to the 15% that are slow but compliant, and quality auditors to investigate the fast cases with violations.
## Output
The calculator displays a matrix with two rows and four columns. Each cell shows the percentage of total cases and the count of cases that fall into that combination of conformance status and performance category. The percentages across all eight cells sum to 100%.
You can click on any cell to drill down and view the specific cases in that segment, enabling detailed investigation of particular problem areas. This drill-down capability allows you to perform further analysis, such as running root cause analysis on slow cases with conformance issues or examining the process maps of different segments.
The matrix visualization typically uses color coding to highlight cells with higher percentages, making it easy to spot where most of your cases are concentrated and which segments represent the biggest opportunities for improvement.
---
*This documentation is part of the mindzie Studio process mining platform.*
---
## Rate
Section: Calculators
URL: https://docs.mindziestudio.com/mindzie_studio/calculators/rate
Source: /docs-master/mindzieStudio/calculators/rate/page.md
# Rate
## Overview
The Rate calculator shows the ratio or percentage of selected filtered data compared to the total dataset. This calculator is essential for calculating performance metrics, compliance rates, and identifying the proportion of cases meeting specific criteria.
## Common Uses
- Calculate the rate of late payments, shipments, or deliveries
- Determine the rate of long-duration cases
- Measure the rate of cases with rework
- Calculate compliance or SLA adherence rates
- Add rate metrics to dashboards
## Settings
**Aggregate Function:** Select which aggregation method to use when calculating the rate:
- **Case count:** Calculates the ratio based on the count of cases
- **Sum:** Calculates the ratio based on the sum of a chosen attribute
**Filters:** Specify the filters that define the subset of data you want to measure. For example, to calculate the rate of cases with durations over 30 days, add a filter selecting cases with Case Duration > 30 days.
## Examples
### Example 1: Rate of Late Deliveries
**Scenario:** You want to calculate what percentage of deliveries are late to measure on-time delivery performance.
**Settings:**
- Aggregate Function: Case count
- Filters: Apply a "Deadline" filter to select only late deliveries
**Steps to add filter:**
1. Click three dots by the filters
2. Select "Open Filters"
3. Click "Add Filter"
4. Select your filter (e.g., "Deadline" filter for late deliveries)
**Output:**
The output shows the value in decimal format. For example, 0.59 means 59% of deliveries are late.
To add the calculator output to the dashboard, click the three dots on the top right and select "Add Single Value."
**Insights:** This metric is crucial for monitoring delivery performance and identifying systemic issues with logistics or planning.
### Example 2: Ratio of Total Cost for Long Cases
**Scenario:** You want to calculate what percentage of total item cost comes from long-duration cases compared to normal cases.
**Settings:**
- Aggregate Function: Sum
- Value Attribute: Total Item Cost
- Filters: Apply a "Cases with Attribute" filter to select long-duration cases
**Steps to add filter:**
1. Click three dots by the filters
2. Select "Open Filters"
3. Click "Add Filter"
4. Select "Cases with Attribute" filter to define long cases
**Output:**
The calculator shows the ratio of costs attributable to long-duration cases.
**Insights:** This reveals the financial impact of process inefficiencies, helping prioritize improvement efforts where they have the greatest cost benefit.
---
*This documentation is part of the mindzie Studio process mining platform.*
---
## Rate Over Time
Section: Calculators
URL: https://docs.mindziestudio.com/mindzie_studio/calculators/rate-over-time
Source: /docs-master/mindzieStudio/calculators/rate-over-time/page.md
# Rate Over Time
## Overview
The Rate Over Time calculator shows how the fraction of cases in a selected category changes over time. This calculator helps you track trends and patterns in your process metrics by comparing filtered cases against all cases over specified time periods, displaying results as percentages.
## Common Uses
- Calculate rate of early/late payments, shipments, or deliveries over time
- Calculate rate of short/long cases over time
- Calculate the rate of cases with rework over time
- Monitor compliance rates across time periods
- Track quality or error rates by month, quarter, or year
## Settings
**Date Attribute:** Select the date attribute that will represent the base for calculating the rate (e.g., Case Start Date, Case End Date, or Activity Time).
**Activity Name:** (Appears only if Activity Time is selected) Select the specific activity that will represent the start of each calculation (e.g., 'Enter Invoice', 'Pay Invoice').
**Activity Selection Type:** (Appears only if Activity Time is selected) Choose whether the first or last occurrence of the selected activity will be used as the start date for calculation.
**Over Time Period:** Select the period frequency for rate calculation (Daily, Weekly, Monthly, Quarterly, Yearly).
**Aggregate Function:** Choose how to aggregate the data:
- **Case count:** Calculates the ratio based on count of cases
- **Sum:** Calculates the ratio based on the sum of a chosen attribute
**Select cases in which:** Define filter criteria to identify the cases you want to measure (e.g., cases with refunds, long duration cases, late payments).
## Example
### Calculating Rate of Long Duration Cases Over Time
**Scenario:** You want to track what percentage of cases exceed 60 days duration each month to monitor process performance.
**Settings:**
- Date Attribute: Case Start Date
- Over Time Period: Monthly
- Aggregate Function: Case count
- Select cases in which: Case Duration > 60 days
**Output:**
The side-by-side bar chart displays:
- **Light purple bars:** Total case count (left axis)
- **Dark purple bars:** Filtered case count (left axis)
- **Line graph:** Rate percentage (right axis)
From this visualization, you can see that the highest rate of long duration cases happened in November 2019, where about 70% of cases exceeded 60 days.
**Insights:** This helps identify time periods with performance issues and measure the impact of process improvements over time.
## Output
The calculator provides:
- **Dual-axis chart:** Shows both absolute counts and percentage rates
- **Trend visualization:** Clear view of rate changes over time
- **Grid view:** Detailed numerical data for each time period
---
*This documentation is part of the mindzie Studio process mining platform.*
---
## Repeated Activities
Section: Calculators
URL: https://docs.mindziestudio.com/mindzie_studio/calculators/repeated-activities
Source: /docs-master/mindzieStudio/calculators/repeated-activities/page.md
# Repeated Activities
## Overview
The Repeated Activities calculator provides comprehensive information about activity repetitions and their impact on process duration. This calculator helps you identify rework, loops, and inefficiencies by analyzing how often activities are repeated within cases.
## Common Uses
- See the number of cases with activity repetitions
- Analyze average repetitions per case
- Calculate average time added per repetition
- Identify rework patterns and inefficiencies
- Measure the cost of repeated activities
## Settings
There are no specific settings for this calculator beyond the standard title and description fields. Click 'Create' to generate the analysis.
## Output
The calculator displays the following metrics for each repeated activity:
**Activity Name:** The name of the activity being performed.
**Number of Cases with Repetitions:** The total number of cases where this activity was repeated at least once.
**Average Repetitions per Case:** The average number of times this activity is repeated for each case in the event log.
**Average Time Added per Repetition:** The average amount of extra time added to a case each time this activity is repeated.
**Total Added Time per Case:** The total amount of time added to a case from the average number of times the activity is repeated.
**Total Added Time:** The total amount of extra time added due to repeated activities across all cases.
## Example
### Analyzing Repeated Activities in Order Processing
When you add the Repeated Activities calculator to an order-to-cash analysis, you might discover:
- "Credit Check" is repeated in 450 cases
- Average of 2.3 repetitions per case
- Each repetition adds 2.5 hours on average
- Total added time per case: 5.75 hours
- Total added time across all cases: 2,587 hours
**Insights:** This reveals significant process inefficiency. Multiple credit checks per order indicate:
- Information quality issues requiring re-verification
- System integration problems
- Missing approvals or documentation
- Process design flaws
The time impact quantifies the cost of this rework, helping prioritize process improvements based on actual time savings potential.
---
*This documentation is part of the mindzie Studio process mining platform.*
---
## Resource Performance Vs Conformance
Section: Calculators
URL: https://docs.mindziestudio.com/mindzie_studio/calculators/resource-performance-vs-conformance
Source: /docs-master/mindzieStudio/calculators/resource-performance-vs-conformance/page.md
# Resource Performance vs Conformance
## Overview
The Resource Performance vs Conformance calculator analyzes the relationship between resource performance metrics and their adherence to defined process standards. This calculator helps identify resources who may be achieving high performance by skipping steps or not following proper procedures, as well as those who are highly compliant but may need performance improvement.
## Common Uses
- Identify resources with high performance but low conformance (potential shortcuts or process violations)
- Find resources with high conformance but low performance (may need training or support)
- Balance resource allocation based on both performance and compliance metrics
- Detect potential quality or compliance risks in resource behavior
- Optimize process training to address specific performance/conformance gaps
## Settings
**Resource Attribute:** Select the attribute that identifies individual resources (e.g., Employee ID, User Name, Resource).
**Performance Metric:** Choose how to measure resource performance, such as throughput, processing speed, or volume of work completed.
**Conformance Metric:** Choose how to measure conformance to process standards, such as adherence to process model, compliance with defined rules, or standard operating procedure adherence.
**Minimum Cases:** Specify the minimum number of cases a resource must have handled to be included in the analysis.
**Visualization Type:** Select the output format to view the analysis results.
## Example
### Analyzing Invoice Processing Performance and Compliance
**Scenario:** You want to understand if invoice processing team members are maintaining quality while achieving productivity targets.
The calculator output divides resources into four quadrants:
1. **High Performance, High Conformance:** Star performers who should be recognized and used as mentors
2. **High Performance, Low Conformance:** Resources cutting corners - need process compliance coaching
3. **Low Performance, High Conformance:** Compliant but slow - may need training or process optimization
4. **Low Performance, Low Conformance:** Require immediate intervention and support
**Insights:** This analysis helps identify resources who may be skipping critical process steps (like 3-way match verification) to achieve higher throughput, creating potential audit risks.
## Output
The calculator displays resources plotted according to their performance and conformance scores, allowing you to quickly identify which quadrant each resource falls into and take appropriate action.
---
*This documentation is part of the mindzie Studio process mining platform.*
---
## Root Cause Analysis
Section: Calculators
URL: https://docs.mindziestudio.com/mindzie_studio/calculators/root-cause-analysis
Source: /docs-master/mindzieStudio/calculators/root-cause-analysis/page.md
# Root Cause Analysis
## Overview
The Root Cause Analysis calculator uses AI-driven decision tree analysis to identify the root causes of selected process behaviors. This calculator automatically analyzes your event log data to discover which factors (such as attributes, values, or conditions) most strongly influence specific outcomes like rework, late payments, or case escalations.
This is an AI-powered calculator that requires minimal configuration and provides intelligent insights into what drives specific process behaviors.
## Common Uses
- Identify factors contributing to invoice payment delays
- Understand what causes rework in processes
- Discover patterns that lead to case escalations
- Analyze what drives quality issues or defects
- Determine root causes of process bottlenecks
- Find out why certain cases take longer than others
## Settings
**Target Behavior:** Define the process behavior you want to analyze by creating a filter that selects cases exhibiting that behavior (e.g., cases with rework, late payments, or long durations).
**Attributes to Analyze:** Select which case and event attributes the AI should consider when building the decision tree. The calculator will automatically determine which attributes have the strongest influence on the target behavior.
**Minimum Case Volume:** Specify the minimum number of cases required for meaningful analysis. The AI needs sufficient data to identify statistically significant patterns.
**Confidence Threshold:** Set the confidence level for the decision tree branches. Higher thresholds result in more reliable but potentially fewer insights.
## Example
### Finding Causes of Late Invoice Payments
**Scenario:** You want to understand why some invoices are paid late while others are paid on time.
**Setup:**
1. Create a filter selecting cases where Payment Timeliness = "Late"
2. Select attributes to analyze: Vendor, Invoice Amount, Department, Payment Terms
3. Set minimum cases to 100 for statistical validity
**Output:**
The calculator generates a decision tree showing:
- **Primary Root Cause:** Invoices from Vendor Category "International" are 3x more likely to be late
- **Secondary Factor:** Within international vendors, invoices over $10,000 have 85% late payment rate
- **Contributing Factor:** Invoices routed to Department "Procurement B" have higher late payment rates regardless of vendor
**Insights:** The analysis reveals that international vendors, especially for high-value invoices, need different payment processes. The decision tree helps prioritize which process improvements will have the biggest impact.
## How to Interpret Results
The decision tree output shows:
- **Nodes:** Represent decision points based on attribute values
- **Branches:** Show how cases split based on conditions
- **Leaf Values:** Indicate the percentage of cases meeting your target behavior at each endpoint
- **Importance Scores:** Highlight which attributes have the strongest influence
Look for branches with high percentages and large case volumes - these represent the most significant root causes requiring attention.
## Output
The calculator displays an interactive decision tree visualization that you can:
- Expand or collapse branches to explore different paths
- Click on nodes to see detailed statistics
- Identify the strongest predictors of your target behavior
- Export findings for presentation or further analysis
---
*This documentation is part of the mindzie Studio process mining platform.*
---
## Same Time Pairs
Section: Calculators
URL: https://docs.mindziestudio.com/mindzie_studio/calculators/same-time-pairs
Source: /docs-master/mindzieStudio/calculators/same-time-pairs/page.md
# Same Time Pairs
## Overview
The Same Time Pairs calculator identifies activity pairs that have problematic timestamp data where the temporal order cannot be reliably determined. This specialized data quality calculator analyzes your process data to find activity pairs where events either occur at exactly the same time or where one event has only a date (no time) while another event on the same date has a specific time. These timestamp issues make it impossible to determine which activity truly happened first, potentially affecting process flow analysis and conformance checking.
## Common Uses
- Detect data quality issues in event timestamps before performing process analysis
- Identify activities that are frequently logged with identical timestamps
- Find cases where date-only timestamps conflict with date-time timestamps
- Validate data import quality after migrating from legacy systems
- Assess the reliability of temporal ordering in process mining analysis
- Prioritize data cleanup efforts by identifying the most problematic activity pairs
## Settings
This calculator requires no configuration settings. It automatically analyzes all activity pairs in your process data to identify those with temporal ordering issues.
## Examples
### Example 1: Identifying Data Quality Issues in Invoice Processing
**Scenario:** After importing invoice processing data from a legacy ERP system, you want to verify whether the timestamp data is reliable enough for process mining analysis. Some activities were logged with full timestamps while others only have dates.
**Settings:**
- No settings required - calculator runs automatically
**Output:**
The calculator produces a table with the following columns:
- **Activity Pair:** Shows the activity pair in the format "Activity1 -> Activity2"
- **Activity 1:** The first activity in the pair
- **Activity 2:** The second activity in the pair
- **Known Order Pair Count:** The number of times this activity pair appears in your data where the temporal order CAN be reliably determined (different timestamps with time-of-day values)
The table only shows activity pairs that have timestamp problems. If a pair doesn't appear in the results, it means all instances of that pair have reliable temporal ordering.
**Insights:**
You discover that "Invoice Received -> Invoice Approved" appears with a Known Order Pair Count of 247. This means there are 247 cases where these activities can be properly ordered, but the calculator identified this pair because there are ALSO cases where:
- Both activities have identical timestamps (logged at exactly the same time)
- One activity has only a date while the other has a date and time on the same day
This tells you that while most instances are fine, there are some cases where you cannot determine whether the invoice was approved before or after it was received, which is a critical data quality issue requiring investigation.
### Example 2: Assessing Batch Import Data Quality
**Scenario:** Your organization performed a bulk data load from a legacy system, and you suspect that many events were assigned the same timestamp during the migration process.
**Settings:**
- No settings required - calculator runs automatically
**Output:**
The calculator shows several activity pairs with high Known Order Pair Counts but also flags them as problematic, indicating mixed data quality:
| Activity Pair | Known Order Pair Count |
|---------------|------------------------|
| Order Created -> Order Validated | 1,523 |
| Order Validated -> Inventory Check | 892 |
| Inventory Check -> Shipping Scheduled | 456 |
**Insights:**
The presence of these pairs in the output indicates that while thousands of instances have proper temporal ordering, there are also instances with timestamp conflicts. This suggests:
- The bulk import may have assigned default midnight timestamps to some events
- Certain activities might have been batch-processed and logged simultaneously
- Data validation rules were not consistently applied during migration
You should investigate the cases contributing to these problematic pairs to determine whether they represent:
- Legitimate simultaneous execution (rare but possible)
- System clock synchronization issues
- Data migration artifacts requiring correction
### Example 3: Validating Real-Time Process Data
**Scenario:** You are analyzing a manufacturing process where activities are supposed to be logged in real-time. You want to verify that the process control system is correctly timestamping all activities.
**Settings:**
- No settings required - calculator runs automatically
**Output:**
The calculator shows only a few activity pairs with very low Known Order Pair Counts:
| Activity Pair | Known Order Pair Count |
|---------------|------------------------|
| Quality Check -> Package | 3 |
| Package -> Label | 1 |
**Insights:**
Finding only a small number of problematic pairs with low counts is a positive result. It indicates:
- The vast majority of activity pairs have reliable temporal ordering
- The real-time logging system is working correctly
- Only 4 total instances have timestamp issues (3 + 1)
- These few cases might represent legitimate simultaneous execution or minor system glitches
This gives you confidence that your process data is suitable for detailed temporal analysis, process mining, and conformance checking.
## Output
The calculator produces a single table showing only activity pairs that have temporal ordering problems. The table includes:
- **Activity Pair column:** Displays the directional relationship between two activities (Activity1 -> Activity2)
- **Individual activity columns:** Shows each activity separately for filtering and analysis
- **Known Order Pair Count:** Indicates how many times this pair appears with reliable temporal ordering, helping you understand the severity of the issue
The output is interactive - you can click on activity pairs to drill down into the specific cases contributing to the temporal ordering problems.
**Important Notes:**
- Activity pairs that NEVER have timestamp issues will NOT appear in this output
- Higher Known Order Pair Counts suggest the timestamp problem affects a frequently-occurring activity pair
- An empty result table means all activity pairs in your process have reliable temporal ordering
---
*This documentation is part of the mindzie Studio process mining platform.*
---
## Selected Cases By Category
Section: Calculators
URL: https://docs.mindziestudio.com/mindzie_studio/calculators/selected-cases-by-category
Source: /docs-master/mindzieStudio/calculators/selected-cases-by-category/page.md
# Selected Cases by Category
## Overview
The Selected Cases by Category calculator analyzes and calculates metrics for cases grouped by categorical attributes. This calculator helps you understand how different categories of cases behave and perform within your process.
## Common Uses
- Analyze case volumes by customer, product, or region
- Compare performance metrics across different case categories
- Identify trends and patterns within specific categories
- Segment cases for targeted analysis
- Track category-specific KPIs
## Settings
**Category Attribute:** Select the categorical attribute to group cases by (e.g., Customer, Product Type, Region, Status).
**Metric to Calculate:** Choose the metric you want to analyze for each category:
- Case count
- Average duration
- Sum of values
- Other aggregate functions
**Filter Criteria (Optional):** Apply filters to focus on specific subsets of cases before categorization.
## Example
### Analyzing Orders by Customer Category
**Scenario:** You want to see how many orders come from different customer categories and compare their characteristics.
**Settings:**
- Category Attribute: Customer Category
- Metric: Case Count
**Output:**
The calculator displays a breakdown showing:
- Enterprise customers: 450 orders
- SMB customers: 1,200 orders
- Individual customers: 3,500 orders
You can switch between different visualizations (grid, bar chart, pie chart) using the dropdown in the top right corner.
**Insights:** This helps you understand your customer mix and can guide resource allocation, pricing strategies, and process optimization efforts for different customer segments.
## Getting Started
To use this calculator effectively:
1. Load your dataset
2. Create or open an investigation
3. Create an analysis
4. Apply relevant filters (if needed)
5. Add the Selected Cases by Category calculator
6. Select your category attribute and desired metrics
---
*This documentation is part of the mindzie Studio process mining platform.*
---
## Selected Cases By Category Over Time
Section: Calculators
URL: https://docs.mindziestudio.com/mindzie_studio/calculators/selected-cases-by-category-over-time
Source: /docs-master/mindzieStudio/calculators/selected-cases-by-category-over-time/page.md
# Selected Cases by Category Over Time
## Overview
The Selected Cases by Category Over Time calculator shows how the distribution of cases across different categories changes over time periods. This calculator helps you track trends in case classifications and identify patterns in category distributions as cases progress through your process.
## Common Uses
- Track how category distributions evolve over time
- Monitor changes in case classifications across different time periods
- Compare category trends across different time frames
- Identify seasonal patterns in case types
- Analyze shifts in workload distribution by category
## Settings
**Category Attribute:** Select the attribute you want to use to categorize cases (e.g., Case Type, Priority, Status, Department).
**Date Attribute:** Select the date/time attribute that will represent the base for time period calculation (e.g., Case Start Date, Activity Time).
**Activity Name:** If you selected Activity Time as your Date Attribute, specify which activity's timestamp to use (e.g., first occurrence of "Submit Order").
**Activity Selection Type:** If using Activity Time, choose whether to use the first or last occurrence of the selected activity in each case.
**Over Time Period:** Select the time period granularity for analysis (Daily, Weekly, Monthly, Quarterly, Yearly).
**Aggregate Function:** Choose how to aggregate the data:
- **Case count:** Count the number of cases in each category
- **Sum:** Sum values from a selected attribute for cases in each category
**Value Attribute:** If using Sum as the aggregate function, select which numeric attribute to sum.
## Example
### Analyzing Invoice Status Distribution Over Time
**Scenario:** You want to track how invoice statuses (Approved, Pending, Rejected) change month by month to identify processing trends.
**Settings:**
- Category Attribute: Invoice Status
- Date Attribute: Invoice Received Date
- Over Time Period: Monthly
- Aggregate Function: Case count
**Output:**
The calculator displays a time-series visualization showing:
- Each category as a separate line or stacked area
- X-axis: Time periods (months)
- Y-axis: Case count or sum value
- Clear visual representation of category distribution changes
**Insights:** You might discover that "Pending" invoices spike at month-end, or that "Rejected" invoices increased after a policy change, helping you identify process improvement opportunities.
## Output
The calculator provides visualization options including:
- **Stacked area chart:** Shows total volume and category proportions
- **Line chart:** Displays each category as a separate trend line
- **Stacked bar chart:** Compares category distributions across time periods
- **Grid view:** Tabular data for detailed analysis
---
*This documentation is part of the mindzie Studio process mining platform.*
---
## Selected Cases Over Time
Section: Calculators
URL: https://docs.mindziestudio.com/mindzie_studio/calculators/selected-cases-over-time
Source: /docs-master/mindzieStudio/calculators/selected-cases-over-time/page.md
# Selected Cases Over Time
## Overview
The Selected Cases Over Time calculator shows how the count or sum of filtered cases changes across time periods. This calculator helps you track trends in case volumes, identify patterns, and monitor how specific subsets of cases evolve over time.
## Common Uses
- Monitor filtered case volumes over time
- Track cases with specific characteristics across time periods
- Identify seasonal patterns in selected cases
- Compare absolute numbers vs. rates over time
- Analyze trend changes in specific case segments
## Settings
**Date Attribute:** Select the date/time attribute that will represent the base for time period calculation (e.g., Case Start Date, Case End Date, or Activity Time).
**Activity Name:** If you selected Activity Time as your Date Attribute, specify which activity's timestamp to use for the time-based analysis.
**Activity Selection Type:** If using Activity Time, choose whether to use the first or last occurrence of the selected activity in each case.
**Over Time Period:** Select the time period granularity for analysis (Daily, Weekly, Monthly, Quarterly, Yearly).
**Aggregate Function:** Choose how to aggregate the data:
- **Case count:** Count the number of filtered cases in each time period
- **Sum:** Sum values from a selected attribute for filtered cases in each time period
**Value Attribute:** If using Sum as the aggregate function, select which numeric attribute to sum.
**Select cases in which:** Define the filter criteria to select which cases to include in the analysis (e.g., cases with specific status, duration thresholds, or attribute values).
## Example
### Tracking Long Duration Cases Over Time
**Scenario:** You want to monitor how many cases with durations over 30 days occur each month to track process performance improvements.
**Settings:**
- Date Attribute: Case Start Date
- Over Time Period: Monthly
- Aggregate Function: Case count
- Select cases in which: Case Duration > 30 days
**Output:**
The calculator displays a time-series chart showing:
- X-axis: Time periods (months)
- Y-axis: Number of cases exceeding 30 days duration
- Trend line showing whether long-duration cases are increasing or decreasing
**Insights:** You might discover that long-duration cases decreased after implementing a new approval workflow, or that they spike during specific months, indicating seasonal bottlenecks.
## Output
The calculator provides:
- **Line chart:** Visual trend of selected case volumes over time
- **Bar chart:** Period-by-period comparison
- **Grid view:** Detailed numerical data for each time period
- **Trend indicators:** Visual cues showing increases or decreases
---
*This documentation is part of the mindzie Studio process mining platform.*
---
## Show Notes
Section: Calculators
URL: https://docs.mindziestudio.com/mindzie_studio/calculators/show-notes
Source: /docs-master/mindzieStudio/calculators/show-notes/page.md
# Show Notes
## Overview
The Show Notes calculator allows you to add textual annotations, documentation, and explanatory notes directly within your process mining analysis. Unlike other calculators that analyze event log data, this calculator simply displays your custom text content without performing any calculations.
This calculator is ideal for documenting analysis decisions, providing context for dashboard viewers, explaining methodology, or adding commentary that travels with your analysis configuration. It serves as an embedded documentation tool within your mindzieStudio workflow.
## Common Uses
- Document analysis assumptions, methodology, or data preparation steps
- Provide explanations for KPIs, metrics, or visualizations on dashboards
- Add comments explaining why specific filters or calculations were applied
- Document known data issues, limitations, or caveats
- Share insights, observations, or recommendations with team members
- Create section headers or dividers in complex dashboards
- Add data source attribution, timestamps, or disclaimers
## Settings
**Notes:** Enter the text content you want to display. This can be plain text, multi-line explanations, or formatted content (if your rendering environment supports Markdown or HTML).
There are no other configuration options beyond the standard title and description fields. The calculator simply displays whatever text you enter in the Notes field.
## Examples
### Example 1: Documenting Filter Strategy
**Scenario:** You want to explain to dashboard viewers why you filtered out cases before a specific date, so they understand the scope of the analysis.
**Settings:**
- Title: "Analysis Scope Note"
- Notes: "Filtering Strategy: We exclude cases that started before 2024-01-01 because the system underwent a major upgrade on that date, changing the activity structure. Including older cases would skew the variant analysis."
**Output:**
The calculator displays your note as a text block on the dashboard, clearly explaining the filtering rationale.
**Insights:** This documentation ensures that anyone viewing the analysis understands why the data was filtered, preventing confusion about why older cases aren't included. It preserves the reasoning behind analytical decisions even when the original analyst isn't available to explain.
### Example 2: Dashboard Section Header
**Scenario:** You're building a comprehensive dashboard and want to add a clear section header to introduce the payment performance metrics.
**Settings:**
- Title: "Payment Performance Section"
- Notes: "Payment Performance Analysis\n\nThis section tracks on-time payment rates and identifies late payment patterns. Data source: SAP ERP, updated daily at 2 AM UTC."
**Output:**
The note appears as a formatted text block that introduces the section, providing context about what metrics follow and when the data was last refreshed.
**Insights:** Section headers make complex dashboards easier to navigate and understand, especially for stakeholders who didn't create the analysis. Including the data source and refresh time helps users assess data freshness.
### Example 3: Analysis Methodology Documentation
**Scenario:** You've completed a root cause analysis and want to document the approach you used so that the methodology is transparent.
**Settings:**
- Title: "Root Cause Methodology"
- Notes: "Root Cause Analysis Methodology:\n1. Identified cases with duration over 30 days (90th percentile)\n2. Applied decision tree to find correlating attributes\n3. Validated findings with business stakeholders\n4. Recommended process improvements based on top 3 root causes"
**Output:**
A clear step-by-step explanation of the analysis methodology appears alongside your root cause analysis results.
**Insights:** Documenting methodology makes your analysis reproducible and transparent. Other analysts can understand your approach, and stakeholders can assess the rigor of your analysis.
### Example 4: Data Quality Disclaimer
**Scenario:** You know there's incomplete data for one department during a specific time period and want to warn dashboard viewers about this limitation.
**Settings:**
- Title: "Data Quality Notice"
- Notes: "IMPORTANT: This dataset contains incomplete data for Department X due to a system integration issue during March 2024. Department X metrics should be interpreted with caution. Issue resolved as of April 1, 2024."
**Output:**
A prominently displayed warning appears on the dashboard, alerting viewers to the data quality issue.
**Insights:** Proactively documenting data quality issues prevents misinterpretation of results and builds trust with stakeholders by being transparent about limitations.
### Example 5: Performance Baseline Documentation
**Scenario:** You're documenting baseline metrics before implementing process improvements so you can measure the impact of changes later.
**Settings:**
- Title: "Pre-Improvement Baseline"
- Notes: "Invoice Processing Baseline - January 2025\n\nCurrent State:\n- Average processing time: 12.3 days\n- On-time payment rate: 67%\n- Rework rate: 23%\n\nTarget State (by June 2025):\n- Average processing time: under 8 days\n- On-time payment rate: over 85%\n- Rework rate: under 10%"
**Output:**
A clear comparison of current performance and target metrics appears on the dashboard, establishing the baseline for measuring improvement.
**Insights:** Documenting baselines and targets creates accountability and makes it easy to measure the success of improvement initiatives. When you review the dashboard in six months, you'll immediately see whether you achieved your goals.
### Example 6: Collaboration and Recommendations
**Scenario:** After analyzing the process, you want to share your key findings and recommendations with the process improvement team.
**Settings:**
- Title: "Key Findings and Next Steps"
- Notes: "Analysis Findings (Q4 2024):\n\nTop 3 Bottlenecks:\n1. Manager approval step (avg 4.2 days wait time)\n2. Vendor document collection (avg 3.8 days)\n3. Invoice matching errors (affects 18% of cases)\n\nRecommendations:\n- Implement automated approval for orders under $5,000\n- Create vendor portal for document uploads\n- Add validation rules to prevent matching errors\n\nAnalyst: John Smith | Date: 2024-12-15"
**Output:**
A comprehensive summary of findings and actionable recommendations appears on the dashboard, complete with attribution and date.
**Insights:** This transforms your dashboard from a simple metrics display into an actionable report that guides improvement efforts. Including analyst name and date creates accountability and helps track the analysis timeline.
## Output
The Show Notes calculator displays your text content as-is in a simple text block format. The exact rendering depends on your dashboard environment:
**Text Display:** The notes appear as plain text or formatted text (if Markdown or HTML rendering is supported).
**No Data Processing:** Unlike other calculators, this calculator doesn't analyze your event log or display any calculated metrics. It simply shows the static text you configured.
**Dashboard Integration:** You can add the notes calculator output to your dashboard just like any other calculator. It appears as a text widget or card that can be positioned alongside other metrics and visualizations.
**Formatting Options:** Depending on your rendering environment, you may be able to use:
- Line breaks (\n) for multi-line text
- Markdown formatting (headers, lists, bold, italic)
- HTML formatting (if supported by the renderer)
The calculator is ideal for creating self-documenting analyses where the context and reasoning travel with the data and calculations.
---
*This documentation is part of the mindzie Studio process mining platform.*
---
## Standard Checker
Section: Calculators
URL: https://docs.mindziestudio.com/mindzie_studio/calculators/standard-checker
Source: /docs-master/mindzieStudio/calculators/standard-checker/page.md
# Standard Checker
## Overview
The Standard Checker calculator validates whether your process data meets mindzie's standard process definitions. It verifies that all required attributes and activities are present with correct data types, helping ensure your process data is ready for analysis and that all platform features will work correctly.
This calculator is particularly valuable during data onboarding, ETL validation, and quality assurance workflows to confirm that extracted data meets the structural and content requirements for mindzie's process-specific features.
## Common Uses
- Validate data completeness after initial ETL setup or data extraction
- Quality gate checks in automated ETL pipelines to ensure data meets requirements
- Verify that mandatory attributes exist before deploying to production
- Identify missing recommended attributes that would enable additional analysis features
- Assess impact of changes to data extraction logic or source systems
- Troubleshoot why specific calculators or features aren't working as expected
## Settings
This calculator has no configurable settings. It automatically validates your data against the appropriate standard based on your process type.
**Process Type Detection:** The calculator detects your process type from your data and applies the corresponding standard. Supported process types include:
- Procure to Pay
- Accounts Payable
- Accounts Receivable
- Order to Cash
- Service Tickets
**Standard Fields:**
- **Title:** Optional custom title for the calculator output
- **Description:** Optional description for documentation purposes
## Examples
### Example 1: Validating New Data Extraction
**Scenario:** You've just completed building your first ETL script for a Procure to Pay process from SAP. Before deploying the dataset to production users, you want to verify that all essential data has been extracted correctly.
**Settings:**
- Title: "P2P Data Validation - Initial Extract"
- Description: "Quality check before production deployment"
**Output:**
The calculator displays a summary table showing compliance percentages across three categories:
```
Category Count Issues Compliance
Mandatory Attributes 42 3 93%
Recommended Attributes 18 8 56%
Derived Attributes 12 0 100%
```
Below the summary, you'll see detailed issue lists organized by category:
**Mandatory Issues (3):**
- Purchase Order Amount: Couldn't find case attribute
- Supplier Name: Couldn't find case attribute
- Payment Date: Couldn't find event attribute
**Recommended Issues (8):**
- Purchase Order Category: Couldn't find case attribute
- Approval Level: Couldn't find case attribute
- (... 6 more attributes)
**Insights:** The 93% mandatory compliance shows your ETL is capturing most essential data, but three critical attributes are missing. The "Purchase Order Amount" and "Supplier Name" attributes are mandatory because they're required for core financial analysis features. You should update your ETL script to extract these fields before deployment.
The 56% recommended compliance is acceptable for an initial deployment, but adding these attributes would unlock additional analysis capabilities like category-based breakdowns and approval workflow analysis.
### Example 2: Post-Upgrade Validation
**Scenario:** Your source ERP system was recently upgraded, and you want to verify that the data structure hasn't changed in ways that break your mindzie integration.
**Settings:**
- Title: "Post-Upgrade Validation"
- Description: "Verify data compatibility after ERP upgrade"
**Output:**
```
Category Count Issues Compliance
Mandatory Attributes 42 0 100%
Recommended Attributes 18 1 94%
Derived Attributes 12 0 100%
```
**Recommended Issues (1):**
- Invoice Currency: Attribute has the wrong type (Expected: String, Found: Number)
**Insights:** All mandatory attributes are present, which means core functionality is intact. However, one recommended attribute changed from string to numeric type. This likely happened because the ERP upgrade changed how currency codes are stored. While not critical, you should update your ETL to convert the numeric currency codes back to standard three-letter currency strings (USD, EUR, GBP) to match the expected format.
### Example 3: Feature Troubleshooting
**Scenario:** Users report that the "Three-Way Match" calculator isn't working properly in your Accounts Payable process. You suspect missing data attributes.
**Settings:**
- Title: "AP Three-Way Match Prerequisites"
- Description: "Identify missing attributes for advanced features"
**Output:**
```
Category Count Issues Compliance
Mandatory Attributes 38 0 100%
Recommended Attributes 15 0 100%
Derived Attributes 10 4 60%
```
**Derived Issues (4):**
- Goods Receipt Value: Couldn't find event attribute (required for three-way matching)
- Purchase Order Line Item Match: Missing required attributes
- Invoice Line Item Match: Missing required activities
- GR-IR Account Balance: Missing required attributes
**Insights:** The issue is clear: derived attributes needed for three-way matching are missing. These derived attributes depend on other attributes and activities that weren't extracted. Specifically, "Goods Receipt Value" is a key event attribute needed to compare invoice amounts against received goods. Review the "required attributes" referenced in each issue to determine what additional data needs to be extracted from your source system to enable three-way match analysis.
### Example 4: Multi-Process Comparison
**Scenario:** You're setting up both Accounts Payable and Accounts Receivable processes and want to understand how complete each dataset is before presenting to stakeholders.
**Settings (Run twice - once for each process):**
- Title: "AP Data Completeness"
- Title: "AR Data Completeness"
**Output Comparison:**
Accounts Payable:
```
Mandatory: 100% Recommended: 85% Derived: 100%
```
Accounts Receivable:
```
Mandatory: 89% Recommended: 45% Derived: 50%
```
**Insights:** Your Accounts Payable data is production-ready with excellent coverage across all categories. However, Accounts Receivable has several mandatory attributes missing (89% compliance), which will prevent some core features from working. Before launching AR analysis, focus on extracting the missing mandatory attributes. The lower recommended and derived percentages can be addressed in a phased approach after launch.
### Example 5: Automated Quality Gate
**Scenario:** Your ETL runs nightly, and you want to set up an automated alert if data quality drops below acceptable levels.
**Settings:**
- Title: "Nightly Data Quality Check"
- Description: "Automated validation in ETL pipeline"
**Output:**
The calculator provides compliance percentages you can evaluate programmatically:
```
Mandatory Percent: 0.97 (97%)
Recommended Percent: 0.83 (83%)
Derived Percent: 1.00 (100%)
```
**Insights:** You can configure your ETL pipeline to:
- **FAIL** the job if Mandatory Percent < 0.95 (less than 95%)
- **WARN** stakeholders if Recommended Percent < 0.70 (less than 70%)
- **PASS** if all thresholds are met
In this example, the job would pass because mandatory compliance (97%) exceeds your 95% threshold. This approach ensures data quality issues are caught immediately rather than discovered by users.
## Output
The calculator produces two primary outputs: a summary statistics table and detailed issue lists.
### Summary Statistics Table
**Mandatory Count (Number):** Total number of mandatory attributes expected for your process type. These attributes are essential for core platform functionality.
**Mandatory Issues (Number):** Count of mandatory attributes that are either missing or have incorrect data types. Each issue represents a critical data quality problem.
**Mandatory Percent (Percentage):** Percentage of mandatory attributes that are correctly present. Values are shown as decimals (0.97 = 97%). Aim for 100% before production deployment.
**Recommended Count (Number):** Total number of recommended attributes defined for your process. These enable advanced features and richer analysis.
**Recommended Issues (Number):** Count of recommended attributes that are missing or incorrect. Lower priority than mandatory issues but still important for full feature access.
**Recommended Percent (Percentage):** Percentage of recommended attributes that are correctly present. Values above 80% indicate good data coverage.
**Derived Count (Number):** Total number of derived attributes that can be calculated from other attributes. These are typically calculated fields or computed metrics.
**Derived Issues (Number):** Count of derived attributes that cannot be calculated due to missing dependencies (required attributes or activities).
**Derived Percent (Percentage):** Percentage of derived attributes that can be successfully calculated. Issues here often indicate gaps in foundational data.
**System Name Version (Text):** The name and version of your source system extracted from the event data. Useful for tracking which ERP or system version the data came from.
**Extraction Version (Text):** The version of your ETL or data extraction process. Helps track which extraction logic was used.
**Process Name (Text):** The identified process type (for example, "Procure to Pay" or "Accounts Payable").
### Detailed Issue Lists
The calculator displays separate lists for each category of issues:
**Mandatory Attribute Issues:** Lists mandatory attributes that are missing or have incorrect data types. Each issue includes:
- Attribute name
- Problem description (for example, "Couldn't find case attribute" or "Attribute has the wrong type")
- Expected data type versus actual data type (for type mismatches)
**Recommended Attribute Issues:** Similar to mandatory issues but for recommended attributes. These are lower priority but should be addressed to unlock additional features.
**Derived Attribute Issues:** Lists derived attributes that cannot be calculated. Issues may include:
- Missing required base attributes
- Missing required activities
- Configuration problems with dependency definitions
**Activity Issues:** Lists standard activities that are expected but not found in your event log. Standard activities are predefined events like "Create Purchase Order" or "Approve Invoice" that enable process-specific analysis.
**Interpretation Guidance:**
- **100% Mandatory compliance:** Data is production-ready for core features
- **95-99% Mandatory compliance:** Minor gaps, review and address before deployment
- **Below 95% Mandatory compliance:** Significant gaps, ETL work required
- **Above 80% Recommended compliance:** Excellent data coverage
- **50-80% Recommended compliance:** Good, consider enhancing over time
- **Below 50% Recommended compliance:** Limited feature access, prioritize improvements
---
*This documentation is part of the mindzie Studio process mining platform.*
---
## Sum Of Values
Section: Calculators
URL: https://docs.mindziestudio.com/mindzie_studio/calculators/sum-of-values
Source: /docs-master/mindzieStudio/calculators/sum-of-values/page.md
# Sum of Values
## Overview
The Sum of Values calculator aggregates (sums up) values for a selected numerical attribute across all cases or events. This calculator is essential for calculating totals such as total revenue, total costs, total quantities, and other cumulative metrics.
## Common Uses
- Sum up total costs across all cases
- Calculate total revenue
- Aggregate total quantities
- Count total number of items processed
- Add summation values to dashboards for financial overviews
## Settings
**Activity Attribute:** Select the numerical attribute you want to sum (e.g., Total Cost, Invoice Amount, Quantity, Revenue).
## Example
### Creating a Financial Overview Dashboard
**Scenario:** You want to create a dashboard showing key financial metrics for your operations.
**Step 1 - Total Cost of Items:**
**Settings:**
- Activity Attribute: Item Cost
**Output:** The calculator displays the total cost across all items.
**Step 2 - Total Quantity:**
Create another Sum of Values calculator with:
- Activity Attribute: Quantity
**Step 3 - Total Number of Invoices:**
Create another Sum of Values calculator with:
- Activity Attribute: Invoice Count
**Final Result:**
Add all three calculators to the dashboard to create a comprehensive financial overview showing:
- Total Item Cost: $2,450,000
- Total Quantity: 45,000 units
- Total Invoices: 1,247
**Insights:** This dashboard provides at-a-glance financial metrics that can be:
- Monitored over time to track business growth
- Combined with filters to show totals for specific periods, customers, or products
- Used to calculate derived metrics (e.g., average cost per invoice)
---
*This documentation is part of the mindzie Studio process mining platform.*
---
## Sum Of Values For Activity
Section: Calculators
URL: https://docs.mindziestudio.com/mindzie_studio/calculators/sum-of-values-for-activity
Source: /docs-master/mindzieStudio/calculators/sum-of-values-for-activity/page.md
# Sum of Values for Activity
## Overview
The Sum of Values for Activity calculator aggregates values for a selected attribute filtered by a specific activity. This calculator helps you analyze totals associated with particular process steps, enabling activity-specific financial and quantitative analysis.
## Common Uses
- Sum total values of posted invoices vs. cleared invoices
- Calculate total costs associated with specific activities
- Analyze revenue by processing step
- Compare values before and after key process milestones
- Add activity-specific summation values to dashboards
## Settings
**Activity Attribute:** Select the numerical attribute you would like to sum up (e.g., Invoice Amount, Total Cost, Quantity).
**Activity Value:** Select the specific activity for which you want to calculate the sum (e.g., "Post Invoice", "Clear Invoice", "Approve Order").
## Example
### Comparing Posted vs. Cleared Invoice Values
**Scenario:** You want to compare the total cost of posted invoices against cleared invoices to identify outstanding amounts.
**Step 1 - Total Cost of Posted Invoices:**
**Settings:**
- Activity Attribute: Total Cost
- Activity Value: Post Invoice
**Output:** The calculator displays the total cost of all posted invoices.
**Step 2 - Total Cost of Cleared Invoices:**
Create another Sum of Values for Activity calculator with:
- Activity Attribute: Total Cost
- Activity Value: Clear Invoice
**Dashboard View:**
Add both calculators to the dashboard to compare:
- Total Posted Invoices: $2,450,000
- Total Cleared Invoices: $2,100,000
- Outstanding: $350,000 (calculated difference)
**Insights:** This comparison reveals:
- The total value of uncleared invoices
- Cash flow implications
- Potential collection issues
- Working capital tied up in the payment process
This activity-specific analysis helps you understand the financial impact of different process stages and identify bottlenecks in payment processing.
---
*This documentation is part of the mindzie Studio process mining platform.*
---
## Time Between All Activity Pairs
Section: Calculators
URL: https://docs.mindziestudio.com/mindzie_studio/calculators/time-between-all-activity-pairs
Source: /docs-master/mindzieStudio/calculators/time-between-all-activity-pairs/page.md
# Time Between All Activity Pairs
## Overview
The Time Between All Activity Pairs calculator analyzes the duration between consecutive activities in your process. This comprehensive calculator helps identify bottlenecks, performance issues, and time delays between process steps across all activity combinations.
## Common Uses
- See the duration between all process activities
- Find bottlenecks between process activities
- Identify the slowest transitions in your process
- Analyze waiting times between steps
- Compare performance across different activity pairs
## Settings
**Case Percent Threshold:** Specify the minimum percentage of cases in which an activity pair must occur to be included in the output.
For example, if you specify '20', only activity pairs where one activity directly follows another in at least 20% of cases will be included. This setting helps filter out rare activity pairs that may not be representative of normal process flow.
## Example
### Analyzing Activity Pair Durations
**Scenario:** You want to see the duration between activity pairs that occur in at least 5% of cases to focus on common process paths.
**Settings:**
- Case Percent Threshold: 5
**Output Options:**
The calculator provides three visualization modes:
1. **Heatmap (recommended):**
- Visual representation of duration between each activity pair
- Red-yellow color scale represents total duration (warmer colors = longer times)
- Gray represents activity pairs with no direct-follows relationship or frequency below threshold
- Quickly identifies hotspots and bottlenecks
2. **Grid:**
- Displays time between activities in tabular format
- Best for sorting on different values depending on analysis needs
- Allows detailed numerical comparison
3. **Matrix:**
- Same information as heatmap but in tabular format
- Best for exporting data in matrix format for external analysis
**Output Metrics:**
You can select different statistical measures:
| Metric | Description |
|--------|-------------|
| Mean | Average duration between activities |
| Median | Middle value of durations (less affected by outliers) |
| Max | Maximum duration between activities |
| Sum | Total duration across all occurrences |
| Stdev | Standard deviation of durations |
| MAD | Median absolute deviation of durations |
**Insights:**
The heatmap quickly reveals:
- Bottleneck activity pairs (dark red/yellow areas)
- Fast transitions (light areas)
- Common vs. rare process paths
- Unusual delays requiring investigation
This analysis is essential for identifying where to focus process improvement efforts for maximum impact.
---
*This documentation is part of the mindzie Studio process mining platform.*
---
## Time Between Selected Events
Section: Calculators
URL: https://docs.mindziestudio.com/mindzie_studio/calculators/time-between-selected-events
Source: /docs-master/mindzieStudio/calculators/time-between-selected-events/page.md
# Time Between Selected Events
## Overview
The Time Between Selected Events calculator measures the time elapsed between two specific events in your process. This targeted calculator helps you analyze durations for critical process segments and understand timing between key milestones.
## Common Uses
- Measure the time between two specific activities
- Analyze time between order placement and order fulfillment
- Calculate duration from invoice posted to payment received
- Measure lead times between critical milestones
- Identify delays in specific process segments
## Settings
**Event Attribute:** Select the event attribute to use for filtering events (e.g., 'Activity Name' to measure between activities, or 'Resource' to measure between events performed by specific resources).
**From Value:** Select the first event that will represent the start time.
**First or Last:** Specify whether to use the first or last occurrence of the start event in the case.
**To Value:** Select the second event that will represent the end time.
**First or Last:** Specify whether to use the first or last occurrence of the end event in the case.
## Examples
### Example 1: Time from Invoice Entry to Payment
**Scenario:** You want to calculate the time between when an invoice is entered and when it's finally paid.
**Settings:**
- Event Attribute: Activity Name
- From Value: Enter Invoice
- First or Last: First
- To Value: Payment
- First or Last: Last (to capture final payment)
**Output:**
The calculator displays key metrics:
- Mean: Average time between the two events
- Median: Middle value (useful when outliers exist)
- Max: Longest time observed
- Additional statistical measures
**Insights:** This reveals invoice payment lead times and helps identify slow-paying scenarios.
### Example 2: Time from Due Date Miss to Payment
**Scenario:** You want to calculate how long overdue invoices remain unpaid after missing their due date.
**Settings:**
- Event Attribute: Activity Name
- From Value: Due Date Missed
- First or Last: First
- To Value: Invoice Paid
- First or Last: First
**Output:**
The calculator shows metrics including a maximum time of 118 years, clearly indicating a data entry error.
**Important Note on Outliers:**
As seen in this example, data quality issues can create extreme outliers (like 118 years). In such cases:
- The **mean** value is heavily affected by outliers
- The **median** is more informative, representing the middle value unaffected by extreme outliers
- Always review maximum values to identify data quality issues
**Insights:** This analysis reveals:
- Typical overdue payment duration (use median)
- Data quality issues requiring correction
- Real payment behavior patterns after due dates pass
---
*This documentation is part of the mindzie Studio process mining platform.*
---
## Time From Case Start To Selected Event
Section: Calculators
URL: https://docs.mindziestudio.com/mindzie_studio/calculators/time-from-case-start-to-selected-event
Source: /docs-master/mindzieStudio/calculators/time-from-case-start-to-selected-event/page.md
# Time From Case Start to Selected Event
## Overview
The Time From Case Start to Selected Event calculator measures the time elapsed from the beginning of a case to a specific event or milestone. This calculator helps you analyze how long it takes for cases to reach important process milestones.
## Common Uses
- Analyze the time it takes for a case to reach a certain point in the process
- Measure time to first customer contact
- Calculate time to first approval
- Determine how quickly cases progress through initial stages
- Identify delays in early process steps
## Settings
**Column Name:** Select the attribute that represents the event you are interested in (e.g., 'Activity Name' if you want to measure time to a specific activity, or 'Status' to measure time to a status change).
**Column Values:** Select the specific event value you want to measure time to (e.g., specific activity name like "Enter Invoice").
**Selection Type:** Specify how to select the event occurrence:
| Type | Description |
|------|-------------|
| All | Selects all occurrences of the event in the case |
| First | Selects the first occurrence of the event (most common) |
| Last | Selects the last occurrence of the event |
| Max | Selects the occurrence with the maximum value |
| Min | Selects the occurrence with the minimum value |
## Example
### Time from Case Start to Invoice Entry
**Scenario:** You want to see how long it takes from the start of a case until an invoice is entered into the system.
**Settings:**
- Column Name: Activity Name
- Column Values: Enter Invoice
- Selection Type: First
**Output:**
The calculator displays time statistics in days:
- **Mean:** Average time from case start to invoice entry
- **Median:** Middle value of times (useful when outliers exist)
- **Max:** Longest time observed
- Additional statistical measures
**Insights:**
This analysis reveals:
- How quickly invoices are entered after case initiation
- Potential delays in the initial data entry process
- Variations in processing speed
- Cases that experience unusually long delays before invoice entry
**Usage Tip:** Use "First" selection type for initial occurrence analysis, or "Last" to measure time to final occurrence of repeated activities.
---
*This documentation is part of the mindzie Studio process mining platform.*
---
## Trend
Section: Calculators
URL: https://docs.mindziestudio.com/mindzie_studio/calculators/trend
Source: /docs-master/mindzieStudio/calculators/trend/page.md
# Trend
## Overview
The Trend calculator compares changes in a selected attribute over time or across different groups. This powerful analytical tool helps you identify improvements, degradations, and patterns by comparing metrics between two periods or categories.
## Common Uses
- Compare two years by sales, invoice amounts, or number of cases
- Analyze sales changes between Q1 and Q2 across different regions
- Track improvements or deterioration in process metrics
- Compare performance before and after process changes
- Identify seasonal trends and patterns
## Settings
**Trend Type:**
| Type | Description | Use When |
|------|-------------|----------|
| Single Value | Calculate an overall trend value showing whether your attribute (e.g., duration or cost) had a positive or negative change | You want to see if total cost increased or decreased from Y1 to Y2 |
| Multiple Value | Calculate trend values for different categories (e.g., for different item types or Vendors) | You want to see how cost changed from Y1 to Y2 for different item types |
**Breakdown Attribute** (for Multiple Value only): Select the attribute that defines categories (e.g., Vendor, Item Type, Region).
**Filter:** Define two trend groups using filters:
- Click three dots -> Open Filters -> Add Filter
- **Group 1:** The base group (e.g., Year 2020, Q1 2021)
- **Group 2:** The comparison group (e.g., Year 2021, Q2 2021)
**Aggregate Function:** Choose how to compare values:
- Sum
- Case count
- Average
- Other aggregate functions
**Value Attribute:** If not using Case Count or Event Count, select the attribute to compare across groups.
**Is Increase Good:**
- Check this box if an increase represents a positive change (e.g., increase in sales)
- Leave unchecked if an increase represents a negative change (e.g., increase in costs)
## Examples
### Example 1: Comparing Total Item Quantities Q1 to Q2 2021
**Scenario:** You want to see whether there was an increase or decrease in total items ordered between Q1 and Q2 2021.
**Settings:**
- Trend Type: Single Value
- Aggregate Function: Sum
- Value Attribute: Item Quantity
- Is Increase Good: Checked (more items ordered is positive)
- **Group 1 Filter:** Time Period = Q1 2021
- **Group 2 Filter:** Time Period = Q2 2021
**Output:**
The calculator displays the change between the two periods, showing:
- Absolute difference in quantities
- Percentage change
- Trend direction (positive or negative indicator)
**Insights:** This reveals whether order volume is growing or declining quarter-over-quarter.
### Example 2: Comparing Item Costs by Type Across Quarters
**Scenario:** You want to compare how total costs changed for different item types from Q1 to Q2 2021.
**Settings:**
- Trend Type: Multiple Value
- Breakdown Attribute: Item Type
- Aggregate Function: Sum
- Value Attribute: Total Cost
- Is Increase Good: Unchecked (cost increases are negative)
- **Group 1 Filter:** Time Period = Q1 2021
- **Group 2 Filter:** Time Period = Q2 2021
**Output:**
The calculator provides two view options:
1. **Trend View (default):** Visual representation showing:
- Item Type in the 1st column
- Quantity difference in the 2nd column
- Percentage difference in the 3rd column
- Color coding based on positive/negative trends
2. **Grid View:** Tabular format with detailed numerical data for analysis and export
**Insights:** This breakdown reveals:
- Which product categories are seeing cost increases/decreases
- Specific items driving overall cost trends
- Categories requiring cost management attention
---
*This documentation is part of the mindzie Studio process mining platform.*
---
## Utilization
Section: Calculators
URL: https://docs.mindziestudio.com/mindzie_studio/calculators/utilization
Source: /docs-master/mindzieStudio/calculators/utilization/page.md
# Utilization
## Overview
The Utilization calculator analyzes how efficiently resources, machines, stations, or departments are being used in your manufacturing or operational processes. It calculates the percentage of time each category is actively working compared to the total process duration, helping you identify underutilized capacity and potential bottlenecks.
## Common Uses
- Monitor machine and equipment utilization to optimize production capacity
- Identify underutilized workstations that could handle additional workload
- Detect overutilized resources that may be creating bottlenecks
- Compare utilization rates across different departments or production lines
- Support capacity planning decisions with data-driven utilization insights
- Evaluate the efficiency of resource allocation in manufacturing processes
## Settings
**Category Attribute:** Select the attribute that defines the resource category you want to analyze (e.g., 'Station', 'Machine', 'Resource', 'Department'). This attribute groups your process events into distinct categories for utilization analysis. The calculator will compute how much time each category was actively working.
**Note:** The attribute you select must be either a case-level or event-level attribute containing categorical data (text, boolean, or numeric values).
## Examples
### Example 1: Manufacturing Station Utilization
**Scenario:** A manufacturing plant has five production stations (Assembly, Testing, Packaging, Quality Control, and Shipping). You want to understand which stations are underutilized and which are running at full capacity to make informed decisions about resource allocation.
**Settings:**
- Category Attribute: Station
**Output:**
The calculator displays a table with the following columns:
- **Category:** The station name
- **Utilization:** The utilization ratio (e.g., 0.85 represents 85% utilization)
- **Total Active Time:** The total time the station was actively working
Example results:
| Station | Utilization | Total Active Time |
|---------|-------------|-------------------|
| Testing | 0.92 | 147 days |
| Assembly | 0.88 | 141 days |
| Quality Control | 0.75 | 120 days |
| Packaging | 0.62 | 99 days |
| Shipping | 0.45 | 72 days |
**Insights:** Testing and Assembly stations are running at near-capacity (92% and 88%), indicating they may become bottlenecks during peak periods. The Shipping station shows only 45% utilization, suggesting it has significant spare capacity that could handle increased throughput from upstream improvements. Quality Control at 75% has moderate headroom for additional work.
**Action Items:**
- Consider adding capacity to Testing and Assembly to prevent bottlenecks
- Investigate if Shipping resources could be reallocated or used for other tasks
- Monitor Quality Control as production volume increases
### Example 2: Production Line Resource Efficiency
**Scenario:** A production facility operates three parallel production lines (Line A, Line B, Line C). Management wants to evaluate which line is being used most efficiently and identify opportunities for better load balancing.
**Settings:**
- Category Attribute: Production Line
**Output:**
| Production Line | Utilization | Total Active Time |
|-----------------|-------------|-------------------|
| Line A | 0.95 | 342 days |
| Line B | 0.78 | 281 days |
| Line C | 0.58 | 209 days |
**Insights:** Line A is running at 95% utilization, indicating it's operating near maximum capacity with little room for additional orders. Line B at 78% is well-utilized but has some buffer capacity. Line C at 58% shows significant underutilization - nearly half of available production time is idle.
**Action Items:**
- Investigate why Line C is underutilized (maintenance issues, skills gaps, scheduling problems, or insufficient demand)
- Consider redistributing work from Line A to Line C to balance capacity and reduce strain on Line A
- Evaluate whether Line C could be temporarily shut down during low-demand periods to reduce operational costs
### Example 3: Department Workload Analysis
**Scenario:** A service organization has multiple departments (Customer Service, Technical Support, Billing, and Administration). Leadership wants to understand departmental workload distribution to support staffing decisions.
**Settings:**
- Category Attribute: Department
**Output:**
| Department | Utilization | Total Active Time |
|------------|-------------|-------------------|
| Technical Support | 0.89 | 226 days |
| Customer Service | 0.82 | 208 days |
| Billing | 0.71 | 180 days |
| Administration | 0.55 | 140 days |
**Insights:** Technical Support shows high utilization at 89%, suggesting the team is working close to capacity and may experience delays during demand spikes. Customer Service at 82% is well-utilized with reasonable buffer capacity. Administration at 55% indicates significant idle time or capacity for additional responsibilities.
**Action Items:**
- Hire additional Technical Support staff or cross-train other departments to provide backup during peak periods
- Assess whether Administration's lower utilization reflects seasonal patterns, inefficient processes, or an opportunity to consolidate roles
## Output
The calculator produces a data table with three columns:
- **Category:** The distinct values from your selected attribute (e.g., station names, production lines, departments)
- **Utilization:** The utilization ratio expressed as a decimal (0.0 to 1.0+), where 0.75 means 75% utilization. Values above 1.0 can occur when resources handle overlapping work.
- **Total Active Time:** The cumulative time this category was actively working, shown as a time duration
You can visualize this output as:
- **Grid view:** Tabular format with sortable columns
- **Bar chart:** Visual comparison of utilization rates across categories
- **Interactive drill-down:** Click on any category to filter your data and explore cases handled by that specific resource
---
*This documentation is part of the mindzie Studio process mining platform.*
---
## Value Count In Case Attribute
Section: Calculators
URL: https://docs.mindziestudio.com/mindzie_studio/calculators/value-count-in-case-attribute
Source: /docs-master/mindzieStudio/calculators/value-count-in-case-attribute/page.md
# Value Count in Case Attribute
## Overview
The Value Count in Case Attribute calculator counts the number of distinct values in a selected case-level attribute. This calculator helps you understand the variety and uniqueness of categorical data at the case level.
## Common Uses
- Calculate number of unique customers or vendors
- Count distinct product categories
- Identify number of different case variants
- Measure diversity in organizational units
- Add value count metrics to dashboards
## Settings
**Column Name:** Select the case-level attribute for which you want to calculate the value count (e.g., Customer, Vendor, Product Category, Variant).
## Examples
### Example 1: Count of Distinct Vendors
**Scenario:** You want to know how many different vendors you work with.
**Settings:**
- Column Name: Vendor
**Output:**
The calculator displays a single number, such as "3,238", indicating you have 3,238 distinct vendor names in your dataset.
**Insights:** This helps you:
- Understand vendor diversity in your supply chain
- Assess consolidation opportunities
- Evaluate vendor management complexity
### Example 2: Count of Distinct Process Variants
**Scenario:** You want to know how many different process paths (variants) exist in your cases.
**Settings:**
- Column Name: ~calc~Variant
**Output:**
The calculator shows "121", indicating there are 121 different process variants in the dataset.
**Insights:** This reveals:
- Process complexity and variation
- Standardization opportunities
- How many different ways the process is executed
- Potential for process simplification
**Usage Tip:** A high variant count suggests process flexibility but may indicate lack of standardization, while a low count suggests standardized but potentially inflexible processes.
---
*This documentation is part of the mindzie Studio process mining platform.*
---
## Value Count In Event Attribute
Section: Calculators
URL: https://docs.mindziestudio.com/mindzie_studio/calculators/value-count-in-event-attribute
Source: /docs-master/mindzieStudio/calculators/value-count-in-event-attribute/page.md
# Value Count in Event Attribute
## Overview
The Value Count in Event Attribute calculator counts the number of distinct values in a selected event-level attribute. This calculator helps you understand the variety and uniqueness of categorical data at the activity/event level.
## Common Uses
- Calculate number of unique activities
- Count distinct resources
- Identify number of different reasons for changes
- Measure diversity in event-level categories
- Add value count metrics to dashboards
## Settings
**Activity Attribute:** Select the event-level attribute for which you want to calculate the value count (e.g., Resource, Activity Name, Change Reason, Status).
## Example
### Count of Distinct Resources
**Scenario:** You want to know how many different resources (people, systems, or organizational units) perform activities in your process.
**Settings:**
- Activity Attribute: Resource
**Output:**
The calculator displays a single number representing the count of unique resources that have performed activities in the dataset.
**Insights:** This helps you:
- Understand workforce or system diversity involved in the process
- Assess resource allocation and availability
- Identify the scale of resource management required
- Compare against organizational structure to find gaps or overlaps
**Additional Use Cases:**
**Counting Unique Activities:**
- Activity Attribute: Activity Name
- Reveals process complexity in terms of distinct steps
**Counting Change Reasons:**
- Activity Attribute: Change Reason
- Shows variety of issues requiring invoice or order modifications
**Usage Tip:** Combine this calculator with filters to analyze value counts for specific process segments or time periods (e.g., how many resources work on high-value orders vs. standard orders).
---
*This documentation is part of the mindzie Studio process mining platform.*
---
## Variant DNA
Section: Calculators
URL: https://docs.mindziestudio.com/mindzie_studio/calculators/variant-dna
Source: /docs-master/mindzieStudio/calculators/variant-dna/page.md
# Variant DNA
## Overview
The Variant DNA calculator analyzes how cases flow through your process by grouping them into process variants. A process variant is a unique sequence of activities that cases follow from start to finish. This calculator provides comprehensive statistics about variant distribution, including frequency counts, percentages, and performance metrics, helping you understand which paths are most common and how they perform.
## Common Uses
- Identify the most common process paths to understand typical case flow
- Discover process deviations and non-standard workflows
- Compare performance across different process variants
- Focus process improvement efforts on high-frequency variants
- Detect compliance issues by identifying unexpected process paths
- Understand process complexity by analyzing variant distribution
## Settings
There are no specific settings for this calculator beyond the standard title and description fields. The calculator automatically analyzes all cases in your filtered dataset and groups them by their process variant.
## Examples
### Example 1: Understanding Order Processing Paths
**Scenario:** You want to understand the different paths orders take through your fulfillment process and identify which paths are most common.
**Settings:**
- No additional settings required - simply add the calculator to your analysis
**Output:**
The calculator shows that your process has 45 unique variants:
- Variant 1 (32.5% of cases): Create Order -> Check Inventory -> Ship -> Invoice -> Payment
- Variant 2 (28.3% of cases): Create Order -> Check Inventory -> Backorder -> Ship -> Invoice -> Payment
- Variant 3 (15.2% of cases): Create Order -> Check Inventory -> Ship -> Invoice -> Payment Reminder -> Payment
- Remaining 42 variants (24.0% of cases): Various other paths
Average durations:
- Variant 1: 3.2 days
- Variant 2: 8.5 days (includes backorder delay)
- Variant 3: 12.1 days (includes payment reminder delay)
**Insights:** The top 3 variants account for 76% of all orders. Variant 2 shows significantly longer duration due to backorder processing, while Variant 3 reveals payment collection issues. This helps prioritize improvement efforts on the inventory management system (Variant 2) and payment reminder process (Variant 3).
### Example 2: Compliance Analysis in Invoice Processing
**Scenario:** You want to verify that invoices are following the approved three-way match process and identify any deviations.
**Settings:**
- No additional settings required
**Output:**
The calculator reveals 12 different process variants:
- Variant 1 (68% of cases): Receive Invoice -> Match PO -> Match Receipt -> Approve -> Pay
- Variant 2 (18% of cases): Receive Invoice -> Match PO -> Approve -> Pay (missing receipt match)
- Variant 3 (8% of cases): Receive Invoice -> Approve -> Pay (missing all matching steps)
- Variant 4 (6% of cases): Receive Invoice -> Match PO -> Match Receipt -> Rework -> Match PO -> Approve -> Pay
Average durations:
- Variant 1: 5.2 days (standard process)
- Variant 2: 3.8 days (faster but non-compliant)
- Variant 3: 2.1 days (fastest but highest risk)
- Variant 4: 12.5 days (includes rework)
**Insights:** Only 68% of invoices follow the compliant three-way match process. The 26% of invoices in Variants 2 and 3 bypass required controls, creating audit risk despite faster processing. The 6% of cases with rework (Variant 4) indicate data quality issues requiring investigation. This analysis helps you enforce compliance while understanding why users bypass controls.
### Example 3: Measuring Process Standardization
**Scenario:** After implementing a process standardization initiative, you want to measure whether cases are following fewer, more standardized paths.
**Settings:**
- Compare results before and after standardization initiative
**Output:**
Before standardization:
- 87 unique variants
- Top 5 variants: 45% of cases
- Top 10 variants: 62% of cases
- Average variant duration spread: 4-18 days
After standardization:
- 34 unique variants (61% reduction)
- Top 5 variants: 78% of cases (33 percentage point increase)
- Top 10 variants: 91% of cases (29 percentage point increase)
- Average variant duration spread: 5-9 days (more consistent)
**Insights:** The standardization initiative successfully reduced process complexity. More cases now follow standardized paths (78% vs 45% in top 5 variants), and performance is more predictable with tighter duration ranges. The remaining 22% of cases following non-standard variants can be analyzed individually to determine if they represent legitimate exceptions or opportunities for further standardization.
### Example 4: Identifying Rework Patterns by Variant
**Scenario:** You want to understand which process paths contain the most rework activities.
**Settings:**
- No additional settings required
**Output:**
The calculator identifies variants with repeated activities:
- Variant 1 (40%): Standard path with no rework - 4 activities, 3.2 days average
- Variant 5 (12%): Contains double "Verify Documents" - 6 activities, 8.1 days average
- Variant 8 (8%): Contains triple "Credit Check" - 8 activities, 11.5 days average
- Variant 12 (5%): Contains double "Approve" after rejection - 7 activities, 9.8 days average
**Insights:** Variants with rework patterns show significantly longer durations. The repeated "Verify Documents" in 12% of cases suggests documentation quality issues. The triple "Credit Check" in 8% of cases indicates either incomplete credit information or changing customer circumstances. By clicking on individual variants, you can drill down to see the specific cases and investigate root causes.
### Example 5: Regional Process Variation Analysis
**Scenario:** You want to compare how different regional offices process the same type of cases.
**Settings:**
- First, filter to Region A, run Variant DNA
- Then, filter to Region B, run Variant DNA
- Compare the variant distributions
**Output:**
Region A:
- 15 unique variants
- Top variant: 65% of cases following standard path
- Average duration: 4.5 days
Region B:
- 38 unique variants
- Top variant: 28% of cases following standard path
- Average duration: 7.2 days
**Insights:** Region A shows much better process standardization with 65% of cases following the same path, while Region B has high process variability. Region B's longer average duration (7.2 days vs 4.5 days) correlates with this lack of standardization. This suggests Region A's practices should be shared with Region B, or Region B may handle more complex case types requiring investigation.
## Output
The calculator provides multiple views of variant data:
**Variant Table:** Displays each variant with the following columns:
- **Variant Name:** Identifier for the process variant (Variant 1, Variant 2, etc.)
- **Count:** Number of cases following this variant
- **Percent:** Percentage of total cases following this variant
- **Cumulative Percent:** Running total percentage when ordered by frequency (useful for Pareto analysis)
- **Average Duration:** Mean duration for cases following this variant
**Interactive Features:**
- **Click on a variant:** Drill down to see the specific activity sequence and all cases following that variant
- **Sort capabilities:** Click column headers to sort by frequency, percentage, or duration
- **Export options:** Export variant data for further analysis in external tools
**Variant Details:** When you click on a specific variant, you can see:
- The complete activity sequence for that variant
- Individual cases following this path
- Duration distribution for cases in this variant
- Ability to create filters to isolate cases in specific variants
---
*This documentation is part of the mindzie Studio process mining platform.*
---
## Variant Performance
Section: Calculators
URL: https://docs.mindziestudio.com/mindzie_studio/calculators/variant-performance
Source: /docs-master/mindzieStudio/calculators/variant-performance/page.md
# Variant Performance
## Overview
The Variant Performance calculator analyzes performance metrics across different process variants, helping you identify which process paths are most efficient and where bottlenecks occur. Unlike Variant DNA which focuses on frequency and distribution, Variant Performance provides detailed duration statistics including mean, median, maximum, and total duration for each variant. This enables data-driven decisions about which process paths to optimize, which to promote as best practices, and where to allocate improvement resources.
The calculator supports flexible configuration including minimum case count thresholds to ensure statistical significance, sorting by multiple metrics, and limiting results to top performers.
## Common Uses
- Identify the fastest and slowest process variants to prioritize optimization efforts
- Compare variant performance to establish best practice pathways
- Monitor variant duration trends to detect process degradation over time
- Allocate resources based on variant complexity and performance characteristics
- Benchmark different process paths to guide standardization initiatives
- Detect performance outliers within variants using maximum duration analysis
## Settings
**Maximum Number of Variants:** Limits results to the top N variants based on your sorting criteria. Default is 10. Setting this to a higher number (e.g., 20) provides more comprehensive analysis, while lower numbers (e.g., 5) focus on the most relevant variants.
**Sort By:** Determines which performance metric to use for ranking variants. Options include:
- Case Count: Sorts by the number of cases following each variant (useful for finding high-volume paths)
- Mean Duration: Sorts by average case duration (default, best for identifying typical performance)
- Median Duration: Sorts by middle duration value (less affected by outliers)
- Maximum Duration: Sorts by longest case in each variant (highlights worst-case scenarios)
- Total Duration: Sorts by cumulative duration across all cases (shows overall capacity consumption)
**Sort Order:** Controls whether highest or lowest values appear first:
- Descending: Shows variants with highest values first (e.g., slowest average duration)
- Ascending: Shows variants with lowest values first (e.g., fastest average duration)
**Duration Unit:** Specifies the time unit for all duration metrics. Options include Seconds, Minutes, Hours, Days (default), Weeks, Months, and Years. Choose based on your process timeframe - use Hours for operational processes, Days for standard business processes, or Weeks/Months for long-running processes.
**Minimum Case Count:** Filters out variants with fewer cases than this threshold. Default is 10. This ensures statistical significance by excluding rare variants with insufficient data. Set to 0 to include all variants regardless of frequency.
## Examples
### Example 1: Optimizing Order Fulfillment Performance
**Scenario:** Your order fulfillment process has multiple variants, and you want to identify which paths deliver the fastest turnaround while maintaining sufficient volume to be statistically meaningful.
**Settings:**
- Maximum Number of Variants: 10
- Sort By: Mean Duration
- Sort Order: Ascending
- Duration Unit: Days
- Minimum Case Count: 20
**Output:**
The calculator reveals performance across your top 10 variants:
| Variant | Cases | Mean | Median | Max | Total |
|---------|-------|------|--------|-----|-------|
| Variant 3 | 245 | 2.1 days | 2.0 days | 4.5 days | 514.5 days |
| Variant 1 | 892 | 3.2 days | 3.0 days | 8.1 days | 2,854.4 days |
| Variant 5 | 156 | 4.8 days | 4.2 days | 12.3 days | 748.8 days |
| Variant 2 | 634 | 8.5 days | 7.9 days | 18.2 days | 5,389.0 days |
Variant 3 shows the fastest mean duration at 2.1 days with 245 cases - enough volume to be statistically significant. Variant 1, your highest-volume path with 892 cases, averages 3.2 days - only slightly slower but processing far more cases. Variant 2 shows significantly longer duration at 8.5 days average.
**Insights:** Variant 3 represents your best practice path. Analyzing what makes it efficient (direct shipping, pre-verified inventory, streamlined approvals) can help optimize other variants. Variant 1's high volume and reasonable performance make it a good baseline. Variant 2's poor performance (8.5 days average) combined with high volume (634 cases) represents the largest improvement opportunity - investigate root causes like backorder delays or approval bottlenecks.
### Example 2: Identifying Performance Outliers in Invoice Processing
**Scenario:** You want to identify process variants with the worst-case performance issues by examining maximum durations, which reveal cases that take exceptionally long regardless of average performance.
**Settings:**
- Maximum Number of Variants: 15
- Sort By: Maximum Duration
- Sort Order: Descending
- Duration Unit: Days
- Minimum Case Count: 10
**Output:**
Sorting by maximum duration reveals problem variants:
| Variant | Cases | Mean | Median | Max | Total |
|---------|-------|------|--------|-----|-------|
| Variant 8 | 47 | 12.5 days | 9.2 days | 45.3 days | 587.5 days |
| Variant 12 | 23 | 8.1 days | 6.8 days | 38.7 days | 186.3 days |
| Variant 4 | 156 | 6.2 days | 5.5 days | 32.1 days | 967.2 days |
| Variant 1 | 892 | 5.2 days | 4.8 days | 18.5 days | 4,638.4 days |
Variant 8, despite only 47 cases, shows a maximum duration of 45.3 days - more than double any other variant. The large gap between median (9.2 days) and maximum (45.3 days) indicates severe outlier cases. Variant 12 also shows concerning maximum duration (38.7 days) relative to its median (6.8 days).
**Insights:** The extreme maximum durations in Variants 8 and 12 suggest specific cases getting stuck in exception handling, approval escalations, or rework loops. Click on these variants to drill down into the longest-running cases and identify common characteristics (specific suppliers, high amounts, missing documentation). These outliers likely represent process failures that need exception-handling improvements rather than average process optimization.
### Example 3: Capacity Planning Using Total Duration Analysis
**Scenario:** You need to understand which process variants consume the most overall capacity to allocate resources effectively and prioritize automation efforts.
**Settings:**
- Maximum Number of Variants: 20
- Sort By: Total Duration
- Sort Order: Descending
- Duration Unit: Hours
- Minimum Case Count: 5
**Output:**
Sorting by total duration reveals capacity consumption:
| Variant | Cases | Mean | Median | Max | Total |
|---------|-------|------|--------|-----|-------|
| Variant 1 | 2,340 | 18.5 hrs | 16.2 hrs | 45.3 hrs | 43,290 hrs |
| Variant 2 | 1,567 | 24.3 hrs | 21.8 hrs | 68.4 hrs | 38,078 hrs |
| Variant 4 | 892 | 36.7 hrs | 32.1 hrs | 89.2 hrs | 32,736 hrs |
| Variant 7 | 456 | 48.2 hrs | 44.5 hrs | 112.3 hrs | 21,979 hrs |
Variant 1 consumes 43,290 total hours despite having the fastest mean duration (18.5 hours) due to its high volume (2,340 cases). Variant 4 shows slower performance (36.7 hours mean) but still ranks third in total capacity consumption. Variant 7 has the slowest mean (48.2 hours) but fewer cases.
**Insights:** Total duration analysis reveals where process capacity is actually being consumed. Variant 1's 43,290 hours represents the largest improvement opportunity - even small per-case reductions (e.g., cutting 2 hours from the 18.5 hour average) yield massive capacity savings (4,680 hours annually). This makes Variant 1 the prime candidate for automation despite already having good mean performance. Variant 4 offers medium-term opportunity - its slower performance and significant volume warrant investigation.
### Example 4: Monitoring Process Standardization Progress
**Scenario:** After implementing process standardization, you want to track whether performance is converging across variants by examining median durations, which are less affected by outliers than mean values.
**Settings:**
- Maximum Number of Variants: 10
- Sort By: Median Duration
- Sort Order: Ascending
- Duration Unit: Days
- Minimum Case Count: 15
**Output:**
Before standardization:
| Variant | Cases | Mean | Median | Max |
|---------|-------|------|--------|-----|
| Variant 1 | 445 | 4.2 days | 3.8 days | 15.2 days |
| Variant 3 | 234 | 6.5 days | 5.9 days | 18.7 days |
| Variant 5 | 156 | 9.8 days | 8.2 days | 24.5 days |
| Variant 8 | 89 | 14.3 days | 12.1 days | 38.9 days |
After standardization:
| Variant | Cases | Mean | Median | Max |
|---------|-------|------|--------|-----|
| Variant 1 | 823 | 3.9 days | 3.7 days | 11.2 days |
| Variant 2 | 612 | 4.2 days | 4.0 days | 12.5 days |
| Variant 3 | 387 | 4.8 days | 4.5 days | 13.8 days |
The median duration range narrowed from 3.8-12.1 days (8.3 day spread) to 3.7-4.5 days (0.8 day spread), demonstrating successful standardization. More cases now follow the top 3 variants (1,822 vs 835 previously), and maximum durations dropped across the board.
**Insights:** Process standardization successfully reduced performance variability. The tight clustering of median durations (3.7-4.5 days) indicates consistent execution across variants. The reduction in maximum durations shows better exception handling. The shift in case distribution toward top variants demonstrates adoption of standardized paths. This validates the standardization initiative and provides a baseline for ongoing monitoring.
### Example 5: Comparing High-Volume vs Low-Volume Variant Performance
**Scenario:** You want to understand if high-volume variants perform differently than low-volume variants by adjusting the minimum case count threshold and analyzing results.
**Settings:**
- Maximum Number of Variants: 10
- Sort By: Case Count
- Sort Order: Descending
- Duration Unit: Days
- Minimum Case Count: 100
**Output:**
High-volume variants (min 100 cases):
| Variant | Cases | Mean | Median | Max | Total |
|---------|-------|------|--------|-----|-------|
| Variant 1 | 1,245 | 5.2 days | 4.8 days | 18.5 days | 6,474 days |
| Variant 2 | 892 | 6.3 days | 5.9 days | 22.3 days | 5,620 days |
| Variant 3 | 634 | 7.1 days | 6.5 days | 28.7 days | 4,501 days |
| Variant 4 | 456 | 4.8 days | 4.5 days | 15.2 days | 2,189 days |
Now change Minimum Case Count to 10 and re-run:
| Variant | Cases | Mean | Median | Max |
|---------|-------|------|--------|-----|
| Variant 27 | 23 | 2.1 days | 2.0 days | 4.5 days |
| Variant 15 | 45 | 2.8 days | 2.6 days | 6.8 days |
| Variant 4 | 456 | 4.8 days | 4.5 days | 15.2 days |
| Variant 1 | 1,245 | 5.2 days | 4.8 days | 18.5 days |
Low-volume variants (Variants 27 and 15) show significantly faster performance (2.1-2.8 days mean) compared to high-volume variants (4.8-7.1 days mean).
**Insights:** The performance disparity reveals that low-volume variants likely represent expedited or simplified paths (rush orders, simple products, VIP customers) while high-volume variants handle standard, more complex cases. Before attempting to scale the fast low-volume processes, verify they can handle the characteristics of high-volume cases. Alternatively, segment cases to route simple cases through expedited variants, potentially reducing overall processing time by directing appropriate cases to faster paths.
## Output
The calculator produces a performance table with the following metrics for each variant:
**Variant:** Identifier for the process variant (e.g., Variant 1, Variant 2). Click on the variant name to drill down and see the complete activity sequence and all cases following this path.
**Case Count:** Number of cases following this variant. Higher case counts provide more statistical confidence in the performance metrics.
**Mean Duration:** Average duration across all cases in the variant, expressed in your selected time unit. Best for understanding typical performance when outliers are not a major concern.
**Median Duration:** Middle duration value when cases are sorted by duration. More robust than mean when outliers are present, representing the typical case performance.
**Maximum Duration:** Longest case duration within the variant. Useful for identifying worst-case scenarios, SLA compliance issues, and exception handling problems.
**Total Duration:** Sum of all case durations in the variant. Reveals overall capacity consumption and helps prioritize improvement efforts based on total organizational impact.
**Interactive Features:**
- Click any variant row to filter the process view to cases in that variant
- Sort by clicking column headers to reorder results dynamically
- Export data for further analysis in spreadsheet or BI tools
- Combine with filters to analyze variant performance for specific time periods or case segments
**Visualization Options:**
The table can be used in dashboards alongside:
- Variant DNA calculator to see frequency and performance together
- Process maps filtered by variant to visualize different paths
- Time-based charts to track variant performance trends over time
---
*This documentation is part of the mindzie Studio process mining platform.*
---
## What If Simulation Rework
Section: Calculators
URL: https://docs.mindziestudio.com/mindzie_studio/calculators/what-if-simulation-rework
Source: /docs-master/mindzieStudio/calculators/what-if-simulation-rework/page.md
# What-If Simulation: Rework
## Overview
The What-If Simulation: Rework calculator shows potential savings from reducing activity repetitions (rework) in your process. This interactive simulation tool helps you model the financial and time impact of eliminating or reducing rework by allowing you to specify reduction targets and see the projected benefits.
By analyzing repeated activities and their associated costs, you can quantify the value of process improvements and make data-driven decisions about where to invest in reducing rework.
## Common Uses
- Model the financial impact of reducing rework by specific percentages
- Calculate potential time savings from eliminating repeated activities
- Quantify the business case for process improvement initiatives
- Compare different rework reduction scenarios
- Support strategic decisions about quality improvement investments
- Prioritize which repeated activities to address first based on potential savings
## Settings
**Rework Attribute:** Select the attribute that identifies whether a case contains rework. This is typically a boolean or flag attribute created by an enrichment that detects repeated activities.
**Time Impact Attribute:** Select the attribute that represents the additional time added due to rework (typically measured in hours or days).
**Cost Impact Attribute:** Select the attribute that represents the financial cost of rework (typically measured in currency).
**Rework Reduction Target (%):** Use the interactive slider to specify the percentage of rework you want to eliminate (e.g., 25%, 50%, 75%, 100%).
## Examples
### Example 1: Analyzing Purchase Order Rework Reduction
**Scenario:** Your procurement process has significant rework due to incomplete purchase orders requiring revisions. You want to model the savings from reducing this rework through better training and validation.
**Settings:**
- Rework Attribute: Has PO Rework
- Time Impact Attribute: Rework Time Added (hours)
- Cost Impact Attribute: Rework Cost
- Rework Reduction Target: 50% (using slider)
**Output:**
The calculator displays an interactive panel with a slider at the bottom. Adjust the slider to model different reduction scenarios.
**Current State (0% Reduction):**
- Cases with Rework: 1,245 cases (28% of total)
- Total Time Impact: 3,738 hours
- Total Cost Impact: $187,000
- Average Rework per Case: 3.0 hours
**Scenario: 50% Rework Reduction:**
- Cases with Rework: 623 cases (14% of total)
- Total Time Impact: 1,869 hours
- Total Cost Impact: $93,500
- Time Savings: 1,869 hours
- Cost Savings: $93,500
**Scenario: 75% Rework Reduction:**
- Cases with Rework: 311 cases (7% of total)
- Total Time Impact: 935 hours
- Total Cost Impact: $46,750
- Time Savings: 2,803 hours
- Cost Savings: $140,250
**Insights:**
This simulation helps you:
- **Quantify improvement value:** See exact dollar and time savings for different reduction targets
- **Build business cases:** Use data to justify process improvement investments
- **Set realistic goals:** Model achievable reduction targets based on resources
- **Track progress:** Compare actual results against simulated targets
- **Prioritize initiatives:** Focus on high-impact rework reduction opportunities
### Example 2: Invoice Processing Rework Analysis
**Scenario:** Your accounts payable process experiences rework due to missing information on invoices. You want to understand the potential impact of implementing automated validation to reduce these issues.
**Settings:**
- Rework Attribute: Invoice Requires Rework
- Time Impact Attribute: Additional Processing Time
- Cost Impact Attribute: Rework Cost
- Rework Reduction Target: 80% (using slider)
**Output:**
**Current State:**
- Cases with Rework: 856 invoices (19% of total)
- Total Time Impact: 2,568 hours
- Total Cost Impact: $128,400
- Average Rework per Case: 3.0 hours
**Scenario: 80% Rework Reduction:**
- Cases with Rework: 171 invoices (4% of total)
- Total Time Impact: 514 hours
- Total Cost Impact: $25,680
- Time Savings: 2,054 hours (80% reduction)
- Cost Savings: $102,720 (80% reduction)
**Insights:**
An 80% reduction would save over $100,000 annually and 2,000 hours of processing time. This data supports:
- **Investment justification:** The savings easily justify automated validation systems
- **ROI calculation:** Compare savings against implementation costs
- **Resource planning:** Understand FTE impact of rework reduction
- **Performance targets:** Set specific reduction goals for the team
**Strategic Applications:**
- Evaluate automation opportunities with clear ROI projections
- Model the impact of training programs on rework rates
- Assess value of process redesign initiatives
- Support quality improvement program planning
## Output
The calculator provides an interactive visualization with:
**Slider Control:** Adjust the rework reduction percentage from 0% to 100% to model different scenarios.
**Metrics Display:** Shows current state and projected state for the selected reduction target, including:
- Number of cases with rework (current and projected)
- Total time impact (current and projected)
- Total cost impact (current and projected)
- Time savings from the reduction
- Cost savings from the reduction
- Percentage of cases affected
**Visualization:** The output typically includes charts or graphs showing the relationship between reduction targets and savings, making it easy to communicate the business case for improvement initiatives.
---
*This documentation is part of the mindzie Studio process mining platform.*
---
## What If Simulation Working Capital
Section: Calculators
URL: https://docs.mindziestudio.com/mindzie_studio/calculators/what-if-simulation-working-capital
Source: /docs-master/mindzieStudio/calculators/what-if-simulation-working-capital/page.md
# What-If Simulation: Working Capital
## Overview
The What-If Simulation: Working Capital calculator shows the effect of payment timeliness on working capital. This interactive simulation tool helps you understand the financial impact of paying invoices earlier or later than current practices.
## Common Uses
- Analyze how working capital will be affected if invoices are paid earlier or later
- Model the financial impact of payment policy changes
- Optimize payment timing for cash flow management
- Understand trade-offs between working capital and supplier relationships
- Support strategic decisions about payment practices
## Settings
**Payment Timeliness Attribute:** Select the attribute that represents payment timeliness (number of days early or late). To set up this attribute, refer to the Enrichment documentation.
**Due Date Attribute:** Select the attribute that represents when the invoice should be paid.
**Invoice Paid Late Attribute:** Select the attribute that represents the actual date when the invoice was paid.
**Total Amount Value Base Attribute:** Select the attribute that represents the total invoice amount.
**Number of Months:** Specify the number of months to base the analysis on (e.g., last 12 months).
**Paid Late Is Bad:** Check this box to indicate that paying invoices late is undesirable in this analysis (affects visualization colors and trend indicators).
## Example
### Analyzing Working Capital Impact of Payment Timing
**Scenario:** You want to understand how your working capital would be affected by changing your payment timing practices.
**Settings:**
- Payment Timeliness Attribute: Payment Timeliness
- Due Date Attribute: Invoice Due Date
- Invoice Paid Late Attribute: Invoice Paid Date
- Total Amount Value Base Attribute: Total Invoice Amount
- Number of Months: 12
- Paid Late Is Bad: Checked
**Output:**
The calculator displays an interactive panel with a slider at the bottom. Use the slider to simulate different payment timing scenarios.
**Scenario 1 - Pay 5 Days Late:**
- Working Capital Impact: +$182,000 (increase)
- Average Payment Days: 27 days
- Interpretation: Holding onto cash longer increases working capital but may damage supplier relationships
**Scenario 2 - Pay 5 Days Early:**
- Working Capital Impact: -$1,000,000 (decrease)
- Average Payment Days: 17 days
- Interpretation: Paying early reduces working capital but may earn early payment discounts and strengthen supplier relationships
**Insights:**
This simulation helps you:
- **Balance competing priorities:** Cash conservation vs. supplier relationships
- **Quantify trade-offs:** See exact dollar impact of payment timing changes
- **Test scenarios:** Model different payment policies before implementation
- **Optimize timing:** Find the optimal payment schedule for your business needs
- **Support negotiations:** Use data to justify payment terms with suppliers
**Strategic Applications:**
- Evaluate feasibility of early payment discount programs
- Plan cash flow requirements for different payment strategies
- Assess impact of payment term renegotiations
- Model effects of improved accounts payable processes
---
*This documentation is part of the mindzie Studio process mining platform.*
---
## World Map
Section: Calculators
URL: https://docs.mindziestudio.com/mindzie_studio/calculators/world-map
Source: /docs-master/mindzieStudio/calculators/world-map/page.md
# World Map
## Overview
The World Map calculator visualizes process data on an interactive geographic map, showing the distribution of cases, events, or values across countries and regions. This powerful visualization tool helps you understand geographic patterns in your process data, identify regional trends, and analyze performance across different locations.
## Common Uses
- Visualize order volumes by customer country
- Map invoice amounts by vendor location
- Identify regional processing delays or bottlenecks
- Analyze shipment destinations and logistics patterns
- Compare process performance across geographic markets
- Track regional compliance rates or quality metrics
## Settings
**Geographic Attribute:** Select the attribute that contains geographic information (typically country names, country codes, or region names). The calculator recognizes standard country names and ISO country codes.
**Aggregate Function:** Choose how to aggregate and display data for each geographic location:
- **Case Count:** Count the number of cases per country (default)
- **Event Count:** Count the number of events per country
- **Sum:** Calculate the total of a selected attribute per country
- **Average:** Calculate the mean of a selected attribute per country
- **Minimum:** Find the minimum value per country
- **Maximum:** Find the maximum value per country
**Value Attribute:** For aggregate functions like Sum or Average, select the numerical attribute you want to analyze (e.g., Invoice Amount, Case Duration, Order Quantity).
**Color Scale:** The map automatically applies a color gradient from light to dark, where darker colors represent higher values. This makes it easy to identify regions with high activity or values at a glance.
## Examples
### Example 1: Mapping Invoice Volumes by Customer Country
**Scenario:** You want to visualize which countries generate the most invoices to understand your global customer distribution.
**Settings:**
- Geographic Attribute: Customer Country
- Aggregate Function: Case Count
- Color Scale: Automatic (light to dark gradient)
**Output:**
The calculator displays an interactive world map with countries colored according to the number of invoices:
- Darker shaded countries have higher invoice volumes
- Lighter shaded countries have fewer invoices
- Unshaded countries have no invoice data
- Hovering over a country shows the exact count
- Clicking on a country filters the data to show only cases from that location
**Insights:** This visualization reveals your most important geographic markets, helps identify underperforming regions, and can guide decisions about regional sales strategies, support resources, or market expansion opportunities.
### Example 2: Analyzing Total Revenue by Country
**Scenario:** You want to see which countries contribute the most revenue to your business.
**Settings:**
- Geographic Attribute: Customer Country
- Aggregate Function: Sum
- Value Attribute: Invoice Amount
**Output:**
The map displays countries colored by total revenue:
- Darkest countries represent your highest revenue markets
- Medium-shaded countries show moderate revenue
- Light-shaded countries indicate lower revenue markets
- The color intensity makes it immediately obvious where your business is strongest
**Insights:** This revenue map helps you:
- Prioritize markets for investment and resources
- Identify untapped markets with growth potential
- Understand geographic revenue concentration and risk
- Guide regional pricing and discount strategies
### Example 3: Comparing Average Case Duration by Vendor Location
**Scenario:** You want to identify if certain geographic regions have longer processing times when working with vendors.
**Settings:**
- Geographic Attribute: Vendor Country
- Aggregate Function: Average
- Value Attribute: Case Duration
**Output:**
The map shows average processing duration by vendor location:
- Darker regions indicate longer average processing times
- Lighter regions show faster processing
- This pattern might reveal logistics challenges, time zone impacts, or regional efficiency differences
**Insights:** Geographic duration analysis helps you:
- Identify regions requiring process improvements
- Understand how location impacts service levels
- Make informed decisions about vendor selection
- Plan for regional variations in processing capacity
## Output
The calculator provides an interactive world map visualization with the following features:
**Interactive Elements:**
- Hover over countries to see exact values
- Click on countries to filter data to that geographic region
- Zoom in and out to focus on specific regions
- Pan across the map to explore different areas
**Visual Encoding:**
- Color gradient from light (low values) to dark (high values)
- Automatic scaling based on your data range
- Clear visual hierarchy showing geographic patterns
- Legend showing the value range and color scale
**Data Table:**
Switch to Grid view (dropdown in top right) to see a tabular listing of all countries and their values, which can be useful for:
- Exact numerical comparisons
- Sorting by value or country name
- Exporting data for further analysis
The World Map calculator works best with data that includes recognized country names or ISO country codes. Ensure your geographic attribute contains standardized location information for accurate mapping.
---
*This documentation is part of the mindzie Studio process mining platform.*
---
## Overview
Section: Enrichments
URL: https://docs.mindziestudio.com/mindzie_studio/enrichments/overview
Source: /docs-master/mindzieStudio/enrichments/overview/page.md
# Enrichments
Enrichments
Enrichments allow you to enhance your process data with additional information, calculated fields,
and derived attributes. Use enrichments to add context and depth to your process analysis.
There are 87 enrichments available for you to choose from. Browse them all below.
⭐ Recommended Enrichments (8)
Most frequently used enrichments for process analysis and optimization.
---
## 2 Way Match
Section: Enrichments
URL: https://docs.mindziestudio.com/mindzie_studio/enrichments/2-way-match
Source: /docs-master/mindzieStudio/enrichments/2-way-match/page.md
# 2 Way Match
## Overview
The 2 Way Match enrichment compares numerical values from two sets of activities within a case to determine if they match, creating a powerful validation mechanism for document reconciliation and process compliance analysis. This enrichment calculates aggregate values (such as sum, average, first, or last occurrence) from specified activities and their associated numeric attributes, then compares these values to identify matches or discrepancies. The enrichment creates both a boolean attribute indicating whether the values match and an optional difference attribute showing the variance between the two values.
This enrichment is essential in procurement, financial, and logistics processes where multiple documents or activities need to be reconciled against each other. For instance, in a procure-to-pay process, you can verify that purchase order quantities match goods receipt quantities, or that invoice amounts align with purchase order values. The enrichment operates at the case level, making it ideal for validating multi-step processes where different activities record related information that should be consistent. By supporting multiple aggregation methods (sum, average, min, max, first, last), the enrichment adapts to various business scenarios, from simple last-value comparisons to complex summations across multiple line items.
The 2 Way Match enrichment provides the foundation for three-way and four-way matching scenarios by establishing the basic comparison logic. Once you've identified mismatches, you can use filtering and analytics to understand patterns in discrepancies, measure process compliance rates, and route cases with mismatches for manual review or approval.
## Common Uses
- Validate purchase order quantities against goods receipt quantities in procurement processes
- Compare invoice amounts to purchase order values for financial compliance and payment approval
- Reconcile sales order quantities with shipment quantities in order fulfillment
- Verify that planned production quantities match actual production output in manufacturing
- Compare requisition amounts to approved budget allocations in spend management
- Validate service delivery hours against contracted hours in professional services
- Reconcile inventory counts between physical counts and system records
- Verify that customer order quantities match picking and packing quantities in warehouse operations
## Settings
**Activity Names 1:** Specify one or more activities that represent the first document or transaction type in your comparison. For example, in a procurement process, this might be "CreatePurchaseOrderLine" or "UpdatePurchaseOrderLine" to capture the ordered quantities. You can select multiple activities if the same type of information appears in different activity names. The enrichment will retrieve the numeric value from these activities based on the Event Selection 1 method you choose.
**Event Selection 1:** Choose how to aggregate values when multiple instances of Activity Names 1 exist in a case. Options include:
- **First:** Uses the value from the first occurrence of the activity in the case
- **Last:** Uses the value from the last occurrence (default - most common for document updates)
- **Sum:** Adds together all values from all occurrences (ideal for line-item totals)
- **Average:** Calculates the mean of all values
- **Min:** Uses the smallest value found
- **Max:** Uses the largest value found
**Activity Names 2:** Specify one or more activities that represent the second document or transaction type to compare against the first. For example, in procurement, this might be "ProductReceipt" or "GoodsReceipt" to capture the received quantities. The enrichment will compare the aggregated value from these activities against the value from Activity Names 1.
**Event Selection 2:** Choose how to aggregate values when multiple instances of Activity Names 2 exist in a case. This uses the same options as Event Selection 1. The default is "Sum" which is commonly used for receipts that may occur in multiple shipments. For example, if a purchase order for 100 units is fulfilled through three shipments (40, 35, and 25 units), selecting "Sum" will correctly total 100 units for comparison.
**Column Name:** Select the numeric event attribute that contains the values to compare. This must be a numeric field (integer, decimal, or float) that exists on the events for both activity sets. Common examples include "Quantity," "Amount," "Value," "Hours," or "Weight." The enrichment will extract this attribute's value from the specified activities and perform the comparison.
**New Attribute Name:** Specify the name for the boolean case attribute that will store the match result. Choose a descriptive name that clearly indicates what is being compared, such as "PO_Matches_GR_Quantity" or "Invoice_Amount_Matches_PO." This attribute will contain True when the values match exactly and False when they differ. Default example: "Quantity for CreatePurchaseOrderLine = ProductReceipt"
**New Attribute Difference Name:** Optionally specify the name for a numeric case attribute that will store the difference between the two values. This attribute calculates Value1 minus Value2, allowing you to analyze the magnitude and direction of discrepancies. For example, a positive difference indicates the first value exceeds the second (e.g., ordered more than received), while a negative difference indicates the opposite. Leave this blank if you only need the boolean match indicator. Default example: "Quantity difference CreatePurchaseOrderLine - ProductReceipt"
**Filter Cases (Advanced):** Optionally apply filters to limit which cases are evaluated by this enrichment. This advanced setting allows you to perform the 2-way match only on cases meeting specific criteria, such as cases with certain statuses, date ranges, or attribute values. Cases not matching the filter will not have the new attributes calculated.
## Examples
### Example 1: Purchase Order to Goods Receipt Quantity Matching
**Scenario:** In a procure-to-pay process, you need to validate that the total quantity received matches the quantity ordered. Purchase orders may be updated multiple times before final approval, and goods may be received in multiple shipments. You want to identify cases where received quantities don't match the final ordered quantity.
**Settings:**
- Activity Names 1: CreatePurchaseOrderLine, UpdatePurchaseOrderLine
- Event Selection 1: Last
- Activity Names 2: GoodsReceipt, ProductReceipt
- Event Selection 2: Sum
- Column Name: Quantity
- New Attribute Name: PO_Quantity_Matches_GR
- New Attribute Difference Name: PO_GR_Quantity_Variance
**Output:**
Creates two new case attributes:
1. **PO_Quantity_Matches_GR** (Boolean):
- True: Cases where final ordered quantity equals total received quantity (e.g., ordered 100, received 100)
- False: Cases with discrepancies (e.g., ordered 100, received 95 or 105)
2. **PO_GR_Quantity_Variance** (Numeric):
- 0: Perfect match
- +5: Ordered 5 units more than received (short shipment)
- -5: Received 5 units more than ordered (over shipment)
Sample data:
- Case 12345: Ordered 100 units (last PO update), received in 3 shipments (40, 35, 25 = 100 total) → PO_Quantity_Matches_GR = True, Variance = 0
- Case 12346: Ordered 50 units, received 48 units → PO_Quantity_Matches_GR = False, Variance = +2
- Case 12347: Ordered 75 units, received 80 units → PO_Quantity_Matches_GR = False, Variance = -5
**Insights:** This enrichment enables you to filter for cases with quantity discrepancies, analyze the frequency and magnitude of over/under shipments, identify suppliers with consistent quantity issues, and route mismatched cases for approval or investigation. You can calculate metrics like "98% of orders have exact quantity matches" or "average quantity variance is +2.3 units, indicating slight under-delivery trend."
### Example 2: Invoice to Purchase Order Amount Validation
**Scenario:** In accounts payable, you need to verify that invoice amounts match the original purchase order values before processing payment. This two-way match ensures that you're only paying for what was actually ordered and helps catch pricing discrepancies or invoice errors.
**Settings:**
- Activity Names 1: CreatePurchaseOrder, ApprovePurchaseOrder
- Event Selection 1: Last
- Activity Names 2: ReceiveInvoice
- Event Selection 2: Sum
- Column Name: TotalAmount
- New Attribute Name: Invoice_Matches_PO_Amount
- New Attribute Difference Name: Invoice_PO_Amount_Difference
**Output:**
Creates two new case attributes showing invoice-to-PO matching:
1. **Invoice_Matches_PO_Amount** (Boolean):
- True: Invoice amount exactly matches PO amount (e.g., both $5,000.00)
- False: Amounts differ (e.g., PO for $5,000.00, invoice for $5,250.00)
2. **Invoice_PO_Amount_Difference** (Numeric):
- 0.00: Exact match
- +500.00: PO amount exceeds invoice by $500 (undercharged)
- -250.00: Invoice exceeds PO by $250 (overcharged, requires approval)
Sample data:
- Case INV-001: PO Amount $10,000, Invoice Amount $10,000 → Match = True, Difference = $0
- Case INV-002: PO Amount $7,500, Invoice Amount $7,750 → Match = False, Difference = -$250
- Case INV-003: PO Amount $3,200, Invoice Amount $3,200 → Match = True, Difference = $0
**Insights:** This enables automatic approval routing for matching invoices, flags invoices exceeding PO amounts for manual review, identifies systematic pricing issues with specific vendors, and measures straight-through processing rates. You can create business rules like "auto-approve if Invoice_Matches_PO_Amount is True" or "require manager approval if Invoice_PO_Amount_Difference exceeds $500."
### Example 3: Sales Order to Shipment Quantity Reconciliation
**Scenario:** In an order fulfillment process, you need to ensure that the quantity shipped matches what the customer ordered. Orders may be modified before fulfillment, and shipments may occur in multiple packages. This validation helps identify short shipments and ensures customer satisfaction.
**Settings:**
- Activity Names 1: CreateSalesOrder, ModifySalesOrder
- Event Selection 1: Last
- Activity Names 2: ShipProduct, ConfirmShipment
- Event Selection 2: Sum
- Column Name: OrderedQuantity
- New Attribute Name: Order_Shipment_Quantity_Match
- New Attribute Difference Name: Unshipped_Quantity
**Output:**
Creates attributes tracking order fulfillment accuracy:
1. **Order_Shipment_Quantity_Match** (Boolean):
- True: Complete fulfillment (ordered 50, shipped 50)
- False: Partial or over fulfillment (ordered 50, shipped 48 or 52)
2. **Unshipped_Quantity** (Numeric):
- 0: Fully shipped
- +2: 2 units short (backorder situation)
- -2: 2 units over-shipped (potential inventory issue)
Sample data:
- Order SO-5001: Ordered 200 units, shipped in 4 batches (75, 50, 50, 25 = 200) → Match = True, Unshipped = 0
- Order SO-5002: Ordered 150 units, shipped 145 units → Match = False, Unshipped = +5
- Order SO-5003: Ordered 100 units, shipped 100 units → Match = True, Unshipped = 0
**Insights:** This enrichment helps measure order fulfillment accuracy rates, identify products frequently experiencing short shipments, calculate backorder quantities and trends, and trigger customer service notifications for incomplete shipments. You can create KPIs like "95% complete fill rate" or "average unfulfilled quantity: 2.3 units per incomplete order."
### Example 4: Manufacturing Production Plan to Actual Output
**Scenario:** In a manufacturing process, you need to compare planned production quantities against actual output to measure production efficiency and identify capacity or quality issues. Production plans may be updated, and output is recorded as batches are completed.
**Settings:**
- Activity Names 1: CreateProductionOrder, UpdateProductionPlan
- Event Selection 1: Last
- Activity Names 2: RecordProduction, CompleteProductionBatch
- Event Selection 2: Sum
- Column Name: Quantity
- New Attribute Name: Production_Met_Plan
- New Attribute Difference Name: Production_Variance
**Output:**
Creates attributes measuring production performance:
1. **Production_Met_Plan** (Boolean):
- True: Actual production equals plan (planned 1000, produced 1000)
- False: Over or under production (planned 1000, produced 950 or 1050)
2. **Production_Variance** (Numeric):
- 0: Met plan exactly
- +50: Under-produced by 50 units (capacity or quality issue)
- -50: Over-produced by 50 units (efficiency gain or forecasting issue)
Sample data:
- Production Order PR-8001: Planned 5000 units, produced 5000 → Met_Plan = True, Variance = 0
- Production Order PR-8002: Planned 3000 units, produced 2850 → Met_Plan = False, Variance = +150
- Production Order PR-8003: Planned 1500 units, produced 1520 → Met_Plan = False, Variance = -20
**Insights:** This enables calculation of production efficiency rates, identification of production lines with consistent under-performance, analysis of variance patterns by product type or shift, and early warning for capacity constraints. You can measure "85% of production orders meet plan exactly" or "average production variance: -2.5% (slight over-production)."
### Example 5: Service Hours - Contracted vs. Delivered
**Scenario:** In a professional services organization, you need to verify that the hours delivered to clients match the contracted hours in the service agreement. Service contracts may be amended, and hours are logged across multiple service delivery activities.
**Settings:**
- Activity Names 1: CreateServiceContract, AmendServiceContract
- Event Selection 1: Last
- Activity Names 2: LogServiceHours, SubmitTimesheet
- Event Selection 2: Sum
- Column Name: Hours
- New Attribute Name: Hours_Match_Contract
- New Attribute Difference Name: Hours_Variance
**Output:**
Creates attributes for service delivery validation:
1. **Hours_Match_Contract** (Boolean):
- True: Delivered hours equal contracted hours (contracted 80, delivered 80)
- False: Over or under delivery (contracted 80, delivered 75 or 85)
2. **Hours_Variance** (Numeric):
- 0: Exact match
- +5: Under-delivered by 5 hours (potential client dissatisfaction)
- -10: Over-delivered by 10 hours (revenue leakage if not billable)
Sample data:
- Project SVC-2001: Contracted 160 hours, delivered 160 hours → Match = True, Variance = 0
- Project SVC-2002: Contracted 120 hours, delivered 115 hours → Match = False, Variance = +5
- Project SVC-2003: Contracted 200 hours, delivered 215 hours → Match = False, Variance = -15
**Insights:** This enrichment enables measurement of service delivery accuracy, identification of projects with scope creep (over-delivery), detection of under-delivery requiring corrective action, and analysis of billing accuracy. You can track "92% of projects deliver contracted hours" or "average over-delivery: 3.2 hours per project."
## Output
The 2 Way Match enrichment creates one or two new case attributes depending on your configuration:
**Match Indicator Attribute (Always Created):** A boolean attribute with the name specified in "New Attribute Name" that contains:
- **True:** When the aggregated value from Activity Names 1 equals the aggregated value from Activity Names 2
- **False:** When the values differ by any amount
- **No value (null):** When either or both activity sets don't exist in the case, or when the specified column doesn't contain values for the activities
**Difference Attribute (Optional):** If you specify a "New Attribute Difference Name," the enrichment creates a numeric attribute containing the difference calculated as Value1 minus Value2:
- **Positive values:** Indicate the first value exceeds the second (e.g., ordered more than received)
- **Negative values:** Indicate the second value exceeds the first (e.g., received more than ordered)
- **Zero:** Indicates an exact match
- **No value (null):** When the comparison cannot be performed due to missing activities or values
Both attributes are created as derived case attributes and integrate seamlessly with other mindzieStudio features:
**Filtering:** Create filters to show only cases with mismatches (Match = False), cases with significant variances (Difference > threshold), or cases with specific variance patterns (Difference > 0 for short shipments).
**Conformance Analysis:** Calculate match rates and variance statistics across your entire dataset or specific segments. For example, measure "98% of purchase orders have matching receipts" or "average quantity variance: 2.3 units."
**Process Visualization:** Split process flows based on match results to visualize different paths for matched versus mismatched cases, helping identify where mismatches are introduced or resolved.
**Calculators:** Use the boolean match attribute in logical expressions to create complex validation rules, such as combining two-way match results with other compliance checks.
**Dashboards and KPIs:** Create metrics showing match rates over time, variance distributions, and compliance trends. Build charts showing variance patterns by supplier, product category, or time period.
**Automation and Routing:** Use match results to drive process automation, such as auto-approving cases where the match is True and routing cases with False to manual review queues.
The enrichment performs comparisons only on cases where both activity sets exist and contain numeric values in the specified column. Cases where activities or values are missing will have null values for the output attributes, allowing you to identify incomplete cases separately from mismatched cases.
## See Also
- **Compare Case Attributes** - For comparing two case-level attributes directly without aggregating from activities
- **Compare Event Attributes for Two Activities** - For comparing event attributes from two specific activities without aggregation
- **Attribute Changes Between Two Activities** - For detecting changes in attribute values between two activities
- **Subtract** - For calculating differences between case attributes created by other enrichments
- **Filter Process Log** - For filtering cases based on match results and variances
- **Divide** - For calculating ratio-based comparisons between matched values
---
*This documentation is part of the mindzie Studio process mining platform.*
---
## Activity Copy Latest Event Value
Section: Enrichments
URL: https://docs.mindziestudio.com/mindzie_studio/enrichments/activity-copy-latest-event-value
Source: /docs-master/mindzieStudio/enrichments/activity-copy-latest-event-value/page.md
# Activity Copy Latest EventValue
## Overview
The Activity Copy Latest EventValue enrichment propagates event attribute values forward through the chronological sequence of activities within each case. This powerful data propagation tool captures the most recent value from specified source activities and copies it to a target activity whenever it occurs, creating a "forward fill" pattern that ensures critical information flows through your process timeline.
This enrichment solves a common process mining challenge: maintaining context across activities when important data appears at specific points in the process but is needed for analysis at later stages. For example, when a customer places an order, their priority level might be recorded at the "Order Received" activity, but you need that priority information available at subsequent "Quality Check" or "Ship Order" activities. The enrichment tracks values as they appear and intelligently carries them forward to where they're needed.
Unlike simple attribute copying that requires exact activity sequences, this enrichment is robust to process variations. It maintains the latest known value throughout the case, regardless of how many events occur between the source and target activities. This makes it ideal for scenarios where data appears intermittently but needs to be available at multiple downstream points for filtering, analysis, or decision-making.
## Common Uses
- Propagate customer priority levels from order entry to all fulfillment activities for priority-based analysis
- Carry forward the latest approved budget amount from approval activities to subsequent spending activities
- Copy the most recent quality rating from inspection activities to shipping and delivery activities
- Propagate the last known inventory location from check-in activities to all subsequent handling activities
- Carry forward pricing tier information from quote activities to order processing activities
- Copy the latest assigned resource from assignment activities to execution activities
- Propagate risk assessment scores from evaluation activities to approval and execution activities
- Carry forward the most recent status update from checkpoint activities to completion activities
## Settings
**Filter:** Optional filter to apply the enrichment only to specific cases. The enrichment will process only cases that match the filter criteria. Leave empty to apply to all cases in your dataset. This is useful when different processes require different value propagation rules.
**Activity Name:** The target activity where the latest known value will be written. Every time this activity occurs in a case, it will receive the most recent value captured from the source activities. Choose the activity or activities where you need the propagated information available for analysis or filtering.
**New Event Attribute Name:** The name for the new event attribute that will be created on the target activity. This attribute will contain the latest value from the source activities. Choose a descriptive name that clearly indicates both the source and purpose, such as "Latest_Customer_Priority" or "Current_Approved_Budget".
**Copy Activities:** The source activities from which to capture values. The enrichment monitors these activities in chronological order and tracks the most recent value encountered. You can specify multiple activities, and the enrichment will update its tracked value whenever any of them occurs. Select all activities that can provide or update the value you want to propagate.
**Copy Activity Attribute:** The event attribute from the source activities whose value should be propagated forward. This attribute must exist on the source activities and will determine what data is carried forward. The attribute can be numeric, text, date, or boolean type, and its data type will be preserved in the new attribute.
## Examples
### Example 1: Customer Priority Propagation in Order Fulfillment
**Scenario:** Your e-commerce process captures customer priority level (Gold, Silver, Bronze) at the "Order Received" activity. You need this priority information available at "Quality Check" and "Pack Order" activities to identify high-priority shipments and apply appropriate service levels, but the priority attribute isn't naturally present on these downstream activities.
**Settings:**
- Filter: (empty - apply to all cases)
- Activity Name: Quality Check, Pack Order
- New Event Attribute Name: Customer_Priority_Level
- Copy Activities: Order Received, Update Customer Status
- Copy Activity Attribute: CustomerPriority
**Output:**
Creates a new event attribute "Customer_Priority_Level" on all "Quality Check" and "Pack Order" activities. For each case, the enrichment tracks the latest priority value from "Order Received" or "Update Customer Status" activities. When "Quality Check" or "Pack Order" occurs, it receives the most recent priority value seen in the case. If a customer's status is updated during order processing, the new priority flows forward to subsequent activities.
**Insights:** This enables filtering quality checks by customer priority to ensure Gold customers receive extra attention, analyzing pack times by priority tier to verify service level compliance, and creating priority-aware performance dashboards that show throughput and cycle time segmented by customer importance.
### Example 2: Budget Tracking Through Approval Process
**Scenario:** A procurement process involves multiple budget approval stages. Each "Budget Approval" activity records an approved amount, which may be revised through the process. You need the current approved budget available at "Create Purchase Order" and "Issue Payment" activities to validate spending against authorized amounts.
**Settings:**
- Filter: Department = "Procurement"
- Activity Name: Create Purchase Order, Issue Payment
- New Event Attribute Name: Approved_Budget_Amount
- Copy Activities: Initial Budget Approval, Revised Budget Approval, Final Budget Approval
- Copy Activity Attribute: ApprovedAmount
**Output:**
Creates "Approved_Budget_Amount" on purchase order and payment activities containing the most recent budget approval. If a case has approvals of $10,000, then a revision to $12,000, the purchase order and payment activities will show $12,000. If multiple approvals occur, each subsequent approval updates the tracked value, and the latest one propagates to downstream activities.
**Insights:** Enables validation that purchase orders don't exceed approved budgets, analysis of how often revised budgets are needed, identification of payments that occurred after budget changes, and tracking of spending patterns relative to authorized amounts.
### Example 3: Quality Rating Propagation in Manufacturing
**Scenario:** A manufacturing process conducts quality inspections at multiple stages ("Initial Inspection", "Mid-Process Check", "Final Inspection"). Each inspection assigns a quality rating. You need the latest quality rating available at "Package Product" and "Ship Product" activities to ensure only properly rated items are shipped.
**Settings:**
- Filter: Product_Line = "Electronics"
- Activity Name: Package Product, Ship Product
- New Event Attribute Name: Latest_Quality_Rating
- Copy Activities: Initial Inspection, Mid-Process Check, Final Inspection
- Copy Activity Attribute: QualityRating
**Output:**
Creates "Latest_Quality_Rating" on packaging and shipping activities showing the most recent inspection result. If a product receives ratings of "A", "B", and "A" at successive inspections, the packaging and shipping activities will show "A" (the final rating). This ensures downstream activities always have access to the current quality assessment.
**Insights:** Allows filtering of shipping activities to identify products shipped with low quality ratings, analysis of whether quality improves or degrades through the manufacturing process, tracking of how quality ratings correlate with customer returns, and validation that shipping only occurs after acceptable final inspections.
### Example 4: Inventory Location Tracking in Warehousing
**Scenario:** A warehousing process moves items through multiple locations. "Check In", "Transfer", and "Relocate" activities update the warehouse location. You need the current location available at "Pick Item" and "Load for Shipping" activities to optimize routing and identify picking inefficiencies.
**Settings:**
- Filter: (empty)
- Activity Name: Pick Item, Load for Shipping
- New Event Attribute Name: Current_Warehouse_Location
- Copy Activities: Check In, Transfer Warehouse, Relocate Inventory
- Copy Activity Attribute: WarehouseLocation
**Output:**
Creates "Current_Warehouse_Location" on picking and loading activities showing where the item currently resides. As items move through check-in (Zone A), transfer (Zone B), and relocation (Zone C), the picking activity receives "Zone C" - the latest known location. This provides accurate location context for each picking operation.
**Insights:** Enables analysis of picking efficiency by warehouse zone, identification of cases where items were picked from suboptimal locations, tracking of how many transfers occur before picking, and optimization of warehouse layout based on actual picking patterns.
### Example 5: Risk Score Propagation Through Loan Processing
**Scenario:** A loan application process includes risk assessment activities that calculate and update risk scores. "Automated Risk Check" provides an initial score, "Manual Risk Review" may revise it, and "Final Risk Assessment" provides the definitive score. You need the current risk score at "Generate Loan Terms" and "Approve Loan" activities for risk-appropriate decision making.
**Settings:**
- Filter: Loan_Type = "Business Loan"
- Activity Name: Generate Loan Terms, Approve Loan
- New Event Attribute Name: Current_Risk_Score
- Copy Activities: Automated Risk Check, Manual Risk Review, Final Risk Assessment
- Copy Activity Attribute: RiskScore
**Output:**
Creates "Current_Risk_Score" on loan terms and approval activities containing the latest risk assessment. If a loan receives an automated score of 72, manual review adjusts it to 68, and final assessment confirms 68, both the loan terms generation and approval activities receive 68. This ensures decisions are based on the most current risk evaluation.
**Insights:** Allows analysis of how loan terms vary by risk score, identification of cases where approvals occurred despite high risk scores, tracking of how often manual review changes automated risk assessments, and validation that high-risk loans receive appropriate oversight.
## Output
The Activity Copy Latest EventValue enrichment creates a new event-level attribute on the specified target activity or activities. The attribute contains the most recent value captured from the source activities as of each target activity's occurrence time.
**Attribute Properties:**
- **Location:** Event table, specific to the target activity or activities
- **Data Type:** Matches the source attribute (numeric, text, date, boolean)
- **Derivation:** Marked as a derived attribute for lineage tracking
- **Display Format:** Inherits formatting from the source attribute
- **Scope:** Only populated on the specified target activity events
**Value Assignment Rules:**
- The enrichment processes events in chronological order within each case
- When a source activity occurs, its attribute value is captured and held as the "latest known value"
- When the target activity occurs, it receives the current latest known value
- If the target activity occurs before any source activity, the new attribute remains null
- If multiple source activities occur between target activities, only the most recent value is propagated
- Each case maintains its own independent tracking of latest values
**Integration Points:**
- New attribute available in event filters for the target activity
- Can be used in event-level calculators and filters
- Appears in event data exports when target activity is included
- Available for visualization in variant analysis and timeline views
- Can be referenced in subsequent enrichments as source data
- Enables activity-specific filtering and analysis based on propagated values
**Performance Characteristics:**
- Processes events sequentially within each case (single pass)
- Memory efficient as it tracks only one value per case at a time
- Suitable for large event logs as it doesn't require cross-case lookups
- Execution time scales linearly with total event count
---
*This documentation is part of the mindzie Studio process mining platform.*
---
## Activity Order Classification
Section: Enrichments
URL: https://docs.mindziestudio.com/mindzie_studio/enrichments/activity-order-classification
Source: /docs-master/mindzieStudio/enrichments/activity-order-classification/page.md
# Activity Order Classification
## Overview
The Activity Order Classification enrichment automatically analyzes the timestamps in your event log to identify cases where the sequence of activities cannot be determined with certainty due to timestamp limitations. This data quality enrichment is essential for process mining accuracy, as uncertain activity ordering can lead to incorrect process models, misleading performance metrics, and unreliable conformance checking results.
Many source systems record only dates without time components, or multiple activities share the exact same timestamp due to bulk data imports, batch processing, or timestamp granularity limitations. When events within a case have identical timestamps (either same date or same datetime), the actual sequence in which these activities occurred becomes ambiguous. This enrichment automatically detects and categorizes these uncertainty patterns, creating attributes that allow you to assess the reliability of your process discovery results and identify cases where ordering assumptions may be incorrect.
The enrichment requires no configuration and performs comprehensive timestamp analysis across both date-level and time-level precision, categorizing uncertainty patterns as "SameDay" (date recorded but no time component), "SameTime" (identical datetime values), or "SameDayAndTime" (case contains both patterns). This enables you to understand the scope and nature of timestamp uncertainty in your event log and make informed decisions about data quality requirements and process analysis reliability.
## Common Uses
- Assess data quality before performing process discovery or conformance checking
- Identify cases where activity sequences are ambiguous due to timestamp limitations
- Detect bulk-loaded or batch-processed events that share identical timestamps
- Evaluate whether source system timestamp granularity is sufficient for process analysis
- Flag cases where manual ordering assumptions may be required for accurate analysis
- Measure the prevalence of timestamp uncertainty across your entire event log
- Filter out low-quality cases where uncertain ordering would compromise analysis results
## Settings
This enrichment requires no configuration. It automatically analyzes all timestamps in your event log and creates comprehensive attributes that categorize timestamp uncertainty patterns at both the event level and case level. Simply add this enrichment to your workflow to begin analyzing timestamp quality.
## Examples
### Example 1: Healthcare Patient Journey Analysis
**Scenario:** A hospital is analyzing patient flow through their emergency department but discovers that many activities on the same day have no recorded time component, making it impossible to determine the actual sequence of treatments and examinations.
**Settings:**
No configuration required - the enrichment automatically detects timestamp uncertainty.
**Output:**
The enrichment creates the following attributes:
Event-level attributes:
- **OrderUncertainty:** TRUE for events where ordering cannot be determined with certainty
- **OrderUncertaintyCategory:** "SameDay" for events that share a date with other events but have no time component
Case-level attributes:
- **UncertainEventOrder:** TRUE (this case has uncertain ordering)
- **UncertainEventOrderCount:** 8 (eight events in this case have uncertain ordering)
- **UncertainEventOrderCategory:** "SameDay"
For a patient case with events recorded as:
- 2024-03-15 00:00:00 - Patient Registration
- 2024-03-15 00:00:00 - Triage Assessment
- 2024-03-15 00:00:00 - Vital Signs Check
- 2024-03-15 00:00:00 - Physician Consultation
- 2024-03-15 14:30:00 - Lab Results Received
- 2024-03-15 14:30:00 - Treatment Decision
- 2024-03-15 14:30:00 - Medication Administered
- 2024-03-15 18:00:00 - Patient Discharge
The first four events (all at 00:00:00) are marked as "SameDay" uncertainty because they share a date but the time component is missing. The three events at 14:30:00 would be marked as "SameTime" uncertainty because they share an identical datetime. This case would be categorized as "SameDayAndTime" because it exhibits both patterns.
**Insights:** The hospital discovers that 67% of emergency department cases have uncertain event ordering due to missing time components in their registration system. This reveals a critical data quality issue that must be addressed before accurate process discovery can be performed. They can now filter cases to analyze only those with complete timestamps or work with IT to enhance timestamp granularity in their source systems.
### Example 2: Financial Transaction Processing
**Scenario:** A bank is analyzing credit card transaction approval processes but notices that batch-processed transactions often share identical timestamps, making it impossible to determine the true sequence of fraud checks, authorization steps, and approval decisions.
**Settings:**
No configuration required.
**Output:**
For a transaction case processed in a batch system:
- 2024-10-15 02:15:33 - Transaction Received
- 2024-10-15 02:15:33 - Fraud Risk Assessment
- 2024-10-15 02:15:33 - Credit Limit Check
- 2024-10-15 02:15:33 - Merchant Verification
- 2024-10-15 02:15:33 - Transaction Approved
- 2024-10-15 02:15:34 - Confirmation Sent
Event attributes:
- First five events: **OrderUncertainty** = TRUE, **OrderUncertaintyCategory** = "SameTime"
- Last event: **OrderUncertainty** = FALSE
Case attributes:
- **UncertainEventOrder:** TRUE
- **UncertainEventOrderCount:** 5
- **UncertainEventOrderCategory:** "SameTime"
**Insights:** The bank identifies that all batch-processed transactions (approximately 40% of their daily volume) have uncertain ordering for critical fraud and credit checks. This revelation prompts them to investigate whether their batch processing system maintains an internal sequence number that could be used to establish true ordering, or whether they need to enhance timestamp precision in their transaction logging system.
### Example 3: Manufacturing Production Line Analysis
**Scenario:** A manufacturing company is analyzing production workflows but discovers that quality control checkpoints are recorded with date-only timestamps, while machine operations have precise timestamps, creating mixed uncertainty patterns.
**Settings:**
No configuration required.
**Output:**
For a production case:
- 2024-10-20 08:15:22 - Raw Material Loaded
- 2024-10-20 08:18:45 - Machining Started
- 2024-10-20 00:00:00 - Visual Inspection
- 2024-10-20 08:45:12 - Machining Completed
- 2024-10-20 00:00:00 - Dimension Check
- 2024-10-20 00:00:00 - Quality Approval
- 2024-10-20 09:10:30 - Packaging Started
Event attributes:
- Visual Inspection, Dimension Check, Quality Approval: **OrderUncertainty** = TRUE, **OrderUncertaintyCategory** = "SameDay"
- Other events: **OrderUncertainty** = FALSE
Case attributes:
- **UncertainEventOrder:** TRUE
- **UncertainEventOrderCount:** 3
- **UncertainEventOrderCategory:** "SameDay"
**Insights:** The company discovers that their manual quality control system records only dates while automated machine operations capture precise timestamps. This mixed precision means they cannot determine whether quality checks occurred in the documented sequence or whether dimension checks sometimes happened before visual inspections. They can now prioritize upgrading their quality control logging system or adjust their process analysis to account for this uncertainty.
### Example 4: E-commerce Order Fulfillment
**Scenario:** An online retailer is analyzing order processing workflows but notices that warehouse management system events often have identical timestamps due to rapid scanning operations that exceed the system's one-second timestamp precision.
**Settings:**
No configuration required.
**Output:**
For an order with rapid fulfillment:
- 2024-10-21 10:23:45 - Order Received
- 2024-10-21 10:24:18 - Inventory Allocated
- 2024-10-21 10:24:18 - Pick List Generated
- 2024-10-21 10:24:18 - Items Picked
- 2024-10-21 10:24:18 - Quality Verified
- 2024-10-21 10:24:18 - Packing Completed
- 2024-10-21 10:25:03 - Shipping Label Created
Event attributes:
- Five events at 10:24:18: **OrderUncertainty** = TRUE, **OrderUncertaintyCategory** = "SameTime"
Case attributes:
- **UncertainEventOrder:** TRUE
- **UncertainEventOrderCount:** 5
- **UncertainEventOrderCategory:** "SameTime"
**Insights:** The retailer discovers that their warehouse operations are so efficient that multiple steps occur within the same one-second window, but their system timestamp precision is insufficient to capture the true sequence. They find that 25% of orders have uncertain ordering for warehouse activities. This prompts them to consider adding sub-second timestamp precision to their warehouse management system or implementing sequence numbers for same-second events.
### Example 5: IT Service Desk Ticket Resolution
**Scenario:** An IT department is analyzing support ticket resolution processes but discovers that bulk status updates and automated system actions often share timestamps, creating uncertainty about the actual sequence of troubleshooting steps.
**Settings:**
No configuration required.
**Output:**
For a support ticket case:
- 2024-10-18 09:15:00 - Ticket Created
- 2024-10-18 09:15:00 - Auto-Assigned to Team
- 2024-10-18 09:15:00 - Priority Set
- 2024-10-18 09:15:00 - SLA Timer Started
- 2024-10-18 10:30:22 - Engineer Assigned
- 2024-10-18 00:00:00 - Initial Investigation
- 2024-10-18 00:00:00 - Root Cause Identified
- 2024-10-18 00:00:00 - Resolution Applied
- 2024-10-18 14:45:10 - Ticket Closed
Event attributes:
- First four events: **OrderUncertainty** = TRUE, **OrderUncertaintyCategory** = "SameTime"
- Middle three events: **OrderUncertainty** = TRUE, **OrderUncertaintyCategory** = "SameDay"
Case attributes:
- **UncertainEventOrder:** TRUE
- **UncertainEventOrderCount:** 7
- **UncertainEventOrderCategory:** "SameDayAndTime"
**Insights:** The IT department discovers that automated ticket creation steps all share the same timestamp, and manual investigation activities are logged with date-only precision. This mixed uncertainty pattern affects 55% of tickets and reveals that their process mining results may show incorrect activity sequences. They can now work with their IT service management system vendor to improve timestamp granularity and establish more reliable process discovery results.
## Output
The Activity Order Classification enrichment creates comprehensive attributes at both the event level and case level to enable detailed analysis of timestamp uncertainty in your process data.
**Event-Level Attributes:**
**OrderUncertainty** (Boolean): Indicates whether this specific event has uncertain ordering relative to other events in the same case. Set to TRUE when the event shares an identical timestamp (either date only or complete datetime) with at least one other event in the case, making the sequence ambiguous. Set to FALSE when the event has a unique timestamp within the case.
**OrderUncertaintyCategory** (Text): Categorizes the type of timestamp uncertainty for this event:
- "SameDay": The event shares a date with other events but has no time component (timestamp ends with 00:00:00), indicating date-only precision in the source system
- "SameTime": The event has an identical datetime (including time component) with other events, indicating either simultaneous execution or insufficient timestamp granularity
- "SameDayAndTime": The event exhibits both patterns (initially flagged as SameDay, then also found to match SameTime criteria)
**Case-Level Attributes:**
**UncertainEventOrder** (Boolean): Indicates whether this case contains any events with uncertain ordering. Set to TRUE if at least one event in the case has ambiguous ordering due to timestamp duplication. Set to FALSE only when all events in the case have unique timestamps and ordering can be determined with certainty.
**UncertainEventOrderCount** (Integer): The total number of events within this case that have uncertain ordering. This count helps you assess the severity of timestamp uncertainty - a case with two uncertain events is less problematic than one with dozens of events sharing the same timestamp.
**UncertainEventOrderCategory** (Text): Summarizes the timestamp uncertainty pattern for the entire case:
- "SameDay": Case contains only date-level uncertainty (some events share dates but have no time component)
- "SameTime": Case contains only time-level uncertainty (some events share identical datetime values)
- "SameDayAndTime": Case contains both patterns of uncertainty
**Data Type Details:**
- Boolean attributes use TRUE/FALSE values and can be used in filters with "equals TRUE" or "equals FALSE" conditions
- Integer attributes can be used in range filters and calculations to measure uncertainty prevalence
- Text attributes can be grouped and filtered to analyze different uncertainty patterns separately
**Usage in Analysis:**
These attributes enable you to filter your dataset to exclude cases with uncertain ordering, create metrics showing the percentage of cases affected by timestamp uncertainty, identify which source systems or processes have the worst timestamp quality, and prioritize data quality improvements based on the impact on your process mining results. The attributes integrate seamlessly with conformance checking, process discovery, and performance analysis features in mindzieStudio.
## See Also
- **Allowed Case End Activities** - Conformance enrichment that requires reliable activity ordering
- **Allowed Case Start Activities** - Conformance enrichment affected by uncertain first-event timestamps
- **Duration Between Two Activities** - Performance enrichment that produces unreliable results when activity order is uncertain
- **Freeze Log Time** - Data cleanup enrichment that can normalize timestamps to improve consistency
---
*This documentation is part of the mindzie Studio process mining platform.*
---
## Add
Section: Enrichments
URL: https://docs.mindziestudio.com/mindzie_studio/enrichments/add
Source: /docs-master/mindzieStudio/enrichments/add/page.md
# Add
## Overview
The Add enrichment performs addition operations on numeric attribute values and stores the result in a new attribute. This fundamental arithmetic operator allows you to sum multiple case attributes together, providing essential capabilities for aggregating metrics, calculating totals, and deriving new insights from your process data. Unlike simple aggregations that work at the event level, the Add enrichment operates on case-level attributes, making it ideal for combining different numeric measures that characterize each process instance.
The Add enrichment is particularly valuable in process mining scenarios where you need to understand total impacts, combined effects, or aggregate measures. For instance, you can add together different cost components to calculate total process costs, sum various time durations to understand cumulative delays, or combine multiple quality scores to derive an overall quality metric. The enrichment automatically handles different numeric data types and ensures proper type conversion in the output.
## Common Uses
- Calculate total costs by adding different cost components (material cost + labor cost + overhead)
- Sum multiple duration attributes to find total processing time
- Combine different delay types to understand total waiting time
- Add quantity changes across different product categories for total inventory impact
- Sum multiple score attributes to calculate composite performance metrics
- Calculate total resource consumption by adding different resource usage metrics
- Aggregate financial impacts by combining revenue and expense attributes
## Settings
**Filter (Optional):** Apply filters to limit which cases receive the new calculated attribute. When filters are applied, only cases matching the filter criteria will have the sum calculated and stored. This is useful when you want to perform calculations only on specific subsets of your data, such as high-value orders or cases from specific regions.
**New Attribute Name:** Specify the name for the new attribute that will store the sum result. Choose a descriptive name that clearly indicates what values are being added together. For example, use "Total_Cost" when adding cost components, or "Combined_Duration" when summing time attributes. The name must be unique and cannot conflict with existing attributes.
**Attribute Names:** Select at least two numeric attributes that you want to add together. The enrichment will sum all selected attributes for each case. Only numeric attributes (integer or floating-point) are available for selection. The attributes must already exist in your dataset - you can use attributes from the original data or those created by other enrichments. All selected attributes will be added together to produce the final sum.
## Examples
### Example 1: Total Order Processing Cost
**Scenario:** In a procurement process, you need to calculate the total cost for each purchase order by adding together material costs, shipping costs, and handling fees to understand the complete financial impact.
**Settings:**
- Filter: None (calculate for all orders)
- New Attribute Name: Total_Order_Cost
- Attribute Names: Material_Cost, Shipping_Cost, Handling_Fee
**Output:**
Creates a new case attribute "Total_Order_Cost" containing the sum of all three cost components. For a case with:
- Material_Cost: 1500.00
- Shipping_Cost: 75.50
- Handling_Fee: 25.00
The Total_Order_Cost would be 1600.50
**Insights:** This combined cost metric enables analysis of total procurement expenses, identification of high-cost orders, and comparison of cost structures across different suppliers or regions.
### Example 2: Cumulative Processing Time
**Scenario:** In a manufacturing process, you want to calculate the total time spent in different processing stages to identify bottlenecks and optimize the production line.
**Settings:**
- Filter: Product_Type = "Complex Assembly"
- New Attribute Name: Total_Processing_Hours
- Attribute Names: Cutting_Time, Assembly_Time, Quality_Check_Time, Packaging_Time
**Output:**
For complex assembly products only, creates "Total_Processing_Hours" by summing:
- Cutting_Time: 2.5 hours
- Assembly_Time: 8.0 hours
- Quality_Check_Time: 1.5 hours
- Packaging_Time: 0.5 hours
Result: Total_Processing_Hours = 12.5 hours
**Insights:** Understanding total processing time helps identify products that consume the most production resources and reveals opportunities for process optimization.
### Example 3: Patient Care Quality Score
**Scenario:** In a healthcare setting, multiple quality indicators need to be combined to create an overall patient care score for each treatment case.
**Settings:**
- Filter: Treatment_Complete = "Yes"
- New Attribute Name: Overall_Quality_Score
- Attribute Names: Clinical_Outcome_Score, Patient_Satisfaction_Score, Safety_Protocol_Score, Documentation_Score
**Output:**
For completed treatments, creates "Overall_Quality_Score":
- Clinical_Outcome_Score: 85
- Patient_Satisfaction_Score: 92
- Safety_Protocol_Score: 88
- Documentation_Score: 90
Result: Overall_Quality_Score = 355 (out of 400 possible)
**Insights:** The composite score enables hospital administrators to assess overall care quality, compare performance across departments, and identify cases requiring quality review.
### Example 4: Inventory Impact Assessment
**Scenario:** In a warehouse management system, you need to track total inventory changes across multiple product categories to understand daily stock movements.
**Settings:**
- Filter: Transaction_Date = Today()
- New Attribute Name: Total_Inventory_Change
- Attribute Names: Electronics_Change, Clothing_Change, Food_Change, Hardware_Change
**Output:**
For today's transactions, calculates total inventory movement:
- Electronics_Change: +45 units
- Clothing_Change: -23 units
- Food_Change: +67 units
- Hardware_Change: -12 units
Result: Total_Inventory_Change = +77 units (net increase)
**Insights:** This aggregated view helps warehouse managers understand overall inventory flow patterns and make informed restocking decisions.
### Example 5: Financial Period Closing Adjustments
**Scenario:** In financial period closing processes, various adjustment amounts need to be summed to calculate the total impact on account balances.
**Settings:**
- Filter: Period = "Q4-2024" AND Account_Type = "Revenue"
- New Attribute Name: Total_Revenue_Adjustments
- Attribute Names: Accrual_Adjustment, Deferral_Adjustment, Correction_Adjustment, Reclass_Adjustment
**Output:**
For Q4 revenue accounts, sums all adjustments:
- Accrual_Adjustment: 125,000
- Deferral_Adjustment: -45,000
- Correction_Adjustment: 8,500
- Reclass_Adjustment: -12,000
Result: Total_Revenue_Adjustments = 76,500
**Insights:** Finance teams can quickly assess the net impact of all adjustments on revenue recognition and ensure accurate financial reporting.
## Output
The Add enrichment creates a new numeric case attribute with the name specified in the "New Attribute Name" setting. The data type of the output attribute is automatically determined based on the input attributes - if any input contains floating-point values, the result will be a floating-point number; otherwise, it will be an integer.
**Calculation Formula:** Result = Attribute1 + Attribute2 + ... + AttributeN
**Null Value Handling:** If any of the selected attributes contains a null value for a particular case, that null value is treated as zero in the addition. This ensures that the calculation can proceed even when some attributes are missing values. For example, if adding three attributes where one is null, only the two non-null values are summed.
**Data Type Considerations:** The enrichment automatically handles mixed numeric types. When adding integers and floating-point numbers together, the result will be stored as a floating-point number to preserve precision. Large sum values are supported, but ensure your visualization and analysis tools can handle the magnitude of the results.
**Integration with Other Features:** The new calculated attribute can be used immediately in filters, other calculators, and additional enrichments. It appears in attribute lists throughout mindzieStudio and can be exported with your enriched dataset. The attribute is also available for use in dashboards, process maps, and custom analyses.
---
*This documentation is part of the mindzie Studio process mining platform.*
---
## Add Activity From Case Attribute
Section: Enrichments
URL: https://docs.mindziestudio.com/mindzie_studio/enrichments/add-activity-from-case-attribute
Source: /docs-master/mindzieStudio/enrichments/add-activity-from-case-attribute/page.md
# Add Activity From Case Attribute
## Overview
The Add Activity From Case Attribute enrichment creates new activities in your event log based on timestamp values stored in case attributes. This powerful transformation enrichment allows you to convert milestone dates, deadline timestamps, or any other date-based case attribute into visible activities that appear in your process maps, variants, and timeline visualizations.
This enrichment is essential when you have important process milestones captured as case-level attributes (like "Expected Delivery Date", "Contract Start Date", or "Warranty Expiration") that you want to analyze alongside your actual process activities. By converting these timestamps into activities, you can measure deviations between planned and actual timelines, identify delays relative to deadlines, and gain deeper insights into time-based process behavior.
The enrichment intelligently places the new activity at the exact timestamp specified in the case attribute, automatically integrating it into the chronological sequence of existing activities. This makes it possible to calculate durations between attribute-based milestones and actual activities, identify cases where activities occurred before or after expected dates, and visualize the relationship between planned and actual process execution.
## Common Uses
- Convert expected delivery dates into activities to measure on-time delivery performance
- Transform contract start dates or SLA deadlines into visible milestones in process maps
- Create activities from planned completion dates to compare planned vs. actual timelines
- Convert appointment times or scheduled dates into activities for appointment adherence analysis
- Inject warranty expiration dates into process flows to identify post-warranty service activities
- Transform check-in times or registration timestamps into process activities for attendance tracking
- Create milestone activities from project phase deadlines to track project schedule adherence
- Convert promised customer delivery dates into activities to measure promise fulfillment
## Settings
**Date Attribute Column Name:** Select the case attribute containing the timestamp you want to convert into an activity. This attribute must be a DateTime type attribute. The enrichment will use the timestamp value from this attribute as the time when the new activity occurs. If a case does not have a value for this attribute (null value), no activity will be created for that case.
**New Activity Name:** Enter the name for the new activity that will be created. This name will appear in your process map, variant analysis, and activity lists. Choose a descriptive name that clearly indicates what the activity represents, such as "Expected Delivery Date", "SLA Deadline", or "Contract Start Date". The activity name should be distinct from existing activities to avoid confusion.
**New Activity Display Name:** Optionally specify a user-friendly display name for the activity if you want it to appear differently in reports and visualizations. If not specified, the Activity Name will be used as the display name.
**Expected Order:** Specify the expected sequence position for this activity in your process model. This numeric value helps the system understand where this activity logically belongs in the process flow, which is useful for conformance checking and variant comparison. For example, if this represents a deadline that should occur after certain activities, assign an appropriate order number based on your process model.
## Examples
### Example 1: On-Time Delivery Analysis
**Scenario:** An e-commerce company tracks promised delivery dates for customer orders as a case attribute. They want to visualize these promised dates as activities in their process map to identify when deliveries occur before or after the promised date, enabling them to measure delivery performance and identify problematic fulfillment patterns.
**Settings:**
- Date Attribute Column Name: "Promised_Delivery_Date"
- New Activity Name: "Promised Delivery Deadline"
- New Activity Display Name: "Expected Delivery"
- Expected Order: 150
**Output:**
A new activity called "Promised Delivery Deadline" is created for each order at the timestamp specified in the Promised_Delivery_Date attribute. In the process map, this activity appears alongside actual delivery activities like "Package Shipped" and "Delivery Complete".
Sample case data before enrichment:
- Case ID: ORD-5423, Promised_Delivery_Date: 2024-03-15 17:00:00
- Activities: Order Placed (March 10), Payment Confirmed (March 10), Package Shipped (March 12), Delivery Complete (March 16)
After enrichment:
- Activities: Order Placed (March 10), Payment Confirmed (March 10), Package Shipped (March 12), Promised Delivery Deadline (March 15 5:00 PM), Delivery Complete (March 16)
**Insights:** The company can now use duration calculators to measure the time between "Promised Delivery Deadline" and "Delivery Complete", identifying late deliveries as cases where this duration is positive. Process maps reveal that 23% of deliveries occur after the promised deadline, primarily for orders fulfilled from the West Coast warehouse. This enables targeted improvement initiatives for problematic fulfillment centers.
### Example 2: SLA Monitoring in IT Support
**Scenario:** An IT support department has service level agreements with different response time commitments based on ticket priority. The SLA deadline for each ticket is calculated and stored as a case attribute. The team wants to inject these deadlines as activities to monitor SLA compliance and identify at-risk tickets before they breach.
**Settings:**
- Date Attribute Column Name: "SLA_Deadline"
- New Activity Name: "SLA Response Deadline"
- New Activity Display Name: "SLA Deadline"
- Expected Order: 50
**Output:**
For each support ticket, an "SLA Response Deadline" activity is created at the timestamp specified in the SLA_Deadline attribute. This deadline activity appears chronologically among the actual support activities.
Sample case data:
- Ticket ID: TKT-8821, Priority: High, SLA_Deadline: 2024-06-20 14:30:00
- Activities: Ticket Created (June 20 10:00), Auto-Assigned (June 20 10:05), SLA Response Deadline (June 20 14:30), First Response (June 20 15:15), Ticket Resolved (June 21 09:00)
**Insights:** The team can now easily identify SLA breaches by filtering for cases where "First Response" occurs after "SLA Response Deadline". Analysis reveals that 18% of high-priority tickets breach the SLA, with most breaches occurring during peak hours (12-2 PM) when the team is understaffed. This data supports a request for additional staffing during peak periods.
### Example 3: Contract Milestone Tracking
**Scenario:** A professional services firm manages long-term client contracts with multiple milestone dates stored as case attributes (contract start, first deliverable due, second deliverable due, contract end). They want to visualize these milestone dates as activities to compare planned contract timelines with actual work performed.
**Settings (run this enrichment 4 times for different milestones):**
Configuration 1:
- Date Attribute Column Name: "Contract_Start_Date"
- New Activity Name: "Contract Start Milestone"
- Expected Order: 10
Configuration 2:
- Date Attribute Column Name: "Deliverable_1_Due_Date"
- New Activity Name: "Deliverable 1 Deadline"
- Expected Order: 50
Configuration 3:
- Date Attribute Column Name: "Deliverable_2_Due_Date"
- New Activity Name: "Deliverable 2 Deadline"
- Expected Order: 100
Configuration 4:
- Date Attribute Column Name: "Contract_End_Date"
- New Activity Name: "Contract End Milestone"
- Expected Order: 200
**Output:**
The enrichment creates four new milestone activities for each contract based on the stored deadline dates. These milestone activities appear in the process timeline alongside actual work activities like "Requirements Gathering", "Design Review", "Deliverable 1 Submitted", etc.
Sample case data for Contract C-445:
- Before enrichment: Requirements Gathering (Jan 5), Design Review (Jan 20), Deliverable 1 Submitted (Feb 10), Testing Complete (Feb 25), Deliverable 2 Submitted (Mar 8)
- After enrichment: Contract Start Milestone (Jan 1), Requirements Gathering (Jan 5), Design Review (Jan 20), Deliverable 1 Deadline (Feb 5), Deliverable 1 Submitted (Feb 10), Testing Complete (Feb 25), Deliverable 2 Deadline (Mar 1), Deliverable 2 Submitted (Mar 8), Contract End Milestone (Mar 15)
**Insights:** The firm can now visualize how actual work aligns with contractual deadlines. Analysis reveals that Deliverable 1 was submitted 5 days late, but Deliverable 2 was submitted 7 days early, resulting in overall on-time contract completion. This pattern analysis helps identify which types of deliverables consistently run late and require better estimation.
### Example 4: Appointment Adherence in Healthcare
**Scenario:** A medical clinic schedules patient appointments and stores the scheduled appointment time as a case attribute. They want to create an activity for the scheduled time to measure how long patients wait before being seen and identify patterns of appointment delays.
**Settings:**
- Date Attribute Column Name: "Scheduled_Appointment_Time"
- New Activity Name: "Scheduled Appointment"
- New Activity Display Name: "Appointment Time"
- Expected Order: 20
**Output:**
A "Scheduled Appointment" activity is created at the exact time the patient was scheduled to be seen, allowing comparison with the actual "Patient Called to Exam Room" activity.
Sample case data:
- Patient Visit PV-9923, Scheduled_Appointment_Time: 2024-09-12 10:00:00
- Activities: Patient Check-In (9:45 AM), Scheduled Appointment (10:00 AM), Patient Called to Exam Room (10:23 AM), Doctor Enters Room (10:30 AM), Visit Complete (10:52 AM)
**Insights:** The clinic can calculate the duration between "Scheduled Appointment" and "Patient Called to Exam Room" to measure appointment delays. Analysis shows an average wait time of 18 minutes beyond scheduled time, with morning appointments (8-10 AM) being more punctual than afternoon appointments. This indicates the clinic falls behind schedule as the day progresses, supporting the need for schedule buffer adjustments.
### Example 5: Manufacturing Production Planning
**Scenario:** A manufacturing company plans production runs and stores the planned start date for each job as a case attribute. They want to inject this planned start date as an activity to compare planned vs. actual production schedules and identify jobs that start late.
**Settings:**
- Date Attribute Column Name: "Planned_Production_Start"
- New Activity Name: "Planned Start Date"
- New Activity Display Name: "Scheduled Start"
- Expected Order: 15
**Output:**
The enrichment creates a "Planned Start Date" activity for each production job, positioned at the timestamp specified in the Planned_Production_Start attribute.
Sample case data:
- Job ID: JOB-3391, Planned_Production_Start: 2024-11-05 06:00:00
- Activities: Materials Requisitioned (Nov 1), Materials Received (Nov 3), Planned Start Date (Nov 5 6:00 AM), Production Setup (Nov 6 8:00 AM), Production Started (Nov 6 9:30 AM), Quality Check (Nov 7), Production Complete (Nov 7)
**Insights:** By measuring the time between "Planned Start Date" and "Production Started", the company identifies that 34% of jobs start more than 24 hours late. Root cause analysis reveals that late material deliveries account for 60% of delayed starts, while equipment availability issues account for 25%. This data drives improvements in material planning and equipment maintenance scheduling.
## Output
The Add Activity From Case Attribute enrichment creates new event rows in your event log:
**New Activity Records:** For each case that has a non-null value in the specified date attribute, a new event row is created with:
- **Activity Name:** The name you specified in the "New Activity Name" setting
- **Timestamp:** The DateTime value from the selected case attribute
- **Case Association:** Linked to the same case as the source attribute
- **Expected Order:** The order value you specified for conformance and variant analysis
**Data Type:** The new activities are standard event log activities that appear in all activity-based analyses, including:
- Process maps and variants (showing the new activity in chronological sequence)
- Activity frequency tables and statistics
- Timeline visualizations
- Duration calculations (as start or end points for duration enrichments)
- Conformance checking (using the expected order value)
**Null Handling:** Cases where the specified date attribute is null or empty will not have the new activity created. This means the number of occurrences of the new activity may be less than the total number of cases if some cases lack the source attribute value.
**Chronological Integration:** The new activities are automatically positioned in the correct chronological order based on their timestamp, appearing before activities that occur later and after activities that occur earlier. This ensures accurate duration calculations and process flow visualization.
**Multiple Enrichments:** You can run this enrichment multiple times with different source attributes to create multiple milestone activities from various date attributes in your dataset, as demonstrated in the Contract Milestone Tracking example above.
**Integration with Other Enrichments:** Once created, the new activities can be used in:
- Duration enrichments to calculate time between milestone and actual activities
- Conformance enrichments to check if activities occur in the expected order relative to milestones
- Activity filters to segment cases based on milestone-related patterns
- Calculators to measure deviation between planned and actual timelines
## See Also
**Related Activity Enrichments:**
- [Duration Between Two Activities](/mindzie_studio/enrichments/duration-between-two-activities) - Calculate time between the new activity and existing activities
- [Activity Copy Latest Event Value](/mindzie_studio/enrichments/activity-copy-latest-event-value) - Copy attribute values to activities
- [Shift Activity Time](/mindzie_studio/enrichments/shift-activity-time) - Adjust timestamps of activities
**Related Attribute Enrichments:**
- [Duration Between an Attribute and an Activity](/mindzie_studio/enrichments/duration-between-an-attribute-and-an-activity) - Alternative approach using attribute-to-activity duration calculation
- Representative Case Attribute - Select representative values from case attributes
**Related Topics:**
- Process Discovery - Understanding activity flows after adding milestone activities
- Timeline Analysis - Visualizing chronological relationships between planned and actual activities
---
*This documentation is part of the mindzie Studio process mining platform.*
---
## Add Days To A Date
Section: Enrichments
URL: https://docs.mindziestudio.com/mindzie_studio/enrichments/add-days-to-a-date
Source: /docs-master/mindzieStudio/enrichments/add-days-to-a-date/page.md
# Add Days to a Date
## Overview
The Add Days to a Date enrichment creates a new timestamp attribute by adding a specified number of days to an existing date attribute in your dataset. This enrichment is essential for calculating future dates, deadlines, and expected milestones based on your process data. By using a numeric attribute to specify the number of days to add, you can dynamically calculate dates that vary by case - for example, adding different payment terms to invoice dates based on customer agreements, or calculating expected delivery dates based on service level agreements. This capability is particularly valuable for deadline monitoring, SLA compliance tracking, and predictive process analytics where you need to project future dates based on current process state.
The enrichment supports flexible date calculations by accepting the number of days from any numeric attribute in your dataset. This means you can use calculated fields, lookup values, or imported data to determine how many days to add, making it powerful for complex business scenarios where the time offset varies based on case characteristics.
## Common Uses
- **Payment Due Date Calculation**: Add payment terms (30, 60, 90 days) to invoice dates to determine when payments are due
- **SLA Deadline Tracking**: Calculate service level agreement deadlines by adding contractual response times to ticket creation dates
- **Expected Delivery Dates**: Add standard shipping times to order dates to predict when customers will receive their products
- **Contract Renewal Dates**: Calculate renewal dates by adding contract duration periods to start dates
- **Warranty Expiration**: Determine warranty end dates by adding warranty periods to purchase or installation dates
- **Project Milestone Planning**: Calculate expected milestone dates by adding planned durations to project start dates
- **Regulatory Compliance Deadlines**: Add regulatory response periods to submission dates to track compliance windows
## Settings
**New Attribute Name:** The name for the new date attribute that will be created in your dataset. This attribute will contain the calculated future date. Choose a descriptive name that clearly indicates what the date represents, such as "Payment_Due_Date", "SLA_Deadline", or "Expected_Delivery_Date". This new attribute will be available for use in filters, dashboards, and other enrichments.
**Attribute Name:** Select the existing date/timestamp attribute that serves as your starting point for the calculation. This must be a DateTime type attribute in your case table. Common examples include "Invoice_Date", "Order_Date", "Ticket_Created", or any timestamp attribute from your process. The enrichment will use this date as the base and add the specified number of days to it.
**Attribute Add Days:** Select the numeric attribute that contains the number of days to add to your base date. This must be a numeric attribute (Integer, Double, or Float) from your case table. The value can be positive (to calculate future dates) or negative (to calculate past dates). Examples include "Payment_Terms_Days", "SLA_Response_Hours" (which would need to be converted to days), "Shipping_Days", or any calculated numeric field. Each case can have a different value, allowing for case-specific date calculations.
## Examples
### Example 1: Invoice Payment Due Dates
**Scenario:** A company needs to track payment due dates for invoices. Different customers have different payment terms - some pay in 30 days, others in 60 or 90 days. The payment terms are stored as a numeric attribute based on customer contracts.
**Settings:**
- New Attribute Name: `Payment_Due_Date`
- Attribute Name: `Invoice_Date`
- Attribute Add Days: `Customer_Payment_Terms`
**Output:**
For a case where:
- Invoice_Date = 2024-03-01
- Customer_Payment_Terms = 30
The enrichment creates:
- Payment_Due_Date = 2024-03-31
This new attribute can be used to create dashboards showing upcoming payment dues, identify overdue invoices, and analyze payment behavior patterns.
**Insights:** By having calculated due dates, the finance team can proactively follow up on payments, prioritize collection efforts, and accurately forecast cash flow based on expected payment dates.
### Example 2: SLA Deadline Monitoring
**Scenario:** An IT service desk needs to track SLA deadlines for different ticket priorities. High priority tickets must be resolved within 1 day, medium within 3 days, and low within 7 days. The SLA days are stored as an attribute based on ticket priority.
**Settings:**
- New Attribute Name: `SLA_Resolution_Deadline`
- Attribute Name: `Ticket_Created_Date`
- Attribute Add Days: `SLA_Days_Required`
**Output:**
For a high-priority ticket:
- Ticket_Created_Date = 2024-03-15 09:00:00
- SLA_Days_Required = 1
- SLA_Resolution_Deadline = 2024-03-16 09:00:00
For a low-priority ticket:
- Ticket_Created_Date = 2024-03-15 09:00:00
- SLA_Days_Required = 7
- SLA_Resolution_Deadline = 2024-03-22 09:00:00
**Insights:** Service managers can now create real-time dashboards showing which tickets are approaching their SLA deadlines, enabling proactive resource allocation and preventing SLA breaches.
### Example 3: Expected Delivery Date Calculation
**Scenario:** An e-commerce company wants to calculate expected delivery dates based on shipping method. Standard shipping adds 5 days, express adds 2 days, and overnight adds 1 day to the ship date.
**Settings:**
- New Attribute Name: `Expected_Delivery_Date`
- Attribute Name: `Order_Shipped_Date`
- Attribute Add Days: `Shipping_Days`
**Output:**
For an express shipment:
- Order_Shipped_Date = 2024-03-20 14:00:00
- Shipping_Days = 2
- Expected_Delivery_Date = 2024-03-22 14:00:00
This enables customer service to provide accurate delivery expectations and identify shipments that may be delayed.
**Insights:** Operations teams can analyze actual delivery performance against expected dates, identify carriers or routes that consistently miss expectations, and improve customer communication about delivery timelines.
### Example 4: Contract Renewal Management
**Scenario:** A software company needs to track when customer contracts are up for renewal. Contracts have different durations - monthly (30 days), quarterly (90 days), or annual (365 days) subscriptions.
**Settings:**
- New Attribute Name: `Contract_Renewal_Date`
- Attribute Name: `Contract_Start_Date`
- Attribute Add Days: `Contract_Duration_Days`
**Output:**
For an annual contract:
- Contract_Start_Date = 2024-01-15
- Contract_Duration_Days = 365
- Contract_Renewal_Date = 2025-01-15
For a monthly contract:
- Contract_Start_Date = 2024-03-01
- Contract_Duration_Days = 30
- Contract_Renewal_Date = 2024-03-31
**Insights:** Sales teams can proactively reach out to customers before renewal dates, account managers can plan renewal negotiations in advance, and revenue forecasting becomes more accurate with clear renewal timelines.
### Example 5: Manufacturing Lead Time Planning
**Scenario:** A manufacturing company needs to calculate expected completion dates for production orders based on standard lead times for different product types, which vary from 7 to 45 days.
**Settings:**
- New Attribute Name: `Expected_Completion_Date`
- Attribute Name: `Production_Start_Date`
- Attribute Add Days: `Product_Lead_Time_Days`
**Output:**
For a complex product order:
- Production_Start_Date = 2024-03-10 08:00:00
- Product_Lead_Time_Days = 21
- Expected_Completion_Date = 2024-03-31 08:00:00
**Insights:** Production planners can optimize scheduling, communicate realistic delivery dates to customers, and identify orders at risk of missing their target completion dates.
## Output
The Add Days to a Date enrichment creates a new case attribute with the following characteristics:
**Attribute Type:** DateTime - The new attribute is created as a timestamp/datetime field that preserves the time component from the original date attribute.
**Attribute Naming:** The new attribute uses the name specified in "New Attribute Name" and appears in your case table immediately after enrichment execution.
**Value Calculation:** For each case, the enrichment takes the base date from "Attribute Name" and adds the number of days specified in "Attribute Add Days". The calculation preserves the original time component, so if your base date includes hours and minutes, these are maintained in the calculated date.
**Null Handling:** If either the base date attribute or the days-to-add attribute is null for a particular case, the new calculated date attribute will also be null for that case. This ensures data integrity and makes it easy to identify cases with missing information.
**Negative Values:** The enrichment supports negative values in the "Attribute Add Days" field, allowing you to calculate dates in the past. This is useful for calculating dates like "Review Required By" (which might be X days before a deadline).
**Integration with Other Features:**
- The new date attribute can be used immediately in filters to select cases based on calculated dates
- It can be used in other enrichments that require date inputs
- It appears in all visualizations and can be used for time-based analysis
- It can be exported with your enriched dataset
- It can be used in calculated attributes for further date manipulations
---
*This documentation is part of the mindzie Studio process mining platform.*
---
## Add Time To Attributes
Section: Enrichments
URL: https://docs.mindziestudio.com/mindzie_studio/enrichments/add-time-to-attributes
Source: /docs-master/mindzieStudio/enrichments/add-time-to-attributes/page.md
# Add Time to attributes
## Overview
The Add Time to attributes enrichment modifies existing DateTime attributes in your dataset by adding or subtracting a specified time duration. Unlike enrichments that create new calculated attributes, this enrichment directly updates your existing timestamp fields, making it invaluable for time zone adjustments, data corrections, and systematic time shifts across your process data. You can add seconds, minutes, hours, days, weeks, months, or years to all DateTime attributes or selectively choose which ones to modify.
This enrichment is particularly powerful for correcting systematic time recording errors, adjusting for daylight saving time changes, aligning timestamps from different systems, or shifting entire processes forward or backward in time for simulation and what-if analysis. The ability to apply filters means you can make these adjustments selectively - for example, only adjusting timestamps for cases from a specific region or time period. The enrichment preserves the original data structure while modifying the time values, maintaining all relationships and dependencies in your process model.
## Common Uses
- **Time Zone Corrections**: Adjust timestamps to convert between different time zones when consolidating data from global operations
- **Daylight Saving Time Adjustments**: Correct for missing or doubled hours during DST transitions in historical data
- **System Clock Error Corrections**: Fix systematic timestamp errors caused by incorrect system clock settings during data capture
- **Data Migration Time Shifts**: Align timestamps when migrating processes between systems with different time recording standards
- **Process Simulation**: Shift entire processes forward or backward in time for testing and what-if scenario analysis
- **Batch Processing Adjustments**: Correct timestamps for batch-processed events that were recorded at processing time rather than actual occurrence
- **Historical Data Alignment**: Synchronize timestamps from legacy systems that used different time references or epochs
## Settings
**Filter:** Optional filter to restrict which cases are affected by the time adjustment. When no filter is applied, all cases in the dataset will have their selected DateTime attributes modified. Use filters to target specific subsets of your data, such as cases from a particular time period, region, or system. This is particularly useful when correcting time zone issues for specific locations or fixing errors that only affected certain periods of data collection. The filter uses the standard mindzie filter interface, supporting complex conditions and combinations.
**Attribute Names:** Select which DateTime attributes to modify. By default, if no attributes are selected, the enrichment will apply to all DateTime attributes in both case and event tables. You can select multiple specific attributes to target only the timestamps you want to adjust. This list dynamically populates with all available DateTime attributes from your dataset. Common selections include "Start_Time", "End_Time", "Created_Date", "Modified_Date", and any custom timestamp fields in your data. The enrichment will skip any null values, leaving them unchanged.
**Add Value:** The numeric value to add to the selected timestamps. This can be positive (to move timestamps forward in time) or negative (to move timestamps backward in time). The interpretation of this value depends on the Timespan Duration setting. For example, entering "2" with "Hours" selected will add 2 hours to all timestamps, while "-30" with "Minutes" selected will subtract 30 minutes. The value must be a whole number (integer). Consider the magnitude carefully - adding years or months can create significant shifts in your process timeline.
**Timespan Duration:** The unit of time for the Add Value setting. Available options are:
- **Seconds**: For fine-grained adjustments or correcting sub-minute timing issues
- **Minutes**: Useful for minor time corrections or adjusting for small clock differences
- **Hours**: Most common for time zone adjustments (e.g., adding 5 hours for EST to UTC conversion)
- **Days**: For shifting entire processes or correcting date-level errors
- **Weeks**: For adjusting weekly batch processes or correcting week-based scheduling errors
- **Months**: For long-term process shifts or fiscal period adjustments
- **Years**: For historical data alignment or major temporal transformations
## Examples
### Example 1: Time Zone Conversion from EST to UTC
**Scenario:** A company's US East Coast operations recorded all timestamps in EST (UTC-5), but the central data warehouse requires all times in UTC for global consistency. You need to add 5 hours to all timestamps from the US operations.
**Settings:**
- Filter: `Region = "US-East"`
- Attribute Names: (leave empty to adjust all DateTime attributes)
- Add Value: `5`
- Timespan Duration: `Hours`
**Output:**
Original timestamps:
- Order_Created: 2024-03-15 09:00:00 (EST)
- Order_Approved: 2024-03-15 09:30:00 (EST)
- Order_Shipped: 2024-03-15 14:00:00 (EST)
After enrichment:
- Order_Created: 2024-03-15 14:00:00 (UTC)
- Order_Approved: 2024-03-15 14:30:00 (UTC)
- Order_Shipped: 2024-03-15 19:00:00 (UTC)
All timestamps are now aligned to UTC, enabling accurate global process analysis and avoiding confusion when comparing processes across time zones.
**Insights:** With standardized UTC timestamps, analysts can now accurately compare process performance across global locations, identify true bottlenecks regardless of local time zones, and create unified dashboards for worldwide operations.
### Example 2: Daylight Saving Time Correction
**Scenario:** Historical data from March 2023 has a one-hour gap due to a daylight saving time transition that wasn't properly handled by the source system. All timestamps after March 12, 2023, 02:00 need to be adjusted backward by one hour.
**Settings:**
- Filter: `Start_Time >= "2023-03-12 02:00:00"`
- Attribute Names: `Start_Time`, `End_Time`, `Activity_Timestamp`
- Add Value: `-1`
- Timespan Duration: `Hours`
**Output:**
Events incorrectly showing:
- Activity A: 2023-03-12 03:30:00
- Activity B: 2023-03-12 04:15:00
- Activity C: 2023-03-12 05:00:00
After correction:
- Activity A: 2023-03-12 02:30:00
- Activity B: 2023-03-12 03:15:00
- Activity C: 2023-03-12 04:00:00
The one-hour gap caused by DST is now corrected, restoring the actual sequence and duration of activities.
**Insights:** Correcting DST issues ensures accurate duration calculations, prevents false bottlenecks from appearing in the data, and maintains the integrity of time-based KPIs and SLA measurements.
### Example 3: System Migration Time Alignment
**Scenario:** During a system migration, all timestamps from the legacy system (which used a different epoch) need to be shifted forward by exactly 30 days to align with the new system's time reference.
**Settings:**
- Filter: `Source_System = "Legacy_ERP"`
- Attribute Names: (leave empty for all attributes)
- Add Value: `30`
- Timespan Duration: `Days`
**Output:**
Legacy system dates:
- Case_Start: 2024-01-01 08:00:00
- First_Approval: 2024-01-02 10:00:00
- Final_Completion: 2024-01-05 16:00:00
After alignment:
- Case_Start: 2024-01-31 08:00:00
- First_Approval: 2024-02-01 10:00:00
- Final_Completion: 2024-02-04 16:00:00
All legacy system timestamps are now properly aligned with the new system's time reference, allowing seamless process analysis across both systems.
**Insights:** Proper time alignment enables accurate process comparison before and after migration, validates that the new system maintains expected process performance, and ensures historical trending remains valid.
### Example 4: Batch Processing Time Correction
**Scenario:** A batch processing system recorded all events at the batch run time (midnight) rather than their actual occurrence times. Events need to be distributed throughout the day by subtracting hours based on their sequence.
**Settings:**
- Filter: `Batch_Processed = "True" AND Processing_Sequence >= 6`
- Attribute Names: `Event_Timestamp`, `Activity_Time`
- Add Value: `-6`
- Timespan Duration: `Hours`
**Output:**
Batch recorded times (all at midnight):
- Order_Received: 2024-03-15 00:00:00
- Order_Validated: 2024-03-15 00:00:00
- Order_Approved: 2024-03-15 00:00:00
After correction for sequence 6+ events:
- Order_Received: 2024-03-14 18:00:00
- Order_Validated: 2024-03-14 18:00:00
- Order_Approved: 2024-03-14 18:00:00
Events are now distributed across the actual day they occurred, though multiple enrichment passes may be needed for complete distribution.
**Insights:** Correcting batch processing timestamps reveals true process patterns, enables accurate duration and throughput calculations, and helps identify actual peak periods rather than artificial batch processing spikes.
### Example 5: Fiscal Year Adjustment
**Scenario:** A company needs to shift all timestamps forward by 3 months to align calendar year data with their fiscal year (which starts in April) for financial process analysis.
**Settings:**
- Filter: (none - apply to all cases)
- Attribute Names: (leave empty for all attributes)
- Add Value: `3`
- Timespan Duration: `Months`
**Output:**
Calendar year timestamps:
- Q1_Start: 2024-01-01
- Q1_Transaction: 2024-02-15
- Q1_Close: 2024-03-31
Fiscal year aligned:
- Q1_Start: 2024-04-01
- Q1_Transaction: 2024-05-15
- Q1_Close: 2024-06-30
All timestamps now align with the fiscal calendar, enabling accurate financial period analysis and reporting.
**Insights:** Fiscal alignment allows finance teams to accurately analyze process performance by fiscal periods, compare year-over-year fiscal performance, and align process metrics with financial reporting requirements.
## Output
The Add Time to attributes enrichment modifies existing DateTime attributes in place, with the following characteristics:
**In-Place Modification:** Unlike enrichments that create new attributes, this enrichment directly modifies the values of existing DateTime attributes. The attribute names, types, and structure remain unchanged - only the time values are adjusted.
**Attribute Scope:** The enrichment can modify:
- Case attributes: DateTime fields at the case level
- Event attributes: DateTime fields at the event level
- All DateTime attributes when no specific selection is made
- Only selected attributes when specifically chosen
**Value Preservation:** The enrichment maintains:
- The date and time components (adjusting both appropriately)
- The precision of the original timestamp (milliseconds are preserved if present)
- Null values (they remain null and are not modified)
- The data type (DateTime remains DateTime)
**Filter Application:** When filters are applied:
- Only cases matching the filter criteria have their timestamps modified
- Cases not matching the filter retain their original timestamp values
- This creates a mixed dataset where some timestamps are adjusted and others are not
**Calculation Details:**
- **Seconds/Minutes/Hours/Days**: Simple arithmetic addition to the timestamp
- **Weeks**: Calculated as days * 7 and added to the timestamp
- **Months**: Intelligent handling of month boundaries (e.g., January 31 + 1 month = February 28/29)
- **Years**: Accounts for leap years automatically
**Important Considerations:**
- This enrichment permanently modifies your data (within the current analysis session)
- Consider creating a backup or copy of your dataset before applying major time shifts
- Month and year additions handle edge cases (like February 30) by adjusting to valid dates
- Negative values are fully supported for moving timestamps backward in time
**Integration with Other Features:**
- Modified timestamps immediately affect all time-based calculations and visualizations
- Duration calculations between activities will change if their timestamps are modified
- Filters and dashboards using date ranges may need adjustment after time shifts
- The modification is transparent to other enrichments - they will use the new timestamp values
---
*This documentation is part of the mindzie Studio process mining platform.*
---
## AI Case Prediction
Section: Enrichments
URL: https://docs.mindziestudio.com/mindzie_studio/enrichments/ai-case-prediction
Source: /docs-master/mindzieStudio/enrichments/ai-case-prediction/page.md
# AI Case Prediction
## Quick Start: Pre-Built Python Templates
mindzie ships three ready-to-upload template packages so you can run AI Case Prediction without writing any Python. Pick the one that matches your **Predict Value Column**, download the zip, and upload it via the AI Case Prediction block's **Upload Model** menu - that's it.
| Template | Use when the Predict Value Column is... | Typical examples | Download |
|---|---|---|---|
| Binary Classifier | Exactly **2 categories** | "Approved" / "Rejected", True / False, 0 / 1, "Pass" / "Fail" | mindzie_ai_binary_classifier_v1.zip |
| Multi-class Classifier | **3 or more categories** | "Low" / "Medium" / "High", region codes, status categories | mindzie_ai_multiclass_classifier_v1.zip |
| Regressor | A **continuous numeric** value | duration in seconds, dollar amount, item count, percentage | mindzie_ai_regressor_v1.zip |
All three packages are generic - they read column names and types from the schema files mindzieStudio writes at run time, so they work with **any** combination of feature and target column names. You do **not** edit anything inside the zip.
The full upload workflow with screenshots, what each template handles automatically, and how to customize them is in [Using Pre-Built Python Templates](#using-pre-built-python-templates) further down this page.
## Overview
The AI Case Prediction enrichment enables you to leverage machine learning and artificial intelligence to make predictions about case outcomes, behaviors, or characteristics based on historical patterns in your process data. This powerful enrichment trains predictive models using your existing case attributes and then applies those models to predict unknown values for current or future cases.
Unlike traditional rule-based enrichments, AI Case Prediction uses statistical learning algorithms to discover complex patterns and relationships in your data that may not be immediately apparent. The enrichment supports classification tasks (predicting categories or outcomes) and can handle both training model creation and prediction deployment within your process mining workflow.
This enrichment is particularly valuable for process optimization, risk management, and proactive decision-making. By predicting case outcomes early in the process lifecycle, you can take preventive actions, allocate resources more effectively, and identify potential issues before they occur.
## Common Uses
- **Outcome Prediction:** Predict whether a case will be approved or rejected, completed on time or delayed, successful or failed based on early case attributes
- **Risk Assessment:** Identify high-risk cases that are likely to encounter problems, require rework, or result in customer complaints
- **Duration Forecasting:** Predict how long a case will take to complete based on its initial characteristics and current progress
- **Resource Allocation:** Predict which cases will require specialized handling or additional resources based on complexity indicators
- **Customer Churn Prevention:** Predict which customer cases are at risk of cancellation or abandonment based on behavior patterns
- **Quality Prediction:** Forecast whether a case will meet quality standards or require additional inspection based on process execution patterns
- **Cost Estimation:** Predict the final cost of a case based on initial parameters and early activity patterns
## Settings
### Prediction Type
**Prediction Type:** Specifies the type of machine learning task to perform. Currently, the enrichment supports Classification, which predicts categorical outcomes or class labels.
- **Classification:** Use for predicting discrete categories or outcomes such as "Approved/Rejected", "High Risk/Low Risk", "On Time/Delayed", or any categorical attribute. The model learns to classify cases into predefined groups based on patterns in the feature columns.
- **Regression:** (Future) Will predict continuous numeric values such as durations, costs, or quantities
- **Clustering:** (Future) Will group similar cases together without predefined categories
- **Time Series:** (Future) Will predict temporal patterns and sequences
- **Anomaly Detection:** (Future) Will identify unusual or outlier cases
- **Recommendation:** (Future) Will suggest optimal next actions or activities
For most business use cases, Classification is the appropriate choice when you want to predict a specific outcome that falls into distinct categories.
### Feature Columns
**Feature Columns:** Select the case attributes that will be used as input features for training and prediction. These are the independent variables that the AI model will analyze to make predictions. Choose attributes that you believe influence or correlate with the outcome you're trying to predict.
Best practices for selecting feature columns:
- Include attributes that are known early in the case lifecycle if you want to make early predictions
- Select attributes with good data quality (minimal missing values)
- Include both categorical and numeric attributes for richer patterns
- Avoid selecting the target column (the one you're predicting) as a feature
- Consider domain knowledge about which factors influence outcomes
- Start with 3-10 relevant features; too many can reduce model accuracy
Examples of useful feature columns:
- Customer type, region, or segment
- Order amount, priority, or category
- Initial request characteristics
- Resource assignments or department
- Time-based attributes (day of week, month, season)
### Predict Value Column
**Predict Value Column:** Select the case attribute that contains the known outcomes you want the model to learn from during training. This is the dependent variable or target that the model will predict for new cases. This column must have known values in your training data but may be empty for cases where you want to make predictions.
For Classification prediction type, valid columns are:
- String attributes (text categories like "Approved", "Rejected", "Pending")
- Boolean attributes (true/false outcomes)
- Integer attributes (numeric codes representing categories)
The Predict Value Column should:
- Contain the actual outcome you want to predict
- Have sufficient examples of each category in the training data
- Be the key business outcome you want to forecast
- Not be available or known at the time you want to make the prediction
### Training Filters
**Training Filters:** Define filter criteria to select which cases will be used to train the AI model. This allows you to use only high-quality, complete cases for model training while excluding cases that may not be representative or have incomplete data.
Common training filter scenarios:
- Include only completed cases (exclude in-progress cases)
- Include only cases where the predict value is known (not empty)
- Exclude cases with data quality issues or missing feature values
- Include only recent cases to train on current process patterns
- Filter by specific time periods, departments, or regions
- Balance the training set by including equal numbers of different outcome categories
Example: "Case End Time is not empty AND Outcome is not empty AND Case Start Time is after 2024-01-01"
### Prediction Filters
**Prediction Filters:** Define filter criteria to select which cases will receive predictions when the enrichment runs. This allows you to predict selectively for cases where predictions are most valuable or where the outcome is not yet known.
Common prediction filter scenarios:
- Include only in-progress cases (where outcome is not yet known)
- Include only cases where the predict value is empty
- Filter to specific time periods or current active cases
- Include only cases that meet certain risk criteria
- Predict only for high-value or high-priority cases
Example: "Outcome is empty AND Case Status equals 'In Progress' AND Case Start Time is after 2025-01-01"
### New Prediction Column
**New Prediction Column:** Define the name, data type, and display format for the new case attribute that will store the AI predictions. This column will be added to your case table and populated with the predicted values when the enrichment executes.
Configuration options:
- **Column Name:** Internal name for the new attribute (no spaces, use underscores)
- **Display Name:** User-friendly name shown in analysis dashboards
- **Data Type:** Must match the data type of your Predict Value Column (String for text categories, Boolean for true/false, Integer for numeric codes)
- **Format:** How the values should be displayed in visualizations (Text, Number, Percentage, etc.)
Example configurations:
- Column Name: "predicted_outcome", Display Name: "Predicted Outcome", Type: String
- Column Name: "risk_prediction", Display Name: "Risk Level Prediction", Type: String
- Column Name: "will_delay", Display Name: "Predicted to Delay", Type: Boolean
### Model Id
**Model Id:** (Optional) Specify the unique identifier (GUID) of a previously trained model to use for predictions. When you train a model and save it, mindzieStudio assigns it a unique Model Id. By providing this Id, you can reuse the trained model without retraining, ensuring consistent predictions across different datasets or time periods.
Leave this field empty if you want the enrichment to train a new model each time it runs. Provide a Model Id when:
- You've already trained and validated a model that performs well
- You want to ensure consistency by using the same model over time
- You're applying predictions to a new dataset using an existing model
- You want to avoid the computational cost of retraining
The Model Id can be found in the enrichment execution logs or model management interface after successful model training.
### Python Image
**Python Image:** Specifies the Python execution environment to use for running the AI model training and prediction scripts. mindzieStudio supports multiple Python execution modes to accommodate different deployment scenarios.
Options:
- **LOCAL:** Uses the local Python installation on the mindzieStudio server. This is the fastest option when Python 3.x is installed locally with required machine learning libraries (pandas, scikit-learn, etc.)
- **Docker Image Name:** Specifies a Docker container image that contains Python and required libraries. Example: "python:3.9-slim" or custom images with pre-installed ML libraries
- **Python not configured:** Indicates that neither local Python nor Docker is available. You'll need to configure Python execution before using this enrichment.
The default behavior:
- If local Python is available, it automatically selects "LOCAL"
- If Docker is configured but not local Python, it uses the default Docker Python image
- If neither is available, it prompts you to configure Python execution
For production use, Docker images are recommended for consistency and isolation, while LOCAL is convenient for development and testing when you have full control over the server environment.
## Examples
### Example 1: Predicting Purchase Order Approval Outcomes
**Scenario:** A procurement organization wants to predict whether purchase orders will be approved or rejected based on order characteristics, so they can flag potential rejections early and work proactively with requesters to improve approval rates.
**Settings:**
- **Prediction Type:** Classification
- **Feature Columns:** Order_Amount, Department, Vendor_Category, Requester_Level, Budget_Available, Previous_Orders_Count, Urgency_Flag
- **Predict Value Column:** Approval_Outcome (contains "Approved" or "Rejected" for completed orders)
- **Training Filters:** "Approval_Outcome is not empty AND Case_End_Time is not empty" (use only completed orders with known outcomes)
- **Prediction Filters:** "Approval_Outcome is empty AND Case_Status equals 'Under Review'" (predict for orders currently being reviewed)
- **New Prediction Column:**
- Column Name: predicted_approval
- Display Name: Predicted Approval Outcome
- Data Type: String
- **Model Id:** (empty - train new model)
- **Python Image:** LOCAL
**Output:**
The enrichment creates a new case attribute called "Predicted Approval Outcome" with values of either "Approved" or "Rejected" for each order under review. The prediction is based on patterns learned from historical orders, such as:
- Orders over $50,000 from new vendors are more likely to be rejected
- Orders with budget available and requester level "Manager" or higher are more likely to be approved
- Urgent orders with previous successful orders from the same vendor have higher approval rates
**Insights:** By analyzing the predictions, the procurement team discovers that 23% of current orders under review are predicted to be rejected. They proactively reach out to requesters of predicted rejections to gather additional justification, suggest alternative vendors, or split large orders into smaller approvals. This intervention improves the overall approval rate from 78% to 89% and reduces process cycle time by avoiding lengthy rejection-resubmission cycles.
### Example 2: Healthcare Patient Readmission Risk Prediction
**Scenario:** A hospital wants to predict which discharged patients are at high risk of readmission within 30 days, enabling care coordinators to provide targeted follow-up support and reduce readmission rates.
**Settings:**
- **Prediction Type:** Classification
- **Feature Columns:** Patient_Age, Diagnosis_Category, Length_of_Stay, Comorbidity_Count, Prior_Admissions, Discharge_Destination, Medication_Complexity, Social_Support_Score
- **Predict Value Column:** Readmitted_30_Days (contains "Yes" or "No" for past discharge cases)
- **Training Filters:** "Discharge_Date is not empty AND Days_Since_Discharge >= 30" (use only cases where 30-day outcome is known)
- **Prediction Filters:** "Discharge_Date is not empty AND Days_Since_Discharge < 30" (predict for recent discharges)
- **New Prediction Column:**
- Column Name: readmission_risk_prediction
- Display Name: Predicted Readmission Risk
- Data Type: String
- **Model Id:** (empty)
- **Python Image:** LOCAL
**Output:**
The enrichment adds a "Predicted Readmission Risk" attribute showing "Yes" or "No" for each recently discharged patient. Sample predictions show:
- Patient ID 45321: Age 72, Heart Failure, 8-day stay, 3 comorbidities, discharged to home alone = Predicted Risk "Yes"
- Patient ID 45322: Age 55, Minor Surgery, 2-day stay, no comorbidities, discharged to home with family = Predicted Risk "No"
- Patient ID 45323: Age 68, Pneumonia, 5-day stay, 2 comorbidities, prior admission 3 months ago = Predicted Risk "Yes"
**Insights:** The model identifies 78 patients in the last 30 days predicted to be at high risk of readmission. The care coordination team prioritizes these patients for home health visits, medication reviews, and follow-up appointments. After 90 days of using the predictions to guide interventions, the actual readmission rate for high-risk patients drops from 22% to 14%, demonstrating the value of proactive, data-driven patient management.
### Example 3: Manufacturing Quality Defect Prediction
**Scenario:** A manufacturing company wants to predict which production orders will result in quality defects based on initial order parameters and early production metrics, allowing them to implement additional quality controls before defects occur.
**Settings:**
- **Prediction Type:** Classification
- **Feature Columns:** Product_Type, Batch_Size, Material_Supplier, Production_Line, Operator_Experience_Level, Temperature_Variance, First_Pass_Yield, Cycle_Time_Deviation
- **Predict Value Column:** Quality_Defect_Found (contains "Defect" or "Pass" for completed orders)
- **Training Filters:** "Production_Status equals 'Completed' AND Quality_Inspection_Complete equals true" (use only fully inspected completed orders)
- **Prediction Filters:** "Production_Status equals 'In Progress' AND Percent_Complete >= 25 AND Percent_Complete < 100" (predict for orders in production)
- **New Prediction Column:**
- Column Name: defect_prediction
- Display Name: Predicted Quality Outcome
- Data Type: String
- **Model Id:** (empty)
- **Python Image:** LOCAL
**Output:**
The enrichment generates quality predictions for 156 orders currently in production. Example predictions:
- Order #10045: Large batch, new material supplier, high temperature variance = Predicted "Defect" (quality alert triggered)
- Order #10046: Standard product, experienced operator, normal metrics = Predicted "Pass"
- Order #10047: Complex product, Production Line B, cycle time 15% over normal = Predicted "Defect" (quality alert triggered)
The system creates a real-time quality dashboard showing predicted defects alongside actual production status, enabling quality engineers to intervene before orders complete.
**Insights:** Using the predictions, the quality team implements enhanced inspections and process adjustments for orders predicted to have defects. Over 3 months, they prevent 34 defective orders from reaching final inspection by catching issues early. The defect rate drops from 8.2% to 4.1%, and rework costs decrease by $127,000. The model reveals that orders with new material suppliers combined with high temperature variance have a 67% defect rate, leading to updated supplier qualification procedures and tighter temperature controls.
### Example 4: Financial Loan Default Risk Prediction
**Scenario:** A financial institution wants to predict which approved loan applications are likely to default within the first 12 months, enabling risk managers to adjust loan terms, require additional collateral, or implement more frequent monitoring for high-risk loans.
**Settings:**
- **Prediction Type:** Classification
- **Feature Columns:** Loan_Amount, Credit_Score, Debt_to_Income_Ratio, Employment_Duration, Loan_Purpose, Property_Value, Down_Payment_Percent, Previous_Loans
- **Predict Value Column:** Defaulted_12_Months (contains "Default" or "Performing" for loans with 12+ months history)
- **Training Filters:** "Loan_Origination_Date < '2024-01-01' AND Months_Since_Origination >= 12" (use only loans with known 12-month outcomes)
- **Prediction Filters:** "Loan_Status equals 'Active' AND Months_Since_Origination < 12" (predict for recent loans)
- **New Prediction Column:**
- Column Name: default_risk_prediction
- Display Name: Predicted Default Risk
- Data Type: String
- **Model Id:** a1b2c3d4-e5f6-7890-a1b2-c3d4e5f6g7h8 (using a previously trained and validated model)
- **Python Image:** LOCAL
**Output:**
The enrichment applies the trained model to 892 active loans originated in the past 12 months, generating default risk predictions:
- 724 loans predicted as "Performing" (low risk)
- 168 loans predicted as "Default" (high risk)
Sample high-risk predictions:
- Loan #50012: $320K, credit score 640, DTI 42%, employment 8 months = "Default"
- Loan #50034: $180K, credit score 680, DTI 38%, previous late payments = "Default"
- Loan #50078: $425K, credit score 655, DTI 45%, high loan-to-value ratio = "Default"
**Insights:** The risk management team segments the portfolio into predicted risk levels and implements differentiated monitoring strategies. High-risk loans receive monthly check-ins versus quarterly for low-risk loans. They also adjust pricing models to account for predicted risk, increasing interest rates by 0.5-1.0% for high-risk profiles. After 12 months, the model's predictions prove 82% accurate, and the proactive monitoring reduces actual default rates in the high-risk segment from 15% to 9%, saving an estimated $2.3 million in losses.
### Example 5: Customer Service Case Resolution Prediction
**Scenario:** A customer service organization wants to predict whether support tickets will be resolved within the target SLA timeframe based on initial ticket characteristics, allowing them to escalate at-risk cases early and improve SLA compliance rates.
**Settings:**
- **Prediction Type:** Classification
- **Feature Columns:** Issue_Category, Customer_Tier, Complexity_Score, Assigned_Team, Initial_Response_Time, Customer_Sentiment, Product_Version, Similar_Cases_Count
- **Predict Value Column:** Resolved_Within_SLA (contains "Yes" or "No" for closed tickets)
- **Training Filters:** "Ticket_Status equals 'Closed' AND Close_Date is not empty" (use only resolved tickets)
- **Prediction Filters:** "Ticket_Status equals 'Open' AND Hours_Since_Creation >= 2 AND Hours_Since_Creation < 24" (predict for recently opened tickets)
- **New Prediction Column:**
- Column Name: sla_compliance_prediction
- Display Name: Predicted SLA Compliance
- Data Type: String
- **Model Id:** (empty)
- **Python Image:** LOCAL
**Output:**
The enrichment predicts SLA compliance for 234 currently open support tickets. Example predictions:
- Ticket #7845: Billing issue, Premium customer, Complexity 2, Team A, 15-min response = Predicted "Yes"
- Ticket #7846: Technical bug, Standard customer, Complexity 8, Team B, 45-min response = Predicted "No" (escalation triggered)
- Ticket #7847: Password reset, Basic customer, Complexity 1, Team C, 5-min response = Predicted "Yes"
The predictions are displayed in the support team dashboard with color-coding: green for predicted SLA compliance, red for predicted SLA breach.
**Insights:** Support managers use the predictions to proactively escalate at-risk tickets to senior engineers or allocate additional resources. Over 6 months, the SLA compliance rate improves from 83% to 91%. The model reveals that tickets with high complexity scores assigned to Team B during peak hours have only a 58% chance of meeting SLA, leading to workload rebalancing and additional training for Team B. The organization also discovers that initial response time is the strongest predictor of overall resolution time, prompting new policies to ensure first responses within 15 minutes.
## Using Pre-Built Python Templates
The Quick Start section at the top of this page lists the three downloadable packages and what each is for. This section walks through the full upload workflow, what the templates handle automatically, and how to customize them.
When you run the AI Case Prediction enrichment without supplying a Model Id, mindzieStudio generates a placeholder Python script that produces **random predictions**. This is intentional - the script is a starting point for you to plug in real machine-learning logic. The pre-built template packages replace that placeholder with a real `scikit-learn` model that trains from your data and writes predictions back into a new case attribute.
### Step-by-Step Workflow
This workflow uses the existing **Upload Model** feature on the AI Case Prediction block. No local Python is required, and it works with every shipped version of mindzieStudio.
**1. Configure the AI Case Prediction enrichment**
Set Prediction Type, Feature Columns, Predict Value Column, the two filter lists, and the New Prediction Column as described in the Settings section above. Save the block. Leave the **Model Id** field empty for now.
**2. Download the matching template package**
From the table above, click the link that matches your Predict Value Column. Save the zip to your computer. Do **not** unzip it - upload it as-is.
**3. Upload it via the block's Upload Model menu**
On the AI Case Prediction block in mindzieStudio, open the block menu and choose **Upload Model**. Select the zip you just downloaded. mindzieStudio extracts it and assigns a unique **Model Id**.
**4. Paste the Model Id into the enrichment**
Copy the Model Id that mindzieStudio shows you and paste it into the **Model Id** field on the AI Case Prediction editor. Save.
**5. Run the enrichment**
The next time the enrichment executes, mindzieStudio writes fresh `Training.csv` and `Prediction.csv` from your current Training and Prediction filters, lays the uploaded model files on top, and runs `python script.py` in the configured Python image. The template loads the data, trains a `RandomForest` model, predicts, and writes the result back into the new case attribute. No further user action is required.
Subsequent executions of the same enrichment re-train on whatever the Training Filters currently match, so the model adapts as your data grows. If you want a model that does **not** retrain every run, see *Customizing the model* below.
### What the Templates Handle Automatically
You do not write a single line of Python. The templates take care of:
- **Generic column detection** - feature columns, target column, and case id are read from `Training.schema` at run time, so any attribute names work.
- **Numeric features** - median imputation for missing values.
- **Categorical / string features** - one-hot encoding with safe handling of unseen categories at prediction time.
- **Train / test split** - 80 / 20 hold-out for accuracy reporting (stratified for classifiers, regular for regression).
- **Class imbalance** - the multi-class template uses `class_weight='balanced'` and drops ultra-rare classes (fewer than 2 rows).
- **Type-correct output** - predictions are cast back to the target column's data type so they parse correctly when mindzieStudio reads them: Int32, Int64, Single, Double, Boolean, String, or TimeSpan-as-seconds.
### What the Templates Don't Do (Yet)
The templates are deliberately simple starting points. They do not:
- **Persist the trained model between runs** - each run re-trains from scratch. This is fast (seconds to a minute on typical event logs) but matters for very large datasets.
- **Search for the best hyper-parameters** - sensible defaults only.
- **Engineer features from datetime attributes** - if you have date columns in your features, extract numeric parts (day-of-week, month, hour) using a calculator before this enrichment.
- **Handle very large datasets** - tested up to ~100k cases. Beyond that, consider sub-sampling in the Training Filters.
### Customizing the Model
If the default `RandomForest` algorithm does not fit your problem, or you want to add hyper-parameter tuning, feature engineering, or your own algorithm, every template package is just three plain Python files inside a zip:
- `model_trainer.py` - the algorithm; this is the only file you ever need to change
- `mindzie_helper.py` - schema-aware CSV loader (don't edit)
- `script.py` - the entry point (don't edit)
To customize:
1. Unzip the template package on your computer.
2. Edit `model_trainer.py` - change algorithm, hyper-parameters, or pre-processing.
3. Re-zip the three files together (no surrounding folder).
4. Upload the new zip via **Upload Model** as in Step 3 above.
If you want to test your changes locally before re-uploading, run an AI Case Prediction enrichment once in mindzieStudio with the **Model Id** field empty, then click **Download Package** on the block menu. The download contains the same three files plus a real `in/Training.csv` and `in/Prediction.csv`. Replace `model_trainer.py` with your edited version and run `python script.py` from the unzipped folder. Output appears in `out/Prediction.csv`.
### Algorithm Reference
| Template | Estimator | Notable settings |
|---|---|---|
| Binary Classifier | `RandomForestClassifier` | `n_estimators=200`, `min_samples_leaf=2`, stratified split |
| Multi-class Classifier | `RandomForestClassifier` | `n_estimators=300`, `class_weight='balanced'`, rare-class guard |
| Regressor | `RandomForestRegressor` | `n_estimators=300`, `min_samples_leaf=2`, integer rounding |
All three use the same pre-processing pipeline: `ColumnTransformer` with `SimpleImputer(median)` for numerics and `SimpleImputer(constant)` + `OneHotEncoder(handle_unknown='ignore')` for categoricals, wrapped in a single `Pipeline` so prediction-time pre-processing matches training exactly.
### What the Templates Handle Automatically
You do not write a single line of Python. The templates take care of:
- **Generic column detection** - feature columns, target column, and case id are read from `Training.schema` at run time, so any attribute names work.
- **Numeric features** - median imputation for missing values.
- **Categorical / string features** - one-hot encoding with safe handling of unseen categories at prediction time.
- **Train / test split** - 80 / 20 hold-out for accuracy reporting (stratified for classifiers, regular for regression).
- **Class imbalance** - the multi-class template uses `class_weight='balanced'` and drops ultra-rare classes (fewer than 2 rows).
- **Type-correct output** - predictions are cast back to the target column's data type so they parse correctly when mindzieStudio reads them: Int32, Int64, Single, Double, Boolean, String, or TimeSpan-as-seconds.
### What the Templates Don't Do (Yet)
The templates are deliberately simple starting points. They do not:
- **Persist the trained model between runs** - each run re-trains from scratch.
- **Search for the best hyper-parameters** - sensible defaults only.
- **Engineer features from datetime attributes** - if you have date columns in your features, extract numeric parts (day-of-week, month, hour) using a calculator before this enrichment.
- **Handle very large datasets** - tested up to ~100k cases. Beyond that, consider sub-sampling in the Training Filters.
If you want to customize the algorithm, hyper-parameters, or pre-processing, the templates are ordinary Python scripts - edit and re-run.
### Algorithm Reference
| Template | Estimator | Notable settings |
|---|---|---|
| `binary_classifier.py` | `RandomForestClassifier` | `n_estimators=200`, `min_samples_leaf=2`, stratified split |
| `multiclass_classifier.py` | `RandomForestClassifier` | `n_estimators=300`, `class_weight='balanced'`, rare-class guard |
| `regressor.py` | `RandomForestRegressor` | `n_estimators=300`, `min_samples_leaf=2`, integer rounding |
All three use the same pre-processing pipeline: `ColumnTransformer` with `SimpleImputer(median)` for numerics and `SimpleImputer(constant)` + `OneHotEncoder(handle_unknown='ignore')` for categoricals, wrapped in a single `Pipeline` so prediction-time pre-processing matches training exactly.
### Required Python Environment
If you are running locally instead of using the Docker image, install the required packages:
```
pip install pandas==2.1.4 numpy==1.26.3 scikit-learn==1.4.0
```
These versions match the pinned dependencies in `mindzie_windows_python3_11:V01`, so behavior is identical whether you run locally or in the Docker container.
## Output
When the AI Case Prediction enrichment executes successfully, it creates a new case attribute in your dataset with the name you specified in the "New Prediction Column" configuration. This attribute is added as a derived column to the case table and appears alongside your other case attributes in all analysis dashboards, filters, and visualizations.
### Prediction Values
The values stored in the new prediction column depend on your Predict Value Column data type:
**For String (Text) Predictions:**
- The column contains text values matching the categories from your training data
- Example: "Approved", "Rejected", "High Risk", "Low Risk", "Delayed", "On Time"
- These values can be used in filters, grouping, and color-coding in dashboards
**For Boolean Predictions:**
- The column contains True or False values
- Example: True = "Will Default", False = "Will Not Default"
- Ideal for binary outcome predictions and simple yes/no classifications
**For Integer Predictions:**
- The column contains numeric codes representing categories
- Example: 0 = "Low Risk", 1 = "Medium Risk", 2 = "High Risk"
- Useful when categories have a natural numeric ordering
### Using Prediction Results
Once the prediction column is created, you can leverage it throughout mindzieStudio:
**In Filters:**
- Filter cases to show only high-risk predictions: "Predicted Risk equals 'High Risk'"
- Exclude low-risk cases from detailed analysis: "Predicted Outcome not equals 'Low Risk'"
- Combine predictions with other criteria: "Predicted Delay equals 'Yes' AND Order Amount > $10,000"
**In Dashboards:**
- Create performance charts grouped by predicted outcome
- Use predictions as color-coding in process maps to visualize risk across process paths
- Build KPI metrics showing prediction accuracy by comparing predicted vs actual outcomes
- Create heat maps showing predicted risk by department, product, or time period
**In Further Enrichments:**
- Use predictions as input to calculators (Example: "High Risk Score" calculator that considers predicted risk)
- Combine with other enrichments to create composite risk scores
- Use as filter criteria for targeted enrichments (Example: "Add compliance check only for predicted non-compliant cases")
**For Process Improvement:**
- Identify process patterns that lead to negative predicted outcomes
- Prioritize process redesign efforts on activities that most influence negative predictions
- Monitor prediction trends over time to measure process improvement effectiveness
- Compare predicted vs actual outcomes to validate and refine your model
### Model Training Output
When training a new model (when Model Id is not provided), the enrichment generates additional artifacts:
**Training Files:**
- Training.csv: The filtered case data used for model training
- Training.schema: Data type definitions for training columns
- Prediction.csv: The filtered case data requiring predictions
- Prediction.schema: Data type definitions for prediction columns
**Model Files:**
- script.py: The Python script that trains and applies the model
- model_trainer.py: The model training logic
- mindzie_helper.py: Utility functions for data loading and processing
**Console Output:**
The enrichment execution logs show:
- "Loading training data..." with row counts
- "Fitting model to training data..." with progress indicators
- "Model training completed successfully!"
- "Loading prediction data..." with row counts
- "Generating predictions..." with completion status
- "Successfully saved predictions to: out/Prediction.csv"
This detailed output helps you verify that training completed successfully and understand the scope of predictions generated.
### Prediction Quality Indicators
For production use, consider monitoring these quality indicators:
- **Prediction Coverage:** What percentage of cases received predictions vs failed due to missing feature values
- **Prediction Distribution:** Are predictions balanced or heavily skewed toward one outcome
- **Validation Accuracy:** When comparing predicted vs actual outcomes for historical cases, what is the accuracy rate
- **Missing Value Handling:** Which cases failed to receive predictions due to incomplete feature data
By analyzing these indicators, you can iteratively improve your feature selection, training filters, and data quality to enhance prediction accuracy and business value.
## See Also
**Related AI and Advanced Enrichments:**
- [Python](/mindzie_studio/enrichments/python) - Execute custom Python code for advanced data transformations and analysis
- Representative Case Attribute - Analyze and select representative values from case attributes
- Group Attribute Values - Group and categorize attribute values for analysis
**Related Predictive Topics:**
- Case Duration Analysis - Analyze historical case durations to inform duration predictions
- Process Simulation - Simulate future process performance using predictive models
- Risk Management Dashboards - Visualize and monitor predicted risks across your process
**Machine Learning Best Practices:**
- Model Training Guidelines - Best practices for training accurate prediction models
- Feature Engineering - Techniques for selecting and creating effective feature columns
- Model Validation - Methods for testing and validating model accuracy before deployment
- Production Deployment - Strategies for deploying AI predictions in production environments
---
*This documentation is part of the mindzieStudio process mining platform.*
---
## Allowed Case End Activities
Section: Enrichments
URL: https://docs.mindziestudio.com/mindzie_studio/enrichments/allowed-case-end-activities
Source: /docs-master/mindzieStudio/enrichments/allowed-case-end-activities/page.md
# Allowed Case End Activities
## Overview
The enrichment defines conformance issues if a case does not end with one of the selected activities.
## Common Uses
To specify the list of allowed activities a case can end with
## Settings
Start by going to the 'Log Enrichment' engine by going to any analysis and clicking 'Log Enrichment' in the top right.

Then click 'Add New'
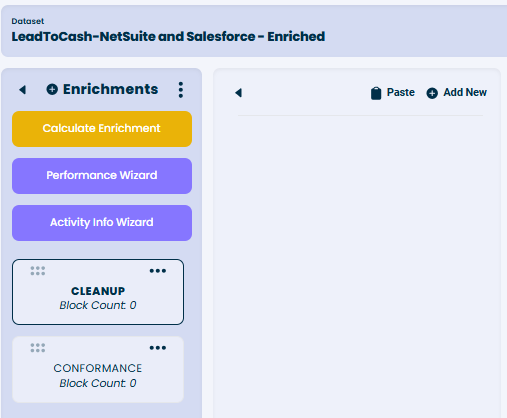
Then choose the enrichment block.
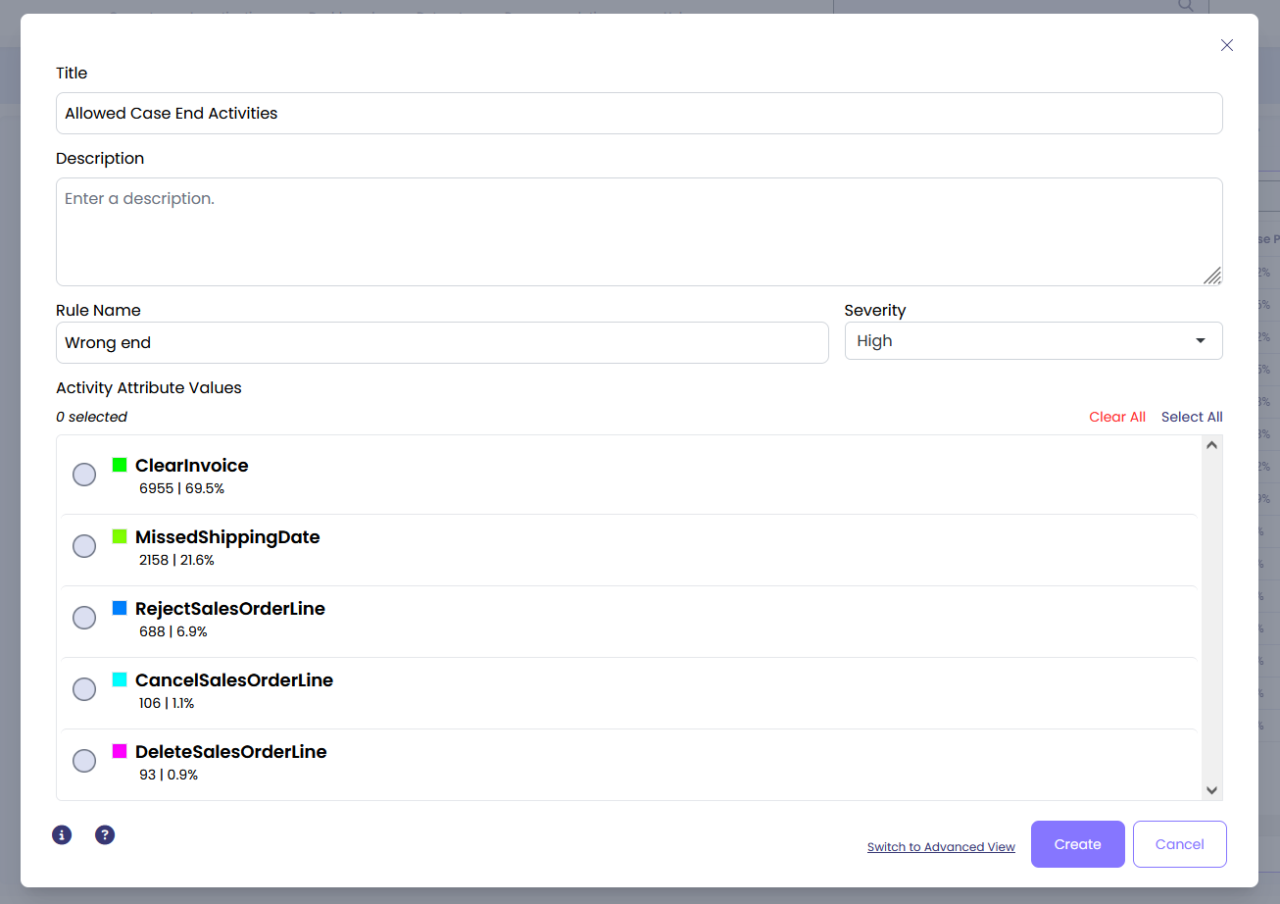
### Configuration Options
- **Rule Name:** Specify the name of the new attribute you are about to create.
- **Severity:** Select the severity of conformance issue if the case ends with a wrong activity.
- **Activity Attribute Values:** Select the activities that your cases are allowed to end with.
## Examples
In this example, we configure the enrichment to ensure cases end with approved activities such as "Close Case", "Archive Order", or "Complete Process". Any case ending with a different activity will be flagged as a conformance issue.
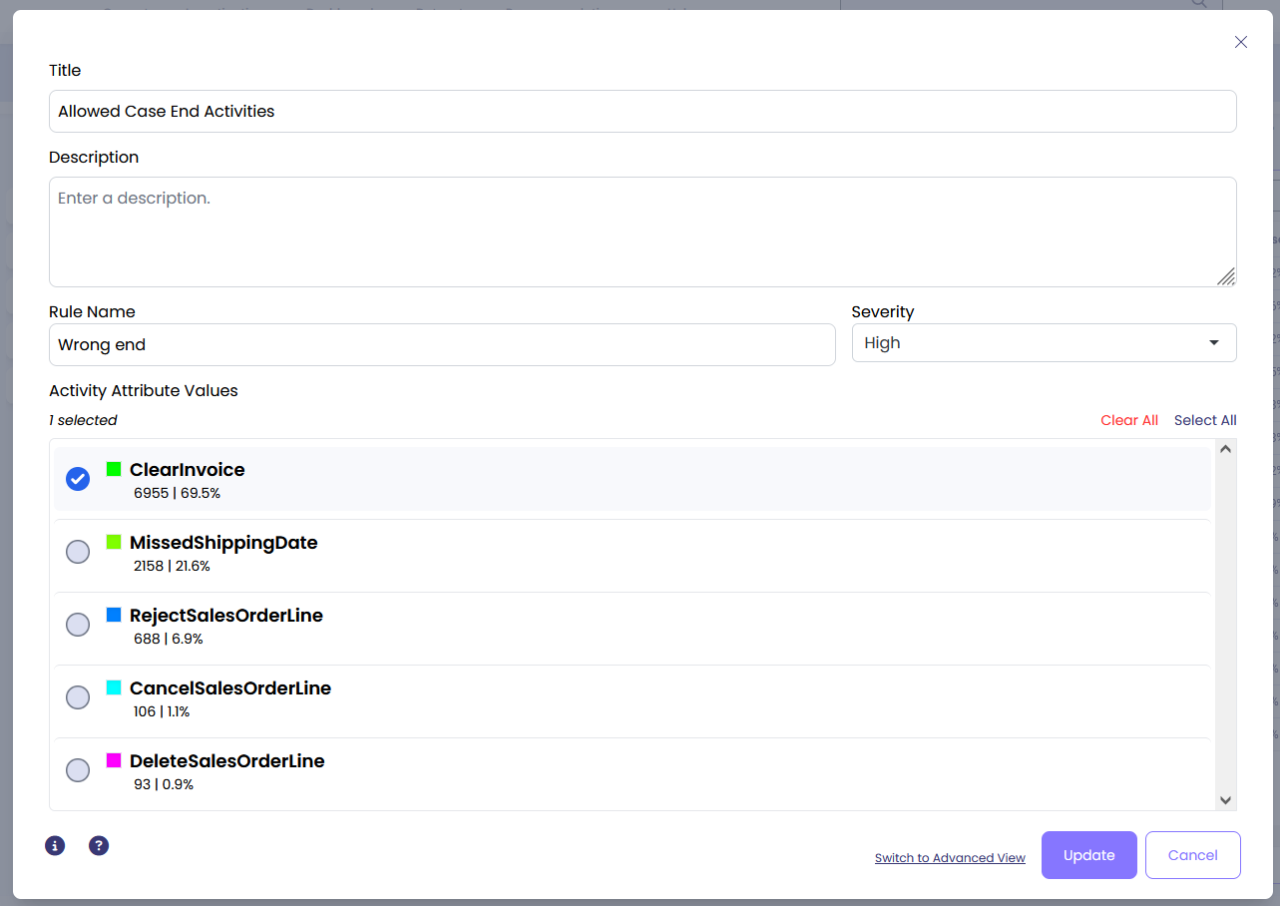
Click 'Create' and once you're ready click 'Calculate Enrichment' to add the new attribute to your data set.
## Output
When this enrichment is executed, it creates a new Boolean case attribute with the name you specified in "Rule Name". The attribute value will be:
- **TRUE**: If the case ends with an activity that is NOT in your allowed list (conformance issue detected)
- **FALSE**: If the case ends with one of the allowed activities (no conformance issue)
The severity level you select determines how this conformance issue is categorized in conformance analysis dashboards and reports. Cases with conformance issues can be filtered and analyzed to understand process deviations.
## See Also
**Related Conformance Enrichments:**
- [Allowed Case Start Activities](/mindzie_studio/enrichments/allowed-case-start-activities) - Define conformance issues for case start activities
- [Repeated Activity](/mindzie_studio/enrichments/repeated-activity) - Detect when activities are repeated in a case
- Mandatory Activity - Ensure required activities are performed
- Undesired Activity - Flag cases containing unwanted activities
- Wrong Activity Order - Detect activities performed in incorrect sequence
**Related Topics:**
- Conformance Experiments - Overview of conformance analysis in mindzieStudio
- Process Discovery - Understanding your process before applying conformance rules
---
## Allowed Case Start Activities
Section: Enrichments
URL: https://docs.mindziestudio.com/mindzie_studio/enrichments/allowed-case-start-activities
Source: /docs-master/mindzieStudio/enrichments/allowed-case-start-activities/page.md
# Allowed Case Start Activities
## Overview
The enrichment defines conformance issues if a case does not start with one of the selected activities. Conformance checking helps identify process deviations by validating that cases follow expected patterns. By controlling which activities can start a case, you can ensure your processes begin correctly and identify cases that don't follow standard procedures.
## Common Uses
To specify the list of allowed activities a case can start with
## Settings
Start by going to the 'Log Enrichment' engine by going to any analysis and clicking 'Log Enrichment' in the top right.

Then click 'Add New'

Then choose the enrichment block.

### Configuration Options
- **Rule Name:** Specify the name of the new attribute you are about to create.
- **Severity:** Select the severity of conformance issue if the case starts with a wrong activity.
- **Activity Attribute Values:** Select the activities that your cases are allowed to start with.

## Examples
In this example, we configure the enrichment to ensure cases start with approved entry points. Any case starting with a different activity will be flagged as a conformance issue.
To specify the activities that our cases are allowed to start with, configure the settings as shown above, then click 'Create' and once you're ready click 'Calculate Enrichment' to add the new attribute to your data set.
## Output
When this enrichment is executed, it creates a new Boolean case attribute with the name you specified in "Rule Name". The attribute value will be:
- **TRUE**: If the case starts with an activity that is NOT in your allowed list (conformance issue detected)
- **FALSE**: If the case starts with one of the allowed activities (no conformance issue)
The severity level you select determines how this conformance issue is categorized in conformance analysis dashboards and reports. Cases with conformance issues can be filtered and analyzed to understand process deviations.
## See Also
**Related Conformance Enrichments:**
- [Allowed Case End Activities](/mindzie_studio/enrichments/allowed-case-end-activities) - Define conformance issues for case end activities
- [Repeated Activity](/mindzie_studio/enrichments/repeated-activity) - Detect when activities are repeated in a case
- [Case Closed](/mindzie_studio/enrichments/case-closed) - Check if cases are properly closed
**Related Topics:**
- [Conformance Experiments](/mindzie_studio/enrichments/conformance-experiments) - Overview of conformance analysis in mindzieStudio
- [Attribute Enrichments](/mindzie_studio/enrichments/attribute-enrichments) - Understanding enrichments in general
---
*This documentation is part of the mindzie Studio process mining platform.*
---
## Anonymize
Section: Enrichments
URL: https://docs.mindziestudio.com/mindzie_studio/enrichments/anonymize
Source: /docs-master/mindzieStudio/enrichments/anonymize/page.md
# Anonymize
## Overview
The Anonymize enrichment provides comprehensive data privacy protection by systematically replacing sensitive text attribute values with anonymized placeholders while preserving the analytical value of your process data. This critical data protection operator ensures compliance with privacy regulations such as GDPR, HIPAA, and other data protection standards by replacing personally identifiable information (PII), confidential business data, and other sensitive text values with consistent anonymous identifiers. The enrichment maintains data relationships and patterns essential for process analysis while removing the actual sensitive content, making it safe to share datasets with external parties, use in demonstrations, or store in less secure environments.
The Anonymize enrichment works by grouping identical attribute values together and replacing each unique value with a standardized anonymous identifier in the format "AttributeName 0001", "AttributeName 0002", etc. This approach ensures that all instances of the same original value receive the same anonymous identifier, preserving data consistency and enabling meaningful process analysis without exposing sensitive information. The enrichment can operate on all text attributes automatically or target specific attributes based on your privacy requirements, providing flexible control over what data gets anonymized while leaving non-sensitive attributes intact for reference.
## Common Uses
- Protect personally identifiable information (PII) such as customer names, employee IDs, email addresses, and social security numbers
- Anonymize financial data including account numbers, credit card information, and transaction references before sharing with third parties
- Prepare datasets for external consultants or vendors while maintaining data confidentiality
- Create demonstration datasets from production data without exposing sensitive business information
- Ensure GDPR compliance by anonymizing personal data in process mining projects
- Protect patient information in healthcare process analysis while maintaining case relationships
- Anonymize supplier and vendor names in procurement process analysis for competitive confidentiality
## Settings
**Attribute Names (Optional):** Select specific text attributes to anonymize. When left empty, the enrichment automatically anonymizes all text attributes in both case and event tables, excluding system attributes like Case ID and Activity names. This selective approach allows you to anonymize only sensitive attributes while preserving non-sensitive reference data. The dropdown shows all available text attributes from your dataset. You can select multiple attributes by clicking on each one you want to anonymize. Only string/text type attributes are available for selection, as numeric and date attributes typically don't contain personally identifiable information and are essential for process analysis.
## Examples
### Example 1: GDPR-Compliant Customer Service Process
**Scenario:** A telecommunications company needs to share their customer service process data with an external consulting firm for process optimization analysis, but must protect customer personal information to comply with GDPR regulations.
**Settings:**
- Attribute Names: Customer_Name, Phone_Number, Email_Address, Account_Number, Address, Credit_Card_Last4
**Output:**
The enrichment replaces sensitive customer data with anonymous identifiers:
- Customer_Name: "John Smith" becomes "Customer_Name 0001"
- Customer_Name: "Jane Doe" becomes "Customer_Name 0002"
- Phone_Number: "+1-555-0123" becomes "Phone_Number 0001"
- Email_Address: "john.smith@example.com" becomes "Email_Address 0001"
- Account_Number: "ACC-789456123" becomes "Account_Number 0001"
All instances of "John Smith" across different cases are consistently replaced with "Customer_Name 0001", maintaining data relationships for analysis.
**Insights:** The consulting firm can analyze customer service patterns, identify bottlenecks, and recommend improvements without ever accessing actual customer personal information, ensuring full GDPR compliance while enabling meaningful process insights.
### Example 2: Healthcare Patient Journey Analysis
**Scenario:** A hospital needs to analyze patient treatment pathways across departments but must protect patient health information (PHI) to comply with HIPAA regulations before the data can be used for research purposes.
**Settings:**
- Attribute Names: Patient_Name, Medical_Record_Number, SSN, Insurance_ID, Physician_Name, Diagnosis_Description, Medication_Names
**Output:**
Sensitive medical information is systematically anonymized:
- Patient_Name: "Robert Johnson" becomes "Patient_Name 0001"
- Medical_Record_Number: "MRN-2024-45678" becomes "Medical_Record_Number 0001"
- SSN: "123-45-6789" becomes "SSN 0001"
- Physician_Name: "Dr. Sarah Williams" becomes "Physician_Name 0001"
- Diagnosis_Description: "Type 2 Diabetes" becomes "Diagnosis_Description 0001"
The same diagnosis appearing in multiple cases maintains the same anonymous identifier, allowing pattern analysis.
**Insights:** Researchers can study treatment patterns, analyze patient flow between departments, and identify care optimization opportunities while maintaining complete patient privacy and HIPAA compliance.
### Example 3: Financial Audit Process Anonymization
**Scenario:** An accounting firm needs to demonstrate their audit process methodology to potential clients using real audit data, but must protect sensitive financial account information and company names.
**Settings:**
- Attribute Names: Company_Name, Account_Number, Bank_Name, Auditor_Name, Contact_Person, Tax_ID
**Output:**
Financial and business identifiers are replaced with anonymous codes:
- Company_Name: "Acme Corporation" becomes "Company_Name 0001"
- Account_Number: "4532-1234-5678-9012" becomes "Account_Number 0001"
- Bank_Name: "First National Bank" becomes "Bank_Name 0001"
- Auditor_Name: "Michael Chen" becomes "Auditor_Name 0001"
All references to "Acme Corporation" across different audit steps receive the same identifier "Company_Name 0001".
**Insights:** The firm can showcase their audit process efficiency, demonstrate compliance checking procedures, and highlight their methodology without revealing any client confidential information.
### Example 4: Supply Chain Data Sharing
**Scenario:** A manufacturing company wants to share supply chain process data with a logistics optimization vendor but needs to protect supplier relationships and pricing information from potential competitors.
**Settings:**
- Attribute Names: Supplier_Name, Supplier_Contact, PO_Number, Part_Number, Supplier_Location
**Output:**
Supplier and component information is anonymized while preserving relationships:
- Supplier_Name: "TechParts Asia Ltd" becomes "Supplier_Name 0001"
- Supplier_Contact: "Lisa Wang" becomes "Supplier_Contact 0001"
- PO_Number: "PO-2024-789456" becomes "PO_Number 0001"
- Part_Number: "CPU-X7-2024-ADV" becomes "Part_Number 0001"
The same supplier appearing in multiple purchase orders maintains consistent anonymization.
**Insights:** The logistics vendor can analyze supply chain patterns, identify delivery bottlenecks, and optimize routing without accessing competitive supplier information or pricing details.
### Example 5: Employee Performance Review Process
**Scenario:** An HR consulting firm is helping optimize a performance review process and needs access to process data without seeing actual employee names, IDs, or salary information.
**Settings:**
- Attribute Names: (Leave empty to anonymize all text attributes automatically)
**Output:**
All text attributes are automatically anonymized:
- Employee_Name: "Jennifer Brown" becomes "Employee_Name 0001"
- Manager_Name: "David Lee" becomes "Manager_Name 0001"
- Department: "Sales West" becomes "Department 0001"
- Job_Title: "Senior Account Manager" becomes "Job_Title 0001"
- Review_Comments: "Exceeds expectations" becomes "Review_Comments 0001"
- Employee_ID: "EMP-45678" becomes "Employee_ID 0001"
Numeric attributes like Review_Score and Years_of_Service remain unchanged for analysis.
**Insights:** The consulting firm can analyze review cycle times, identify process inefficiencies, and recommend improvements while maintaining complete employee confidentiality and privacy.
## Output
The Anonymize enrichment modifies existing text attribute values in-place, replacing sensitive content with anonymous identifiers while preserving the attribute structure and data types. The anonymization follows a consistent pattern that maintains data relationships essential for process mining analysis.
**Anonymization Format:** Each unique value within an attribute is replaced with the pattern "[AttributeName] [4-digit-number]", where the number is assigned sequentially starting from 0001. For example, the first unique value in the "Customer_Name" attribute becomes "Customer_Name 0001", the second unique value becomes "Customer_Name 0002", and so on.
**Consistency Guarantee:** The enrichment ensures that all instances of the same original value receive the same anonymous identifier across all cases and events. This consistency preservation is critical for maintaining data relationships and enabling meaningful process analysis. If "John Smith" appears in 100 different cases, all 100 instances will be replaced with the same identifier "Customer_Name 0001".
**Scope of Anonymization:** When no specific attributes are selected, the enrichment automatically anonymizes all text (string) attributes in both the case table and event table, with the following exceptions:
- Case ID attributes are preserved to maintain case identity
- Activity names are preserved to maintain process flow visibility
- Calculated attributes are skipped as they don't contain source sensitive data
- Hidden attributes are skipped
- Non-text attributes (numbers, dates, booleans) remain unchanged
**Irreversibility:** The anonymization process is irreversible within mindzieStudio. Once applied, the original values cannot be recovered from the anonymized dataset. Always maintain a backup of your original data before applying anonymization if you need to preserve the original values for other purposes.
**Performance Considerations:** The enrichment groups all unique values for each attribute before applying anonymization, ensuring efficient processing even for large datasets. The sequential numbering approach maintains a predictable and readable format while ensuring uniqueness.
**Integration with Other Features:** Anonymized attributes retain their original data type and can be used in all mindzieStudio features including filters, process maps, and other enrichments. The anonymous identifiers can be used in group-by operations, conformance checking, and performance analysis just like the original values. The consistent replacement ensures that process patterns, frequencies, and relationships remain analyzable after anonymization.
## See Also
- **Hide Attribute** - Completely hide sensitive attributes from view without modifying data
- **Hide Blank Attributes** - Remove attributes with no values from the dataset
- **Group Attribute Values** - Combine similar attribute values into categories
- **Categorize Attribute Values** - Create meaningful categories from attribute ranges
- **Trim Text** - Clean up text attributes by removing leading/trailing spaces
- **Text Start** - Extract the beginning portion of text attributes
- **Text End** - Extract the ending portion of text attributes
---
*This documentation is part of the mindzie Studio process mining platform.*
---
## Attribute Changes Between Two Activities
Section: Enrichments
URL: https://docs.mindziestudio.com/mindzie_studio/enrichments/attribute-changes-between-two-activities
Source: /docs-master/mindzieStudio/enrichments/attribute-changes-between-two-activities/page.md
# Attribute Changes between two Activities
## Overview
The Attribute Changes between two Activities enrichment analyzes event attributes to detect changes that occur between two specific activities within each case. This powerful enrichment creates boolean attributes that indicate whether selected event attributes have changed in value between your specified activities. This is essential for understanding data transformations, handoff quality, process consistency, and identifying where information modifications occur in your business processes. The enrichment can analyze multiple event attributes simultaneously and even create new activities to mark where changes occurred, providing comprehensive visibility into data evolution throughout your process flow.
Beyond simple change detection, this enrichment helps organizations identify process inefficiencies, data quality issues, and compliance risks. By tracking attribute changes between key process milestones, you can pinpoint where data corrections happen, validate that required transformations occur, and ensure information consistency across departmental handoffs. The ability to generate activities at change points makes this enrichment particularly valuable for creating visual markers in process maps that highlight critical data transitions.
## Common Uses
- **Invoice Processing**: Detect changes in invoice amounts, payment terms, or approval codes between submission and approval stages
- **Order Management**: Track modifications to order quantities, delivery dates, or customer requirements between order entry and fulfillment
- **Change Request Handling**: Monitor status changes, priority adjustments, or assigned team modifications between initial request and implementation
- **Quality Control**: Identify product specifications, test results, or quality scores that change between inspection stages
- **Customer Service**: Detect ticket priority changes, category reassignments, or resolution code modifications between creation and closure
- **Healthcare Pathways**: Track diagnosis code changes, treatment plan modifications, or insurance status updates between patient encounters
- **Loan Processing**: Monitor credit score updates, collateral valuations, or interest rate adjustments between application and approval
## Settings
**Event Columns:** Select which event attributes to analyze for changes between the two activities. The enrichment will create a separate boolean attribute for each selected column, indicating whether its value changed. You can select multiple columns to comprehensively track data modifications across different aspects of your process. Leave empty to automatically analyze all non-system event attributes.
**Activity 1:** Choose the first activity that serves as the starting point for comparison. This activity marks where the initial attribute values will be captured. Select an activity that represents a meaningful checkpoint in your process where data should be in a specific state.
**Activity 1 Selection Type:** Specify whether to use the First or Last occurrence of Activity 1 within each case:
- **First**: Uses the earliest occurrence when the activity appears multiple times
- **Last**: Uses the most recent occurrence before Activity 2
- Default is First
**Activity 2:** Choose the second activity that serves as the ending point for comparison. The enrichment will compare attribute values at this activity against the values from Activity 1. Select an activity that represents another key milestone where you want to verify data changes or consistency.
**Activity 2 Selection Type:** Specify whether to use the First or Last occurrence of Activity 2 within each case:
- **First**: Uses the earliest occurrence after Activity 1
- **Last**: Uses the final occurrence in the case
- Default is Last
**Create Activities:** Enable this option to automatically inject new activities into your event log at points where attribute changes are detected. When enabled, the enrichment creates new events with activity names matching the changed attribute (e.g., "Invoice Amount-Change"). This provides visual markers in process maps and enables additional analysis of change patterns. Default is disabled.
## Examples
### Example 1: Invoice Amount Verification
**Scenario:** A finance team needs to track whether invoice amounts are modified between initial submission and final approval, as such changes require additional review according to company policy.
**Settings:**
- Event Columns: [Invoice_Amount, Tax_Amount, Total_Due]
- Activity 1: Submit Invoice
- Activity 1 Selection Type: First
- Activity 2: Approve Invoice
- Activity 2 Selection Type: Last
- Create Activities: False
**Output:**
Creates three new boolean case attributes:
- `Invoice_Amount-Change`: True for cases where the invoice amount was modified
- `Tax_Amount-Change`: True for cases where tax calculations changed
- `Total_Due-Change`: True for cases where the total amount due changed
Sample data showing enrichment results:
| Case ID | Invoice_Amount-Change | Tax_Amount-Change | Total_Due-Change |
|---------|----------------------|-------------------|------------------|
| INV-001 | False | False | False |
| INV-002 | True | True | True |
| INV-003 | False | True | True |
| INV-004 | True | False | True |
**Insights:** The finance team discovers that 23% of invoices have amount changes between submission and approval, indicating a need for better initial validation. They implement additional training and system checks at the submission stage to reduce rework.
### Example 2: Order Fulfillment Quality
**Scenario:** A logistics company wants to identify orders where delivery details change between order placement and shipment preparation, as these changes often lead to delivery delays and customer complaints.
**Settings:**
- Event Columns: [Delivery_Address, Delivery_Date, Shipping_Method, Order_Priority]
- Activity 1: Place Order
- Activity 1 Selection Type: First
- Activity 2: Prepare Shipment
- Activity 2 Selection Type: First
- Create Activities: True
**Output:**
Creates four boolean attributes and injects new activities for each detected change:
- `Delivery_Address-Change`: Indicates address modifications
- `Delivery_Date-Change`: Shows delivery date adjustments
- `Shipping_Method-Change`: Reveals shipping method changes
- `Order_Priority-Change`: Tracks priority modifications
When changes are detected, new events are added to the log:
| Case ID | Activity | Timestamp |
|---------|----------|-----------|
| ORD-123 | Place Order | 2024-01-10 09:00 |
| ORD-123 | Delivery_Date-Change | 2024-01-10 14:30 |
| ORD-123 | Shipping_Method-Change | 2024-01-10 14:30 |
| ORD-123 | Prepare Shipment | 2024-01-10 14:30 |
**Insights:** Analysis reveals that 35% of orders have delivery date changes, primarily occurring during peak seasons. The company implements a customer notification system for date changes and adjusts capacity planning to reduce modifications.
### Example 3: Healthcare Treatment Pathway Monitoring
**Scenario:** A hospital needs to track changes in patient diagnosis codes and treatment plans between initial emergency room assessment and admission to specialized departments, ensuring proper handoff communication.
**Settings:**
- Event Columns: [Diagnosis_Code, Treatment_Priority, Assigned_Department, Insurance_Status]
- Activity 1: ER Assessment
- Activity 1 Selection Type: First
- Activity 2: Department Admission
- Activity 2 Selection Type: First
- Create Activities: False
**Output:**
Creates four boolean attributes for tracking medical data changes:
- `Diagnosis_Code-Change`: True when diagnosis is refined or changed
- `Treatment_Priority-Change`: Indicates priority level modifications
- `Assigned_Department-Change`: Shows department reassignments
- `Insurance_Status-Change`: Tracks insurance verification updates
Results enable filtering and analysis:
| Case ID | Diagnosis_Code-Change | Treatment_Priority-Change | Assigned_Department-Change |
|---------|----------------------|--------------------------|----------------------------|
| PT-001 | True | False | False |
| PT-002 | True | True | True |
| PT-003 | False | False | False |
| PT-004 | True | False | True |
**Insights:** The hospital identifies that 42% of patients have diagnosis code changes between ER and admission, indicating the need for better initial assessment protocols. They implement additional diagnostic tools in the ER to improve accuracy.
### Example 4: IT Change Request Management
**Scenario:** An IT service desk wants to monitor how change request attributes evolve between initial submission and implementation start, identifying patterns that correlate with successful deployments.
**Settings:**
- Event Columns: [Risk_Level, Implementation_Type, Affected_Systems, Approval_Status]
- Activity 1: Submit Change Request
- Activity 1 Selection Type: First
- Activity 2: Start Implementation
- Activity 2 Selection Type: First
- Create Activities: True
**Output:**
Creates boolean change indicators and activity markers:
- `Risk_Level-Change`: Indicates risk assessment modifications
- `Implementation_Type-Change`: Shows changes in implementation approach
- `Affected_Systems-Change`: Tracks scope modifications
- `Approval_Status-Change`: Monitors approval level changes
The enrichment injects activities to mark significant changes, enabling process mining visualization of where modifications occur in the change management workflow.
**Insights:** The IT team discovers that change requests with Risk_Level modifications have 3x higher failure rates. They implement mandatory review meetings when risk levels change to ensure proper planning adjustments.
### Example 5: Manufacturing Quality Control
**Scenario:** A manufacturer needs to detect whether product specifications or quality measurements change between different inspection stations to identify where defects are introduced or corrected.
**Settings:**
- Event Columns: [Product_Weight, Color_Code, Quality_Score, Defect_Count]
- Activity 1: Initial Inspection
- Activity 1 Selection Type: Last
- Activity 2: Final Inspection
- Activity 2 Selection Type: Last
- Create Activities: False
**Output:**
Creates quality change tracking attributes:
- `Product_Weight-Change`: Detects weight variations
- `Color_Code-Change`: Identifies color specification changes
- `Quality_Score-Change`: Tracks quality rating modifications
- `Defect_Count-Change`: Shows defect count changes
Analysis results by production line:
| Production Line | % Weight Changes | % Quality Score Changes | % Defect Changes |
|----------------|------------------|------------------------|------------------|
| Line A | 2.3% | 15.2% | 18.5% |
| Line B | 5.1% | 22.7% | 31.2% |
| Line C | 1.8% | 8.9% | 11.3% |
**Insights:** Production Line B shows significantly higher change rates, indicating equipment calibration issues. The manufacturer schedules immediate maintenance and implements more frequent quality checks on that line.
## Output
The enrichment creates new boolean case attributes for each selected event column, following the naming pattern `[ColumnName]-Change`. These attributes contain:
- **True**: When the event attribute value differs between Activity 1 and Activity 2
- **False**: When the event attribute value remains the same or when either activity is missing from the case
- **Empty/Null**: When the attribute cannot be evaluated (missing activities or attribute values)
Each created attribute:
- Is immediately available for use in filters, calculators, and other enrichments
- Can be exported with your enhanced dataset
- Appears in case attribute lists for analysis and visualization
- Supports process mining visualizations when change activities are created
When "Create Activities" is enabled, the enrichment also:
- Injects new events into the event log at the timestamp of Activity 2
- Names these events using the pattern `[ColumnName]-Change`
- Copies all other event attributes from Activity 2 to maintain context
- Requires dataset refresh to see new activities in process maps
The enrichment intelligently handles:
- Cases where one or both activities don't exist (no change recorded)
- Multiple occurrences of activities (controlled by selection type settings)
- Null or empty attribute values (treated as distinct values for comparison)
- Mixed data types (compares string representations)
Use these outputs to:
- Filter cases with specific types of changes for detailed analysis
- Calculate change rates and patterns across your process
- Create alerts for unexpected modifications
- Build conformance rules around allowed and prohibited changes
- Visualize change patterns in process maps when activities are created
---
*This documentation is part of the mindzie Studio process mining platform.*
---
## Attribute Changes In A Case
Section: Enrichments
URL: https://docs.mindziestudio.com/mindzie_studio/enrichments/attribute-changes-in-a-case
Source: /docs-master/mindzieStudio/enrichments/attribute-changes-in-a-case/page.md
# Attribute Changes in a Case
## Overview
The Attribute Changes in a Case enrichment is a powerful analytical tool that detects and quantifies value changes in event attributes throughout the lifecycle of a case. This enrichment automatically examines every event attribute in your dataset and creates new case-level metrics that reveal patterns of change, stability, and variation within each process instance. By transforming event-level variations into case-level insights, this enrichment enables you to identify process inconsistencies, track state transitions, and measure process stability at scale.
This enrichment is particularly valuable for understanding process dynamics and variability. It answers critical questions about how attribute values evolve during case execution - whether status fields change frequently, if resource assignments remain consistent, or how many distinct values an attribute takes within a single case. The enrichment creates up to three different types of metrics for each event attribute, giving you flexibility in how you analyze and visualize attribute changes across your process.
## Common Uses
- **Status transition analysis** - Track how many times order status, approval status, or case status changes throughout the process lifecycle
- **Resource consistency monitoring** - Identify cases where ownership or responsibility changes hands multiple times, indicating potential handover issues
- **Data quality validation** - Detect unexpected variations in attributes that should remain constant, revealing data entry errors or system inconsistencies
- **Process complexity measurement** - Quantify the number of distinct values or states a case passes through to measure process complexity
- **Change frequency analysis** - Count the total number of value changes to identify highly volatile cases requiring investigation
- **Conformance checking** - Verify that certain attributes maintain expected values or change patterns according to business rules
- **Performance categorization** - Group cases by their change patterns to understand which types of cases follow simpler versus more complex paths
## Settings
**Ignore Null:** Determines whether null (empty) values should be excluded when analyzing attribute changes. When enabled, the enrichment will skip over events where the attribute value is null, focusing only on actual value changes. This is useful when null values represent missing data rather than meaningful state changes. Default value is true (enabled). Enable this when nulls represent data gaps; disable when null is a meaningful state in your process.
**Create Change Count Attribute:** Controls whether to create attributes that count the total number of value changes for each event attribute. When enabled, creates attributes with the suffix "-Changes" that contain the count of how many times the value changed from one event to the next. This provides a sequential change count metric. Default value is true (enabled). Use this to measure volatility and identify cases with frequent state transitions.
**Create Group Count Attribute:** Determines whether to create attributes that count the number of distinct values (groups) each event attribute takes within a case. When enabled, creates attributes with the suffix "-Groups" containing the count of unique values. This measures diversity rather than change frequency. Default value is true (enabled). Enable this to understand value diversity and process complexity.
**Create Bool Change Attribute:** Controls whether to create boolean attributes indicating if any change occurred for each event attribute. When enabled, creates attributes with the suffix "-Change" that contain true/false values - true if the attribute had any distinct values, false otherwise. Default value is true (enabled). Use this for simple binary classification of cases with or without changes.
## Examples
### Example 1: Order Status Monitoring in Procurement
**Scenario:** A procurement team needs to identify purchase orders with excessive status changes, which often indicate process complications or delays requiring manual intervention.
**Settings:**
- Ignore Null: true
- Create Change Count Attribute: true
- Create Group Count Attribute: true
- Create Bool Change Attribute: false
**Output:**
For an event attribute "Order_Status" that transitions through values: "Created" → "Approved" → "In Review" → "Approved" → "Processed", the enrichment creates:
- `Order_Status-Changes`: 4 (counts each transition)
- `Order_Status-Groups`: 4 (counts distinct values: Created, Approved, In Review, Processed)
Cases with `Order_Status-Changes` > 5 are flagged for review as they indicate repeated back-and-forth status changes.
**Insights:** Orders with high change counts correlate with longer cycle times and higher costs. The procurement team implements automated alerts for orders exceeding 3 status changes to proactively manage exceptions.
### Example 2: Patient Care Team Transitions in Healthcare
**Scenario:** A hospital wants to analyze care continuity by tracking how often patients are transferred between different medical teams or departments during their stay.
**Settings:**
- Ignore Null: true
- Create Change Count Attribute: true
- Create Group Count Attribute: true
- Create Bool Change Attribute: true
**Output:**
For an event attribute "Assigned_Team" with values: "ER" → "ER" → "ICU" → "Surgery" → "ICU" → "Recovery", the enrichment creates:
- `Assigned_Team-Changes`: 4 (ER to ICU, ICU to Surgery, Surgery to ICU, ICU to Recovery)
- `Assigned_Team-Groups`: 4 (ER, ICU, Surgery, Recovery)
- `Assigned_Team-Change`: true (changes occurred)
**Insights:** Patients with more than 3 team transitions show 40% longer average length of stay. The hospital implements care coordination protocols for high-transition patients to improve outcomes and efficiency.
### Example 3: Manufacturing Quality Control Tracking
**Scenario:** A manufacturing plant needs to monitor quality inspection results throughout the production process to identify products requiring multiple quality interventions.
**Settings:**
- Ignore Null: false
- Create Change Count Attribute: true
- Create Group Count Attribute: true
- Create Bool Change Attribute: false
**Output:**
For an event attribute "Quality_Status" with values: null → "Pass" → "Fail" → "Rework" → "Pass", the enrichment creates:
- `Quality_Status-Changes`: 4 (including the initial null to Pass transition)
- `Quality_Status-Groups`: 5 (null, Pass, Fail, Rework, and Pass counted as distinct)
Products with `Quality_Status-Groups` > 2 are analyzed for root cause analysis of quality issues.
**Insights:** Products experiencing quality status changes correlate with specific production lines and shifts, leading to targeted training and equipment maintenance programs.
### Example 4: Financial Transaction Approval Workflow
**Scenario:** A bank wants to analyze the complexity of their loan approval process by tracking how many different approval levels and decision states each application passes through.
**Settings:**
- Ignore Null: true
- Create Change Count Attribute: false
- Create Group Count Attribute: true
- Create Bool Change Attribute: true
**Output:**
For an event attribute "Approval_Level" with values: "Initial_Review" → "Credit_Check" → "Manager_Review" → "Credit_Check" → "Final_Approval", the enrichment creates:
- `Approval_Level-Groups`: 4 (Initial_Review, Credit_Check, Manager_Review, Final_Approval)
- `Approval_Level-Change`: true
Loan applications with `Approval_Level-Groups` > 5 indicate complex cases requiring process optimization.
**Insights:** Applications with fewer approval level groups have 60% faster processing times. The bank streamlines the process for standard applications while maintaining thorough review for complex cases.
### Example 5: IT Incident Resolution Tracking
**Scenario:** An IT service desk needs to track how often incident priorities and assignees change to identify tickets that bounce between teams without resolution.
**Settings:**
- Ignore Null: true
- Create Change Count Attribute: true
- Create Group Count Attribute: true
- Create Bool Change Attribute: true
**Output:**
For event attributes "Priority" and "Assigned_Group":
- `Priority-Changes`: Number of priority escalations or de-escalations
- `Priority-Groups`: Count of distinct priority levels used
- `Assigned_Group-Changes`: Number of times the ticket was reassigned
- `Assigned_Group-Groups`: Number of different teams that handled the ticket
- `Assigned_Group-Change`: true/false indicating if any reassignment occurred
Tickets with both `Priority-Changes` > 2 and `Assigned_Group-Changes` > 3 are flagged as "hot potato" tickets requiring management attention.
**Insights:** Incidents with multiple reassignments show 3x longer resolution times. The service desk implements a "sticky assignment" policy where the first responding team must coordinate resolution even if expertise from other teams is needed.
## Output
The Attribute Changes in a Case enrichment creates new case-level attributes for each non-system event attribute in your dataset. The enrichment automatically processes all event attributes except system columns (Activity, Timestamp, Start Time) and hidden or calculated columns.
**Generated Attributes:**
- **[AttributeName]-Changes** (Integer): Contains the count of value transitions for the attribute. A change is counted each time the value differs from the previous event. Values range from 0 (no changes) to n-1 where n is the number of events in the case.
- **[AttributeName]-Groups** (Integer): Contains the count of distinct values the attribute takes within the case. This measures value diversity regardless of change frequency. A value of 1 indicates the attribute remained constant throughout the case.
- **[AttributeName]-Change** (Boolean): Contains true if the attribute had any distinct values within the case, false if it remained constant or had no values. This provides a simple binary indicator of change presence.
**Data Types and Formats:**
- Change count attributes: Integer values displayed with number formatting
- Group count attributes: Integer values displayed with number formatting
- Boolean change attributes: Boolean values displayed as Yes/No
**Integration with Other Features:**
- Use these attributes in filters to identify cases with specific change patterns
- Combine with calculators to create change ratios or percentages
- Apply in dashboards to visualize process stability metrics
- Use in conformance checking to verify expected change patterns
- Leverage in machine learning models as process complexity features
**Naming Conventions:**
The enrichment preserves the original attribute name and appends clear suffixes (-Changes, -Groups, -Change) making it easy to identify the source attribute and metric type. These attributes appear in the case attribute list and can be used immediately in all mindzieStudio analysis features.
---
*This documentation is part of the mindzie Studio process mining platform.*
---
## BPMN Conformance
Section: Enrichments
URL: https://docs.mindziestudio.com/mindzie_studio/enrichments/bpmn-conformance
Source: /docs-master/mindzieStudio/enrichments/bpmn-conformance/page.md
# BPMN Conformance
## Overview
BPMN Conformance checking compares your actual process data against a designed BPMN process model. It analyzes every case in your event log and determines whether each case follows the expected process flow defined in your BPMN model.
This feature is configured during the **Dataset Upload** wizard when you load your event log into mindzieStudio.

This feature uses **Petri Net token replay** for accurate conformance checking. Unlike simple sequence matching, token replay correctly handles:
- **Parallel gateways (AND)**: All branches must be executed
- **Exclusive gateways (XOR)**: Only one branch should be taken
- **Inclusive gateways (OR)**: One or more branches can be taken
## Common Uses
- **Process Compliance**: Verify that cases follow the standard operating procedure defined in your BPMN model
- **Deviation Analysis**: Identify cases that deviate from the expected process flow
- **Quality Control**: Flag non-conforming cases for review or remediation
- **Continuous Improvement**: Track conformance rates over time to measure process improvement
- **Audit Support**: Provide evidence of process compliance for internal or external audits
## How to Configure
### Step 1: Access Dataset Configuration
During the dataset upload wizard, navigate to the **Configure** step (step 6 of 7). In the left sidebar, select **BPMN Conformance**.
### Step 2: Upload Your BPMN Model
Click the upload area to select a BPMN 2.0 file from your computer.
**Supported formats:**
- `.bpmn` - Standard BPMN 2.0 files
- `.xml` - XML files containing BPMN 2.0 definitions
**File requirements:**
- Maximum file size: 10 MB
- Must be valid BPMN 2.0 XML format
### Step 3: Review Conformance Results
After uploading, the system immediately analyzes your data against the BPMN model and shows:
- **Summary boxes**: Count of conforming vs non-conforming variants
- **Variant list**: Each process variant with its fitness score and conformance status
- **Activity sequence**: Visual display of activities in each variant
### Step 4: Adjust Fitness Threshold (Optional)
Use the **Fitness Threshold** slider to adjust what counts as "conforming":
- **1.0 (100%)**: Only perfect matches are conforming
- **0.8 (80%)**: Cases with fitness 80% or higher are conforming (recommended)
- **0.5 (50%)**: More lenient - cases with moderate deviations still count as conforming
### Step 5: Save Configuration
Click **Save Configuration** to store the BPMN model. The conformance check will run automatically every time your data is refreshed.
## Output Attributes
When this enrichment runs, it adds **four new attributes** to each case in your event log:
### BPMN Conforming (Yes/No)
| Attribute | Details |
|-----------|---------|
| Column Name | `~enrich~BpmnConforming` |
| Display Name | BPMN Conforming |
| Data Type | Boolean (Yes/No) |
**What it means:**
- **Yes**: This case follows the BPMN model (fitness score meets or exceeds the threshold)
- **No**: This case deviates from the BPMN model

### BPMN Fitness Score (0% - 100%)
| Attribute | Details |
|-----------|---------|
| Column Name | `~enrich~BpmnFitness` |
| Display Name | BPMN Fitness Score |
| Data Type | Percentage |
**What it means:**
- **100%**: Perfect conformance - the case exactly follows the BPMN model
- **90-99%**: Minor deviations - the case mostly follows the model
- **70-89%**: Moderate deviations - some activities are missing or out of order
- **Below 70%**: Major deviations - significant differences from the expected flow

### BPMN Conformance Status (Text)
| Attribute | Details |
|-----------|---------|
| Column Name | `~enrich~BpmnConformanceStatus` |
| Display Name | BPMN Conformance Status |
| Data Type | Text |
**Possible values:**
| Fitness Score | Status |
|---------------|--------|
| 100% | Perfect |
| 90% - 99% | Minor Deviations |
| 70% - 89% | Moderate Deviations |
| Below 70% | Major Deviations |

### BPMN Deviations (Text)
| Attribute | Details |
|-----------|---------|
| Column Name | `~enrich~BpmnDeviations` |
| Display Name | BPMN Deviations |
| Data Type | Text |
**What it contains:**
- Lists the activity transitions that failed during token replay
- Shows up to 5 problematic transitions, separated by semicolons
- Empty if the case has perfect conformance
**Example values:**
- *(empty)* - No deviations
- `Submit for Approval` - One missing activity
- `Receive Goods; Invoice Match; Pay Invoice` - Multiple deviations

## Example Output
After running BPMN Conformance on an Order-to-Cash process, your case table might look like this:
| Case ID | BPMN Conforming | BPMN Fitness Score | BPMN Conformance Status | BPMN Deviations |
|---------|-----------------|-------------------|------------------------|-----------------|
| PO-001 | Yes | 100% | Perfect | |
| PO-002 | No | 65% | Major Deviations | Receive Goods; Invoice Match |
| PO-003 | Yes | 92% | Minor Deviations | Post Invoice |
| PO-004 | Yes | 100% | Perfect | |
| PO-005 | No | 45% | Major Deviations | Submit for Approval; Approve; Receive Goods |
## Using Conformance Results
Once the conformance attributes are added to your data, you can:
### Filter Cases
- Show only non-conforming cases: Filter where `BPMN Conforming = No`
- Find severe deviations: Filter where `BPMN Fitness Score < 70%`
### Create Dashboards
- Add a pie chart showing conforming vs non-conforming case counts
- Track conformance rate over time with a trend chart
- Compare conformance across different vendors, regions, or case types
### Analyze Root Causes
- Use the Deviations attribute to identify common problematic activities
- Compare conforming vs non-conforming cases by attribute values
- Identify patterns in which cases tend to deviate
### Set Up Alerts
- Create alerts when conformance rate drops below a threshold
- Notify stakeholders when specific cases fail conformance
## Understanding Token Replay
Token replay is a conformance checking algorithm that simulates executing each case through your BPMN model:
1. A "token" is placed at the start of the process
2. For each activity in the case, the algorithm tries to move the token through the corresponding transition in the BPMN model
3. If the transition can fire (the token is in the right place), it succeeds
4. If the transition cannot fire (the token is missing), it's recorded as a deviation
5. At the end, the algorithm checks if the token reached the final state
**Fitness is calculated as:**
```
Fitness = 1 - (missing tokens + remaining tokens) / (produced tokens + consumed tokens)
```
This gives a score from 0.0 (no conformance) to 1.0 (perfect conformance).
## See Also
**Related Features:**
- [Expected Order](/mindzie_studio/enrichments/expected-order) - Define the expected sequence of activities
- [Conformance Issue](/mindzie_studio/enrichments/conformance-issue) - Flag cases with conformance violations
**Related Topics:**
- [Process Variants](/mindzie_studio/process-discovery/process-variants) - Analyze different paths through your process
- [Process Map](/mindzie_studio/process-discovery/process-map) - Visualize your actual process flow
---
*This documentation is part of the mindzieStudio process mining platform.*
---
## Case Closed
Section: Enrichments
URL: https://docs.mindziestudio.com/mindzie_studio/enrichments/case-closed
Source: /docs-master/mindzieStudio/enrichments/case-closed/page.md
# Case Closed
## Overview
The enrichment creates a 'Case Closed' attribute whose value is 'True' if the case satisfies specified criteria. Conformance checking helps identify process deviations by validating that cases follow expected patterns. By controlling which criteria define a closed case, you can filter completed cases from active ones and focus your analysis on successfully completed workflows.
## Common Uses
Use the Case Closed enrichment to:
- **Reporting:** Exclude incomplete cases from cycle time calculations
- **Analysis:** Focus process mining on successfully completed workflows
- **Filtering:** Separate active cases from archived/closed cases in visualizations
- **Metrics:** Calculate completion rates and closure patterns
## Settings
**Filter:** Specify the criteria that identify a closed case by adding one or more filters.
Common filter types for Case Closed:
- **Cases with Attribute:** Filter by specific attribute values (e.g., Status = "Completed")
- **Cases with Activity:** Filter by presence of completion activities
- **Date-based filters:** Filter by closure date ranges
Multiple filters can be combined using AND/OR logic to create complex closure criteria.

## Examples
To define closed cases, let's add two 'Case Closed' enrichments, in each selecting 'Cases with Attribute' filter, and selecting different statuses of a case.
**First, let's select 'Cases with Attribute' and select cases which are already fully paid:**
After adding a filter, you will see it on this page. Click 'Update'.
In the settings, give the enrichment a descriptive title, specifying that this is 'Case Closed' enrichment for fully paid cases.
**Second, let's select cases that were cancelled (we also consider those as closed).**
Let's specify that this is 'Case Closed' enrichment for cancelled cases.
Once you're ready click 'Calculate Enrichment' to add the new attribute to your data set. In the overview, you will find one attribute 'Case Closed' which will combine the two enrichments we created above.


## Output
The Case Closed enrichment creates a new case-level attribute:
- **Attribute Name:** Case Closed
- **Values:** 'True' (case meets closure criteria) or 'False' (case does not meet criteria)
- **Data Type:** Boolean
Multiple Case Closed enrichments with different criteria are combined into a single attribute. A case is marked as 'True' if it satisfies ANY of the configured criteria.
The severity level you select determines how this conformance issue is categorized in conformance analysis dashboards and reports. Cases with closure status can be filtered and analyzed to understand process completion patterns.
## See Also
**Related Conformance Enrichments:**
- [Allowed Case End Activities](/mindzie_studio/enrichments/allowed-case-end-activities) - Define conformance issues for case end activities
- [Allowed Case Start Activities](/mindzie_studio/enrichments/allowed-case-start-activities) - Define conformance issues for case start activities
- [Repeated Activity](/mindzie_studio/enrichments/repeated-activity) - Detect when activities are repeated in a case
**Related Topics:**
- [Conformance Experiments](/mindzie_studio/enrichments/conformance-experiments) - Overview of conformance analysis in mindzieStudio
- [Attribute Enrichments](/mindzie_studio/enrichments/attribute-enrichments) - Understanding enrichments in general
---
*This documentation is part of the mindzie Studio process mining platform.*
---
## Case Duration Category For Activity
Section: Enrichments
URL: https://docs.mindziestudio.com/mindzie_studio/enrichments/case-duration-category-for-activity
Source: /docs-master/mindzieStudio/enrichments/case-duration-category-for-activity/page.md
# Case Duration Category for Activity
## Overview
The Case Duration Category for Activity enrichment analyzes the total time spent on a specific activity across all its occurrences within each case, then categorizes this duration into performance levels: Fast, Normal, Slow, or Extreme. This enrichment is particularly valuable for identifying cases where certain activities are consuming excessive time, enabling focused process improvement efforts.
Unlike simple duration calculations, this enrichment automatically determines optimal performance thresholds based on your actual data distribution using statistical percentiles. It sums up all durations for the selected activity within each case, providing a comprehensive view of how much time is being invested in that particular activity throughout the case lifecycle. This makes it ideal for analyzing activities that may occur multiple times within a case, such as approvals, reviews, or quality checks.
## Common Uses
- **Purchase Order Processing**: Categorize cases based on total approval time to identify orders stuck in lengthy approval cycles
- **Claims Processing**: Analyze total investigation time across multiple investigation activities to spot complex claims requiring excessive review
- **Manufacturing Quality Control**: Measure cumulative inspection time to identify products requiring repeated quality checks
- **Customer Service**: Track total customer interaction time across multiple support contacts to identify high-maintenance cases
- **Loan Applications**: Categorize applications by total underwriting time to streamline the approval process
- **Healthcare Patient Flow**: Analyze total diagnostic testing time to optimize patient pathways
- **Software Development**: Measure total code review time across multiple review cycles to improve development velocity
## Settings
**Activity Name:** Select the activity you want to analyze for performance categorization. The enrichment will sum up all occurrences of this activity within each case and categorize the total duration. This is required and must match an existing activity name in your event log exactly.
**Case Filter (Optional):** Apply filters to limit which cases are analyzed. You can filter by case attributes, time ranges, or other criteria. Only filtered cases will be used to calculate the performance thresholds, and only these cases will receive the new performance category attribute. Cases outside the filter will not be categorized.
**Fast Duration Threshold:** The maximum duration (in hours) for a case to be categorized as "Fast". If left at default (0), the system automatically calculates this as the 20th percentile of all case durations for the selected activity. For example, if set to 2 hours, any case with total activity duration up to 2 hours is considered Fast.
**Normal Duration Threshold:** The maximum duration (in hours) for a case to be categorized as "Normal". If left at default (0), the system automatically calculates this as the 80th percentile. Cases with durations between the Fast threshold and this value are considered Normal performance.
**Slow Duration Threshold:** The maximum duration (in hours) for a case to be categorized as "Slow". If left at default (0), the system automatically calculates this as the 90th percentile. Cases between the Normal and Slow thresholds are considered Slow, while anything beyond this threshold is categorized as "Extreme".
## Examples
### Example 1: Invoice Approval Performance
**Scenario:** A finance team wants to identify invoices that spend excessive time in approval processes, as these often indicate issues requiring manual intervention or complex validation.
**Settings:**
- Activity Name: "Approve Invoice"
- Case Filter: None (analyze all invoices)
- Fast Duration Threshold: 0 (auto-calculate)
- Normal Duration Threshold: 0 (auto-calculate)
- Slow Duration Threshold: 0 (auto-calculate)
**Output:**
The enrichment creates a new case attribute called "Approve Invoice - Case Performance" with values:
- Fast: Invoices with total approval time in the bottom 20% (e.g., under 2 hours)
- Normal: Invoices with typical approval times (e.g., 2-24 hours)
- Slow: Invoices taking longer than usual (e.g., 24-72 hours)
- Extreme: Invoices with exceptional delays (e.g., over 72 hours)
**Insights:** The finance team can now filter for "Extreme" cases to investigate why certain invoices require excessive approval time, potentially revealing missing documentation, disputed amounts, or process bottlenecks.
### Example 2: Patient Diagnostic Testing
**Scenario:** A hospital wants to categorize emergency department visits based on the total time spent in diagnostic testing (X-rays, CT scans, lab work) to improve patient flow and resource allocation.
**Settings:**
- Activity Name: "Perform Diagnostic Test"
- Case Filter: Department = "Emergency"
- Fast Duration Threshold: 1 (hour)
- Normal Duration Threshold: 3 (hours)
- Slow Duration Threshold: 5 (hours)
**Output:**
New attribute "Perform Diagnostic Test - Case Performance" categorizes each patient visit:
- Fast: Patients with minimal testing (under 1 hour total)
- Normal: Standard diagnostic workup (1-3 hours)
- Slow: Complex cases requiring extensive testing (3-5 hours)
- Extreme: Critical cases with prolonged diagnostics (over 5 hours)
**Insights:** The hospital identifies that "Extreme" cases often involve multiple specialists and could benefit from a dedicated complex case coordinator to reduce waiting times between tests.
### Example 3: Software Code Review Cycles
**Scenario:** A development team wants to understand which pull requests are consuming excessive review time across multiple review iterations, impacting deployment velocity.
**Settings:**
- Activity Name: "Code Review"
- Case Filter: Repository = "Core Platform"
- Fast Duration Threshold: 0 (auto-calculate)
- Normal Duration Threshold: 0 (auto-calculate)
- Slow Duration Threshold: 0 (auto-calculate)
**Output:**
Creates "Code Review - Case Performance" attribute with automatically calculated thresholds:
- Fast: PRs reviewed quickly (e.g., under 4 hours total across all reviews)
- Normal: Standard review time (e.g., 4-16 hours)
- Slow: PRs requiring extensive review (e.g., 16-24 hours)
- Extreme: PRs with exceptional review effort (e.g., over 24 hours)
**Insights:** Analysis reveals that "Extreme" cases typically involve architectural changes or lack proper documentation, leading the team to implement better PR templates and architectural review processes.
### Example 4: Manufacturing Quality Inspections
**Scenario:** A manufacturing plant needs to identify products requiring excessive quality inspection time, which often indicates production issues or design flaws.
**Settings:**
- Activity Name: "Quality Inspection"
- Case Filter: Product Line = "Premium Series"
- Fast Duration Threshold: 0.5 (30 minutes)
- Normal Duration Threshold: 2 (hours)
- Slow Duration Threshold: 4 (hours)
**Output:**
New attribute "Quality Inspection - Case Performance" with values:
- Fast: Products passing quickly (under 30 minutes total inspection)
- Normal: Standard inspection time (30 minutes - 2 hours)
- Slow: Products requiring detailed inspection (2-4 hours)
- Extreme: Products with major quality issues (over 4 hours)
**Insights:** Products in the "Extreme" category correlate strongly with specific production batches, revealing equipment calibration issues that can be proactively addressed.
## Output
This enrichment creates a new case attribute with the following characteristics:
**Attribute Name:** "[Activity Name] - Case Performance" (e.g., "Approve Invoice - Case Performance")
**Data Type:** String (categorical)
**Possible Values:**
- **Fast**: Total activity duration falls within the fastest performing cases (below Fast threshold)
- **Normal**: Total activity duration is within typical range (between Fast and Normal thresholds)
- **Slow**: Total activity duration is longer than normal (between Normal and Slow thresholds)
- **Extreme**: Total activity duration exceeds expected boundaries (above Slow threshold)
- **Negative**: Rare cases where calculated duration is negative (data quality issue)
- **Null**: Cases where the selected activity doesn't occur
**How Thresholds Work:**
When thresholds are set to 0 (default), the system automatically calculates them using:
- Fast Threshold: 20th percentile of all positive durations
- Normal Threshold: 80th percentile of all positive durations
- Slow Threshold: 90th percentile of all positive durations
This statistical approach ensures categories are meaningful for your specific process, automatically adapting to your data's natural distribution.
**Using the Output:**
The new performance category attribute can be used in:
- **Performance Dashboards**: Visualize the distribution of cases across performance categories
- **Root Cause Analysis**: Filter for "Extreme" cases to investigate process issues
- **Process Comparison**: Compare performance categories across different case attributes
- **Predictive Analytics**: Use as a feature for predicting case outcomes or delays
- **SLA Monitoring**: Track percentage of cases in each category against targets
## See Also
**Related Performance Enrichments:**
- [Performance Matrix](/mindzie_studio/calculators/performance-matrix) - Analyze overall process performance patterns
- [Duration Between Two Activities](/mindzie_studio/enrichments/duration-between-two-activities) - Calculate specific activity-to-activity durations
**Related Analysis Tools:**
- [Case Filters](/mindzie_studio/filters/case-filters) - Create sophisticated filters for case selection
- [Performance Dashboards](/mindzie_studio/dashboards/performance) - Visualize performance metrics
- [Statistical Analysis](/mindzie_studio/analysis/statistics) - Analyze duration distributions
---
*This documentation is part of the mindzie Studio process mining platform.*
---
## Categorize Attribute Values
Section: Enrichments
URL: https://docs.mindziestudio.com/mindzie_studio/enrichments/categorize-attribute-values
Source: /docs-master/mindzieStudio/enrichments/categorize-attribute-values/page.md
# Categorize Attribute Values
## Overview
The Categorize Attribute Values enrichment transforms numerical attributes into meaningful business categories by applying customizable range-based rules. This powerful enrichment enables you to convert continuous numerical data into discrete categories that are easier to analyze, filter, and understand in your process mining dashboards. Instead of dealing with raw numbers like invoice amounts ranging from $1 to $1,000,000, you can create intuitive categories such as "Small", "Medium", "Large", and "Enterprise" that immediately convey business significance.
This enrichment is particularly valuable for creating performance indicators, risk categories, and business classifications that align with your organizational standards. It supports both simple range definitions (greater than X) and complex range combinations (between X and Y), allowing you to define categories that precisely match your business rules. The resulting categorical attributes can be used in filters, charts, and conformance checks, making them essential for creating actionable process insights and enabling data-driven decision making across your organization.
## Common Uses
- Categorize invoice amounts into approval tiers (Under $1000, $1000-$5000, $5000-$25000, Over $25000)
- Classify processing times into SLA categories (On Time, At Risk, Overdue, Critical)
- Group customer order values into segments (Low Value, Standard, Premium, VIP)
- Define risk levels based on transaction amounts (Low Risk, Medium Risk, High Risk, Critical)
- Create age bands for outstanding payments (Current, 30 Days, 60 Days, 90+ Days)
- Segment inventory levels into stock categories (Out of Stock, Low Stock, Normal, Overstocked)
- Classify employee tenure into experience levels (New, Junior, Senior, Expert)
## Settings
**New Attribute Name:** The name for the new categorical attribute that will be created in your dataset. Choose a descriptive name that clearly indicates the categorization purpose, such as "Invoice_Category", "SLA_Status", or "Risk_Level". This attribute will contain the category names you define based on the value ranges.
**Attribute Name:** Select the numerical attribute you want to categorize. This must be a numeric field (integer or decimal) from your case attributes. Common choices include amounts, durations, counts, or any other numerical measure that would benefit from categorization.
**Category List:** Define your categories by creating rules that map numerical ranges to category names. Each category requires:
- **Category Range Name:** The text label that will appear when values fall within this range (e.g., "High Priority", "Standard", "Low Risk")
- **First Comparison Method:** Choose how to compare the attribute value (Equal, Greater Than, Greater Than or Equal, Less Than, Less Than or Equal, Not Equal)
- **First Value:** The numerical threshold for the first comparison
- **Second Comparison Method (Optional):** Add a second condition to create range boundaries (useful for "between" logic)
- **Second Value (Optional):** The threshold for the second comparison (only available when Second Comparison Method is selected)
Categories are evaluated in the order they appear in the list. You can drag and drop categories to reorder them. The first matching category will be applied to each case.
## Examples
### Example 1: Invoice Amount Approval Tiers
**Scenario:** A procurement department needs to route invoices to different approval workflows based on their total amount. Different approval levels are required for different value ranges.
**Settings:**
- New Attribute Name: Approval_Tier
- Attribute Name: Total_Invoice_Amount
- Category List:
- Category: "Auto-Approval" | Less Than or Equal: 500
- Category: "Manager Approval" | Greater Than: 500 | AND Less Than or Equal: 5000
- Category: "Director Approval" | Greater Than: 5000 | AND Less Than or Equal: 25000
- Category: "C-Level Approval" | Greater Than: 25000
**Output:**
Creates an "Approval_Tier" attribute where:
- Invoices up to $500 are marked as "Auto-Approval"
- Invoices from $501 to $5,000 are marked as "Manager Approval"
- Invoices from $5,001 to $25,000 are marked as "Director Approval"
- Invoices over $25,000 are marked as "C-Level Approval"
**Insights:** This categorization enables automatic routing of invoices to appropriate approvers, analysis of approval workload distribution, and identification of bottlenecks at specific approval levels.
### Example 2: SLA Performance Categories
**Scenario:** A customer service team needs to monitor case resolution times against their SLA commitments. Cases should be categorized based on how close they are to breaching the 48-hour SLA target.
**Settings:**
- New Attribute Name: SLA_Status
- Attribute Name: Hours_Since_Creation
- Category List:
- Category: "On Track" | Less Than or Equal: 24
- Category: "Warning" | Greater Than: 24 | AND Less Than or Equal: 40
- Category: "At Risk" | Greater Than: 40 | AND Less Than or Equal: 48
- Category: "Breached" | Greater Than: 48
**Output:**
Creates an "SLA_Status" attribute where:
- Cases under 24 hours are "On Track"
- Cases between 24-40 hours are "Warning"
- Cases between 40-48 hours are "At Risk"
- Cases over 48 hours are "Breached"
**Insights:** Enables proactive management of cases approaching SLA breach, prioritization of at-risk cases, and performance reporting on SLA compliance rates.
### Example 3: Customer Value Segmentation
**Scenario:** An e-commerce company wants to segment customers based on their total order value to provide differentiated service levels and marketing campaigns.
**Settings:**
- New Attribute Name: Customer_Segment
- Attribute Name: Total_Order_Value
- Category List:
- Category: "Bronze" | Less Than: 100
- Category: "Silver" | Greater Than or Equal: 100 | AND Less Than: 500
- Category: "Gold" | Greater Than or Equal: 500 | AND Less Than: 2000
- Category: "Platinum" | Greater Than or Equal: 2000
**Output:**
Creates a "Customer_Segment" attribute where customers are classified into Bronze, Silver, Gold, or Platinum tiers based on their total order value.
**Insights:** Facilitates targeted marketing campaigns, enables tiered customer service strategies, and helps identify opportunities for customer upgrades.
### Example 4: Inventory Stock Level Alerts
**Scenario:** A warehouse management system needs to categorize inventory levels to trigger appropriate restocking actions and prevent stockouts.
**Settings:**
- New Attribute Name: Stock_Alert_Level
- Attribute Name: Current_Stock_Quantity
- Category List:
- Category: "Out of Stock" | Equal: 0
- Category: "Critical" | Greater Than: 0 | AND Less Than or Equal: 10
- Category: "Low Stock" | Greater Than: 10 | AND Less Than or Equal: 50
- Category: "Normal" | Greater Than: 50 | AND Less Than or Equal: 200
- Category: "Overstocked" | Greater Than: 200
**Output:**
Creates a "Stock_Alert_Level" attribute that classifies inventory into five actionable categories from "Out of Stock" to "Overstocked".
**Insights:** Enables automated reorder point triggers, helps optimize inventory carrying costs, and provides clear visibility into stock situations requiring immediate attention.
### Example 5: Payment Aging Categories
**Scenario:** An accounts receivable department needs to categorize outstanding invoices by age to prioritize collection efforts and assess credit risk.
**Settings:**
- New Attribute Name: Payment_Age_Category
- Attribute Name: Days_Outstanding
- Category List:
- Category: "Current" | Less Than or Equal: 0
- Category: "1-30 Days" | Greater Than: 0 | AND Less Than or Equal: 30
- Category: "31-60 Days" | Greater Than: 30 | AND Less Than or Equal: 60
- Category: "61-90 Days" | Greater Than: 60 | AND Less Than or Equal: 90
- Category: "Over 90 Days" | Greater Than: 90
**Output:**
Creates a "Payment_Age_Category" attribute that groups outstanding payments into standard aging buckets used for accounts receivable reporting.
**Insights:** Supports collection prioritization, enables aging report generation, helps identify customers with payment issues, and facilitates bad debt provisioning calculations.
## Output
The enrichment creates a new case-level attribute with the name specified in "New Attribute Name". This attribute contains string values representing the category names defined in your category list. For each case:
- The numerical value from the source attribute is evaluated against each category rule in order
- The first matching category name is assigned to the new attribute
- If no categories match, the attribute remains empty (null) for that case
- The new categorical attribute can be used immediately in filters, charts, conformance checks, and other enrichments
The categorical attribute integrates seamlessly with mindzieStudio's visualization and analysis features, enabling you to create category-based process maps, filter cases by category, generate distribution charts, and build conformance rules based on your business categories.
## See Also
- [Duration Categorization](/mindzie_studio/enrichments/duration-categorization) - Specialized categorization for time-based attributes
- [Performance Categories](/mindzie_studio/enrichments/performance-categories) - Advanced performance classification based on multiple criteria
- [Group Attribute Values](/mindzie_studio/enrichments/group-attribute-values) - Text-based grouping and categorization
- [Representative Case Attribute](/mindzie_studio/enrichments/representative-case-attribute) - Extract and aggregate event attributes to case level
---
*This documentation is part of the mindzie Studio process mining platform.*
---
## Categorize Duration
Section: Enrichments
URL: https://docs.mindziestudio.com/mindzie_studio/enrichments/categorize-duration
Source: /docs-master/mindzieStudio/enrichments/categorize-duration/page.md
# Categorize Duration
## Overview
Categorize Duration is a performance categorization enrichment that transforms continuous duration values into discrete performance categories, enabling immediate visual identification of process bottlenecks and performance patterns. This enrichment takes any duration attribute in your event log and classifies each value into one of five performance categories: Fast, Normal, Slow, Extreme, or Negative. By converting numeric duration data into meaningful business categories, teams can quickly identify outliers, filter on performance criteria, and create performance-based visualizations without requiring complex mathematical filters.
This enrichment is essential for process mining analysis because it translates technical timing measurements into business-relevant performance indicators. Rather than analyzing raw duration numbers, users can immediately see which cases are performing well, which need attention, and which represent extreme outliers requiring immediate investigation. The categorization uses intelligent statistical defaults based on percentile analysis of your actual data, ensuring that categories reflect real performance distribution patterns in your processes.
The enrichment works with any duration attribute, whether it measures case-level throughput times, activity-level processing times, or custom duration calculations. This flexibility makes it a fundamental tool for performance analysis across all process mining scenarios, from order-to-cash cycle time analysis to manufacturing lead time categorization and service request handling time assessment.
## Common Uses
- Label order fulfillment cases as fast, normal, or slow based on total cycle time to prioritize shipping operations and identify delayed orders requiring expedited handling
- Categorize invoice approval durations to identify exceptional approval times that may indicate missing documentation, escalation requirements, or bottlenecks in the approval workflow
- Classify manufacturing production times by performance category to separate standard production runs from delayed batches requiring root cause analysis and corrective action
- Segment customer service ticket resolution times into performance categories for SLA monitoring, enabling quick identification of tickets at risk of SLA breach
- Analyze procurement cycle times by categorizing purchase order processing durations to identify both efficient procurement cycles and problematic delays requiring vendor follow-up
- Create performance-based process variants by categorizing activity durations, enabling comparison between fast-path and slow-path executions to understand what drives performance differences
- Monitor healthcare patient wait times by categorizing durations between appointment scheduling and treatment to identify capacity issues and optimize resource allocation
## Settings
**Attribute Name:** Select the duration attribute you want to categorize. This must be a TimeSpan attribute in your dataset, such as case duration, time between activities, or any custom duration calculation. The enrichment will analyze this attribute and assign performance categories to each case or event based on the duration values. Common selections include Case Duration for overall case performance analysis, or specific activity pair durations for targeted bottleneck identification.
**New Attribute Name:** Specify the name for the new categorical attribute that will be created. The default format is "[Attribute Name] - Category", which clearly indicates the source duration and the categorical nature of the new attribute. This new attribute will contain text values (Fast, Normal, Slow, Extreme, or Negative) and can be used in filters, color coding, and dashboard visualizations. Choose a descriptive name that makes the performance categorization immediately recognizable in your analysis.
**Fast Duration:** Define the upper threshold for the "Fast" performance category. Any duration less than or equal to this value will be labeled as "Fast". You can specify the threshold value and select the time unit (Days, Hours, Minutes, or Seconds). When you first select an attribute, this threshold is automatically calculated as the 20th percentile of all duration values in your dataset, representing the fastest 20% of cases or events. Adjust this threshold based on your business requirements and performance targets.
**Normal Duration:** Define the upper threshold for the "Normal" performance category. Durations greater than the Fast threshold but less than or equal to this value will be labeled as "Normal". This represents typical, expected performance in your process. The default is automatically calculated as the 80th percentile of your data, meaning 80% of cases fall within the Fast and Normal categories combined. This threshold should align with your standard operating procedures and expected service levels.
**Slow Duration:** Define the upper threshold for the "Slow" performance category. Durations greater than the Normal threshold but less than or equal to this value will be labeled as "Slow". These cases require attention but may not yet be critical outliers. The default is automatically calculated as the 90th percentile, identifying the slowest 10% of cases for investigation. Slow cases often indicate process inefficiencies, resource constraints, or minor complications that add delay without being exceptional.
**Extreme Category:** Any duration greater than the Slow Duration threshold is automatically categorized as "Extreme". This category represents exceptional outliers that require immediate investigation. Extreme cases often indicate process failures, system errors, extended waiting periods, or unusual circumstances. No threshold setting is required as this category captures all durations beyond the Slow threshold, typically representing less than 10% of cases but often accounting for significant process variation.
**Negative Category:** Any duration with a negative value is automatically categorized as "Negative". Negative durations typically indicate data quality issues, timestamp errors, or cases where activities occurred out of expected sequence. This category helps identify data anomalies that may require data cleanup or process investigation. No threshold setting is required as this category is automatically applied to all negative duration values.
**Reset Button:** Click this button to recalculate the Fast, Normal, and Slow duration thresholds based on the current dataset using the default percentile method (20th, 80th, and 90th percentiles). This is useful when you've manually adjusted thresholds and want to return to statistically derived defaults, or when analyzing a new dataset with different performance characteristics. The reset function ensures thresholds always reflect the actual distribution of your data.
## Examples
### Example 1: Order Fulfillment Performance Classification
**Scenario:** An e-commerce company wants to categorize order fulfillment performance to identify slow orders requiring expedited shipping and fast orders that can serve as best practice examples. They have calculated case duration representing time from order placement to shipment completion and need to classify 10,000 daily orders into performance categories for operational dashboards and automated alerting.
**Settings:**
- Attribute Name: Case Duration
- New Attribute Name: Fulfillment Performance
- Fast Duration: 4 Hours
- Normal Duration: 12 Hours
- Slow Duration: 24 Hours
**Output:**
The enrichment creates a new case attribute named "Fulfillment Performance" with text values:
- "Fast" for orders completed within 4 hours (approximately 2,000 orders per day representing same-day processing)
- "Normal" for orders completed between 4 and 12 hours (approximately 7,000 orders representing standard overnight processing)
- "Slow" for orders completed between 12 and 24 hours (approximately 800 orders requiring attention)
- "Extreme" for orders taking more than 24 hours (approximately 200 orders requiring immediate investigation)
- "Negative" for any orders with timestamp errors (rare data quality issues)
Sample data:
| Order ID | Case Duration | Fulfillment Performance |
|----------|--------------|------------------------|
| ORD-10234 | 2h 15m | Fast |
| ORD-10235 | 8h 30m | Normal |
| ORD-10236 | 18h 45m | Slow |
| ORD-10237 | 36h 20m | Extreme |
| ORD-10238 | 3h 50m | Fast |
**Insights:** The categorization reveals that 80% of orders meet expected performance targets (Fast and Normal), while 10% are slow and need attention. The 2% of Extreme cases can be immediately filtered for root cause analysis, often revealing inventory issues, shipping carrier delays, or address verification problems. Fast orders can be analyzed to identify success patterns such as specific product types, warehouse locations, or order characteristics that enable rapid fulfillment.
### Example 2: Invoice Approval Cycle Time Analysis
**Scenario:** A finance department processes 5,000 invoices monthly and wants to understand approval performance. They have calculated the duration between invoice receipt and final approval, with concerns that slow approvals cause late payment penalties and vendor relationship issues. The team needs to categorize approval times to create performance-based filters and identify exceptional delays requiring escalation.
**Settings:**
- Attribute Name: Approval Duration
- New Attribute Name: Approval Performance Category
- Fast Duration: 2 Days
- Normal Duration: 5 Days
- Slow Duration: 10 Days
**Output:**
A new case attribute "Approval Performance Category" is created with performance classifications:
- "Fast" for invoices approved within 2 business days (approximately 1,000 invoices representing pre-approved vendors or low-value purchases)
- "Normal" for invoices approved within 5 business days (approximately 3,500 invoices meeting payment terms)
- "Slow" for invoices requiring 5-10 days (approximately 400 invoices approaching payment deadlines)
- "Extreme" for invoices taking more than 10 days (approximately 100 invoices at risk of late payment penalties)
Sample data:
| Invoice ID | Amount | Approval Duration | Approval Performance Category |
|-----------|--------|------------------|------------------------------|
| INV-45001 | $1,250 | 1d 8h | Fast |
| INV-45002 | $45,000 | 4d 12h | Normal |
| INV-45003 | $8,500 | 7d 18h | Slow |
| INV-45004 | $125,000 | 15d 6h | Extreme |
| INV-45005 | $950 | 1d 2h | Fast |
**Insights:** The categorization enables the finance team to create performance dashboards showing real-time approval status distribution. Extreme cases are automatically escalated to senior management for investigation, often revealing missing purchase orders, multi-department approval requirements, or disputed invoice amounts. Analysis of Fast cases reveals that vendor master data quality and pre-approved vendor status are key drivers of rapid approval, leading to a vendor onboarding improvement initiative.
### Example 3: Manufacturing Production Batch Timing
**Scenario:** A pharmaceutical manufacturing facility produces batches of medication with strict quality control requirements. Production planners need to categorize batch production times to identify both efficiency wins and problematic delays. With 200 batches per month, they want to classify production duration from batch start to final quality approval to optimize production scheduling and capacity planning.
**Settings:**
- Attribute Name: Batch Production Time
- New Attribute Name: Production Performance
- Fast Duration: 18 Hours
- Normal Duration: 26 Hours
- Slow Duration: 36 Hours
**Output:**
The enrichment creates "Production Performance" with categories applied to each batch:
- "Fast" for batches completed within 18 hours (approximately 40 batches representing optimal conditions)
- "Normal" for batches completed in 18-26 hours (approximately 140 batches meeting production targets)
- "Slow" for batches requiring 26-36 hours (approximately 15 batches with minor delays)
- "Extreme" for batches exceeding 36 hours (approximately 5 batches with significant issues)
Sample data:
| Batch ID | Product Code | Batch Production Time | Production Performance |
|----------|-------------|----------------------|----------------------|
| B-2024-0456 | MED-XR-500 | 16h 45m | Fast |
| B-2024-0457 | MED-AB-250 | 24h 30m | Normal |
| B-2024-0458 | MED-XR-500 | 32h 15m | Slow |
| B-2024-0459 | MED-CD-100 | 48h 20m | Extreme |
| B-2024-0460 | MED-AB-250 | 22h 10m | Normal |
**Insights:** The production performance categories reveal that 90% of batches meet expected timelines, providing confidence in capacity planning. Slow and Extreme batches undergo detailed root cause analysis, identifying equipment maintenance issues, raw material quality variations, and environmental control problems as primary delay factors. Fast batches are studied to understand optimal production conditions, leading to improved standard operating procedures and reduced average production time by 8%.
### Example 4: Customer Service Ticket Resolution Time
**Scenario:** A software company's support team handles 8,000 support tickets monthly with various SLA commitments based on customer tier. Support management wants to categorize ticket resolution times to monitor SLA performance, identify tickets at risk of breach, and analyze resolution efficiency patterns. They need performance categories that align with their 48-hour standard SLA target.
**Settings:**
- Attribute Name: Resolution Time
- New Attribute Name: Resolution Performance
- Fast Duration: 12 Hours
- Normal Duration: 36 Hours
- Slow Duration: 72 Hours
**Output:**
A new "Resolution Performance" attribute classifies each ticket:
- "Fast" for tickets resolved within 12 hours (approximately 3,200 tickets representing excellent service)
- "Normal" for tickets resolved within 36 hours (approximately 4,000 tickets meeting SLA)
- "Slow" for tickets requiring 36-72 hours (approximately 600 tickets approaching SLA limit)
- "Extreme" for tickets exceeding 72 hours (approximately 200 tickets representing SLA failures)
Sample data:
| Ticket ID | Priority | Resolution Time | Resolution Performance |
|-----------|---------|----------------|----------------------|
| TKT-89234 | High | 4h 25m | Fast |
| TKT-89235 | Medium | 28h 15m | Normal |
| TKT-89236 | Low | 52h 40m | Slow |
| TKT-89237 | High | 96h 30m | Extreme |
| TKT-89238 | Medium | 8h 10m | Fast |
**Insights:** Performance categorization enables automated alerting when tickets enter the Slow category, allowing proactive escalation before SLA breach. Analysis reveals that Fast resolution is strongly correlated with clear problem descriptions and availability of diagnostic information, leading to improved ticket submission templates. Extreme cases are reviewed weekly, identifying knowledge gaps and training opportunities for support engineers, resulting in a 15% improvement in average resolution time over six months.
### Example 5: Healthcare Patient Wait Time Monitoring
**Scenario:** A hospital emergency department treats 500 patients daily and needs to monitor wait times between patient registration and initial physician assessment. Department leadership wants to categorize wait times to ensure compliance with quality standards, optimize staffing levels, and identify capacity bottlenecks during peak hours. Performance categories will drive real-time dashboards and historical trend analysis.
**Settings:**
- Attribute Name: Registration to Assessment Duration
- New Attribute Name: Wait Time Category
- Fast Duration: 15 Minutes
- Normal Duration: 45 Minutes
- Slow Duration: 90 Minutes
**Output:**
The enrichment creates "Wait Time Category" for each patient visit:
- "Fast" for patients assessed within 15 minutes (approximately 150 patients with immediate triage)
- "Normal" for patients assessed within 45 minutes (approximately 280 patients meeting standards)
- "Slow" for patients waiting 45-90 minutes (approximately 60 patients experiencing delays)
- "Extreme" for patients waiting over 90 minutes (approximately 10 patients with unacceptable delays)
Sample data:
| Visit ID | Triage Level | Registration to Assessment Duration | Wait Time Category |
|----------|-------------|-----------------------------------|-------------------|
| ED-20240615-001 | Critical | 3m 15s | Fast |
| ED-20240615-002 | Urgent | 28m 45s | Normal |
| ED-20240615-003 | Standard | 62m 20s | Slow |
| ED-20240615-004 | Standard | 125m 10s | Extreme |
| ED-20240615-005 | Urgent | 12m 30s | Fast |
**Insights:** Real-time performance monitoring reveals that 86% of patients receive assessment within acceptable timeframes, but Slow and Extreme cases cluster during evening shift changes and weekend peak hours. This leads to adjusted staffing models with overlapping shift coverage during high-risk periods. Analysis of Fast assessments identifies efficient triage protocols and optimal physician-to-patient ratios, which are implemented as department-wide standards, reducing average wait times by 22%.
## Output
The Categorize Duration enrichment creates a single new attribute in your dataset with a text data type containing performance category labels. This attribute appears as a case attribute if you selected a case-level duration attribute, or as an event attribute if you selected an event-level duration attribute. The new attribute is automatically categorized under the Performance attribute type in mindzieStudio, ensuring it appears in performance-related visualizations and analysis tools.
The output attribute contains one of five possible text values for each case or event:
- **Fast:** Duration is less than or equal to the Fast Duration threshold. Represents best-in-class performance, often suitable as benchmark examples for process improvement initiatives. Fast cases typically represent 15-25% of your dataset when using default percentile settings.
- **Normal:** Duration is greater than the Fast Duration threshold but less than or equal to the Normal Duration threshold. Represents typical, expected performance that meets business standards and service level agreements. Normal cases typically represent 55-65% of your dataset, forming the core of your standard process execution.
- **Slow:** Duration is greater than the Normal Duration threshold but less than or equal to the Slow Duration threshold. Represents below-average performance requiring attention, investigation, or process improvement. Slow cases typically represent 8-12% of your dataset and often indicate minor bottlenecks or inefficiencies.
- **Extreme:** Duration is greater than the Slow Duration threshold. Represents exceptional outliers requiring immediate investigation and potentially representing process failures, system errors, or unusual circumstances. Extreme cases typically represent 2-10% of your dataset but often account for significant process variation and customer dissatisfaction.
- **Negative:** Duration has a negative value, indicating data quality issues such as timestamp errors, out-of-sequence events, or data extraction problems. Negative cases should trigger data validation and cleanup processes. These cases are rare in well-maintained event logs but provide important data quality indicators.
The categorical attribute can be used throughout mindzieStudio for:
- **Filtering:** Create filters to isolate specific performance categories, such as showing only Extreme cases for detailed investigation or excluding Slow cases from benchmark analysis.
- **Color Coding:** Apply color-based visualizations in process maps, dashboards, and charts where Fast appears green, Normal appears blue, Slow appears yellow, and Extreme appears red, providing immediate visual performance identification.
- **Variant Analysis:** Segment process variants by performance category to understand how case paths differ between fast and slow executions, identifying bottleneck activities and inefficient routing patterns.
- **Dashboard Metrics:** Display performance distribution showing percentage of cases in each category, trend analysis showing category changes over time, and real-time monitoring of cases entering Slow or Extreme categories.
- **Drill-Down Analysis:** Use performance categories as entry points for detailed case analysis, enabling quick navigation from high-level performance summaries to specific case details requiring investigation.
- **Automated Alerting:** Configure alerts when cases enter specific performance categories, such as notifications when Extreme cases exceed threshold counts or when Slow case percentages increase beyond acceptable limits.
- **Comparative Analysis:** Compare performance categories across process dimensions such as organizational units, product types, customer segments, or time periods to identify performance patterns and improvement opportunities.
The categorical nature of the output makes it significantly more user-friendly than working with raw duration numbers, enabling business users to quickly understand process performance without requiring technical expertise in duration calculations or statistical analysis. The attribute integrates seamlessly with all mindzieStudio calculators, enrichments, and visualization components.
---
*This documentation is part of the mindzie Studio process mining platform.*
---
## Categorize Duration For Activity
Section: Enrichments
URL: https://docs.mindziestudio.com/mindzie_studio/enrichments/categorize-duration-for-activity
Source: /docs-master/mindzieStudio/enrichments/categorize-duration-for-activity/page.md
# Categorize Duration for Activity
## Overview
The Categorize Duration for Activity enrichment transforms activity durations into performance categories that provide immediate insights into process efficiency. This enrichment analyzes how long each instance of a selected activity takes to complete and automatically assigns performance labels such as "Fast", "Normal", "Slow", or "Extreme" based on statistical thresholds. Instead of working with raw duration values that can be difficult to interpret at scale, you get clear performance indicators that instantly highlight which activities are meeting expectations and which require attention.
This enrichment is particularly powerful for performance monitoring and optimization initiatives. It uses intelligent percentile-based calculations to automatically determine appropriate thresholds based on your actual data distribution, ensuring that categories reflect the real performance patterns in your process. The enrichment handles edge cases such as negative durations (which can occur when timestamps are incorrect) by categorizing them separately, and it creates a new event attribute that can be used in performance dashboards, filters, and detailed process analysis to identify bottlenecks and improvement opportunities.
## Common Uses
- Monitor approval activity performance to identify which approvals are taking longer than expected
- Track manufacturing step durations to ensure production processes meet cycle time targets
- Analyze customer service response times to identify agents or cases needing performance improvement
- Measure payment processing speeds to detect delays in financial workflows
- Evaluate medical procedure durations to optimize hospital resource allocation
- Monitor order fulfillment activities to identify warehouse or shipping bottlenecks
- Assess document review times in compliance processes to prevent regulatory delays
## Settings
**Activity Name:** Select the specific activity whose duration you want to categorize. This dropdown lists all activities present in your event log. The enrichment will analyze the duration of each occurrence of this activity (the time between its start and end timestamps) and assign a performance category to each instance.
**Fast Duration Threshold:** The maximum duration (in hours, minutes, and seconds) that will be categorized as "Fast" performance. Any activity instance completing in this time or less will be labeled as "Fast". If left at the default value of 00:00:00, the system will automatically calculate this threshold using the 20th percentile of all positive durations for the selected activity.
**Normal Duration Threshold:** The maximum duration that will be categorized as "Normal" performance. Activity instances with durations greater than the Fast threshold but less than or equal to this value will be labeled as "Normal". If left at 00:00:00, the system automatically uses the 80th percentile of durations.
**Slow Duration Threshold:** The maximum duration that will be categorized as "Slow" performance. Activity instances exceeding the Normal threshold but within this limit will be labeled as "Slow". If left at 00:00:00, the system automatically uses the 90th percentile. Any duration exceeding this threshold will be categorized as "Extreme".
**Filter:** Optional filter to apply before calculating categories. This allows you to focus the categorization on specific subsets of your data, such as particular time periods, regions, or case types. The filter affects both the automatic threshold calculation and which events receive category labels.
## Examples
### Example 1: Purchase Order Approval Performance
**Scenario:** A procurement team needs to monitor the performance of their purchase order approval process. They want to identify which approvals are being processed efficiently and which are experiencing delays.
**Settings:**
- Activity Name: "Approve Purchase Order"
- Fast Duration Threshold: 00:00:00 (auto-calculate)
- Normal Duration Threshold: 00:00:00 (auto-calculate)
- Slow Duration Threshold: 00:00:00 (auto-calculate)
- Filter: None
**Output:**
Creates an event attribute called "Approve Purchase Order - Performance" with values:
- "Fast" for approvals completed in under 2 hours (20th percentile)
- "Normal" for approvals taking 2-8 hours (20th to 80th percentile)
- "Slow" for approvals taking 8-24 hours (80th to 90th percentile)
- "Extreme" for approvals exceeding 24 hours (above 90th percentile)
- "Negative" for any data quality issues with negative durations
**Insights:** The procurement team can now easily identify that 20% of approvals are processed very quickly, while 10% are taking an extremely long time. They can drill down into the "Extreme" cases to understand what causes these delays and implement targeted improvements.
### Example 2: Patient Triage Classification
**Scenario:** A hospital emergency department wants to categorize triage assessment times to ensure patients are being evaluated within appropriate timeframes based on medical best practices.
**Settings:**
- Activity Name: "Triage Assessment"
- Fast Duration Threshold: 00:05:00 (5 minutes)
- Normal Duration Threshold: 00:10:00 (10 minutes)
- Slow Duration Threshold: 00:15:00 (15 minutes)
- Filter: Emergency_Department = "Main ED"
**Output:**
Creates "Triage Assessment - Performance" attribute where:
- Assessments under 5 minutes are "Fast"
- Assessments from 5-10 minutes are "Normal"
- Assessments from 10-15 minutes are "Slow"
- Assessments over 15 minutes are "Extreme"
**Insights:** Hospital administrators can monitor compliance with triage time targets, identify peak periods where assessments slow down, and ensure critical patients receive timely evaluation.
### Example 3: Manufacturing Quality Inspection
**Scenario:** A manufacturing plant needs to monitor quality inspection durations across different production lines to maintain consistent throughput while ensuring thorough inspections.
**Settings:**
- Activity Name: "Quality Inspection"
- Fast Duration Threshold: 00:00:00 (auto-calculate)
- Normal Duration Threshold: 00:00:00 (auto-calculate)
- Slow Duration Threshold: 00:00:00 (auto-calculate)
- Filter: Product_Category = "Electronics"
**Output:**
The enrichment analyzes only electronics inspections and creates performance categories:
- "Fast" for inspections under 12 minutes
- "Normal" for inspections from 12-35 minutes
- "Slow" for inspections from 35-45 minutes
- "Extreme" for inspections over 45 minutes
**Insights:** Production managers can balance inspection thoroughness with production speed, identify inspectors who may need additional training, and detect potential quality issues when inspection times are consistently extreme.
### Example 4: Loan Application Processing
**Scenario:** A bank wants to categorize loan application processing times to meet service level agreements and improve customer satisfaction.
**Settings:**
- Activity Name: "Process Loan Application"
- Fast Duration Threshold: 24:00:00 (1 day)
- Normal Duration Threshold: 72:00:00 (3 days)
- Slow Duration Threshold: 120:00:00 (5 days)
- Filter: Loan_Type = "Personal Loan"
**Output:**
Creates performance categories for personal loan processing:
- Applications processed within 1 day are "Fast"
- Applications taking 1-3 days are "Normal"
- Applications taking 3-5 days are "Slow"
- Applications exceeding 5 days are "Extreme"
**Insights:** The bank can track SLA compliance, identify process improvements for slow applications, and potentially offer expedited processing as a premium service for "Fast" category achievements.
### Example 5: Customer Support Ticket Resolution
**Scenario:** A software company wants to analyze the performance of their technical support team's ticket resolution activities across different priority levels.
**Settings:**
- Activity Name: "Resolve Technical Issue"
- Fast Duration Threshold: 00:00:00 (auto-calculate)
- Normal Duration Threshold: 00:00:00 (auto-calculate)
- Slow Duration Threshold: 00:00:00 (auto-calculate)
- Filter: Priority = "High"
**Output:**
For high-priority tickets, the enrichment creates categories:
- "Fast" for resolutions under 30 minutes (top 20% performers)
- "Normal" for resolutions from 30 minutes to 2 hours
- "Slow" for resolutions from 2-4 hours
- "Extreme" for resolutions exceeding 4 hours
**Insights:** Support managers can identify which high-priority issues are resolved quickly, recognize top-performing agents, and investigate extreme cases to improve training and documentation.
## Output
When executed, this enrichment creates a new event attribute named "[Activity Name] - Performance" that contains performance category values for each occurrence of the selected activity. The attribute characteristics include:
- **Attribute Type**: Event attribute (attached to individual activity instances)
- **Data Type**: String (text)
- **Possible Values**:
- "Fast" - Duration is at or below the Fast threshold
- "Normal" - Duration exceeds Fast but is at or below Normal threshold
- "Slow" - Duration exceeds Normal but is at or below Slow threshold
- "Extreme" - Duration exceeds the Slow threshold
- "Negative" - Duration is less than zero (indicates data quality issues)
- Null - Activity has no duration information available
The performance attribute integrates seamlessly with other mindzieStudio features:
- Use in performance dashboards to visualize activity efficiency distribution
- Apply filters to focus on extreme or slow activities for process improvement
- Combine with conformance checking to correlate performance with process violations
- Export to business intelligence tools for detailed performance analytics
- Use in calculators to compute average performance across different dimensions
## See Also
- **Duration Between Two Activities** - Calculate time between different activities instead of categorizing single activity performance
- **Categorize Attribute Values** - Create custom categories for any numerical attribute beyond just durations
- **Durations Between Case Attribute and Activity Times** - Measure time from case start to specific activities
- **Performance Filter Category** - Apply performance categorization across multiple attributes simultaneously
---
*This documentation is part of the mindzie Studio process mining platform.*
---
## Categorize Duration For Selected Cases
Section: Enrichments
URL: https://docs.mindziestudio.com/mindzie_studio/enrichments/categorize-duration-for-selected-cases
Source: /docs-master/mindzieStudio/enrichments/categorize-duration-for-selected-cases/page.md
# Categorize Duration for Selected Cases
## Overview
The Categorize Duration for Selected Cases enrichment transforms continuous duration measurements into actionable performance categories for specific subsets of your cases. This powerful tool enables you to classify case durations or any TimeSpan attribute into five distinct performance bands: Fast, Normal, Slow, Extreme, and Negative. What sets this enrichment apart is its ability to apply categorization selectively to filtered case populations, making it ideal for comparative performance analysis across different vendors, customers, regions, or any other business dimension.
This enrichment uses intelligent statistical analysis to automatically calculate category boundaries based on percentile distributions (20th, 80th, and 90th percentiles) of the filtered data, or you can define custom thresholds that align with your business service level agreements. The result is a new text attribute that enables instant performance segmentation in visualizations, filters, and downstream analysis workflows.
By combining duration categorization with case filtering, you can answer critical business questions like "How do invoice processing times for our top vendors compare to smaller suppliers?" or "Are high-value orders processed faster than standard orders?" This enrichment is essential for performance benchmarking, SLA compliance tracking, and identifying process bottlenecks across different business segments.
## Common Uses
- Categorize purchase order approval durations for specific vendors to identify which suppliers experience delays
- Classify invoice payment cycle times for high-value customers versus standard customers to ensure priority processing
- Segment claim resolution times for specific insurance products to identify underperforming claim types
- Analyze loan application processing durations for different risk categories to optimize approval workflows
- Compare order fulfillment lead times across different distribution centers or geographic regions
- Evaluate patient treatment durations for specific medical conditions to establish performance benchmarks
- Track manufacturing cycle times for different product families to identify production bottlenecks
## Settings
**Filters:** Define which cases should be included in the categorization. Use filters to select specific subsets of your event log, such as particular vendors, customers, products, regions, or any other case attribute. The categorization and statistical calculations will apply only to cases matching these filter criteria. When filters are specified, the default duration thresholds (Fast, Normal, Slow) are automatically calculated based only on the filtered case population. This allows you to create performance categories tailored to specific business segments. If no filters are applied, all cases in the dataset will be categorized.
**Attribute Name:** Select the duration attribute you want to categorize. This must be a TimeSpan type attribute, such as "Case Duration," "Duration Between Two Activities," or any other enrichment that produces duration values. The dropdown menu displays only valid TimeSpan attributes from your event log. Common choices include overall case duration, time between specific milestones, or activity-level duration measurements.
**New Attribute Name:** Specify the name for the new performance category attribute that will be created. By default, this is set to "[Attribute Name] - Category" (e.g., "Case Duration - Category"). This new text attribute will contain one of five values: "Fast," "Normal," "Slow," "Extreme," or "Negative." Choose a descriptive name that clearly indicates what is being categorized and for which population. The new attribute can be used immediately in filters, charts, and other enrichments.
**Fast Duration:** Set the upper threshold for the "Fast" performance category. Cases with durations less than or equal to this value will be classified as "Fast." When you select an attribute and optionally apply filters, this value is automatically set to the 20th percentile of the filtered duration distribution, meaning 20% of cases fall into the Fast category. You can override this with a custom value that aligns with your business SLA or performance targets. The value is specified in the selected Duration Unit.
**Normal Duration:** Set the upper threshold for the "Normal" performance category. Cases with durations greater than Fast but less than or equal to this value will be classified as "Normal." The default is automatically set to the 80th percentile of the filtered duration distribution, meaning 60% of cases (between the 20th and 80th percentiles) fall into the Normal category. Adjust this threshold to match your organization's definition of acceptable performance. The value is specified in the selected Duration Unit.
**Slow Duration:** Set the upper threshold for the "Slow" performance category. Cases with durations greater than Normal but less than or equal to this value will be classified as "Slow." The default is automatically set to the 90th percentile of the filtered duration distribution, meaning 10% of cases (between the 80th and 90th percentiles) fall into the Slow category. Cases exceeding this threshold are classified as "Extreme." This setting helps you identify performance outliers that may require attention. The value is specified in the selected Duration Unit.
**Duration Unit:** Select the time unit for specifying the Fast, Normal, and Slow duration thresholds. Available options are Days, Hours, Minutes, and Seconds. The default is Days. When you change the unit, the displayed threshold values automatically convert to the new unit while preserving the underlying TimeSpan values. Choose the unit that makes the most sense for your process timeframes - use Days for long-running processes like procurement or loan origination, Hours for order fulfillment, and Minutes or Seconds for operational processes.
**Reset Button:** Click this button to recalculate the default duration thresholds based on the current filtered case population. This is useful when you've manually adjusted the thresholds but want to return to the statistically-derived defaults (20th, 80th, and 90th percentiles). The reset operation uses only the cases matching your current filter criteria, ensuring the defaults are relevant to the selected population.
## Examples
### Example 1: Purchase Order Approval Performance by Vendor Tier
**Scenario:** A procurement team wants to analyze purchase order approval times specifically for their top-tier strategic vendors (those with annual spend over $1 million). They need to categorize approval durations to identify which strategic vendors experience exceptional, normal, or problematic processing times, enabling them to prioritize vendor relationship improvements.
**Settings:**
- **Filters:** Vendor Tier = "Strategic" (cases where annual vendor spend > $1,000,000)
- **Attribute Name:** PO Approval Duration
- **New Attribute Name:** Strategic Vendor PO Performance
- **Fast Duration:** 2.5 (Days)
- **Normal Duration:** 5.0 (Days)
- **Slow Duration:** 7.0 (Days)
- **Duration Unit:** Days
**Output:**
The enrichment creates a new case attribute called "Strategic Vendor PO Performance" with the following values:
| Case ID | Vendor | PO Approval Duration | Strategic Vendor PO Performance |
|---------|--------|---------------------|--------------------------------|
| PO-1001 | Acme Industrial | 1.8 days | Fast |
| PO-1002 | Global Supplies | 4.2 days | Normal |
| PO-1003 | Premier Materials | 6.5 days | Slow |
| PO-1004 | Mega Corp | 9.2 days | Extreme |
| PO-1005 | FastTrack Vendors | 3.8 days | Normal |
The categorization applies only to strategic vendors. Cases for non-strategic vendors are not categorized (the new attribute remains empty for those cases). The thresholds were automatically calculated based on the duration distribution of strategic vendor POs: 20% of strategic vendor POs are approved within 2.5 days (Fast), 80% within 5 days (Normal threshold), and 90% within 7 days (Slow threshold).
**Insights:** The procurement team discovers that 12% of strategic vendor POs fall into the Extreme category (over 7 days), primarily concentrated with three specific vendors. This triggers a root cause analysis revealing that these vendors use non-standard requisition forms. By addressing this issue and standardizing the intake process, the team reduces extreme-duration POs by 75% within three months.
### Example 2: High-Value Invoice Payment Prioritization
**Scenario:** An accounts payable department must ensure that invoices over $50,000 are paid faster than standard invoices to maintain critical vendor relationships. They want to categorize payment cycle times specifically for high-value invoices to monitor compliance with their internal SLA of 10-day payment for large invoices.
**Settings:**
- **Filters:** Invoice Amount > 50000
- **Attribute Name:** Invoice to Payment Duration
- **New Attribute Name:** High-Value Payment Performance
- **Fast Duration:** 5 (Days)
- **Normal Duration:** 10 (Days)
- **Slow Duration:** 15 (Days)
- **Duration Unit:** Days
**Output:**
The enrichment creates a new case attribute called "High-Value Payment Performance" for high-value invoices:
| Case ID | Invoice Amount | Invoice to Payment Duration | High-Value Payment Performance |
|---------|---------------|----------------------------|-------------------------------|
| INV-5001 | $125,000 | 4.2 days | Fast |
| INV-5002 | $87,500 | 9.8 days | Normal |
| INV-5003 | $95,000 | 13.5 days | Slow |
| INV-5004 | $150,000 | 18.7 days | Extreme |
| INV-5005 | $72,000 | 6.1 days | Normal |
The Fast category (under 5 days) represents exceptional processing. Normal (5-10 days) meets the SLA. Slow (10-15 days) indicates SLA violations that need attention. Extreme (over 15 days) represents critical delays requiring immediate investigation.
**Insights:** By filtering the process map to show only Extreme performance cases, the AP team identifies that high-value invoices lacking purchase order references account for 78% of payment delays. They implement an automated matching enhancement and reduce Extreme-category payments from 15% to 3% of high-value invoices within two months.
### Example 3: Regional Claim Processing Performance
**Scenario:** An insurance company wants to categorize claim processing times for different regions to identify areas needing process improvement or additional resources.
**Settings:**
- Filter Cases: Region = "Northeast" AND Claim_Type = "Auto"
- Attribute Name: Claim_Submission_To_Payout
- New Attribute Name: Northeast_Auto_Claim_Category
- Fast Duration: 72 hours (auto-calculated)
- Normal Duration: 168 hours (auto-calculated)
- Slow Duration: 240 hours (auto-calculated)
- Duration Unit: Hours
**Output:**
Creates "Northeast_Auto_Claim_Category" with distribution:
- "Fast" - Claims resolved within 3 days
- "Normal" - Claims resolved within 3-7 days
- "Slow" - Claims resolved within 7-10 days
- "Extreme" - Claims taking more than 10 days
**Insights:** Comparing Northeast performance to other regions shows that the Northeast has significantly more claims in the Slow and Extreme categories, leading to the deployment of additional claims adjusters to that region.
### Example 4: Manufacturing Batch Quality Categories
**Scenario:** A pharmaceutical manufacturer wants to categorize production cycle times for specific drug batches that require additional quality controls.
**Settings:**
- Filter Cases: Product_Category = "Controlled Substance" AND Batch_Size > 1000
- Attribute Name: Manufacturing_Cycle_Time
- New Attribute Name: Controlled_Batch_Performance
- Fast Duration: 4.5 hours (auto-calculated)
- Normal Duration: 8 hours (auto-calculated)
- Slow Duration: 10 hours (auto-calculated)
- Duration Unit: Hours
**Output:**
New attribute showing:
- "Fast" - Batches completed in under 4.5 hours while maintaining quality
- "Normal" - Standard production time of 4.5-8 hours
- "Slow" - Extended production time of 8-10 hours
- "Extreme" - Batches requiring more than 10 hours, indicating potential issues
**Insights:** Analysis shows that batches in the Extreme category have a 3x higher rate of quality issues, leading to new protocols for batches exceeding 10 hours of production time.
### Example 5: IT Ticket Resolution by Priority
**Scenario:** An IT service desk wants to create performance categories for high-priority tickets from VIP users to ensure SLA compliance.
**Settings:**
- Filter Cases: Ticket_Priority = "P1" AND User_Category = "VIP"
- Attribute Name: Ticket_Resolution_Duration
- New Attribute Name: VIP_P1_Resolution_Category
- Fast Duration: 30 minutes (manually set per SLA)
- Normal Duration: 2 hours (manually set per SLA)
- Slow Duration: 4 hours (manually set per SLA)
- Duration Unit: Minutes
**Output:**
Categories created:
- "Fast" - P1 VIP tickets resolved within 30 minutes (target: 50%)
- "Normal" - Resolution within 30 minutes to 2 hours (target: 40%)
- "Slow" - Resolution within 2-4 hours (acceptable: 8%)
- "Extreme" - Resolution exceeding 4 hours (must be < 2%)
**Insights:** Current performance shows only 35% of P1 VIP tickets in the Fast category, below the 50% target. The service desk implements automated escalation for VIP tickets approaching the 30-minute threshold.
## Output
When this enrichment is executed, it creates a new case attribute with the following characteristics:
**Attribute Details:**
- **Data Type**: String (text)
- **Attribute Type**: Performance (automatically marked for performance analysis features)
- **Scope**: Case-level attribute (one value per case)
**Category Values:**
The new attribute will contain one of five possible values:
- **"Fast"**: Duration is less than or equal to the Fast threshold
- **"Normal"**: Duration is between Fast and Normal thresholds
- **"Slow"**: Duration is between Normal and Slow thresholds
- **"Extreme"**: Duration exceeds the Slow threshold
- **"Negative"**: Duration is less than zero (data quality issue)
**Null Handling:**
Cases without a value in the source duration attribute will have null in the category attribute. This includes:
- Cases filtered out by your selection criteria
- Cases missing the duration value
- Cases with invalid duration data
**Using the Output:**
The categorized attribute can be used in:
- Performance matrix visualizations to show distribution across categories
- Case filters to focus on slow or extreme cases requiring attention
- Conformance checking to identify cases violating SLA categories
- Comparative analysis between different filtered groups
- Dashboard KPIs showing percentage of cases in each category
- Root cause analysis to understand what drives extreme performance
**Integration with Other Features:**
- Use in calculated attributes to create scoring systems
- Combine with other enrichments for multi-dimensional performance analysis
- Export to external systems for SLA reporting
- Use as input for predictive models to forecast performance categories
## See Also
**Related Performance Enrichments:**
- [Categorize Duration](/mindzie_studio/enrichments/categorize-duration) - Create performance categories for all cases without filtering
- [Categorize Duration for Activity](/mindzie_studio/enrichments/categorize-duration-for-activity) - Categorize durations at the activity level
- [Case Duration Category for Activity](/mindzie_studio/enrichments/case-duration-category-for-activity) - Apply activity duration categories to cases
**Related Duration Enrichments:**
- [Duration Between Two Activities](/mindzie_studio/enrichments/duration-between-two-activities) - Calculate time between activities
- [Duration Between an Attribute and an Activity](/mindzie_studio/enrichments/duration-between-an-attribute-and-an-activity) - Measure time from case attribute to activity
- [Durations Between a Case Attribute and Activity Times](/mindzie_studio/enrichments/durations-between-case-attribute-and-activity-times) - Calculate multiple durations from a case attribute
**Related Analysis Features:**
- [Categorize Attribute Values](/mindzie_studio/enrichments/categorize-attribute-values) - Create categories for any attribute type
- [Performance Analysis](/mindzie_studio/analysis/performance-analysis) - Using performance categories in analysis
- [Filters](/mindzie_studio/filters/overview) - Understanding case and event filtering
---
*This documentation is part of the mindzie Studio process mining platform.*
---
## Change Attribute Display Name
Section: Enrichments
URL: https://docs.mindziestudio.com/mindzie_studio/enrichments/change-attribute-display-name
Source: /docs-master/mindzieStudio/enrichments/change-attribute-display-name/page.md
# Change Attribute Display Name
## Overview
The Change Attribute Display Name enrichment modifies how an attribute appears in the user interface without altering its underlying technical name or data. This powerful cleanup operator provides a critical layer of abstraction between technical attribute names and business-friendly labels, enabling you to present data in terms that are meaningful to business users while maintaining the integrity of the underlying data structure. The enrichment operates at the metadata level, updating only the display property of the selected attribute column.
This enrichment is essential for transforming technical or system-generated attribute names into clear, business-oriented terminology that stakeholders can immediately understand. For instance, you might have attributes with technical names like "PO_AMT_USD" or "CUST_ID_001" that need to be presented as "Purchase Order Amount" or "Customer ID" for better readability. The Change Attribute Display Name enrichment makes this transformation seamless, improving the usability of your process mining analysis without requiring any changes to the underlying data model or breaking existing filters, calculators, or other enrichments that reference the original attribute name.
## Common Uses
- Transform technical database column names into business-friendly labels for reports and dashboards
- Standardize attribute naming conventions across different data sources in merged datasets
- Implement internationalization by changing display names to different languages for global teams
- Create context-specific labels when the same attribute means different things in different processes
- Improve readability of automatically generated attributes from other enrichments or calculations
- Align attribute names with corporate terminology standards and business glossaries
- Make cryptic system-generated field names understandable for non-technical users
## Settings
**Attribute Name:** Select the attribute whose display name you want to change. The dropdown list shows all available case attributes in your dataset, excluding calculated fields and hidden attributes. This ensures you're only modifying attributes that are actually stored in the data. The selection determines which attribute's display property will be updated.
**New Attribute Display Name:** Enter the new display name for the selected attribute. This is the name that will appear in all user interfaces, reports, and visualizations throughout mindzieStudio. The new name should be clear, descriptive, and follow your organization's naming conventions. There are no restrictions on the characters you can use, allowing for spaces, special characters, and even unicode characters if needed for internationalization. The display name can be as long as necessary to properly describe the attribute's meaning.
## Examples
### Example 1: Purchase Order System Integration
**Scenario:** After importing data from an ERP system, you have attributes with technical database names like "PO_HDR_CRDT", "VNDR_CODE", and "APPR_STATUS" that need to be made understandable for business analysts reviewing the procurement process.
**Settings:**
- Attribute Name: PO_HDR_CRDT
- New Attribute Display Name: Purchase Order Creation Date
**Output:**
The attribute "PO_HDR_CRDT" will now display as "Purchase Order Creation Date" in all views, filters, and reports. The underlying data and technical name remain unchanged, ensuring compatibility with existing configurations.
**Insights:** Business users can now easily identify and work with the creation date field without needing to understand the technical abbreviation, reducing training time and improving self-service analytics adoption.
### Example 2: Multi-Language Support for Global Teams
**Scenario:** A multinational company needs to present the same process data to teams in different countries, requiring attribute names in local languages while maintaining a single underlying dataset.
**Settings:**
- Attribute Name: Customer_Region
- New Attribute Display Name: Region Cliente (Spanish)
**Output:**
The attribute appears as "Region Cliente" in the Spanish version of the analysis, making it immediately understandable for Spanish-speaking team members. The technical name "Customer_Region" remains unchanged for system operations.
**Insights:** Teams across different regions can work with the same dataset using terminology familiar to them, improving collaboration and reducing misinterpretation of data fields.
### Example 3: Healthcare Claims Processing
**Scenario:** In a healthcare claims process, medical coding attributes like "ICD10_PRIM", "DRG_CODE", and "CPT_MOD" need clearer names for claims analysts who aren't familiar with medical coding abbreviations.
**Settings:**
- Attribute Name: ICD10_PRIM
- New Attribute Display Name: Primary Diagnosis Code (ICD-10)
**Output:**
The cryptic "ICD10_PRIM" field now displays as "Primary Diagnosis Code (ICD-10)", providing both clarity about the field's purpose and context about the coding system used.
**Insights:** Claims analysts can quickly identify diagnostic information without memorizing technical abbreviations, leading to faster claim reviews and fewer errors in data interpretation.
### Example 4: Financial Reconciliation Process
**Scenario:** After merging data from multiple financial systems, you have similar attributes with different naming conventions like "AMT_USD" from one system and "TransactionAmount" from another that need consistent presentation.
**Settings:**
- Attribute Name: AMT_USD
- New Attribute Display Name: Transaction Amount (USD)
**Output:**
Both the "AMT_USD" and after changing "TransactionAmount" display names, all monetary fields follow a consistent naming pattern with currency clearly indicated, improving data interpretation accuracy.
**Insights:** Standardized display names across merged datasets reduce confusion and ensure accurate financial analysis, especially when dealing with multi-currency transactions.
### Example 5: Manufacturing Quality Control
**Scenario:** In a quality control process, sensor-generated attributes like "TEMP_S1_AVG", "PRES_S2_MAX", and "VISC_S3_STD" need human-readable names for quality engineers reviewing production data.
**Settings:**
- Attribute Name: TEMP_S1_AVG
- New Attribute Display Name: Average Temperature - Sensor 1
**Output:**
The technical sensor reading code "TEMP_S1_AVG" now clearly indicates it represents average temperature readings from sensor 1, making it immediately understandable in quality reports.
**Insights:** Quality engineers can quickly identify which sensor readings correspond to which production parameters, enabling faster root cause analysis of quality issues without constantly referencing sensor documentation.
## Output
The Change Attribute Display Name enrichment modifies the display metadata of the selected attribute without creating new attributes or altering the underlying data. The original attribute's technical name remains unchanged and continues to function in all existing configurations, filters, and calculations. The new display name appears immediately in all user interface elements including:
- Attribute selection dropdowns in filters and calculators
- Column headers in data views and case explorers
- Axis labels in charts and visualizations
- Field names in exported reports
- Attribute lists in enrichment configurations
The change is persistent and will remain in effect for all future analysis sessions. However, any references to the attribute in formulas, scripts, or API calls must continue to use the original technical name. This separation between display and technical names ensures backward compatibility while improving usability.
## See Also
- **Rename Activity** - Changes the name of activities in the event log
- **Replace Text in Attribute** - Modifies actual attribute values rather than display names
- **Trim Text** - Cleans up attribute values by removing leading/trailing spaces
- **Upper Case Attribute** - Standardizes text attribute values to uppercase
- **Hide Attribute** - Removes attributes from display without deleting them
---
*This documentation is part of the mindzie Studio process mining platform.*
---
## Change Attribute Name
Section: Enrichments
URL: https://docs.mindziestudio.com/mindzie_studio/enrichments/change-attribute-name
Source: /docs-master/mindzieStudio/enrichments/change-attribute-name/page.md
# Change Attribute Name
## Overview
The Change Attribute Name enrichment allows you to rename case and event attributes in your dataset to create clearer, more meaningful, and standardized naming conventions. This enrichment is essential for improving the readability and interpretability of your process mining results, especially when working with datasets that contain cryptic, technical, or legacy attribute names. Beyond simple renaming, this enrichment also allows you to set a display name that appears in visualizations while preserving the technical attribute name for filtering and calculations.
This enrichment is particularly valuable when consolidating data from multiple sources with different naming conventions, preparing datasets for business stakeholder review, or aligning attribute names with organizational terminology. The ability to set both a technical name and a display name provides flexibility in maintaining technical accuracy while ensuring business-friendly presentation.
## Common Uses
- **Standardize attribute naming** across datasets from different source systems (e.g., renaming "VBELN" to "SalesOrderNumber" for SAP data)
- **Create business-friendly names** for technical database field names (e.g., "CUST_ID_2023_V2" to "Customer ID")
- **Align with organizational terminology** by renaming attributes to match company-specific terms and abbreviations
- **Improve dashboard readability** by using clear, descriptive names that stakeholders immediately understand
- **Fix legacy naming issues** from older systems or data migrations where attribute names no longer reflect their content
- **Prepare datasets for sharing** by ensuring attribute names are self-explanatory without requiring documentation
- **Support multi-language environments** by renaming attributes to the preferred business language
## Settings
**Attribute Name:** Select the existing attribute you want to rename from the dropdown list. This list includes all available case and event attributes in your dataset, excluding system attributes like Case ID, Activity, and Timestamp. Only attributes that haven't been hidden and aren't calculated fields are shown.
**New Attribute Name:** Enter the new technical name for the attribute. This becomes the attribute's internal identifier used in filters, calculators, and other enrichments. The name should follow standard naming conventions: avoid special characters, use underscores or camelCase for multi-word names, and ensure uniqueness within the dataset.
**New Attribute Display Name:** Optionally specify a user-friendly display name that appears in visualizations and reports. This allows you to use spaces, special characters, and formatting that wouldn't be valid in technical attribute names. If left empty, the New Attribute Name will be used as the display name. This is particularly useful when you need a technical name like "order_value_usd" but want to display "Order Value ($)" in dashboards.
## Examples
### Example 1: Standardizing SAP Field Names
**Scenario:** Your procurement dataset from SAP contains German field names like "EKORG", "LIFNR", and "BEDAT" that are meaningless to business users reviewing the process analysis.
**Settings:**
- Attribute Name: EKORG
- New Attribute Name: PurchasingOrganization
- New Attribute Display Name: Purchasing Organization
**Output:**
The attribute "EKORG" is renamed to "PurchasingOrganization" throughout the dataset. In all visualizations and reports, users see "Purchasing Organization" as the label. Filters and calculations can reference either the old name (for backward compatibility) or the new name "PurchasingOrganization".
**Insights:** Business users can now immediately understand that this attribute represents the purchasing organization without needing to reference SAP documentation, significantly improving self-service analytics adoption.
### Example 2: Consolidating Multi-System Data
**Scenario:** You're analyzing a order-to-cash process with data from three systems: CRM (CustomerCode), ERP (CUST_NUM), and billing system (client_identifier). You need to standardize these customer identifier fields.
**Settings:**
- Attribute Name: CUST_NUM
- New Attribute Name: CustomerID
- New Attribute Display Name: Customer ID
**Output:**
The ERP field "CUST_NUM" is renamed to "CustomerID" to match the standardized naming convention. After applying similar renaming to the other systems' fields, all customer identifiers across systems use consistent naming, enabling easier cross-system analysis and reducing confusion in multi-system process flows.
**Insights:** Standardized naming across systems eliminates the cognitive load of remembering different field names for the same business concept, making cross-functional process analysis more efficient.
### Example 3: Creating Business-Friendly Healthcare Names
**Scenario:** Your hospital's patient flow dataset contains technical field names like "pt_admit_dt", "dx_primary", and "los_days" that need to be more accessible for clinical staff and administrators.
**Settings:**
- Attribute Name: los_days
- New Attribute Name: LengthOfStay
- New Attribute Display Name: Length of Stay (Days)
**Output:**
The attribute "los_days" is renamed to "LengthOfStay" for technical use, while displaying as "Length of Stay (Days)" in all user interfaces. This makes the metric immediately understandable to clinical staff reviewing patient flow patterns and helps identify bottlenecks in the discharge process.
**Insights:** Clear, descriptive naming helps clinical teams focus on process improvement rather than decoding technical terminology, leading to faster identification of care delivery inefficiencies.
### Example 4: Multi-Language Support for Global Operations
**Scenario:** A multinational manufacturing company needs to rename attributes from local language systems to English for global reporting while maintaining local display names for regional teams.
**Settings:**
- Attribute Name: fecha_produccion
- New Attribute Name: ProductionDate
- New Attribute Display Name: Production Date
**Output:**
The Spanish attribute "fecha_produccion" is renamed to the standardized English "ProductionDate" for global reporting and integration. The display name "Production Date" appears in all visualizations. Regional teams can still reference the original name in their local reports if needed.
**Insights:** Standardized English attribute names enable global process mining initiatives while the display name feature ensures local teams can work with familiar terminology in their reports.
### Example 5: Cleaning Up Legacy System Names
**Scenario:** After a system migration, your finance dataset contains outdated attribute names like "OLD_GL_ACCT_2019_FINAL" that no longer reflect the current chart of accounts structure.
**Settings:**
- Attribute Name: OLD_GL_ACCT_2019_FINAL
- New Attribute Name: GLAccountNumber
- New Attribute Display Name: G/L Account Number
**Output:**
The legacy attribute name is replaced with the clean, current "GLAccountNumber" throughout the dataset. The display name "G/L Account Number" uses standard accounting terminology familiar to finance teams. All existing filters and calculations automatically update to use the new name.
**Insights:** Removing legacy naming artifacts reduces confusion and errors in financial process analysis, ensuring teams work with current, accurate terminology aligned with the active chart of accounts.
## Output
The Change Attribute Name enrichment modifies the dataset's metadata without altering the underlying data values. The renamed attribute retains all its original properties including data type, values, and relationships with other attributes. The enrichment creates a permanent change to the attribute's identifier throughout the dataset schema.
When you specify only a New Attribute Name, this becomes both the technical identifier and the display label. When you also provide a New Attribute Display Name, the system maintains a separation between the technical name (used in formulas and filters) and the presentation name (shown in user interfaces).
All existing enrichments, filters, and calculators that reference the original attribute name are automatically updated to use the new name, ensuring backward compatibility. The rename operation is case-sensitive and validates that the new name doesn't conflict with existing attributes in the dataset.
## See Also
- **Hide Attribute** - Remove unwanted attributes from view without deleting them
- **Trim Text** - Clean up attribute values by removing leading/trailing spaces
- **Replace Text** - Modify specific text within attribute values
- **Group Attribute Values** - Consolidate similar attribute values into standardized groups
- **Categorize Attribute Values** - Create categorical groupings based on attribute value ranges
---
*This documentation is part of the mindzie Studio process mining platform.*
---
## Combine Boolean Attributes
Section: Enrichments
URL: https://docs.mindziestudio.com/mindzie_studio/enrichments/combine-boolean-attributes
Source: /docs-master/mindzieStudio/enrichments/combine-boolean-attributes/page.md
# Combine Boolean Attributes
## Overview
The Combine Boolean Attributes enrichment creates a new text attribute that concatenates the names of selected boolean attributes whose values are TRUE for each case. This powerful data synthesis tool helps you create composite indicators that represent multiple conditions occurring simultaneously, providing a clear view of complex multi-factor scenarios in your process data. Rather than examining numerous individual boolean flags separately, you can generate a single descriptive attribute that captures all active conditions in an easy-to-read format.
This enrichment is particularly valuable when you need to understand combinations of conditions that occur together in your process. For example, in a loan approval process, you might have boolean attributes for "High Credit Score," "Stable Employment," and "Low Debt Ratio." The Combine Boolean Attributes enrichment would create a new attribute showing combinations like "High Credit Score | Stable Employment | Low Debt Ratio" for cases where all three conditions are true. This makes it easy to identify patterns, create process variants based on multiple criteria, and understand the complete context of each case at a glance.
## Common Uses
- **Create composite compliance indicators:** Combine multiple compliance checks into a single attribute showing all passed requirements
- **Build multi-criteria classifications:** Generate process variants based on combinations of boolean conditions
- **Identify quality patterns:** Combine multiple quality checks to see which combinations frequently occur together
- **Track approval criteria:** Consolidate multiple approval conditions into readable combinations for audit trails
- **Analyze exception patterns:** Combine error or exception flags to understand common failure combinations
- **Support root cause analysis:** Create attributes showing all active conditions to identify correlations
- **Generate descriptive case labels:** Build human-readable descriptions of case characteristics for reporting
## Settings
**Filter:** Define optional filtering criteria to limit which cases are processed by the enrichment. Only cases matching the filter will have the new combined attribute created. Cases not matching the filter will have a null value for the new attribute. Use this to focus the enrichment on specific subsets of your data, such as cases from a particular time period, region, or process variant.
**New Attribute Name:** Specify the name for the new text attribute that will contain the concatenated boolean attribute names. Choose a descriptive name that clearly indicates what combination is being captured, such as "Active Compliance Flags," "Quality Check Results," or "Approval Criteria Met." This attribute will contain the names of all TRUE boolean attributes separated by " | " characters.
**Attribute Names:** Select two or more boolean or text attributes to combine. For boolean attributes, only those with TRUE values will have their names included in the output. For text attributes, their values (not names) will be included if they are not null or empty. You must select at least two attributes for the enrichment to be valid. The order of selection determines the order in which attribute names appear in the combined result.
## Examples
### Example 1: Loan Approval Criteria Combination
**Scenario:** A bank wants to create a comprehensive view of which approval criteria are met for each loan application to better understand approval patterns and identify the most common qualifying combinations.
**Settings:**
- Filter: (none - apply to all cases)
- New Attribute Name: Approval Criteria Met
- Attribute Names:
- High Credit Score (boolean)
- Stable Employment (boolean)
- Low Debt Ratio (boolean)
- Collateral Provided (boolean)
- Previous Customer (boolean)
**Output:**
The enrichment creates an "Approval Criteria Met" attribute showing which conditions are TRUE:
| Case ID | High Credit Score | Stable Employment | Low Debt Ratio | Collateral Provided | Previous Customer | Approval Criteria Met |
|---------|------------------|-------------------|----------------|---------------------|-------------------|----------------------|
| L-001 | TRUE | TRUE | TRUE | FALSE | TRUE | High Credit Score \| Stable Employment \| Low Debt Ratio \| Previous Customer |
| L-002 | TRUE | FALSE | TRUE | TRUE | FALSE | High Credit Score \| Low Debt Ratio \| Collateral Provided |
| L-003 | FALSE | TRUE | FALSE | TRUE | FALSE | Stable Employment \| Collateral Provided |
| L-004 | TRUE | TRUE | TRUE | TRUE | TRUE | High Credit Score \| Stable Employment \| Low Debt Ratio \| Collateral Provided \| Previous Customer |
**Insights:** Analysis reveals that 78% of approved loans have at least three criteria met, with "High Credit Score | Stable Employment | Low Debt Ratio" being the most common combination. Cases with all five criteria have 95% approval rates and 40% faster processing times.
### Example 2: Manufacturing Quality Control Flags
**Scenario:** A manufacturing plant needs to track which quality checks pass for each production batch to identify patterns in quality issues and optimize the inspection process.
**Settings:**
- Filter: Cases with Attribute "Production Line" = "Line A"
- New Attribute Name: Quality Checks Passed
- Attribute Names:
- Dimensional Accuracy OK (boolean)
- Surface Quality OK (boolean)
- Weight Within Spec (boolean)
- Tensile Strength OK (boolean)
- Color Match OK (boolean)
**Output:**
Creates a "Quality Checks Passed" attribute for Line A production:
| Batch ID | Dimensional Accuracy OK | Surface Quality OK | Weight Within Spec | Tensile Strength OK | Color Match OK | Quality Checks Passed |
|----------|-------------------------|--------------------|--------------------|---------------------|----------------|----------------------|
| B-2001 | TRUE | TRUE | FALSE | TRUE | TRUE | Dimensional Accuracy OK \| Surface Quality OK \| Tensile Strength OK \| Color Match OK |
| B-2002 | TRUE | TRUE | TRUE | TRUE | TRUE | Dimensional Accuracy OK \| Surface Quality OK \| Weight Within Spec \| Tensile Strength OK \| Color Match OK |
| B-2003 | FALSE | TRUE | TRUE | FALSE | TRUE | Surface Quality OK \| Weight Within Spec \| Color Match OK |
**Insights:** Batches with all quality checks passed have 0.1% return rates. The combination "Surface Quality OK | Weight Within Spec" alone appears in 15% of batches requiring rework, indicating these checks may not be sufficient quality indicators.
### Example 3: Healthcare Patient Risk Factors
**Scenario:** A hospital emergency department wants to combine multiple risk indicator flags to quickly identify high-complexity patients requiring specialized care coordination.
**Settings:**
- Filter: Cases with Attribute "Department" = "Emergency"
- New Attribute Name: Active Risk Factors
- Attribute Names:
- Chronic Condition Present (boolean)
- Multiple Medications (boolean)
- Age Over 65 (boolean)
- Previous Admission (boolean)
- Allergy Alert (boolean)
- Fall Risk (boolean)
**Output:**
Creates "Active Risk Factors" showing all present risk conditions:
| Patient ID | Chronic Condition | Multiple Medications | Age Over 65 | Previous Admission | Allergy Alert | Fall Risk | Active Risk Factors |
|------------|-------------------|---------------------|-------------|-------------------|---------------|-----------|---------------------|
| P-801 | TRUE | TRUE | TRUE | FALSE | TRUE | TRUE | Chronic Condition Present \| Multiple Medications \| Age Over 65 \| Allergy Alert \| Fall Risk |
| P-802 | FALSE | FALSE | FALSE | TRUE | FALSE | FALSE | Previous Admission |
| P-803 | TRUE | TRUE | FALSE | TRUE | TRUE | FALSE | Chronic Condition Present \| Multiple Medications \| Previous Admission \| Allergy Alert |
**Insights:** Patients with 4+ active risk factors have 2.5x longer average length of stay and require care coordination in 89% of cases. The most common combination "Chronic Condition Present | Multiple Medications | Age Over 65" appears in 34% of readmissions.
### Example 4: Procurement Compliance Verification
**Scenario:** A procurement department needs to track which compliance requirements are met for each purchase order to ensure regulatory compliance and identify gaps in the approval process.
**Settings:**
- Filter: Cases with Attribute "Order Value" > 10000
- New Attribute Name: Compliance Requirements Met
- Attribute Names:
- Budget Approved (boolean)
- Vendor Verified (boolean)
- Legal Review Complete (boolean)
- Risk Assessment Done (boolean)
- Manager Approval (boolean)
- Finance Approval (boolean)
**Output:**
Shows combined compliance status for high-value orders:
| PO Number | Budget Approved | Vendor Verified | Legal Review | Risk Assessment | Manager Approval | Finance Approval | Compliance Requirements Met |
|-----------|----------------|-----------------|--------------|-----------------|------------------|------------------|----------------------------|
| PO-5001 | TRUE | TRUE | TRUE | TRUE | TRUE | TRUE | Budget Approved \| Vendor Verified \| Legal Review Complete \| Risk Assessment Done \| Manager Approval \| Finance Approval |
| PO-5002 | TRUE | TRUE | FALSE | TRUE | TRUE | FALSE | Budget Approved \| Vendor Verified \| Risk Assessment Done \| Manager Approval |
| PO-5003 | TRUE | FALSE | FALSE | FALSE | TRUE | TRUE | Budget Approved \| Manager Approval \| Finance Approval |
**Insights:** Orders with all compliance requirements met process 60% faster. The combination lacking "Legal Review Complete | Finance Approval" accounts for 40% of audit findings, highlighting critical control gaps.
### Example 5: IT Service Desk Ticket Classification
**Scenario:** An IT service desk wants to combine multiple ticket characteristic flags to better route tickets and identify common issue combinations requiring specialized support.
**Settings:**
- Filter: Cases with Attribute "Ticket Priority" IN ["High", "Critical"]
- New Attribute Name: Ticket Characteristics
- Attribute Names:
- Security Related (boolean)
- Production Impact (boolean)
- Multiple Users Affected (boolean)
- Executive Request (boolean)
- Compliance Issue (boolean)
- Data Loss Risk (boolean)
**Output:**
Creates comprehensive ticket characteristic combinations:
| Ticket ID | Security Related | Production Impact | Multiple Users | Executive Request | Compliance Issue | Data Loss Risk | Ticket Characteristics |
|-----------|-----------------|-------------------|----------------|-------------------|------------------|----------------|----------------------|
| T-9001 | TRUE | TRUE | TRUE | FALSE | TRUE | TRUE | Security Related \| Production Impact \| Multiple Users Affected \| Compliance Issue \| Data Loss Risk |
| T-9002 | FALSE | TRUE | TRUE | TRUE | FALSE | FALSE | Production Impact \| Multiple Users Affected \| Executive Request |
| T-9003 | TRUE | FALSE | FALSE | FALSE | TRUE | TRUE | Security Related \| Compliance Issue \| Data Loss Risk |
**Insights:** Tickets with "Security Related | Production Impact | Multiple Users Affected" require immediate escalation and have average resolution times under 2 hours. This combination triggers automatic incident response team activation in 95% of cases.
## Output
The Combine Boolean Attributes enrichment creates a single new case-level text attribute containing the concatenated names of all TRUE boolean attributes or non-empty text values from the selected attributes. The attribute names are separated by " | " for clear readability.
The new attribute will contain:
- For boolean attributes: The attribute name itself when the value is TRUE (e.g., "High Priority" appears when the High Priority attribute is TRUE)
- For text attributes: The actual text value when not null or empty (useful for including status or category values)
- An empty/null value when no selected attributes are TRUE or have values
- Multiple attribute names separated by " | " when multiple conditions are TRUE
This output attribute can be used in subsequent enrichments, filters, and calculators. It's particularly useful for creating process variants, grouping cases with similar characteristics, and building comprehensive case descriptions for dashboards and reports. The concatenated format makes it easy to use in further text processing or pattern matching operations.
## See Also
- **Group Attribute Values** - Create categorical groupings based on attribute values
- **Logical OR** - Create boolean attributes based on OR logic across multiple conditions
- **Logical AND** - Create boolean attributes based on AND logic across multiple conditions
- **Representative Case Attribute** - Extract representative values from event attributes to case level
- **Categorize Attribute Values** - Create categories based on attribute value ranges or patterns
---
*This documentation is part of the mindzie Studio process mining platform.*
---
## Compare Activity Counts
Section: Enrichments
URL: https://docs.mindziestudio.com/mindzie_studio/enrichments/compare-activity-counts
Source: /docs-master/mindzieStudio/enrichments/compare-activity-counts/page.md
# Compare Activity Counts
## Overview
The Compare Activity Counts enrichment analyzes whether two selected activities occur with equal frequency within each case, creating a boolean attribute that indicates balanced or imbalanced execution patterns. This enrichment is essential for validating process symmetry, ensuring paired operations are properly matched, and detecting deviations in expected activity patterns. Unlike simple counting enrichments that track individual activity occurrences, this operator specifically compares the execution counts of two activities to identify cases where they are balanced versus those where one activity occurs more frequently than the other.
This enrichment is particularly valuable in processes where certain activities should occur in pairs or with matching frequencies. For example, in procurement processes, you might expect each "Create Purchase Order" to have a corresponding "Receive Goods" activity. In manufacturing, quality checks might need to match production runs. In financial processes, debits and credits should balance. The enrichment helps identify cases where these expected patterns are violated, enabling targeted investigation of process deviations, incomplete executions, or system errors that cause imbalanced activity patterns.
## Common Uses
- Validate that paired activities occur with equal frequency (order creation vs. order fulfillment)
- Ensure balanced operations in financial processes (payment initiated vs. payment completed)
- Check manufacturing process symmetry (assembly start vs. assembly complete activities)
- Verify quality control completeness (items produced vs. items inspected)
- Monitor approval workflows for consistency (approval requests vs. approval decisions)
- Detect incomplete process executions where expected matching activities are missing
- Identify system integration issues causing activity count mismatches
## Settings
**Filter (Optional):** Apply filters to limit which cases are analyzed for activity count comparison. When filters are applied, only cases matching the filter criteria will have the comparison performed and the result stored. This is useful when you want to check activity balance only for specific subsets of your data, such as high-priority cases, specific product categories, or particular time periods. Cases not matching the filter will have a null value for the new attribute.
**New Attribute Name:** Specify the name for the new boolean attribute that will store the comparison result. Choose a descriptive name that clearly indicates what is being compared. For example, use "Orders_Balanced" when comparing order and delivery activities, or "QC_Complete" when comparing production and inspection activities. The attribute will contain "Yes" (true) when counts match, "No" (false) when they differ, or null when neither activity exists in the case.
**Activity 1:** Select the first activity to compare from the dropdown list of all activities in your dataset. This should be one of the paired activities you want to check for balance. The enrichment will count how many times this activity occurs in each case. The selection list shows all unique activities found in your event log, ensuring you can only select activities that actually exist in your data.
**Activity 2:** Select the second activity to compare from the dropdown list. This is the activity that should occur with the same frequency as Activity 1. The enrichment will count occurrences of this activity and compare them to Activity 1. You can select the same activity as Activity 1 if needed for special validation scenarios, though typically you would choose a different activity that forms a logical pair with Activity 1.
## Examples
### Example 1: Purchase Order and Goods Receipt Validation
**Scenario:** In a procurement process, you need to verify that every purchase order created has a corresponding goods receipt to ensure all ordered items have been delivered and process completion.
**Settings:**
- Filter: None (check all purchase orders)
- New Attribute Name: Order_Receipt_Balanced
- Activity 1: Create Purchase Order
- Activity 2: Record Goods Receipt
**Output:**
Creates a new boolean case attribute "Order_Receipt_Balanced" with values:
- "Yes" - Cases where the number of purchase orders equals the number of goods receipts (e.g., 3 orders, 3 receipts)
- "No" - Cases where counts differ (e.g., 3 orders created but only 2 goods received)
- Null - Cases that contain neither activity (non-procurement cases in mixed datasets)
**Insights:** Cases showing "No" indicate incomplete procurement processes requiring investigation. This could reveal delayed deliveries, missing documentation, or system synchronization issues between ordering and receiving systems.
### Example 2: Quality Check Completeness in Manufacturing
**Scenario:** In a manufacturing process, every production run should have a corresponding quality inspection to ensure product standards are met and compliance requirements are fulfilled.
**Settings:**
- Filter: Product_Category = "Electronics"
- New Attribute Name: QC_Inspection_Complete
- Activity 1: Complete Production Run
- Activity 2: Perform Quality Inspection
**Output:**
Creates "QC_Inspection_Complete" attribute for electronic products:
- "Yes" - Production runs and quality inspections are balanced (e.g., 5 runs, 5 inspections)
- "No" - Mismatch in counts indicating missing inspections or duplicate production records
- Null - Cases without production activities (filtered non-electronics products show null)
**Insights:** This identifies production batches that bypassed quality control, enabling corrective action and compliance reporting. Patterns in mismatches might reveal specific production lines or shifts with systematic QC issues.
### Example 3: Financial Transaction Reconciliation
**Scenario:** In an accounts payable process, you need to ensure that every payment approval has a corresponding payment execution to detect stuck or failed payment processes.
**Settings:**
- Filter: Amount > 10000 (focus on high-value transactions)
- New Attribute Name: Payment_Reconciled
- Activity 1: Approve Payment
- Activity 2: Execute Payment
**Output:**
Creates "Payment_Reconciled" attribute for high-value transactions:
- "Yes" - Equal number of approvals and executions (properly completed payments)
- "No" - Imbalanced counts suggesting approved but unexecuted payments or execution errors
- Null - Cases without payment activities
**Insights:** Cases with "No" require immediate attention as they represent approved payments that haven't been executed, potentially causing vendor relationship issues or compliance violations.
### Example 4: Customer Service Ticket Resolution
**Scenario:** In a customer service process, you want to verify that every ticket escalation to a specialist has received a specialist response, ensuring no escalated issues are abandoned.
**Settings:**
- Filter: Priority = "High" OR Priority = "Critical"
- New Attribute Name: Escalation_Handled
- Activity 1: Escalate to Specialist
- Activity 2: Specialist Response
**Output:**
Creates "Escalation_Handled" attribute for high-priority tickets:
- "Yes" - All escalations received specialist responses (balanced support process)
- "No" - Some escalations lack responses (customer issues potentially unresolved)
- Null - High-priority tickets that were resolved without escalation
**Insights:** This metric helps identify service level breaches where escalated issues didn't receive appropriate specialist attention, enabling process improvement and staff training initiatives.
### Example 5: Healthcare Appointment Management
**Scenario:** In a patient scheduling system, you need to ensure that every appointment scheduled has a corresponding appointment completion or cancellation record for accurate utilization reporting.
**Settings:**
- Filter: Department = "Radiology"
- New Attribute Name: Appointment_Closure_Complete
- Activity 1: Schedule Appointment
- Activity 2: Complete Appointment
**Output:**
Creates "Appointment_Closure_Complete" attribute for radiology appointments:
- "Yes" - Scheduled and completed appointments are balanced
- "No" - Mismatch indicating no-shows, incomplete records, or scheduling errors
- Null - Non-appointment related radiology cases
**Insights:** Cases showing "No" help identify patterns in appointment no-shows, enabling targeted patient communication improvements and better resource planning for the radiology department.
## Output
The Compare Activity Counts enrichment creates a single new boolean attribute at the case level containing the comparison result. The attribute uses the boolean data type with a "Yes/No" display format for easy interpretation in filters, pivot tables, and visualizations.
**Value Logic:**
- **Yes (True):** Both activities occur with exactly the same frequency in the case, including when both have zero occurrences
- **No (False):** The activities have different occurrence counts (one appears more frequently than the other)
- **Null:** Neither activity appears in the case, and the enrichment leaves the value empty rather than setting it to Yes
The new attribute can be immediately used in subsequent enrichments, filters, and calculations. Common applications include filtering to find only imbalanced cases, calculating the percentage of balanced processes, or using the attribute in conformance checking to identify process violations. The boolean nature of the output makes it ideal for KPI calculations, dashboard indicators, and automated alerting systems that need to flag process imbalances.
---
*This documentation is part of the mindzie Studio process mining platform.*
---
## Compare Case Attributes
Section: Enrichments
URL: https://docs.mindziestudio.com/mindzie_studio/enrichments/compare-case-attributes
Source: /docs-master/mindzieStudio/enrichments/compare-case-attributes/page.md
# Compare Case Attributes
## Overview
The Compare Case Attributes enrichment performs equality comparisons between two case attributes and creates a boolean result attribute indicating whether they match. This logical operator enables you to validate data consistency, verify business rules, and identify discrepancies in your process data by comparing any two attributes at the case level. The enrichment provides essential capabilities for quality checks, compliance validation, and process conformance analysis.
This enrichment is particularly valuable in process mining scenarios where you need to verify that different data points align correctly or identify cases where expected matches don't occur. For instance, you can compare planned versus actual values to identify deviations, validate that different system fields contain consistent information, or check whether manual entries match automated calculations. The comparison works across different data types, automatically handling type conversions when comparing numeric values, dates, or text fields, making it a versatile tool for data validation and quality assurance.
## Common Uses
- Validate that invoice amounts match purchase order values for financial compliance
- Compare planned delivery dates with requested dates to identify scheduling conflicts
- Verify customer information consistency across different system fields
- Check if approved budgets match actual spending authorizations
- Identify cases where manual entries differ from system-calculated values
- Validate that product codes match between ordering and shipping systems
- Compare start and end locations in logistics processes to identify round trips
## Settings
**New Attribute Name:** Specify the name for the boolean attribute that will store the comparison result. Choose a descriptive name that clearly indicates what is being compared. For example, "Amount_Matches_PO" when comparing invoice amounts to purchase orders, or "Delivery_Date_Consistent" when comparing planned and actual delivery dates. The attribute will contain True when the values match and False when they differ.
**Case Column 1:** Select the first case attribute to compare. This dropdown shows all available case attributes in your dataset, including both original attributes and those created by other enrichments. The attribute can be of any data type - text, numeric, date, or boolean. The enrichment will handle appropriate type conversions during comparison.
**Case Column 2:** Select the second case attribute to compare against the first. Like Case Column 1, this dropdown presents all available case attributes. The enrichment will compare the values of these two attributes for each case and determine if they are equal. Null values are handled appropriately - two null values are considered equal, while a null compared to any non-null value results in False.
## Examples
### Example 1: Invoice and Purchase Order Validation
**Scenario:** In a procure-to-pay process, you need to validate that invoice amounts match the original purchase order values to identify discrepancies that require investigation or approval.
**Settings:**
- New Attribute Name: Invoice_Matches_PO
- Case Column 1: Invoice_Amount
- Case Column 2: PO_Amount
**Output:**
Creates a boolean attribute "Invoice_Matches_PO" with values:
- True: When Invoice_Amount equals PO_Amount (e.g., both are 5,000.00)
- False: When values differ (e.g., Invoice_Amount is 5,250.00 but PO_Amount is 5,000.00)
- False: When one value is null and the other is not
**Insights:** This comparison helps identify invoices requiring additional approval due to amount mismatches, enables automatic routing of matching invoices through straight-through processing, and provides metrics on supplier invoice accuracy.
### Example 2: Delivery Date Consistency Check
**Scenario:** In a logistics process, you want to verify that the promised delivery date communicated to customers matches the planned delivery date in your scheduling system.
**Settings:**
- New Attribute Name: Delivery_Dates_Aligned
- Case Column 1: Customer_Promise_Date
- Case Column 2: System_Planned_Date
**Output:**
Creates a boolean attribute "Delivery_Dates_Aligned" showing:
- True: When both dates are identical (e.g., both show 2024-03-15)
- False: When dates differ (e.g., promised 2024-03-15 but planned for 2024-03-17)
**Insights:** This enables identification of cases where customer expectations don't match internal planning, helps measure communication accuracy, and highlights process areas where scheduling conflicts occur frequently.
### Example 3: Data Quality Validation in Healthcare
**Scenario:** In a patient care process, you need to verify that the attending physician recorded in the admission system matches the physician listed in the discharge summary.
**Settings:**
- New Attribute Name: Physician_Records_Match
- Case Column 1: Admission_Physician_ID
- Case Column 2: Discharge_Physician_ID
**Output:**
Creates a boolean attribute "Physician_Records_Match" indicating:
- True: When both IDs are identical (e.g., both show "DOC-12345")
- False: When physician IDs differ, indicating a handover or data entry error
**Insights:** This comparison helps identify cases with physician handovers, validates data consistency across systems, and supports quality audits for continuity of care documentation.
### Example 4: Manufacturing Specification Compliance
**Scenario:** In a manufacturing process, you need to verify that the actual material grade used matches the specified grade in the production order.
**Settings:**
- New Attribute Name: Material_Grade_Compliant
- Case Column 1: Specified_Material_Grade
- Case Column 2: Actual_Material_Grade
**Output:**
Creates a boolean attribute "Material_Grade_Compliant" with:
- True: When the specified grade matches what was actually used (e.g., both are "Grade_A")
- False: When different grades were used (e.g., specified "Grade_A" but used "Grade_B")
**Insights:** This enables quality control tracking, identifies production batches that may not meet specifications, and helps calculate compliance rates for different production lines or time periods.
### Example 5: Round Trip Detection in Logistics
**Scenario:** In a transportation management process, you want to identify shipments that are round trips by comparing origin and destination locations.
**Settings:**
- New Attribute Name: Is_Round_Trip
- Case Column 1: Origin_Location
- Case Column 2: Final_Destination
**Output:**
Creates a boolean attribute "Is_Round_Trip" showing:
- True: When origin and destination are the same (e.g., both are "Warehouse_NYC")
- False: When locations differ (e.g., from "Warehouse_NYC" to "Store_Boston")
**Insights:** This comparison helps identify round trip patterns for route optimization, enables different pricing strategies for round trip versus one-way shipments, and supports fleet utilization analysis.
## Output
The Compare Case Attributes enrichment creates a single new boolean case attribute with the name specified in the settings. This attribute contains True when the two compared attributes have identical values and False when they differ. The comparison is performed for each case independently.
The boolean attribute can be displayed in different formats depending on your visualization preferences - as True/False, Yes/No, 1/0, or with custom labels. This attribute integrates seamlessly with other mindzieStudio features:
- **Filtering:** Use the boolean result to filter cases, showing only matches or only mismatches
- **Conformance Analysis:** Identify the percentage of cases where values match versus mismatch
- **Process Flows:** Split process paths based on whether attributes match
- **Calculators:** Use in logical expressions with AND/OR operators for complex validation rules
- **Dashboards:** Create KPIs showing match rates and trends over time
The enrichment handles null values appropriately - two null values are considered equal (returning True), while a null compared to any non-null value returns False. This ensures consistent behavior in data validation scenarios where missing data is significant.
---
*This documentation is part of the mindzie Studio process mining platform.*
---
## Compare Event Attributes For Two Activities
Section: Enrichments
URL: https://docs.mindziestudio.com/mindzie_studio/enrichments/compare-event-attributes-for-two-activities
Source: /docs-master/mindzieStudio/enrichments/compare-event-attributes-for-two-activities/page.md
# Compare Event Attributes for two Activities
## Overview
The Compare Event Attributes for two Activities enrichment performs sophisticated cross-activity attribute matching to determine whether specific event attributes contain the same values across two different activities within each case. This powerful comparison enrichment creates a boolean case attribute that indicates whether the selected attributes match, considering all occurrences of the activities when they appear multiple times. This is essential for validating data consistency, ensuring proper handoffs between process stages, detecting unauthorized modifications, and verifying that critical information flows correctly through your business process.
Unlike simple attribute change detection, this enrichment considers all execution instances when activities occur multiple times in a case. By default, it compares all values from both activities in sorted order. Alternatively, you can compare only distinct values to ignore repetitions and focus on the unique data present at each activity. This flexibility makes the enrichment valuable for both exact matching scenarios and more nuanced consistency checks across complex process variants.
The enrichment is particularly powerful for compliance verification, data integrity validation, and quality assurance scenarios where specific attributes must maintain consistent values between key process milestones. By creating clear boolean indicators, you can quickly filter and analyze cases that fail matching criteria, enabling targeted investigation of data quality issues, process deviations, and potential compliance violations.
## Common Uses
- **Purchase-to-Pay Matching**: Verify that purchase order numbers, vendor IDs, or item descriptions match exactly between goods receipt and invoice receipt activities
- **Three-Way Matching**: Ensure price, quantity, or product codes are consistent across purchase orders, delivery confirmations, and invoices
- **Handoff Validation**: Confirm that customer IDs, account numbers, or reference codes remain consistent between departmental transfers
- **Audit Trail Verification**: Detect cases where approval codes, authorization numbers, or compliance flags change between submission and processing
- **Quality Assurance**: Validate that product specifications, batch numbers, or quality ratings remain unchanged between production stages
- **Contract Compliance**: Ensure contract terms, pricing agreements, or service level codes match between contract signing and service delivery
- **Healthcare Continuity**: Verify that patient identifiers, medication codes, or treatment protocols stay consistent across care transitions
- **Financial Reconciliation**: Check that transaction amounts, account numbers, or payment methods match between authorization and settlement
## Settings
**Filter:** Apply optional case-level filters to limit the enrichment to specific subsets of your data. Only cases matching the filter criteria will have the comparison performed. Cases excluded by filters will have null values for the output attribute. Use filters to focus analysis on specific process variants, time periods, or organizational units.
**New Attribute Name:** Specify the name for the boolean case attribute that will store the comparison result. Choose a descriptive name that clearly indicates what is being compared, such as "PO_Vendor_Match" or "Invoice_Price_Consistency". This attribute will be created in your case table and immediately available for filtering and analysis.
**Activity 1:** Select the first activity that contains the event attribute to compare. This activity represents the initial checkpoint where the attribute value will be captured. All occurrences of this activity within a case will be included in the comparison. Choose an activity that represents an authoritative or original data entry point in your process.
**Attribute 1:** Choose which event attribute from Activity 1 to include in the comparison. This can be any event-level attribute such as vendor ID, amount, product code, or status. The enrichment will collect all values of this attribute from all occurrences of Activity 1 within each case for comparison.
**Activity 2:** Select the second activity that contains the event attribute to compare. This activity represents the secondary checkpoint where the attribute value should match. All occurrences of this activity within a case will be included in the comparison. Choose an activity that represents a dependent or downstream process step where consistency is required.
**Attribute 2:** Choose which event attribute from Activity 2 to compare against Attribute 1. This attribute may have the same name as Attribute 1 or a different name, allowing you to compare equivalent attributes that use different naming conventions across systems. The enrichment will collect all values of this attribute from all occurrences of Activity 2 for comparison.
**Use Distinct Values:** Enable this option to compare only the unique values from each activity, ignoring duplicates and repetitions. When enabled, the enrichment creates a set of distinct values from each activity before comparison. When disabled (default), all values including duplicates are compared in sorted order. Enable this option when you want to verify that the same set of unique values exists regardless of repetition counts. For example, use distinct values when checking if the same set of product codes appears in both activities, even if quantities differ.
## Examples
### Example 1: Purchase Order Invoice Matching
**Scenario:** A procurement department needs to verify that vendor IDs on invoices match the vendor IDs on corresponding purchase orders. This three-way matching validation is critical for preventing payment fraud and ensuring invoices are legitimate.
**Settings:**
- Filter: (none)
- New Attribute Name: Vendor_ID_Match
- Activity 1: Create Purchase Order
- Attribute 1: Vendor_ID
- Activity 2: Receive Invoice
- Attribute 2: Vendor_ID
- Use Distinct Values: False
**Output:**
Creates a boolean case attribute `Vendor_ID_Match`:
- **True**: All vendor IDs from purchase orders exactly match all vendor IDs from invoices (same values in same quantities)
- **False**: Vendor IDs differ between purchase orders and invoices
Sample results showing matching analysis:
| Case ID | Purchase Orders | Invoices | Vendor_ID_Match | Analysis |
|---------|----------------|----------|-----------------|----------|
| PO-1001 | VND-523 | VND-523 | True | Perfect match |
| PO-1002 | VND-523, VND-523 | VND-523, VND-523 | True | Multiple POs, exact match |
| PO-1003 | VND-523 | VND-724 | False | Different vendors |
| PO-1004 | VND-523, VND-724 | VND-523, VND-724 | True | Multiple vendors match |
| PO-1005 | VND-523 | VND-523, VND-724 | False | Extra invoice vendor |
**Insights:** The procurement team discovers that 8% of cases have vendor ID mismatches, indicating potential duplicate invoicing or fraud attempts. They implement mandatory verification workflows for all non-matching cases and recover $340,000 in duplicate payments.
### Example 2: Product Code Consistency Check
**Scenario:** A manufacturing company needs to ensure that product codes assigned during order entry match the product codes recorded during quality inspection, preventing shipment of incorrect items to customers.
**Settings:**
- Filter: [Order_Status] Equals "Completed"
- New Attribute Name: Product_Code_Consistent
- Activity 1: Enter Order
- Attribute 1: Product_Code
- Activity 2: Quality Inspection
- Attribute 2: Inspected_Product_Code
- Use Distinct Values: True
**Output:**
Creates the `Product_Code_Consistent` boolean attribute. With distinct values enabled, the enrichment ignores quantity differences and focuses on whether the same unique product codes appear in both activities.
Analysis of product consistency:
| Case ID | Ordered Products | Inspected Products | Product_Code_Consistent |
|---------|-----------------|-------------------|------------------------|
| ORD-501 | PRD-A, PRD-B | PRD-A, PRD-B | True |
| ORD-502 | PRD-A, PRD-A, PRD-B | PRD-A, PRD-B | True (distinct match) |
| ORD-503 | PRD-A | PRD-C | False |
| ORD-504 | PRD-A, PRD-B | PRD-A, PRD-B, PRD-C | False (extra product) |
**Insights:** Using distinct value comparison, the company identifies that 12% of completed orders have product code mismatches, with most errors occurring during warehouse picking. They redesign the picking process with barcode verification, reducing errors by 85%.
### Example 3: Healthcare Medication Reconciliation
**Scenario:** A hospital needs to verify that medications prescribed during admission match the medications administered during patient care, ensuring patient safety and identifying potential medication errors.
**Settings:**
- Filter: [Department] Equals "Cardiology"
- New Attribute Name: Medication_Match
- Activity 1: Admission Prescribe
- Attribute 1: Medication_Code
- Activity 2: Administer Medication
- Attribute 2: Medication_Code
- Use Distinct Values: True
**Output:**
Creates `Medication_Match` boolean indicating whether the same set of medications was prescribed and administered. Using distinct values allows detection of unauthorized medications regardless of dosing frequency.
Medication reconciliation results:
| Patient ID | Prescribed | Administered | Medication_Match | Review Required |
|-----------|-----------|--------------|------------------|-----------------|
| PT-8001 | MED-101, MED-205 | MED-101, MED-205 | True | No |
| PT-8002 | MED-101 | MED-101, MED-303 | False | Yes - Extra med |
| PT-8003 | MED-101, MED-205 | MED-101 | False | Yes - Missing med |
| PT-8004 | MED-101 | MED-205 | False | Yes - Wrong med |
**Insights:** The cardiology department discovers 6.5% of patients have medication mismatches, with 3% receiving unauthorized additions. They implement electronic verification at the point of administration, improving patient safety scores by 40%.
### Example 4: Financial Transaction Authorization Verification
**Scenario:** A payment processing company must verify that transaction amounts approved during authorization exactly match the amounts settled during final processing, detecting potential fraud or system errors.
**Settings:**
- Filter: [Transaction_Type] Equals "Credit Card"
- New Attribute Name: Amount_Authorization_Match
- Activity 1: Authorize Transaction
- Attribute 1: Authorized_Amount
- Activity 2: Settle Transaction
- Attribute 2: Settlement_Amount
- Use Distinct Values: False
**Output:**
Creates `Amount_Authorization_Match` boolean. With distinct values disabled, every authorized amount must have a matching settlement amount, including handling cases with multiple authorizations or settlements.
Transaction verification analysis:
| Transaction ID | Authorized Amounts | Settled Amounts | Amount_Authorization_Match |
|---------------|-------------------|-----------------|---------------------------|
| TXN-4001 | 125.00 | 125.00 | True |
| TXN-4002 | 125.00, 25.00 | 125.00, 25.00 | True |
| TXN-4003 | 125.00 | 150.00 | False |
| TXN-4004 | 125.00, 125.00 | 125.00 | False (missing settlement) |
**Insights:** The company identifies 0.3% of transactions with amount mismatches, representing $2.1M in discrepancies. Analysis reveals a system bug causing decimal rounding errors during currency conversion. The fix prevents future losses and improves customer trust.
### Example 5: Quality Control Batch Tracking
**Scenario:** A pharmaceutical manufacturer needs to ensure that batch numbers recorded during raw material receiving match the batch numbers used during production, maintaining complete traceability for regulatory compliance.
**Settings:**
- Filter: [Product_Category] Equals "Injectable"
- New Attribute Name: Batch_Traceability_Valid
- Activity 1: Receive Raw Material
- Attribute 1: Material_Batch_Number
- Activity 2: Production Complete
- Attribute 2: Used_Batch_Number
- Use Distinct Values: True
**Output:**
Creates `Batch_Traceability_Valid` boolean for regulatory compliance tracking. Distinct values ensure all received batches are accounted for in production regardless of usage frequency.
Batch traceability verification:
| Production Run | Received Batches | Used Batches | Batch_Traceability_Valid | Compliance Status |
|---------------|-----------------|--------------|-------------------------|-------------------|
| RUN-2401 | B-8801, B-8802 | B-8801, B-8802 | True | Compliant |
| RUN-2402 | B-8803 | B-8803, B-8803 | True | Compliant (dup OK) |
| RUN-2403 | B-8804 | B-8805 | False | Non-compliant |
| RUN-2404 | B-8806, B-8807 | B-8806 | False | Missing batch |
**Insights:** The manufacturer identifies 2.8% of production runs with batch traceability issues, preventing potential FDA compliance violations. They implement real-time batch verification at production start, achieving 99.9% traceability compliance.
## Output
The enrichment creates a single boolean case attribute with the name you specify in the "New Attribute Name" setting. This attribute contains:
- **True**: When the collected values from Activity 1/Attribute 1 exactly match the collected values from Activity 2/Attribute 2
- **False**: When the values differ in any way (different values, different counts, missing values)
- **Empty/Null**: When one or both activities are missing from the case, preventing comparison
**Matching Logic:**
The enrichment uses the following sophisticated comparison algorithm:
1. **Value Collection**: Collects all values of the specified attribute from all occurrences of each activity within the case
2. **Distinct Processing** (if enabled): Removes duplicate values, keeping only unique entries from each activity
3. **Sorting**: Arranges all values in ascending order for consistent comparison
4. **String Concatenation**: Creates pipe-delimited strings of the sorted values (e.g., "|value1|value2|value3")
5. **Exact Match**: Compares the concatenated strings for exact equality
**Important Matching Characteristics:**
- **Order Independent**: Values are sorted before comparison, so order doesn't matter
- **Null Aware**: Null values are treated as distinct values and included in comparison
- **Type Sensitive**: Comparison is performed on string representations of values
- **Count Sensitive** (when distinct values disabled): The number of occurrences must match exactly
- **Count Insensitive** (when distinct values enabled): Only unique values are compared
**Handling Multiple Activity Occurrences:**
When activities appear multiple times in a case:
- All occurrences contribute their attribute values to the comparison
- With distinct values disabled: Each occurrence's value is included (allowing duplicates)
- With distinct values enabled: Each unique value appears only once regardless of occurrence count
**Cases with Missing Activities:**
- If Activity 1 or Activity 2 doesn't occur in a case: Output is null (no comparison possible)
- If both activities are missing: Output is null
- If either activity has no value for the specified attribute: Treated as empty string in comparison
**Using the Output:**
The created boolean attribute is immediately available for:
- **Filtering**: Show only cases with matching or non-matching values
- **Performance Analysis**: Calculate match rates and identify patterns in mismatches
- **Alert Configuration**: Create notifications when critical attributes fail to match
- **Root Cause Analysis**: Filter to non-matching cases and analyze common characteristics
- **Compliance Reporting**: Generate reports showing validation pass/fail rates
- **Process Mining Visualization**: Color-code cases by match status in process maps
- **Statistical Analysis**: Calculate correlation between matching and other process metrics
- **Downstream Enrichments**: Use as input to other enrichments and calculators
**Example Filter Uses:**
```
Filter to non-matching cases:
[Vendor_ID_Match] Equals False
Filter to valid matching cases only:
[Amount_Authorization_Match] Equals True
Find cases where comparison was possible:
[Product_Code_Consistent] Is Not Empty
```
The enrichment efficiently processes large event logs by operating at the case level and using optimized sorting and comparison algorithms. Results are cached with your dataset and remain available until you refresh or modify the enrichment configuration.
---
*This documentation is part of the mindzie Studio process mining platform.*
---
## Compare Multiple Case Attributes
Section: Enrichments
URL: https://docs.mindziestudio.com/mindzie_studio/enrichments/compare-multiple-case-attributes
Source: /docs-master/mindzieStudio/enrichments/compare-multiple-case-attributes/page.md
# Compare Multiple Case Attributes
## Overview
The Compare Multiple Case Attributes enrichment extends basic comparison capabilities by validating that multiple case attributes all contain identical values. This powerful data quality operator creates a boolean result indicating whether all selected attributes match across a case, enabling comprehensive validation scenarios where consistency across multiple data points is critical. Unlike simple two-attribute comparisons, this enrichment checks for universal agreement among three or more attributes, providing essential capabilities for complex data validation, multi-system reconciliation, and comprehensive quality assurance.
This enrichment is particularly valuable in process mining scenarios involving data from multiple source systems, redundant data entry points, or complex validation requirements. For example, in three-way matching scenarios common in procurement, you can verify that quantity values match across purchase orders, goods receipts, and invoices. In healthcare settings, you can validate that patient identifiers are consistent across admission, treatment, and discharge records. In manufacturing, you can ensure that product specifications align across design, production planning, and quality control systems. The enrichment returns True only when all specified attributes contain exactly the same value, making it ideal for detecting any inconsistency among multiple related data points.
The comparison algorithm processes attributes sequentially, comparing each subsequent attribute against the first one. If any attribute differs from the first attribute's value, the result is False. If any attribute contains a null value, the result is null (not calculated), ensuring that incomplete data doesn't produce misleading validation results. This approach provides a robust foundation for data quality monitoring and process conformance checking across complex multi-system environments.
## Common Uses
- Validate three-way matching in procurement processes by ensuring purchase order, goods receipt, and invoice quantities all match
- Verify patient identifiers remain consistent across admission, treatment, billing, and discharge systems in healthcare
- Ensure product specifications match across design documents, production orders, and quality inspection records
- Validate that customer information is synchronized across CRM, order management, and billing systems
- Check that approval amounts align across requisition, approval workflow, and payment authorization systems
- Verify shipping quantities match across warehouse management, transportation, and customs documentation
- Ensure compliance by validating that audit trail timestamps match across multiple logging systems
## Settings
**New Attribute Name:** Specify the name for the boolean attribute that will store the comparison result. Choose a descriptive name that clearly indicates what multi-attribute validation is being performed. For example, "Three_Way_Match_Quantity" when comparing purchase order, goods receipt, and invoice quantities, or "Patient_ID_Consistent" when validating patient identifiers across multiple systems. The attribute will contain True when all compared values match, False when any value differs, and null when any attribute contains a null value.
**Case Column Names:** Select the case attributes to compare for equality. This multi-select field allows you to choose three or more attributes from all available case attributes in your dataset, including both original attributes and those created by other enrichments. The attributes can be of any data type - text, numeric, date, or boolean. The enrichment validates that all selected attributes contain identical values for each case. A minimum of two attributes must be selected, but the enrichment is designed for scenarios with three or more attributes. The comparison checks for exact equality - all values must be precisely the same, including data type and format. If any attribute in the list contains a null value, the comparison result is null rather than True or False, ensuring that incomplete data is properly flagged for investigation.
## Examples
### Example 1: Three-Way Match in Procurement
**Scenario:** In a procure-to-pay process, you need to validate that the quantity values match across three critical documents - the purchase order, goods receipt, and invoice - before authorizing payment. This three-way match is a fundamental control for financial accuracy and fraud prevention.
**Settings:**
- New Attribute Name: Three_Way_Match_Quantity
- Case Column Names: PO_Quantity, GR_Quantity, Invoice_Quantity
**Output:**
Creates a boolean attribute "Three_Way_Match_Quantity" with values:
- True: When all three quantities match exactly (e.g., PO=100, GR=100, Invoice=100)
- False: When any quantity differs (e.g., PO=100, GR=100, Invoice=105)
- null: When any of the three quantity fields is missing or null
Sample data showing different scenarios:
| Case_ID | PO_Quantity | GR_Quantity | Invoice_Quantity | Three_Way_Match_Quantity |
|---------|-------------|-------------|------------------|-------------------------|
| PO-001 | 100 | 100 | 100 | True |
| PO-002 | 50 | 50 | 52 | False |
| PO-003 | 200 | 195 | 200 | False |
| PO-004 | 75 | null | 75 | null |
| PO-005 | 25 | 25 | 25 | True |
**Insights:** This comparison enables automatic approval of invoices with perfect three-way matches while flagging discrepancies for manual review. Organizations can calculate three-way match rates as a KPI for process efficiency, identify suppliers with frequent discrepancies, and measure the financial impact of mismatches. Cases with False results require investigation, while null results indicate incomplete data requiring data quality improvement.
### Example 2: Patient Identifier Validation in Healthcare
**Scenario:** In a hospital information system, patient identifiers must remain consistent across the admission system (ADT), electronic medical records (EMR), laboratory information system (LIS), and billing system. Inconsistent identifiers can lead to medical errors, billing problems, and regulatory compliance issues.
**Settings:**
- New Attribute Name: Patient_ID_Consistent
- Case Column Names: ADT_Patient_ID, EMR_Patient_ID, LIS_Patient_ID, Billing_Patient_ID
**Output:**
Creates a boolean attribute "Patient_ID_Consistent" indicating:
- True: When all four system identifiers match (e.g., all show "PT-789456")
- False: When any system has a different identifier, indicating a data synchronization issue
- null: When any system has missing identifier information
Sample data:
| Case_ID | ADT_Patient_ID | EMR_Patient_ID | LIS_Patient_ID | Billing_Patient_ID | Patient_ID_Consistent |
|---------|---------------|---------------|---------------|-------------------|---------------------|
| ADM-101 | PT-789456 | PT-789456 | PT-789456 | PT-789456 | True |
| ADM-102 | PT-445821 | PT-445821 | PT-445821 | PT-445281 | False |
| ADM-103 | PT-223344 | PT-223344 | null | PT-223344 | null |
| ADM-104 | PT-998877 | PT-998877 | PT-998877 | PT-998877 | True |
**Insights:** This validation helps identify master data management issues requiring immediate attention, as inconsistent patient identifiers can lead to serious medical errors. Healthcare organizations can track the percentage of cases with consistent identifiers across systems, prioritize system integration improvements, and ensure regulatory compliance for patient data management. False results trigger data reconciliation workflows, while null results indicate incomplete registration processes.
### Example 3: Product Specification Consistency in Manufacturing
**Scenario:** In a manufacturing environment, product specifications must align across engineering design documents, production planning systems, and quality control databases to ensure products meet requirements. Inconsistencies can result in production of non-conforming products or unnecessary production delays.
**Settings:**
- New Attribute Name: Spec_Consistent_All_Systems
- Case Column Names: Design_Material_Grade, Planning_Material_Grade, QC_Required_Grade
**Output:**
Creates a boolean attribute "Spec_Consistent_All_Systems" showing:
- True: When all three systems specify the same material grade (e.g., all specify "Grade_A_Premium")
- False: When any system has different specifications (e.g., Design specifies "Grade_A_Premium" but Planning shows "Grade_A_Standard")
- null: When specification data is missing from any system
Sample data:
| Production_Order | Design_Material_Grade | Planning_Material_Grade | QC_Required_Grade | Spec_Consistent_All_Systems |
|-----------------|----------------------|------------------------|------------------|---------------------------|
| WO-5001 | Grade_A_Premium | Grade_A_Premium | Grade_A_Premium | True |
| WO-5002 | Grade_B_Standard | Grade_B_Standard | Grade_A_Premium | False |
| WO-5003 | Grade_C_Economic | null | Grade_C_Economic | null |
| WO-5004 | Grade_A_Premium | Grade_A_Premium | Grade_A_Premium | True |
**Insights:** This comparison enables early detection of specification inconsistencies before production begins, preventing quality issues and material waste. Manufacturing organizations can measure the rate of specification alignment across systems, identify specific products or product families with frequent inconsistencies, and improve engineering change management processes. False results trigger specification review workflows to resolve conflicts before production starts.
### Example 4: Customer Data Synchronization Across Systems
**Scenario:** In an enterprise with multiple customer-facing systems, customer email addresses must be synchronized across the CRM system, e-commerce platform, email marketing system, and customer service portal to ensure consistent communication and accurate customer records.
**Settings:**
- New Attribute Name: Customer_Email_Synchronized
- Case Column Names: CRM_Email, Ecommerce_Email, Marketing_Email, Support_Email
**Output:**
Creates a boolean attribute "Customer_Email_Synchronized" with:
- True: When all systems have the same email address (e.g., all show "customer@example.com")
- False: When email addresses differ across systems, indicating synchronization issues
- null: When email address is missing from any system
Sample data:
| Customer_ID | CRM_Email | Ecommerce_Email | Marketing_Email | Support_Email | Customer_Email_Synchronized |
|-------------|--------------------|--------------------|--------------------|--------------------|---------------------------|
| CUST-1001 | john@example.com | john@example.com | john@example.com | john@example.com | True |
| CUST-1002 | mary@company.com | mary@company.com | mary@oldmail.com | mary@company.com | False |
| CUST-1003 | bob@business.net | bob@business.net | null | bob@business.net | null |
| CUST-1004 | lisa@enterprise.io | lisa@enterprise.io | lisa@enterprise.io | lisa@enterprise.io | True |
**Insights:** This validation helps identify customers with inconsistent contact information who may miss important communications or receive duplicate messages. Organizations can calculate data synchronization rates across systems, prioritize master data management improvements, and reduce customer service issues caused by outdated contact information. False results trigger data synchronization workflows, while null results indicate incomplete customer profiles.
### Example 5: Financial Approval Amounts Alignment
**Scenario:** In a purchase requisition and approval process, the requested amount must remain consistent as it flows through multiple approval levels and systems to prevent unauthorized amount changes and ensure financial controls are functioning correctly.
**Settings:**
- New Attribute Name: Approval_Amounts_Aligned
- Case Column Names: Requisition_Amount, L1_Approval_Amount, L2_Approval_Amount, PO_Final_Amount
**Output:**
Creates a boolean attribute "Approval_Amounts_Aligned" indicating:
- True: When all approval levels show the same amount (e.g., all show 15,000.00)
- False: When amounts differ across approval stages, indicating unauthorized changes
- null: When amount data is missing from any stage
Sample data:
| Requisition_ID | Requisition_Amount | L1_Approval_Amount | L2_Approval_Amount | PO_Final_Amount | Approval_Amounts_Aligned |
|---------------|-------------------|-------------------|-------------------|-----------------|------------------------|
| REQ-2001 | 15000.00 | 15000.00 | 15000.00 | 15000.00 | True |
| REQ-2002 | 8500.00 | 8500.00 | 8750.00 | 8750.00 | False |
| REQ-2003 | 22000.00 | 22000.00 | null | 22000.00 | null |
| REQ-2004 | 5000.00 | 5000.00 | 5000.00 | 5200.00 | False |
**Insights:** This comparison ensures financial control integrity by detecting unauthorized amount changes during the approval workflow. Organizations can identify cases where amounts were modified without proper authorization, investigate approval process compliance, and strengthen financial controls. False results trigger immediate investigation for potential fraud or process violations, while a high rate of True results confirms that financial controls are functioning as designed.
## Output
The Compare Multiple Case Attributes enrichment creates a single new boolean case attribute with the name specified in the settings. This attribute contains True when all compared attributes have identical values, False when any attribute differs from the others, and null when any attribute contains a null value. The comparison is performed for each case independently.
The enrichment uses a sequential comparison algorithm that compares the first attribute against each subsequent attribute. All values must match exactly, including data type and format. The result is:
- **True:** All selected attributes contain identical non-null values
- **False:** At least one attribute has a different value (but all compared attributes are non-null)
- **null:** One or more attributes contain null values, indicating incomplete data
The boolean attribute can be displayed in different formats depending on your visualization preferences - as True/False, Yes/No, 1/0, or with custom labels. This attribute integrates seamlessly with other mindzieStudio features:
- **Filtering:** Filter cases to show only complete matches (True), any mismatches (False), or incomplete data (null)
- **Conformance Analysis:** Calculate the percentage of cases with perfect multi-attribute alignment versus those with discrepancies
- **Process Flows:** Create different process paths based on whether all attributes match
- **Calculators:** Use in logical expressions for complex validation rules, such as "(Three_Way_Match_Quantity = True) AND (Amount < 10000)"
- **Dashboards:** Create KPIs showing match rates, trend analysis of data quality over time, and identify systems with frequent inconsistencies
- **Data Quality Monitoring:** Track null results to identify data completeness issues requiring investigation
The enrichment is particularly effective when combined with other comparison enrichments to build comprehensive validation hierarchies. For example, you might first use Compare Multiple Case Attributes to check if three quantity fields match, then use a separate comparison to validate that matched quantities also meet a threshold requirement.
## See Also
- **Compare Case Attributes:** For simple two-attribute equality comparisons when only two values need validation
- **Logical AND:** Combine multiple comparison results when building complex validation rules
- **Logical OR:** Create flexible validation rules where at least one comparison must be true
- **Categorize Attribute Values:** Group cases based on multi-attribute comparison results for analysis
- **Filter Cases:** Remove cases from analysis based on multi-attribute validation outcomes
---
*This documentation is part of the mindzie Studio process mining platform.*
---
## Concatenate Attributes
Section: Enrichments
URL: https://docs.mindziestudio.com/mindzie_studio/enrichments/concatenate-attributes
Source: /docs-master/mindzieStudio/enrichments/concatenate-attributes/page.md
# Concatenate Attributes
## Overview
The Concatenate Attributes enrichment combines multiple attribute values into a single text string, creating a new attribute that represents the joined values. This powerful text manipulation operator enables you to create composite identifiers, generate descriptive labels, and build meaningful text representations from multiple data fields. The enrichment intelligently handles both case and event attributes, automatically determining the appropriate level for the new concatenated attribute based on the source attributes selected.
In process mining, the ability to combine attribute values is essential for creating unique identifiers, building human-readable descriptions, and establishing relationships between different data elements. The Concatenate Attributes enrichment uses a pipe separator (" | ") between values, ensuring clear visual distinction while maintaining readability. When attributes have no value, the enrichment substitutes "No Value" to maintain consistent formatting and prevent confusion from empty segments. This approach makes the enrichment particularly valuable for creating audit trails, composite keys for matching operations, and comprehensive case descriptions that combine multiple business dimensions.
## Common Uses
- Create composite keys by combining multiple identifier fields (Order_ID + Line_Number)
- Generate descriptive labels that combine category and subcategory information
- Build full names from separate first name, middle name, and last name attributes
- Construct location identifiers by combining region, country, and city attributes
- Create audit descriptions that combine user, timestamp, and action attributes
- Assemble product descriptions from brand, model, and variant attributes
- Generate case summaries by combining status, priority, and category fields
## Settings
**Filter (Optional):** Apply filters to limit which cases receive the concatenated attribute. When filters are applied, only cases matching the filter criteria will have the concatenation performed. This is useful when you want to create composite values only for specific subsets of your data, such as cases from certain departments or time periods. The filter operates at the case level, even when concatenating event attributes.
**New Attribute Name:** Specify the name for the new attribute that will store the concatenated result. Choose a descriptive name that clearly indicates what information is being combined. For example, use "Full_Product_Description" when concatenating product attributes, or "Complete_Address" when joining location fields. The name must be unique and cannot conflict with existing attributes in your dataset.
**Attribute Names:** Select multiple attributes whose values you want to concatenate together. The enrichment will join all selected attributes in the order they are selected, using " | " as the separator. You can select any combination of string, numeric, or boolean attributes. The enrichment supports both case attributes and event attributes, though all selected attributes should typically be at the same level for meaningful results. Numeric and boolean values are automatically converted to text for concatenation.
## Examples
### Example 1: Creating Composite Purchase Order Identifiers
**Scenario:** In a procurement process, you need to create unique identifiers that combine the vendor code, purchase order number, and fiscal year to ensure global uniqueness across multiple systems and time periods.
**Settings:**
- Filter: None (apply to all cases)
- New Attribute Name: PO_Composite_ID
- Attribute Names: Vendor_Code, PO_Number, Fiscal_Year
**Output:**
Creates a new case attribute "PO_Composite_ID" containing the concatenated values. For a case with:
- Vendor_Code: "SUPP-0247"
- PO_Number: "PO-2024-8831"
- Fiscal_Year: 2024
The PO_Composite_ID would be: "SUPP-0247 | PO-2024-8831 | 2024"
**Insights:** This composite identifier enables unique tracking across systems, simplifies matching with external data sources, and provides a human-readable reference that includes all key identifying information in a single field.
### Example 2: Building Complete Customer Addresses
**Scenario:** In a delivery process, you need to combine separate address components into a single field for routing optimization and delivery documentation purposes.
**Settings:**
- Filter: None
- New Attribute Name: Full_Delivery_Address
- Attribute Names: Street_Address, City, State, Postal_Code, Country
**Output:**
Creates a new case attribute "Full_Delivery_Address" with all address components. For a case with:
- Street_Address: "123 Main Street"
- City: "Springfield"
- State: "IL"
- Postal_Code: "62701"
- Country: "USA"
The Full_Delivery_Address would be: "123 Main Street | Springfield | IL | 62701 | USA"
**Insights:** The complete address string simplifies geographic analysis, enables easier integration with mapping services, and provides delivery teams with all location information in a single, readable field.
### Example 3: Creating Product Description Labels
**Scenario:** In an inventory management process, you want to create comprehensive product descriptions by combining brand, category, model, and color attributes for improved searchability and reporting.
**Settings:**
- Filter: Category = "Electronics"
- New Attribute Name: Product_Full_Description
- Attribute Names: Brand, Product_Category, Model_Number, Color, Size
**Output:**
Creates a new case attribute "Product_Full_Description" for electronic items. For a case with:
- Brand: "TechCorp"
- Product_Category: "Laptop"
- Model_Number: "X500-PRO"
- Color: "Silver"
- Size: "15-inch"
The Product_Full_Description would be: "TechCorp | Laptop | X500-PRO | Silver | 15-inch"
If the Color attribute is missing, it would show: "TechCorp | Laptop | X500-PRO | No Value | 15-inch"
**Insights:** These consolidated descriptions improve product searchability, enable better categorization in reports, and provide complete product information for customer service representatives in a single field.
### Example 4: Building Audit Trail Descriptions
**Scenario:** In a financial approval process, you need to create comprehensive audit entries that combine the approver name, approval timestamp, department, and decision for compliance tracking.
**Settings:**
- Filter: Process_Step = "Approval"
- New Attribute Name: Approval_Audit_Entry
- Attribute Names: Approver_Name, Approval_Date, Department, Decision, Amount_Approved
**Output:**
Creates a new case attribute "Approval_Audit_Entry" for approval steps. For a case with:
- Approver_Name: "John Smith"
- Approval_Date: "2024-03-15"
- Department: "Finance"
- Decision: "Approved"
- Amount_Approved: 50000
The Approval_Audit_Entry would be: "John Smith | 2024-03-15 | Finance | Approved | 50000"
**Insights:** This consolidated audit trail simplifies compliance reporting, enables quick review of approval patterns, and provides complete approval context in a single searchable field.
### Example 5: Creating Location-Based Service Identifiers
**Scenario:** In a healthcare process, you need to combine facility, department, and room information to create unique location identifiers for patient routing and resource allocation.
**Settings:**
- Filter: None
- New Attribute Name: Service_Location_ID
- Attribute Names: Facility_Name, Building, Department, Room_Number
**Output:**
Creates a new case attribute "Service_Location_ID" with complete location information. For a case with:
- Facility_Name: "Central Medical Center"
- Building: "Tower B"
- Department: "Radiology"
- Room_Number: "B-201"
The Service_Location_ID would be: "Central Medical Center | Tower B | Radiology | B-201"
**Insights:** These location identifiers streamline patient navigation, improve resource planning by location, and enable analysis of service patterns across different facility areas.
## Output
The Concatenate Attributes enrichment creates a single new attribute at either the case or event level, depending on the source attributes selected. If all selected attributes are case attributes, the new concatenated attribute is created at the case level. If any selected attribute is an event attribute, the new attribute is created at the event level to preserve the granularity of the event data.
The output attribute is always of type String and contains the concatenated values separated by " | " (space-pipe-space). This separator ensures visual clarity while being unlikely to appear naturally in most business data. When an attribute value is null or missing, the enrichment substitutes "No Value" in that position, maintaining the structure and making it clear which attributes had no data.
The concatenated values maintain their original formatting - numbers remain in their numeric format, dates retain their display format, and boolean values appear as "True" or "False". This preservation of formatting ensures that the concatenated result remains readable and meaningful for business users while maintaining data integrity for downstream processing.
---
*This documentation is part of the mindzie Studio process mining platform.*
---
## Conformance Issue
Section: Enrichments
URL: https://docs.mindziestudio.com/mindzie_studio/enrichments/conformance-issue
Source: /docs-master/mindzieStudio/enrichments/conformance-issue/page.md
# Conformance Issue
## Overview
The Conformance Issue enrichment is a powerful and flexible tool that allows you to define custom conformance rules using the full mindzieStudio filter engine. Unlike specialized conformance enrichments that check for specific conditions (such as allowed start activities or mandatory activities), this enrichment gives you complete control to define any conformance issue based on case attributes, duration thresholds, activity patterns, or any other filterable criteria.
This enrichment serves as the foundation for building a comprehensive conformance checking framework tailored to your organization's specific business rules and process requirements. It enables you to identify process deviations, policy violations, and compliance issues by creating rule-based checks that flag cases matching your defined criteria. Each conformance issue can be categorized by severity, organized into rule groups, and tracked across your entire process landscape.
The flexibility of this enrichment makes it essential for organizations implementing process compliance monitoring, audit trails, and continuous process improvement initiatives. By combining multiple filter conditions, you can model complex business rules and regulatory requirements that reflect real-world process governance needs.
## Common Uses
- Detect SLA violations by flagging cases where duration between critical activities exceeds defined thresholds
- Identify unauthorized process variations where specific user roles perform activities outside their permitted scope
- Monitor approval bypass scenarios where cases skip required authorization steps based on attribute values
- Track financial policy violations such as purchase orders exceeding approval limits without proper oversight
- Flag data quality issues where mandatory case attributes are missing or contain invalid values
- Detect segregation of duties violations where the same user performs conflicting activities
- Identify cases with abnormal resource allocation patterns that may indicate process inefficiencies
- Monitor compliance with regulatory requirements by flagging cases that violate specific business rules
- Track process deviations from standard operating procedures based on activity sequences and timing
- Identify high-risk cases that require additional review based on multiple combined criteria
## Settings
**Filters:** The core of this enrichment is the filter configuration. You can add one or more filters using mindzieStudio's comprehensive filter engine to define exactly which cases represent conformance issues. Filters can be based on case attributes, activity attributes, duration calculations, or any other data available in your event log. Multiple filters are combined using AND/OR logic to create sophisticated rule definitions. At least one filter must be configured for the enrichment to function.
**Rule Name:** The name of the case attribute that will be created to track this specific conformance issue. When a case matches your filter criteria, this attribute will be set to TRUE, indicating a conformance violation. If left empty, only the Rule Group Name will be used. Use descriptive names that clearly identify the type of conformance issue being detected, such as "Late Approval Detected" or "Missing Manager Authorization". This attribute appears in your case table and can be used in subsequent filters, calculations, and visualizations.
**Rule Group Name:** A higher-level categorization that allows you to group related conformance rules together. For example, you might create multiple individual rules for different SLA violations but group them all under "SLA Compliance Issues". When a case matches the criteria, both the Rule Name and Rule Group Name attributes are set to TRUE. This hierarchical structure enables better organization of conformance issues and facilitates reporting at different levels of granularity. At least one of Rule Name or Rule Group Name must be specified.
**Severity:** The importance level of this conformance issue, which can be set to Low, Medium, or High. The default severity is High. This setting helps prioritize which conformance issues require immediate attention versus those that are informational. Severity levels appear in conformance analysis dashboards and reports, enabling teams to focus on the most critical process deviations first. High severity issues might trigger immediate alerts or escalations, while low severity issues may be reviewed periodically.
**Control Flow Issue:** A checkbox that indicates whether this conformance issue relates specifically to the sequence or presence of activities (the control flow) rather than case attribute values or other data-related problems. When enabled, this flag helps categorize the conformance issue as a process execution problem versus a data quality or business rule violation. This distinction is valuable for root cause analysis and determining whether process redesign or improved training is needed. Leave unchecked for conformance issues based on attribute values, durations, or other non-activity-sequence criteria.
## Examples
### Example 1: Purchase Order SLA Violation
**Scenario:** A procurement organization has a policy requiring all purchase orders over $10,000 to be approved within 5 business days (120 hours) from submission. Orders that exceed this threshold represent SLA violations that need to be flagged and escalated to procurement management for review.
**Settings:**
- **Filters:**
- Case Attribute: "Order Amount" Greater Than 10000 (AND)
- Case Attribute: "Time from Submit PO to Approve PO" Greater Than 120 hours
- **Rule Name:** "PO Approval SLA Violation"
- **Rule Group Name:** "SLA Compliance Issues"
- **Severity:** High
- **Control Flow Issue:** Unchecked (this is a timing issue, not an activity sequence issue)
**Output:**
The enrichment creates two new Boolean case attributes: "PO Approval SLA Violation" and "SLA Compliance Issues". For cases where both conditions are met (order amount exceeds $10,000 AND approval time exceeds 120 hours), both attributes are set to TRUE. All other cases have these attributes set to FALSE.
Sample data after enrichment:
| Case ID | Order Amount | Time from Submit to Approve | PO Approval SLA Violation | SLA Compliance Issues |
|---------|--------------|----------------------------|---------------------------|----------------------|
| PO-1001 | $12,500 | 145 hours | TRUE | TRUE |
| PO-1002 | $8,000 | 150 hours | FALSE | FALSE |
| PO-1003 | $15,000 | 95 hours | FALSE | FALSE |
| PO-1004 | $25,000 | 168 hours | TRUE | TRUE |
**Insights:** This conformance check identified 2 out of 4 purchase orders that violated the approval SLA policy. Management can filter on these cases to understand why delays occurred and implement corrective actions. The high severity designation ensures these cases are prioritized in dashboard reviews.
### Example 2: Segregation of Duties Violation
**Scenario:** In a financial system, internal controls require that the person who creates an invoice cannot be the same person who approves payment. This segregation of duties prevents fraud and ensures proper oversight. Cases where the same user performs both activities represent serious compliance violations.
**Settings:**
- **Filters:**
- Case Attribute: "Create Invoice User" Equals Case Attribute "Approve Payment User"
- **Rule Name:** "Same User Created and Approved"
- **Rule Group Name:** "Segregation of Duties Violations"
- **Severity:** High
- **Control Flow Issue:** Unchecked (this is about user attributes, not activity sequence)
**Output:**
Two Boolean case attributes are created. When the same user ID appears in both the "Create Invoice User" and "Approve Payment User" attributes, both "Same User Created and Approved" and "Segregation of Duties Violations" are flagged as TRUE.
Sample data:
| Case ID | Create Invoice User | Approve Payment User | Same User Created and Approved | Segregation of Duties Violations |
|---------|---------------------|---------------------|-------------------------------|----------------------------------|
| INV-501 | jsmith | jdoe | FALSE | FALSE |
| INV-502 | mbrown | mbrown | TRUE | TRUE |
| INV-503 | kwilson | jdoe | FALSE | FALSE |
| INV-504 | rjones | rjones | TRUE | TRUE |
**Insights:** This conformance rule identified critical internal control violations that require immediate investigation. The audit team can review these cases to determine whether they represent intentional fraud, system configuration errors, or gaps in user training. This type of check is essential for regulatory compliance in financial processes.
### Example 3: Missing Mandatory Documentation
**Scenario:** A healthcare provider requires that all patient discharge cases include documentation of follow-up care instructions. Cases missing this documentation represent both a compliance issue and a patient safety concern. The organization uses a case attribute "Follow-up Instructions Provided" that should always be "Yes" for discharged patients.
**Settings:**
- **Filters:**
- Case Attribute: "Case Status" Equals "Discharged" (AND)
- Case Attribute: "Follow-up Instructions Provided" Not Equals "Yes"
- **Rule Name:** "Missing Follow-up Instructions"
- **Rule Group Name:** "Documentation Compliance"
- **Severity:** High
- **Control Flow Issue:** Unchecked (this is about data completeness, not activity flow)
**Output:**
The enrichment creates two Boolean attributes that flag discharged cases lacking proper documentation. Cases marked TRUE require immediate remediation to ensure patients receive proper care instructions.
Sample data:
| Case ID | Case Status | Follow-up Instructions Provided | Missing Follow-up Instructions | Documentation Compliance |
|---------|-------------|--------------------------------|-------------------------------|-------------------------|
| PT-2001 | Discharged | Yes | FALSE | FALSE |
| PT-2002 | Discharged | NULL | TRUE | TRUE |
| PT-2003 | Active | NULL | FALSE | FALSE |
| PT-2004 | Discharged | No | TRUE | TRUE |
**Insights:** This check identified 2 discharged patients who did not receive documented follow-up instructions. The quality improvement team can contact these patients immediately to provide missing instructions and investigate why the documentation step was skipped. This type of conformance monitoring is critical for patient safety and regulatory compliance.
### Example 4: Unauthorized Discount Application
**Scenario:** A retail organization has a policy that discounts over 15% require manager approval. Sales representatives are allowed to apply discounts up to 15% without approval, but higher discounts must go through an approval activity. Cases with discounts exceeding 15% that don't include a "Manager Approves Discount" activity represent policy violations.
**Settings:**
- **Filters:**
- Case Attribute: "Discount Percentage" Greater Than 15 (AND)
- Case Attribute: "Has Manager Approval Activity" Equals FALSE
- **Rule Name:** "Unauthorized High Discount"
- **Rule Group Name:** "Authorization Policy Violations"
- **Severity:** Medium
- **Control Flow Issue:** Checked (this relates to a missing activity in the process flow)
**Output:**
Two Boolean attributes identify cases where sales representatives applied unauthorized high discounts. These cases require review to determine whether the discount was justified and whether the sales representative needs additional training on approval requirements.
Sample data:
| Case ID | Discount Percentage | Has Manager Approval Activity | Unauthorized High Discount | Authorization Policy Violations |
|---------|-------------------|------------------------------|---------------------------|--------------------------------|
| ORD-701 | 12% | FALSE | FALSE | FALSE |
| ORD-702 | 20% | TRUE | FALSE | FALSE |
| ORD-703 | 25% | FALSE | TRUE | TRUE |
| ORD-704 | 18% | FALSE | TRUE | TRUE |
**Insights:** Two orders received unauthorized discounts exceeding the 15% threshold. Management can review these specific transactions to understand whether system controls need strengthening or whether additional training is needed. The medium severity indicates these should be reviewed but may not require immediate escalation like financial fraud cases.
### Example 5: Complex Multi-Condition Compliance Rule
**Scenario:** A pharmaceutical manufacturing process has a complex compliance requirement: any batch with a production duration over 48 hours AND a temperature deviation recorded AND processed by a temporary operator must undergo additional quality review. This multi-factor rule identifies high-risk batches requiring enhanced scrutiny.
**Settings:**
- **Filters:**
- Case Attribute: "Production Duration Hours" Greater Than 48 (AND)
- Case Attribute: "Temperature Deviation Recorded" Equals "Yes" (AND)
- Case Attribute: "Primary Operator Type" Equals "Temporary"
- **Rule Name:** "Enhanced Quality Review Required"
- **Rule Group Name:** "Manufacturing Compliance"
- **Severity:** High
- **Control Flow Issue:** Unchecked (this is about multiple risk factors, not activity sequence)
**Output:**
The enrichment creates Boolean attributes that flag batches meeting all three high-risk criteria. These batches are automatically routed for enhanced quality review procedures before release.
Sample data:
| Case ID | Production Duration | Temperature Deviation | Operator Type | Enhanced Quality Review Required | Manufacturing Compliance |
|---------|--------------------|-----------------------|---------------|----------------------------------|-------------------------|
| BATCH-A | 52 hours | Yes | Temporary | TRUE | TRUE |
| BATCH-B | 45 hours | Yes | Temporary | FALSE | FALSE |
| BATCH-C | 55 hours | No | Temporary | FALSE | FALSE |
| BATCH-D | 60 hours | Yes | Permanent | FALSE | FALSE |
**Insights:** Only batches meeting all three conditions are flagged. This demonstrates how the Conformance Issue enrichment can model sophisticated compliance rules that reflect real-world risk assessment. The high severity ensures quality assurance teams prioritize these cases for enhanced testing and documentation review.
## Output
When the Conformance Issue enrichment is executed, it creates one or two new Boolean case attributes depending on your configuration:
**Rule Name Attribute (if specified):** A Boolean case attribute with the exact name you provided in the "Rule Name" setting. This attribute is set to:
- **TRUE**: For cases that match all filter criteria defined in the enrichment (conformance issue detected)
- **FALSE**: For all other cases (no conformance issue)
**Rule Group Name Attribute (if specified):** A Boolean case attribute with the name you provided in "Rule Group Name". This attribute follows the same TRUE/FALSE logic as the Rule Name attribute and allows you to group multiple related conformance rules under a common category.
**Column Type:** Both attributes are created with the column type "ConformanceIssue", which identifies them as compliance-related attributes in the mindzieStudio interface. They are displayed with a "YesNo" format for easy interpretation.
**Initial Values:** When the attributes are first created, all cases are initialized with a FALSE value. The enrichment then evaluates each case against the filter criteria and updates matching cases to TRUE.
**Conformance Issue Registration:** In addition to creating case attributes, the enrichment registers the conformance issue in mindzieStudio's conformance tracking system. This registration includes:
- The source of the issue (marked as "Rule" to indicate it comes from a user-defined rule)
- The severity level (Low, Medium, or High)
- The rule name and rule group name for categorization
- The control flow flag indicating whether this is an activity sequence issue
- A unique conformance issue identifier used for tracking and reporting
**Integration with Other Features:** The Boolean attributes created by this enrichment can be used immediately in:
- **Filters:** Create views showing only cases with specific conformance issues
- **Dashboards:** Build conformance monitoring dashboards showing counts and trends of issues
- **Calculations:** Use conformance attributes in mathematical calculations or conditional logic
- **Subsequent Enrichments:** Base additional enrichments on whether conformance issues exist
- **Exports:** Include conformance flags in exported datasets for external analysis
- **Case Stage Calculators:** Use conformance status to drive case routing and prioritization
**Conformance Analysis:** The registered conformance issues appear in mindzieStudio's conformance analysis tools, where you can:
- View counts of cases affected by each conformance issue
- Analyze trends over time to see if issues are increasing or decreasing
- Compare severity distributions across different rule groups
- Drill down into specific cases to understand root causes
- Generate compliance reports for management and auditors
## See Also
**Related Conformance Enrichments:**
- [Allowed Case Start Activities](/mindzie_studio/enrichments/allowed-case-start-activities) - Define allowed starting activities for cases
- [Allowed Case End Activities](/mindzie_studio/enrichments/allowed-case-end-activities) - Define allowed ending activities for cases
- [Repeated Activity](/mindzie_studio/enrichments/repeated-activity) - Detect repeated activity executions
- [Wrong Activity Order](/mindzie_studio/enrichments/wrong-activity-order) - Identify incorrect activity sequences
- Mandatory Activity - Ensure required activities are performed
**Related Topics:**
- Conformance Checking - Overview of conformance analysis in mindzieStudio
- Filter Engine - Understanding how to build complex filter conditions
- Case Attributes - Working with case-level data in process mining
- Severity Levels - How to use severity for prioritization in process analysis
---
*This documentation is part of the mindzie Studio process mining platform.*
---
## Convert Currency To Base
Section: Enrichments
URL: https://docs.mindziestudio.com/mindzie_studio/enrichments/convert-currency-to-base
Source: /docs-master/mindzieStudio/enrichments/convert-currency-to-base/page.md
# Convert Currency To Base
## Overview
The Convert Currency To Base enrichment enables multi-currency data consolidation by converting monetary values from various currencies into a single base currency. This enrichment is essential for organizations that operate across multiple countries or deal with international transactions, as it normalizes financial data for accurate analysis and comparison. By transforming all monetary amounts to a common currency, you can perform meaningful aggregations, comparisons, and financial analysis across your entire process landscape without the distortions caused by currency differences.
This enrichment works by examining each case or event that contains both a monetary amount and a currency identifier, then applying the appropriate exchange rate to convert the amount to your chosen base currency. The conversion creates a new attribute containing the standardized value while preserving the original amount and currency information. This approach is particularly valuable in global procurement, international sales, cross-border logistics, and any process involving multi-currency transactions where you need a unified view of financial metrics.
## Common Uses
- Consolidate international sales data into a single reporting currency for global revenue analysis
- Standardize procurement costs from multiple countries for total spend analysis
- Compare process costs across different geographic regions with local currencies
- Calculate total financial impact of global operations in headquarters' reporting currency
- Analyze cross-border transaction values in a consistent currency for benchmarking
- Normalize invoice amounts from international suppliers for accounts payable processing
- Create unified financial dashboards that aggregate data from multiple currency zones
## Settings
**Attribute Name:** Select the numeric attribute containing the monetary amount you want to convert. This must be a numeric field (integer or decimal) that represents a financial value. Common examples include Invoice_Amount, Order_Value, Cost, Payment_Amount, or any other monetary field in your dataset. The original attribute values are preserved, and the converted values are stored in a new attribute.
**Currency Attribute Name:** Specify the attribute that contains the currency code for each amount. This attribute should contain standard currency codes like "USD", "EUR", "GBP", "JPY", etc. The enrichment uses this field to determine which exchange rate to apply for each case or event. This attribute must exist in the same scope (case or event level) as the amount attribute.
**New Currency:** Enter the target base currency code that all amounts will be converted to. This should be a standard three-letter currency code such as "USD" for US Dollars, "EUR" for Euros, or your organization's reporting currency. All monetary values will be converted to this currency using the appropriate exchange rates configured in your mindzie instance.
**New Attribute Name:** Provide a name for the new attribute that will store the converted currency values. Choose a descriptive name that clearly indicates the values are in base currency, such as "Amount_USD", "Value_Base_Currency", or "Converted_Amount". This new attribute will be created at the same level (case or event) as the original amount attribute.
**New Attribute Description (Optional):** Add an optional description for the new attribute to help other users understand its purpose and calculation method. For example: "Invoice amount converted to USD base currency" or "Order value in company reporting currency (EUR)". This description appears in attribute tooltips and documentation.
## Examples
### Example 1: Global Sales Consolidation
**Scenario:** A multinational company processes orders from customers worldwide in local currencies and needs to analyze total revenue in US Dollars for corporate reporting.
**Settings:**
- Attribute Name: Order_Total
- Currency Attribute Name: Customer_Currency
- New Currency: USD
- New Attribute Name: Order_Total_USD
- New Attribute Description: Order total amount converted to USD for global revenue reporting
**Output:**
The enrichment creates a new case attribute "Order_Total_USD" with converted values:
| Case_ID | Order_Total | Customer_Currency | Order_Total_USD |
|---------|------------|-------------------|-----------------|
| ORD-001 | 1000.00 | EUR | 1095.00 |
| ORD-002 | 85000.00 | JPY | 780.50 |
| ORD-003 | 750.00 | GBP | 952.50 |
| ORD-004 | 500.00 | USD | 500.00 |
**Insights:** With all orders converted to USD, the company can now accurately calculate total global revenue ($3,328.00), compare sales performance across regions, and identify top markets regardless of local currency fluctuations.
### Example 2: International Procurement Analysis
**Scenario:** A manufacturing company sources materials from suppliers in different countries and needs to analyze total procurement spend in Euros for budgeting and cost control.
**Settings:**
- Attribute Name: Invoice_Amount
- Currency Attribute Name: Supplier_Currency
- New Currency: EUR
- New Attribute Name: Invoice_Amount_EUR
- New Attribute Description: Supplier invoice amount in EUR base currency
**Output:**
Creates "Invoice_Amount_EUR" for procurement analysis:
| Case_ID | Supplier_Country | Invoice_Amount | Supplier_Currency | Invoice_Amount_EUR |
|---------|-----------------|----------------|-------------------|-------------------|
| INV-101 | China | 50000.00 | CNY | 6580.00 |
| INV-102 | USA | 12000.00 | USD | 10950.00 |
| INV-103 | India | 800000.00 | INR | 8900.00 |
| INV-104 | Germany | 15000.00 | EUR | 15000.00 |
**Insights:** The procurement team can now accurately track total spend (41,430 EUR), compare supplier costs fairly, and make informed sourcing decisions based on true cost comparisons.
### Example 3: Cross-Border Payment Processing
**Scenario:** A payment processing company handles transactions in multiple currencies and needs to calculate daily settlement amounts in British Pounds for reconciliation.
**Settings:**
- Attribute Name: Transaction_Amount
- Currency Attribute Name: Transaction_Currency
- New Currency: GBP
- New Attribute Name: Amount_GBP
- New Attribute Description: Transaction amount converted to GBP for daily settlement
**Output:**
For each payment transaction, creates "Amount_GBP":
| Transaction_ID | Transaction_Amount | Transaction_Currency | Amount_GBP |
|---------------|-------------------|---------------------|------------|
| TXN-5001 | 250.00 | USD | 197.50 |
| TXN-5002 | 300.00 | EUR | 258.00 |
| TXN-5003 | 40000.00 | JPY | 295.00 |
| TXN-5004 | 150.00 | GBP | 150.00 |
**Insights:** The payment processor can calculate accurate daily settlement totals (900.50 GBP), monitor transaction volumes across currencies, and identify currency exposure risks.
### Example 4: Multi-Currency Expense Reporting
**Scenario:** A consulting firm needs to consolidate employee expense reports submitted in various currencies for client billing in Australian Dollars.
**Settings:**
- Attribute Name: Expense_Amount
- Currency Attribute Name: Expense_Currency
- New Currency: AUD
- New Attribute Name: Expense_AUD
- New Attribute Description: Employee expense converted to AUD for client billing
**Output:**
Converts all expense items to AUD:
| Expense_ID | Employee | Expense_Amount | Expense_Currency | Expense_AUD |
|------------|-----------|----------------|------------------|-------------|
| EXP-801 | John Smith | 500.00 | USD | 765.00 |
| EXP-802 | Maria Lee | 350.00 | EUR | 560.00 |
| EXP-803 | Tom Brown | 200.00 | SGD | 225.00 |
| EXP-804 | Sarah Chen | 400.00 | AUD | 400.00 |
**Insights:** The firm can now accurately bill clients for total project expenses (1,950 AUD), track spending patterns across global projects, and ensure proper expense reimbursement.
### Example 5: Healthcare Equipment Cost Analysis
**Scenario:** A hospital network purchasing medical equipment from international suppliers needs to analyze total equipment costs in their local currency (Canadian Dollars) for budget planning.
**Settings:**
- Attribute Name: Equipment_Cost
- Currency Attribute Name: Vendor_Currency
- New Currency: CAD
- New Attribute Name: Equipment_Cost_CAD
- New Attribute Description: Medical equipment cost in CAD for budget analysis
**Output:**
Standardizes equipment costs to CAD:
| Purchase_ID | Equipment_Type | Equipment_Cost | Vendor_Currency | Equipment_Cost_CAD |
|-------------|---------------|----------------|-----------------|-------------------|
| PUR-901 | MRI Scanner | 1500000.00 | USD | 2025000.00 |
| PUR-902 | Ventilator | 45000.00 | EUR | 65250.00 |
| PUR-903 | X-Ray System | 8000000.00 | JPY | 95200.00 |
| PUR-904 | Ultrasound | 35000.00 | GBP | 60900.00 |
**Insights:** Hospital administrators can accurately assess total equipment investment (2,246,350 CAD), compare vendor pricing across countries, and make informed procurement decisions within budget constraints.
## Output
The Convert Currency To Base enrichment creates a new numeric attribute at either the case or event level, depending on where your original amount attribute exists. The new attribute contains the monetary values converted to your specified base currency using the exchange rates configured in your mindzie system.
**Attribute Creation:** The enrichment adds a new column with the name specified in "New Attribute Name". This attribute has the same scope (case or event level) as the original amount attribute. The data type is automatically set to numeric (float) to handle decimal currency values accurately.
**Value Calculation:** For each case or event, the enrichment:
1. Retrieves the original amount from the specified attribute
2. Identifies the source currency from the currency attribute
3. Applies the appropriate exchange rate to convert to the base currency
4. Stores the converted value in the new attribute
**Special Cases:**
- If the source currency matches the target currency, the original value is copied without conversion
- If the amount value is null or missing, the converted value will also be null
- If the currency attribute is null or unrecognized, the original value is preserved without conversion
- The enrichment uses the display format "CurrencyBaseSymbol" to properly format the values with currency symbols
**Data Preservation:** The original amount and currency attributes remain unchanged, allowing you to maintain audit trails and perform additional analysis on the original values when needed.
## See Also
**Related Financial Enrichments:**
- [Multiply](/mindzie_studio/enrichments/multiply) - Scale monetary values or apply conversion factors
- [Divide](/mindzie_studio/enrichments/divide) - Calculate rates or unit costs
- [Add](/mindzie_studio/enrichments/add) - Sum multiple financial attributes
- [Subtract](/mindzie_studio/enrichments/subtract) - Calculate differences or margins
**Related Cleanup Enrichments:**
- [Convert to Integer](/mindzie_studio/enrichments/convert-to-integer) - Round currency values to whole numbers
- [Representative Case Attribute](/mindzie_studio/enrichments/representative-case-attribute) - Standardize currency codes
**Related Topics:**
- Currency Configuration - Setting up exchange rates in mindzie
- Financial Process Mining - Best practices for financial data analysis
- Multi-National Process Analysis - Techniques for cross-border process comparison
---
*This documentation is part of the mindzie Studio process mining platform.*
---
## Convert To Case Attributes
Section: Enrichments
URL: https://docs.mindziestudio.com/mindzie_studio/enrichments/convert-to-case-attributes
Source: /docs-master/mindzieStudio/enrichments/convert-to-case-attributes/page.md
# Convert to Case Attributes
## Overview
The Convert to Case Attributes enrichment is an intelligent data optimization operator that automatically identifies and converts event-level attributes to case-level attributes when their values remain constant throughout each case. This powerful cleanup tool analyzes your entire dataset to find event attributes that never change within a case - such as customer IDs, product categories, or region codes that are unnecessarily repeated at the event level - and elevates them to case attributes for improved performance and cleaner data models.
This enrichment solves a common data quality issue in process mining where source systems export redundant data at the event level, creating bloated datasets and complicating analysis. By automatically detecting and converting these stable attributes to the case level, the enrichment reduces data redundancy, improves query performance, and creates a more logical data structure. The conversion process is completely automatic and requires no configuration, making it an essential first step in data preparation that can significantly reduce dataset size while maintaining all information integrity.
## Common Uses
- Optimize imported ERP data where customer information is repeated in every event but never changes within an order
- Convert static product attributes like category, family, or type from event to case level in manufacturing processes
- Elevate fixed project attributes such as project manager, budget, or department in project management datasets
- Move constant patient demographics like age group, insurance type, or admission type to case level in healthcare data
- Convert stable financial attributes like loan type, interest rate, or branch code in banking process data
- Clean up procurement data by moving vendor information, contract numbers, and payment terms to case level
- Optimize logistics data by converting shipment properties like destination country, service level, or carrier to case attributes
## Settings
This enrichment operates automatically without requiring any configuration. It analyzes all event attributes in your dataset and intelligently determines which ones can be safely converted to case attributes based on value consistency within each case.
## Examples
### Example 1: Optimizing Order Processing Data
**Scenario:** An e-commerce company's order processing system exports data where customer information, shipping details, and order properties are unnecessarily repeated in every event, creating a dataset that's 60% larger than needed.
**Event Data Before Enrichment:**
| Case ID | Activity | Customer_Name | Customer_Region | Order_Priority | Product_Category | Timestamp |
|---------|----------|---------------|-----------------|----------------|------------------|-----------|
| ORD-001 | Create Order | John Smith | North America | High | Electronics | 2024-01-10 08:00 |
| ORD-001 | Verify Payment | John Smith | North America | High | Electronics | 2024-01-10 08:15 |
| ORD-001 | Pick Items | John Smith | North America | High | Electronics | 2024-01-10 09:00 |
| ORD-001 | Ship Order | John Smith | North America | High | Electronics | 2024-01-10 14:00 |
| ORD-002 | Create Order | Jane Doe | Europe | Normal | Clothing | 2024-01-10 08:30 |
| ORD-002 | Verify Payment | Jane Doe | Europe | Normal | Clothing | 2024-01-10 08:45 |
**Case Attributes After Enrichment:**
| Case ID | Customer_Name | Customer_Region | Order_Priority | Product_Category |
|---------|---------------|-----------------|----------------|------------------|
| ORD-001 | John Smith | North America | High | Electronics |
| ORD-002 | Jane Doe | Europe | Normal | Clothing |
**Event Data After Enrichment:**
| Case ID | Activity | Timestamp |
|---------|----------|-----------|
| ORD-001 | Create Order | 2024-01-10 08:00 |
| ORD-001 | Verify Payment | 2024-01-10 08:15 |
| ORD-001 | Pick Items | 2024-01-10 09:00 |
| ORD-001 | Ship Order | 2024-01-10 14:00 |
| ORD-002 | Create Order | 2024-01-10 08:30 |
| ORD-002 | Verify Payment | 2024-01-10 08:45 |
**Output:** The enrichment identified that Customer_Name, Customer_Region, Order_Priority, and Product_Category never change within each case and automatically converted them to case attributes. The event table is now 60% smaller, containing only the essential event-specific information.
**Insights:** After conversion, dashboard queries run 3x faster due to the reduced data volume. Case-level filtering for customer segments and product categories is now more intuitive, and the data model clearly distinguishes between case properties and event details, making it easier for analysts to understand and work with the data.
### Example 2: Healthcare Patient Journey Optimization
**Scenario:** A hospital's patient management system exports admission data where patient demographics, insurance information, and medical classifications are repeated in every treatment event, making the dataset unnecessarily complex and slow to analyze.
**Event Data Before Enrichment:**
| Case ID | Activity | Patient_Age_Group | Insurance_Type | Admission_Type | Department | Diagnosis_Code | Resource |
|---------|----------|------------------|----------------|----------------|------------|---------------|----------|
| PAT-501 | Registration | 45-60 | Private | Emergency | ER | CARD-01 | Nurse Smith |
| PAT-501 | Triage | 45-60 | Private | Emergency | ER | CARD-01 | Dr. Jones |
| PAT-501 | Treatment | 45-60 | Private | Emergency | ER | CARD-01 | Dr. Jones |
| PAT-501 | Discharge | 45-60 | Private | Emergency | ER | CARD-01 | Nurse Brown |
**After Enrichment:**
Case Attributes:
| Case ID | Patient_Age_Group | Insurance_Type | Admission_Type | Diagnosis_Code |
|---------|------------------|----------------|----------------|---------------|
| PAT-501 | 45-60 | Private | Emergency | CARD-01 |
Event Attributes (varying values remain):
| Case ID | Activity | Department | Resource |
|---------|----------|------------|----------|
| PAT-501 | Registration | ER | Nurse Smith |
| PAT-501 | Triage | ER | Dr. Jones |
| PAT-501 | Treatment | ER | Dr. Jones |
| PAT-501 | Discharge | ER | Nurse Brown |
**Output:** Patient demographics and fixed medical information are moved to case level, while Department and Resource remain as event attributes since they could potentially vary (patients might move between departments). The dataset is now 40% smaller and more logically organized.
**Insights:** The optimized data structure enables faster patient cohort analysis, with insurance type and age group filters running instantly at the case level. Diagnosis-based process mining is now more efficient, and the hospital can quickly identify treatment patterns for specific patient segments without processing redundant event data.
### Example 3: Manufacturing Process Data Cleanup
**Scenario:** A manufacturing plant's MES system exports production data where product specifications, order details, and quality standards are duplicated across every production step, creating performance issues in process analysis.
**Before Enrichment:**
Every production event contains: Product_ID, Product_Type, Material_Grade, Quality_Standard, Customer_Code, Order_Size, Target_Date
**After Enrichment:**
- **Converted to Case Attributes:** Product_ID, Product_Type, Material_Grade, Quality_Standard, Customer_Code, Order_Size, Target_Date (all constant within each production run)
- **Remaining Event Attributes:** Activity, Timestamp, Machine_ID, Operator, Temperature, Pressure (varying values)
**Output:** Seven attributes that never change within a production run are automatically elevated to case level. The event table now focuses solely on process execution details that vary between activities.
**Insights:** The conversion reduced the dataset size by 65%, enabling real-time process monitoring that was previously impossible due to data volume. Quality analysis by product type and material grade is now straightforward using case-level filters, and the plant can efficiently track KPIs across different product categories.
### Example 4: Financial Loan Processing Simplification
**Scenario:** A bank's loan processing system exports application data where loan parameters, customer profiles, and regulatory classifications are repeated in every workflow step, complicating compliance reporting and process optimization.
**Event Data Sample (Before):**
Each event includes: Loan_Type, Interest_Rate, Loan_Amount, Credit_Score_Range, Branch, Region, Product_Code, Regulatory_Class, Customer_Segment
**After Enrichment:**
- **Case Level:** All loan parameters and customer classifications (9 attributes) moved to case table
- **Event Level:** Only Activity, Timestamp, Approver, Decision, and Comments remain
**Output:** The enrichment detected that loan parameters and customer information never change during the application process and converted them to case attributes. The event table is reduced to essential workflow information only.
**Insights:** Regulatory compliance reports that previously took hours now run in minutes. The bank can instantly analyze approval patterns by credit score range and loan type using case-level data, and process mining reveals bottlenecks specific to certain customer segments without the overhead of redundant event data.
### Example 5: Supply Chain Data Optimization
**Scenario:** A logistics company's tracking system records shipment details at every scan point, with fixed shipment properties like service level, destination, weight class, and customer account repeated millions of times across tracking events.
**Before Enrichment:**
500,000 shipments × 15 scan points × 8 static attributes = 60 million redundant data points
**After Enrichment:**
- **Case Attributes:** Service_Level, Origin_Country, Destination_Country, Weight_Class, Customer_Account, Declared_Value, Shipment_Type, Contract_ID
- **Event Attributes:** Activity (Scan Location), Timestamp, Scanner_ID, Location_Code, Exception_Flag
**Output:** Eight shipment properties are converted to case level, stored once per shipment instead of repeated at every scan. The event table size is reduced by 70%, containing only dynamic tracking information.
**Insights:** Route analysis by destination and service level is now 10x faster using case-level queries. The company can efficiently identify delivery patterns for different customer segments and optimize routes based on shipment characteristics without processing massive amounts of duplicate data. Real-time tracking performance improved dramatically, enabling live dashboard updates that were previously impossible.
## Output
The Convert to Case Attributes enrichment modifies your dataset structure by intelligently moving attributes from the event level to the case level. The enrichment performs a comprehensive analysis to identify event attributes whose values never change within each case, then automatically converts these to case attributes for optimal data organization.
**Conversion Process:**
- Analyzes all event-level data columns except system columns (Activity, Timestamp, Resource)
- For each attribute, checks if values remain constant within every case in the dataset
- Only converts attributes that have identical values across all events within each case
- Preserves the original attribute names and data types during conversion
- Maintains data integrity by using the last non-null value when present
**Attributes That Are Converted:**
- Event attributes with constant values throughout each case (customer IDs, product codes, categories)
- Static properties that are unnecessarily repeated at event level (regions, types, classifications)
- Reference data that logically belongs at case level (contract numbers, project codes, order properties)
**Attributes That Remain at Event Level:**
- System columns (Activity, Timestamp, Start Time, Resource, Expected Order)
- Attributes with varying values within cases (different resources, changing statuses, measurements)
- Hidden system attributes that should not be modified
- Attributes that already exist at the case level with the same name
**Impact on Your Dataset:**
The enrichment creates a cleaner, more efficient data structure where each piece of information exists at its logical level. Case-level filtering and aggregation become more intuitive since case properties are properly organized. Query performance improves significantly due to reduced data redundancy, and the dataset size typically decreases by 30-70% depending on the amount of redundant event data.
The converted attributes integrate seamlessly with all mindzieStudio features. Filters can efficiently query case attributes without scanning event data, calculators can reference case attributes directly without aggregation functions, and other enrichments benefit from the optimized data structure. Process discovery and conformance checking operate more efficiently on the streamlined event data, while maintaining full access to case properties when needed.
---
*This documentation is part of the mindzie Studio process mining platform.*
---
## Convert To Integer
Section: Enrichments
URL: https://docs.mindziestudio.com/mindzie_studio/enrichments/convert-to-integer
Source: /docs-master/mindzieStudio/enrichments/convert-to-integer/page.md
# Convert To Integer
## Overview
The Convert To Integer enrichment transforms decimal numbers (double or single precision floating-point values) into whole numbers (32-bit integers) by applying a specified rounding method. This enrichment is essential for process mining scenarios where you need to standardize numeric data, perform integer-based calculations, or prepare data for systems that require whole number values.
In process mining, many calculated metrics like durations, costs, or counts may result in decimal values that need to be converted to integers for reporting, categorization, or downstream processing. This enrichment ensures consistent and predictable conversion behavior by letting you choose between different rounding strategies, making it particularly valuable when precision requirements and business rules dictate how fractional values should be handled.
The enrichment works with both case-level and event-level attributes, automatically detecting the source and applying the conversion appropriately. It creates a new attribute while preserving the original decimal value, allowing you to maintain data lineage and compare pre- and post-conversion values when needed.
## Common Uses
- Convert calculated duration values from decimal hours or days to whole numbers for simplified reporting and categorization
- Round financial amounts to nearest dollar or currency unit when cent-level precision is not needed for analysis
- Transform calculated performance metrics like throughput rates or cycle times into integer values for dashboard displays
- Prepare numeric data for systems that require integer inputs, such as priority levels or status codes
- Standardize count-based metrics that may have been calculated as averages or weighted values
- Convert percentage calculations to whole numbers for simplified business rules and filtering
- Transform calculated resource utilization rates into integer percentages for capacity planning reports
## Settings
**New Attribute Name:** The name of the new integer attribute that will be created to store the converted values. This attribute will be added as a case or event attribute depending on the source of the original attribute. Choose a descriptive name that clearly indicates the attribute contains integer values (for example, "Duration Days" or "Amount Dollars"). The new attribute will be displayed with number formatting in the mindzieStudio interface.
**Attribute Name:** The source attribute containing decimal values (double or single precision floating-point numbers) that you want to convert to integers. The dropdown shows only numeric attributes with decimal places from your dataset. This can be either a case attribute or an event attribute. The enrichment automatically detects whether the source is case-level or event-level data and creates the new attribute at the same level.
**Rounding Method:** Determines how decimal values are rounded when converting to integers. This setting is critical for ensuring the conversion meets your business requirements. Two methods are available:
- **AwayFromZero** (default): Rounds to the nearest integer, with midpoint values (exactly .5) rounding away from zero. For example: 2.5 becomes 3, -2.5 becomes -3, 2.4 becomes 2, 2.6 becomes 3. This is the most commonly used rounding method and matches standard mathematical rounding conventions. Use this method when you want symmetric rounding behavior for positive and negative numbers.
- **ToZero**: Rounds to the nearest integer, with midpoint values (exactly .5) rounding toward zero. For example: 2.5 becomes 2, -2.5 becomes -2, 2.4 becomes 2, 2.6 becomes 3. This method is also known as "banker's rounding" or "round half down" and is useful when you want to avoid systematic bias in rounding over large datasets. Use this method when conservative estimates are preferred or when regulatory requirements dictate this specific rounding behavior.
## Examples
### Example 1: Purchase Order Processing - Duration Rounding
**Scenario:** A procurement team tracks purchase order cycle times in decimal days but needs whole day values for SLA reporting and process categorization. Purchase orders with cycle times like 3.7 days or 5.2 days need to be rounded to 4 and 5 days respectively for clear communication with stakeholders and simplified performance dashboards.
**Settings:**
- New Attribute Name: PO Cycle Time Days
- Attribute Name: PO Cycle Time (calculated decimal duration)
- Rounding Method: AwayFromZero
**Output:**
The enrichment creates a new case attribute "PO Cycle Time Days" containing integer values. Cases with original values like 3.2 days become 3 days, 3.5 days becomes 4 days, and 3.8 days becomes 4 days. The attribute appears in the case table with number formatting and can be used directly in filters, performance categorizations, and dashboard visualizations.
| Case ID | PO Cycle Time | PO Cycle Time Days |
|---------|---------------|---------------------|
| PO-1001 | 3.2 | 3 |
| PO-1002 | 3.5 | 4 |
| PO-1003 | 3.8 | 4 |
| PO-1004 | 5.1 | 5 |
| PO-1005 | 7.9 | 8 |
**Insights:** The integer values enable simplified SLA tracking (e.g., "orders completed within 5 days") and make it easier to create meaningful duration categories without dealing with decimal precision in business rules.
### Example 2: Healthcare - Patient Cost Standardization
**Scenario:** A hospital analyzes patient treatment costs that include cents in the calculations, but the finance department requires whole dollar amounts for budget reporting and variance analysis. Costs like $1,247.83 or $892.45 need to be rounded to $1,248 and $892 for simplified financial reporting and cost category assignments.
**Settings:**
- New Attribute Name: Treatment Cost Dollars
- Attribute Name: Total Treatment Cost
- Rounding Method: AwayFromZero
**Output:**
The enrichment creates "Treatment Cost Dollars" as a new case attribute with integer values representing the nearest whole dollar amount. This attribute can be used in financial dashboards, cost categorization enrichments, and budget variance calculations without dealing with decimal precision.
| Patient ID | Total Treatment Cost | Treatment Cost Dollars |
|------------|----------------------|------------------------|
| PT-5001 | 1247.83 | 1248 |
| PT-5002 | 892.45 | 892 |
| PT-5003 | 3456.50 | 3457 |
| PT-5004 | 567.12 | 567 |
| PT-5005 | 2199.99 | 2200 |
**Insights:** Converting to integer dollar amounts simplifies financial reporting, makes cost categorization more straightforward, and aligns with how budget managers think about and discuss treatment costs in stakeholder meetings.
### Example 3: Manufacturing - Production Throughput Metrics
**Scenario:** A manufacturing plant calculates average production throughput rates that result in decimal values like 47.3 units per hour. For capacity planning reports and shift performance dashboards, operations managers prefer whole number values that are easier to communicate and understand at a glance.
**Settings:**
- New Attribute Name: Units Per Hour
- Attribute Name: Calculated Throughput Rate
- Rounding Method: AwayFromZero
**Output:**
Creates an integer attribute "Units Per Hour" that rounds throughput rates to whole numbers. Production rates like 47.3, 47.5, and 47.8 become 47, 48, and 48 respectively, making it easier to set production targets and evaluate shift performance.
| Shift ID | Calculated Throughput Rate | Units Per Hour |
|----------|----------------------------|----------------|
| SHIFT-101 | 47.3 | 47 |
| SHIFT-102 | 47.5 | 48 |
| SHIFT-103 | 47.8 | 48 |
| SHIFT-104 | 52.1 | 52 |
| SHIFT-105 | 49.9 | 50 |
**Insights:** Whole number throughput values make it easier to communicate production targets, compare shift performance, and identify capacity constraints without the distraction of decimal precision that adds no value to operational decision-making.
### Example 4: Order Fulfillment - Time to Ship Hours
**Scenario:** An e-commerce company tracks time from order placement to shipment in decimal hours (e.g., 18.7 hours, 23.4 hours) but wants to report these values as whole hours for customer service SLA tracking and fulfillment center performance evaluation. Simplified integer values make it easier to categorize orders as "same day," "next day," or "2+ days."
**Settings:**
- New Attribute Name: Shipping Time Hours
- Attribute Name: Time To Ship (decimal hours)
- Rounding Method: AwayFromZero
**Output:**
The enrichment produces an integer attribute "Shipping Time Hours" with values rounded to whole hours. Orders with shipping times of 18.3, 18.5, and 18.8 hours become 18, 19, and 19 hours respectively, enabling straightforward categorization and SLA compliance tracking.
| Order ID | Time To Ship | Shipping Time Hours |
|----------|--------------|---------------------|
| ORD-2001 | 18.3 | 18 |
| ORD-2002 | 18.5 | 19 |
| ORD-2003 | 18.8 | 19 |
| ORD-2004 | 23.4 | 23 |
| ORD-2005 | 47.9 | 48 |
**Insights:** Integer hour values enable simple rules like "orders under 24 hours" for same-day fulfillment analysis and make performance dashboards more readable for operations teams monitoring real-time fulfillment metrics.
### Example 5: Financial Services - Loan Processing with Conservative Rounding
**Scenario:** A bank calculates loan processing cycle times in decimal business days and needs to report these to regulators using conservative estimates. When a loan takes 5.5 days to process, regulatory reporting requires rounding down to 5 days to avoid overstating processing times. This requires the ToZero rounding method to ensure midpoint values are rounded conservatively.
**Settings:**
- New Attribute Name: Processing Days Regulatory
- Attribute Name: Loan Processing Time Days
- Rounding Method: ToZero
**Output:**
Creates an integer attribute "Processing Days Regulatory" using conservative rounding. Values like 5.4, 5.5, and 5.6 days become 5, 5, and 6 days respectively. The ToZero method ensures that midpoint values (5.5) round down rather than up, providing conservative estimates for regulatory reporting.
| Loan ID | Loan Processing Time Days | Processing Days Regulatory |
|---------|---------------------------|----------------------------|
| LN-7001 | 5.4 | 5 |
| LN-7002 | 5.5 | 5 |
| LN-7003 | 5.6 | 6 |
| LN-7004 | 7.3 | 7 |
| LN-7005 | 7.5 | 7 |
**Insights:** Using ToZero rounding ensures compliance with regulatory requirements for conservative time reporting, prevents systematic overstatement of processing times in aggregate reports, and provides defensible metrics for regulatory audits.
## Output
The Convert To Integer enrichment creates a single new attribute containing integer (32-bit whole number) values derived from the source decimal attribute:
**New Integer Attribute:** Added at the same level as the source attribute (case-level or event-level). The attribute name is specified in the "New Attribute Name" setting. The data type is Int32 (32-bit integer), supporting values from -2,147,483,648 to 2,147,483,647. The attribute is marked as a derived attribute with lineage tracking to the source decimal attribute.
**Display Formatting:** The new attribute is automatically configured with number display formatting in mindzieStudio, showing values without decimal places. This ensures consistent presentation in case tables, dashboards, and reports.
**Null Value Handling:** If the source attribute contains null values, those cases or events are skipped during conversion, and the new attribute remains null for those records. This preserves data integrity and ensures that missing data in the source does not result in zero values in the output.
**Data Precision:** The conversion uses standard .NET rounding with the specified MidpointRounding method, ensuring consistent and predictable behavior. The resulting integer values may lose precision compared to the original decimal values, so it's important to choose appropriate rounding methods based on your business requirements.
**Integration with Other Enrichments:** The new integer attribute can be used immediately in subsequent enrichments such as:
- **Categorize Attribute Values** to create duration bands or cost tiers based on integer values
- **Filter Log** to isolate cases based on integer threshold criteria
- **Calculators** for further arithmetic operations that benefit from integer precision
- **Performance Categorization** to group cases by integer-based performance metrics
The original decimal attribute is preserved unchanged, allowing you to maintain both representations of the data. This is valuable for auditing, validation, and scenarios where you need to compare the impact of rounding on your analysis results.
---
*This documentation is part of the mindzie Studio process mining platform.*
---
## Copy Attribute
Section: Enrichments
URL: https://docs.mindziestudio.com/mindzie_studio/enrichments/copy-attribute
Source: /docs-master/mindzieStudio/enrichments/copy-attribute/page.md
# Copy Attribute
## Overview
The Copy Attribute enrichment creates a duplicate of an existing attribute with a new name, enabling you to preserve original data while performing transformations, create backup copies before modifications, or establish multiple versions of the same data for different analytical purposes. This fundamental data manipulation operator works seamlessly with both case and event attributes, automatically detecting the attribute level and creating the copy at the appropriate location in your dataset structure.
In process mining, the ability to copy attributes is essential for data preservation, attribute versioning, and creating working copies for subsequent transformations. The Copy Attribute enrichment performs a complete replication of the source attribute, including its data type, display format, and all values. When combined with filters, you can selectively copy attribute values only for specific cases, leaving the new attribute blank for cases that don't match the filter criteria. This selective copying capability makes the enrichment particularly valuable for data segmentation, conditional data preparation, and creating attribute variants for different analytical scenarios.
The enrichment intelligently handles all attribute types - text, numeric, boolean, and datetime - preserving the exact data type and formatting of the source attribute. This type preservation ensures that downstream calculations, filters, and visualizations can work with the copied attribute exactly as they would with the original, maintaining data integrity throughout your analytical workflows.
## Common Uses
- Create backup copies of attributes before applying transformations or enrichments
- Preserve original values while creating modified versions for comparison analysis
- Duplicate attributes for different analytical contexts (weekly vs. monthly reporting)
- Create working copies of attributes for iterative data quality improvements
- Establish baseline versions of attributes before applying conditional updates
- Copy attributes selectively based on filter criteria for segmented analysis
- Generate attribute variants with different display names for business vs. technical audiences
## Settings
**Column Name:** Select the source attribute that you want to copy. This can be any existing case or event attribute in your dataset. The enrichment will automatically detect whether the attribute is at the case or event level and create the copy at the same level. All data types are supported, including text, numeric, boolean, and datetime attributes. The display format and data type of the source attribute will be preserved in the copy.
**New Attribute Name:** Specify the name for the new copied attribute. Choose a descriptive name that clearly indicates the purpose of the copy or its relationship to the original. For example, use "Original_Amount" when creating a backup before transformations, or "Baseline_Status" when preserving initial values. The name must be unique and cannot conflict with existing attributes in your dataset.
**Filter (Optional):** Apply filters to control which cases receive the copied values. When filters are specified, only cases matching the filter criteria will have values copied to the new attribute. Cases that don't match the filter will have the new attribute created but left blank (null). This selective copying is useful for creating attribute variants that apply only to specific process segments, time periods, or case categories. The filter operates at the case level, even when copying event attributes.
## Examples
### Example 1: Creating a Baseline Status for Comparison
**Scenario:** In an order fulfillment process, you need to preserve the initial order status at the time of creation to compare against the current status and track status changes throughout the process lifecycle.
**Settings:**
- Column Name: Order_Status
- New Attribute Name: Initial_Order_Status
- Filter: None (copy for all cases)
**Output:**
Creates a new case attribute "Initial_Order_Status" that contains an exact copy of the Order_Status values. For cases with:
- Order_Status: "Pending Approval"
The Initial_Order_Status will also be: "Pending Approval"
Later in your analysis, you can compare Initial_Order_Status with the current Order_Status to identify which orders have changed status, enabling analysis of status progression patterns and identifying cases stuck in specific states.
**Insights:** This baseline copy enables change tracking analysis, helps identify process bottlenecks where statuses don't progress as expected, and provides a reference point for measuring process evolution over time.
### Example 2: Preserving Original Cost Before Currency Conversion
**Scenario:** In a global procurement process, you need to convert all costs to a base currency (USD) for consolidated reporting, but you want to preserve the original cost values in their native currencies for audit and reconciliation purposes.
**Settings:**
- Column Name: Invoice_Amount
- New Attribute Name: Original_Invoice_Amount
- Filter: None
**Output:**
Creates a new case attribute "Original_Invoice_Amount" containing the exact copy of Invoice_Amount values. For cases with:
- Invoice_Amount: 45000.00 (in various currencies)
- Currency: "EUR"
The Original_Invoice_Amount will be: 45000.00
After copying, you can apply currency conversion enrichments to Invoice_Amount while Original_Invoice_Amount remains unchanged, preserving the source data for audit trails and variance analysis.
**Insights:** This preservation approach maintains data lineage, enables audit reconciliation between original and converted amounts, and provides transparency in multi-currency reporting scenarios.
### Example 3: Creating Regional Variants for Different Analysis Contexts
**Scenario:** In a sales process spanning multiple regions, you want to create separate copies of the sales amount attribute for different regional teams, each containing values only for their respective region to simplify region-specific analysis.
**Settings:**
- Column Name: Sales_Amount
- New Attribute Name: North_America_Sales
- Filter: Region = "North America"
**Output:**
Creates a new case attribute "North_America_Sales" that contains sales amounts only for North American cases. For a North American case with:
- Sales_Amount: 125000.00
- Region: "North America"
The North_America_Sales will be: 125000.00
For cases from other regions:
- Sales_Amount: 85000.00
- Region: "Europe"
The North_America_Sales will be: blank (null)
**Insights:** This selective copying enables region-specific dashboards and reports without requiring constant filter application, simplifies variance analysis between regions, and allows different teams to focus on their relevant data subset.
### Example 4: Establishing a Working Copy for Iterative Data Quality
**Scenario:** In a customer service process, you need to clean and standardize product category names, but you want to preserve the original raw values for quality assurance and to track the extent of data cleaning required.
**Settings:**
- Column Name: Product_Category
- New Attribute Name: Product_Category_Original
- Filter: None
**Output:**
Creates a new case attribute "Product_Category_Original" with exact copies of all Product_Category values. For cases with:
- Product_Category: "Laptop Computer - 15in"
The Product_Category_Original will be: "Laptop Computer - 15in"
After copying, you can apply text replacement, grouping, and standardization enrichments to Product_Category while Product_Category_Original remains unchanged, allowing you to:
- Compare cleaned vs. original values to measure data quality improvements
- Identify the most common raw variations that required standardization
- Maintain an audit trail of all data transformations
**Insights:** This working copy approach enables transparent data quality processes, provides before-and-after comparison capabilities, and maintains traceability of all transformations applied to your data.
### Example 5: Creating Time-Based Snapshots for Trend Analysis
**Scenario:** In a project management process, you want to capture the project completion percentage at specific milestones to analyze how estimates change over time and identify patterns in project forecast accuracy.
**Settings:**
- Column Name: Completion_Percentage
- New Attribute Name: Completion_At_Midpoint
- Filter: Milestone = "Project Midpoint Review"
**Output:**
Creates a new case attribute "Completion_At_Midpoint" that captures the completion percentage only for cases that have reached the midpoint review. For a case at midpoint with:
- Completion_Percentage: 45
- Milestone: "Project Midpoint Review"
The Completion_At_Midpoint will be: 45
For cases not yet at midpoint:
- Completion_Percentage: 25
- Milestone: "Initial Planning"
The Completion_At_Midpoint will be: blank (null)
Later, as Completion_Percentage continues to update, you can compare the midpoint snapshot with the final completion to analyze estimate accuracy and identify projects that significantly deviated from midpoint projections.
**Insights:** These temporal snapshots enable trend analysis over project lifecycles, help identify systematic estimation biases at different project phases, and provide baseline metrics for improving future project planning accuracy.
## Output
The Copy Attribute enrichment creates a single new attribute at the same level (case or event) as the source attribute. The new attribute is an exact replica of the source attribute, preserving:
- **Data Type**: The copied attribute maintains the same data type as the source (text, integer, decimal, boolean, or datetime)
- **Display Format**: Any formatting applied to the source attribute (currency symbols, decimal places, date formats) is preserved in the copy
- **Values**: All non-null values from the source attribute are copied exactly to the new attribute
The new attribute appears in your dataset alongside the original attribute and can be used in all mindzieStudio features including filters, calculators, visualizations, and subsequent enrichments. When no filter is applied, the new attribute will have values for all cases or events (matching the source attribute's completeness). When a filter is applied, only cases or events matching the filter criteria will have values populated in the new attribute; non-matching cases will have the attribute present but set to null.
The copied attribute is marked as a derived attribute in the dataset metadata, indicating it was created through enrichment processing rather than being part of the source data. The attribute's dependencies reference the original source attribute, maintaining data lineage for auditing and understanding data transformations.
For event attributes, the copying operation is performed at the event level, meaning each individual event receives a copy of its attribute value. For case attributes, the copying occurs at the case level, with the single case-level value being duplicated to the new attribute.
---
*This documentation is part of the mindzie Studio process mining platform.*
---
## Correct Time Zone
Section: Enrichments
URL: https://docs.mindziestudio.com/mindzie_studio/enrichments/correct-time-zone
Source: /docs-master/mindzieStudio/enrichments/correct-time-zone/page.md
# Correct Time Zone
## Overview
The Correct Time Zone enrichment automatically adjusts all timestamps in your process mining dataset from UTC (Coordinated Universal Time) to a specified local time zone. This enrichment is essential when analyzing processes that span multiple geographic regions or when your source systems store timestamps in UTC format that need to be converted to local business hours for accurate analysis.
This enrichment performs a comprehensive conversion across your entire dataset, transforming all date/time values in both case attributes and event attributes to reflect the correct local time zone. This ensures that time-based analyses, such as working hours calculations, shift analysis, and daily/weekly patterns, accurately reflect the business reality in the local time zone where the processes actually occur.
## Common Uses
- Convert UTC timestamps from global ERP systems to local business time zones for accurate working hours analysis
- Align timestamps from multiple source systems that use different time zone conventions into a single, consistent local time
- Prepare data for shift-based analysis by ensuring all timestamps reflect the actual local time when work was performed
- Enable accurate calculation of business hours metrics by converting to the time zone where the process operates
- Support compliance reporting that requires timestamps in specific regional time zones
- Facilitate cross-regional process comparison by standardizing timestamps to headquarters' time zone
- Correct timestamp display for business users who need to see events in their local time rather than system time
## Settings
This enrichment operates automatically using the time zone configuration specified at the dataset level. No additional settings are required in the enrichment itself.
**Dataset Time Zone:** The target time zone for conversion is configured when importing or configuring your dataset in mindzieStudio. The enrichment reads this configuration and applies it consistently across all timestamps. Common time zones include:
- Eastern Standard Time
- Pacific Standard Time
- Central European Time
- Greenwich Mean Time
- Australia Eastern Standard Time
- And all other standard Windows time zone identifiers
**Automatic Detection:** The enrichment automatically identifies all date/time columns in your dataset (both in case attributes and event attributes) and converts each timestamp from UTC to the specified local time zone. Only timestamps that have a time component (not just dates) are converted.
**Skip If Already Local:** If your dataset has already been converted to local time (indicated by the IsLocalTime flag), this enrichment will skip processing to avoid double conversion.
## Examples
### Example 1: Global Manufacturing Process Analysis
**Scenario:** A multinational manufacturing company has factories in Germany, China, and Mexico, all reporting to a SAP system that stores timestamps in UTC. The European headquarters needs to analyze production processes in Central European Time to align with business reporting.
**Settings:**
- Dataset Time Zone: Central European Standard Time
- No additional enrichment settings required
**Output:**
Original UTC timestamps are converted to CET/CEST:
- UTC Event: 2024-03-15 14:30:00 becomes CET: 2024-03-15 15:30:00 (winter time)
- UTC Event: 2024-07-15 14:30:00 becomes CEST: 2024-07-15 16:30:00 (summer time)
All case attributes with timestamps (Order Date, Delivery Date, Payment Date) and event timestamps are automatically adjusted. This enables accurate analysis of working hours (8:00-17:00 CET) and identification of overtime work.
**Insights:** After conversion, the company discovers that what appeared to be late-night production activities (22:00 UTC) were actually normal afternoon shifts (15:00 local time) in their Mexico facility, eliminating false compliance alerts.
### Example 2: Healthcare Appointment Scheduling
**Scenario:** A hospital network spans three time zones across the United States. Their centralized scheduling system stores all appointment times in UTC, but local staff need to see appointments in their respective local times for operational planning.
**Settings:**
- Dataset Time Zone: Eastern Standard Time (for East Coast analysis)
- No additional enrichment settings required
**Output:**
Patient journey timestamps converted from UTC to EST/EDT:
- Registration: 2024-02-20 18:00:00 UTC → 2024-02-20 13:00:00 EST
- Appointment: 2024-02-20 19:30:00 UTC → 2024-02-20 14:30:00 EST
- Discharge: 2024-02-20 21:45:00 UTC → 2024-02-20 16:45:00 EST
**Insights:** The conversion reveals that most appointments occur during standard business hours (9:00-17:00 EST), not in the evening as the UTC timestamps suggested. This helps in proper staff scheduling and resource allocation.
### Example 3: Financial Trading Process
**Scenario:** An investment firm processes trades globally with all transactions logged in UTC. For regulatory compliance and performance analysis, they need to convert timestamps to New York time (EST/EDT) to align with market hours.
**Settings:**
- Dataset Time Zone: Eastern Standard Time
- No additional enrichment settings required
**Output:**
Trade execution timestamps adjusted for NYSE trading hours:
- Trade Initiated: 2024-03-10 13:30:00 UTC → 2024-03-10 09:30:00 EDT (market open)
- Trade Executed: 2024-03-10 13:31:15 UTC → 2024-03-10 09:31:15 EDT
- Settlement Confirmed: 2024-03-10 20:00:00 UTC → 2024-03-10 16:00:00 EDT (market close)
**Insights:** After time zone correction, the firm can accurately identify trades executed during regular market hours versus after-hours trading, enabling proper fee calculation and compliance reporting.
### Example 4: E-commerce Order Fulfillment
**Scenario:** An online retailer with fulfillment centers worldwide needs to analyze order processing times in Pacific Time to align with their headquarters' business hours and customer service operations.
**Settings:**
- Dataset Time Zone: Pacific Standard Time
- No additional enrichment settings required
**Output:**
Order lifecycle timestamps converted from UTC to PST/PDT:
- Order Placed: 2024-08-15 05:00:00 UTC → 2024-08-14 22:00:00 PDT (previous day)
- Payment Processed: 2024-08-15 05:15:00 UTC → 2024-08-14 22:15:00 PDT
- Warehouse Picked: 2024-08-15 15:00:00 UTC → 2024-08-15 08:00:00 PDT
- Shipped: 2024-08-15 23:00:00 UTC → 2024-08-15 16:00:00 PDT
**Insights:** The time zone correction shows that orders appearing to be placed at 5 AM UTC were actually placed at 10 PM PST the previous evening, explaining high overnight order volumes and helping optimize warehouse staffing for morning pick operations.
### Example 5: IT Service Desk Operations
**Scenario:** A global IT service provider needs to analyze incident resolution times across multiple regions. Their ITSM system logs all events in UTC, but SLA compliance must be measured in local business hours.
**Settings:**
- Dataset Time Zone: GMT Standard Time (for UK operations analysis)
- No additional enrichment settings required
**Output:**
Incident timestamps converted from UTC to GMT/BST:
- Incident Created: 2024-06-20 08:00:00 UTC → 2024-06-20 09:00:00 BST
- First Response: 2024-06-20 08:45:00 UTC → 2024-06-20 09:45:00 BST
- Escalated: 2024-06-20 11:00:00 UTC → 2024-06-20 12:00:00 BST
- Resolved: 2024-06-20 15:30:00 UTC → 2024-06-20 16:30:00 BST
**Insights:** Converting to local time reveals that most incidents occur during UK business hours (9:00-17:00 BST), not early morning as UTC times suggested, validating current shift patterns and identifying peak support demand periods.
## Output
The Correct Time Zone enrichment modifies all existing date/time attributes in your dataset without creating new columns. The conversion affects:
**Case Attributes:**
- All date/time fields in the case table are converted from UTC to the specified local time zone
- Examples include: Case Start Time, Case End Time, Order Date, Due Date, Completion Date
- Only timestamps with time components are converted (pure dates without times remain unchanged)
**Event Attributes:**
- All date/time fields in the event table are converted to local time
- The primary Timestamp field used for process mining is adjusted
- Any additional timestamp fields (Start Time, End Time, Schedule Time) are also converted
**Data Integrity:**
- The relative order of events remains unchanged
- Duration calculations between timestamps remain accurate
- The enrichment sets an internal flag (IsLocalTime) to prevent accidental re-conversion
**Integration Notes:**
- Once converted, all time-based enrichments and calculators will use the local timestamps
- Filters based on time ranges will operate on local time values
- Export functions will output the converted local timestamps
- The conversion accounts for daylight saving time changes automatically
## See Also
- [Shift Activity Time](../shift-activity-time/page.md) - Adjust individual activity timestamps by specific time periods
- [Freeze Time](../freeze-time/page.md) - Standardize timestamps for simulation or comparison purposes
- [Sort Log on Start Time](../sort-log-on-start-time/page.md) - Reorder events based on start timestamps
- [Duration Between Two Activities](../duration-between-two-activities/page.md) - Calculate time between activities after time zone correction
- [Working Hours](../working-hours/page.md) - Define business hours in local time for accurate calculations
---
*This documentation is part of the mindzie Studio process mining platform.*
---
## Count Activities
Section: Enrichments
URL: https://docs.mindziestudio.com/mindzie_studio/enrichments/count-activities
Source: /docs-master/mindzieStudio/enrichments/count-activities/page.md
# Count Activities
## Overview
The Count Activities enrichment is a powerful statistical tool that counts how many times specific activities occur within each case in your process. This enrichment creates a new integer attribute that tallies the total number of executions for selected activities, providing quantitative insights into activity frequency and process patterns. It's particularly valuable for identifying cases with unusual activity patterns, measuring compliance with expected process steps, and understanding workload distribution across different process paths.
Unlike simple event counting, Count Activities allows you to focus on specific activities of interest rather than all events in a case. This targeted approach helps you analyze critical process steps, measure the frequency of rework activities, count approval cycles, or track how often specific exceptions occur. The enrichment also supports filtering, allowing you to count activities only within specific segments of your cases based on defined criteria.
## Common Uses
- Track the number of approval cycles in procurement or finance processes to identify bottlenecks
- Count rework activities in manufacturing processes to measure quality issues and process efficiency
- Monitor the frequency of escalations in customer service cases to assess service quality
- Measure how often manual interventions occur in automated processes to identify automation opportunities
- Count validation or verification steps in compliance-critical processes to ensure proper controls
- Analyze the number of follow-up activities in sales processes to understand customer engagement patterns
- Track exception handling activities to identify process variations and improvement opportunities
## Settings
**Filter:** An optional filter that allows you to limit the counting to specific segments of your cases. When a filter is applied, only activities within events that meet the filter criteria will be counted. This is useful for counting activities within specific time periods, for certain case types, or under particular conditions. If no filter is specified, all occurrences of the selected activities across the entire case will be counted.
**New Attribute Name:** The name for the new integer attribute that will store the activity count for each case. This attribute will be added to your case table and will contain the total number of times the selected activities occurred. Choose a descriptive name that clearly indicates what is being counted, such as "ApprovalCount", "ReworkActivities", or "EscalationFrequency". This field is required.
**Activity Names:** A multi-select dropdown that allows you to choose which activities to count. You can select one or more activities from the list of all activities present in your dataset. The enrichment will count the total occurrences of all selected activities combined. For example, if you select "Review" and "Approve", the count will include both Review and Approve activities. This field is required and must include at least one activity.
## Examples
### Example 1: Counting Approval Cycles in Purchase Orders
**Scenario:** A procurement team needs to identify purchase orders that required multiple approval cycles, as these cases often indicate complex requirements or incomplete documentation that slow down the procurement process.
**Settings:**
- New Attribute Name: "Total Approval Steps"
- Activity Names: ["Manager Approval", "Director Approval", "VP Approval", "CFO Approval"]
- Filter: None
**Output:**
The enrichment creates a new case attribute "Total Approval Steps" with integer values:
- Case PO-2024-001: Total Approval Steps = 2 (Manager and Director approval)
- Case PO-2024-002: Total Approval Steps = 4 (All four approval levels)
- Case PO-2024-003: Total Approval Steps = 1 (Only Manager approval)
- Case PO-2024-004: Total Approval Steps = 3 (Manager, Director, and VP approval)
**Insights:** Cases with 3 or more approval steps can be analyzed to understand why they required elevated approvals. This data helps identify threshold violations, policy exceptions, or opportunities to streamline the approval matrix for routine purchases.
### Example 2: Measuring Rework in Manufacturing Quality Control
**Scenario:** A manufacturing plant wants to measure how often products require rework or re-inspection, as these activities directly impact production efficiency and delivery timelines.
**Settings:**
- New Attribute Name: "Rework Count"
- Activity Names: ["Quality Rejection", "Rework Process", "Re-inspection", "Repair"]
- Filter: Department = "Production Line A"
**Output:**
The enrichment creates a "Rework Count" attribute showing rework frequency:
- Case BATCH-5001: Rework Count = 0 (First-time quality pass)
- Case BATCH-5002: Rework Count = 3 (Quality Rejection, Rework Process, Re-inspection)
- Case BATCH-5003: Rework Count = 1 (Single Repair activity)
- Case BATCH-5004: Rework Count = 5 (Multiple quality issues requiring several rework cycles)
**Insights:** Batches with high rework counts indicate quality issues that need investigation. The plant can correlate rework frequency with factors like shift timing, operator training, or raw material suppliers to identify root causes.
### Example 3: Tracking Customer Service Escalations
**Scenario:** A customer service center needs to monitor how often support tickets are escalated to higher tiers, as excessive escalations indicate either complex issues or insufficient first-tier training.
**Settings:**
- New Attribute Name: "Escalation Count"
- Activity Names: ["Escalate to Tier 2", "Escalate to Tier 3", "Escalate to Supervisor", "Transfer to Specialist"]
- Filter: Case Type = "Technical Support"
**Output:**
The enrichment produces an "Escalation Count" for technical support cases:
- Case TICKET-8901: Escalation Count = 0 (Resolved at Tier 1)
- Case TICKET-8902: Escalation Count = 2 (Escalated to Tier 2, then to Specialist)
- Case TICKET-8903: Escalation Count = 1 (Single escalation to Tier 2)
- Case TICKET-8904: Escalation Count = 4 (Complex issue requiring multiple escalations)
**Insights:** High escalation counts correlate with longer resolution times and lower customer satisfaction. The center can use this data to identify training needs, improve knowledge base articles, or route specific issue types directly to appropriate tiers.
### Example 4: Monitoring Manual Interventions in Automated Processes
**Scenario:** A bank has automated its loan application process but needs to track how often manual interventions are required, as these indicate either system limitations or exceptional cases requiring human judgment.
**Settings:**
- New Attribute Name: "Manual Intervention Count"
- Activity Names: ["Manual Review", "Override Decision", "Exception Handling", "Manual Verification"]
- Filter: Process Type = "Auto Loan" AND Application Date >= "2024-01-01"
**Output:**
The enrichment creates a "Manual Intervention Count" for recent auto loan applications:
- Case LOAN-2024-001: Manual Intervention Count = 0 (Fully automated processing)
- Case LOAN-2024-002: Manual Intervention Count = 2 (Manual Review and Manual Verification)
- Case LOAN-2024-003: Manual Intervention Count = 1 (Override Decision for special terms)
- Case LOAN-2024-004: Manual Intervention Count = 3 (Multiple manual steps required)
**Insights:** Applications with zero manual interventions demonstrate successful automation, while those with multiple interventions highlight opportunities for system enhancement or identify edge cases that require special handling procedures.
### Example 5: Analyzing Follow-up Activities in Sales Processes
**Scenario:** A sales team wants to measure how many follow-up activities occur in their opportunity management process, as this indicates the level of effort required to close deals and helps predict resource needs.
**Settings:**
- New Attribute Name: "Follow Up Activities"
- Activity Names: ["Follow-up Call", "Follow-up Email", "Schedule Meeting", "Send Reminder", "Check-in Contact"]
- Filter: Opportunity Stage != "Closed Lost"
**Output:**
The enrichment generates a "Follow Up Activities" count for active opportunities:
- Case OPP-2024-101: Follow Up Activities = 3 (Two emails and one call)
- Case OPP-2024-102: Follow Up Activities = 7 (High-touch enterprise deal)
- Case OPP-2024-103: Follow Up Activities = 1 (Quick conversion)
- Case OPP-2024-104: Follow Up Activities = 5 (Multiple meetings and reminders)
**Insights:** Opportunities requiring many follow-ups may indicate customer hesitation or complex decision-making processes. The sales team can adjust their approach for high-touch deals and identify which opportunities might benefit from executive involvement or different engagement strategies.
## Output
The Count Activities enrichment creates a single new integer attribute in your case table with the name specified in the "New Attribute Name" setting. This attribute contains the total count of how many times the selected activities occurred within each case, subject to any applied filters.
The output attribute characteristics include:
- **Data Type:** Integer (Int32)
- **Value Range:** 0 to the maximum number of events in any case
- **Column Type:** Derived attribute
- **Display Format:** Number
The new attribute can be immediately used in:
- Filters to identify cases with specific activity count ranges (e.g., "Rework Count > 3")
- Calculators to compute averages, distributions, or correlations with other metrics
- Dashboards to visualize activity frequency patterns across your process
- Other enrichments that depend on quantitative activity measurements
- Process conformance checks to verify expected activity occurrences
Cases where none of the selected activities occur will have a count value of 0, making it easy to identify cases that completely avoided certain process steps. The enrichment preserves the original event data while adding this analytical layer, allowing you to maintain full process transparency while gaining statistical insights.
---
*This documentation is part of the mindzie Studio process mining platform.*
---
## Count Boolean Attributes With Value
Section: Enrichments
URL: https://docs.mindziestudio.com/mindzie_studio/enrichments/count-boolean-attributes-with-value
Source: /docs-master/mindzieStudio/enrichments/count-boolean-attributes-with-value/page.md
# Count Boolean Attributes with Value
## Overview
The Count Boolean Attributes with Value enrichment is a specialized analytical tool that evaluates multiple boolean (true/false) attributes and counts how many of them match a specified value. This enrichment creates a new integer attribute containing the count of boolean attributes that are either TRUE or FALSE according to your selection, providing powerful capabilities for multi-criteria evaluation, compliance scoring, and risk assessment across your process cases.
This enrichment is particularly valuable when you need to evaluate cases against multiple binary conditions simultaneously. For example, in a compliance scenario where you have boolean flags for different regulatory requirements, this enrichment can count how many requirements are met (TRUE values) or violated (FALSE values). Similarly, in quality control processes with multiple pass/fail criteria, it can quantify the number of passed or failed checks. The enrichment supports both case-level and event-level boolean attributes, allowing for flexible analysis at different granularities of your process data.
## Common Uses
- Calculate compliance scores by counting how many regulatory requirements are met (TRUE) across multiple compliance flags
- Assess risk levels by counting the number of risk indicators that are triggered (TRUE) in financial or operational processes
- Measure quality by counting passed (TRUE) or failed (FALSE) quality check attributes in manufacturing processes
- Evaluate customer satisfaction by counting positive (TRUE) responses across multiple satisfaction indicators
- Track completion status by counting completed (TRUE) task flags in project management processes
- Identify problematic cases by counting the number of exception flags (TRUE) or error indicators
- Score vendor performance by counting met (TRUE) or missed (FALSE) SLA criteria across multiple metrics
## Settings
**Filter:** An optional filter that allows you to limit the counting operation to specific cases or events. When a filter is applied, the boolean counting will only be performed for cases that meet the filter criteria. This is useful for calculating scores within specific time periods, for certain case types, or under particular conditions. If no filter is specified, the counting will be applied to all cases in your dataset.
**New Attribute Name:** The name for the new integer attribute that will store the count of boolean attributes matching your specified value. This attribute will be added to either your case table or event table depending on your source selection. Choose a descriptive name that clearly indicates what is being counted, such as "ComplianceScore", "QualityChecksPassed", "RiskIndicatorCount", or "RequirementsMet". This field is required.
**Source:** Determines whether to count boolean attributes from the case table or the event table. Select "Case" to count case-level boolean attributes (attributes that have one value per case), or "Event" to count event-level boolean attributes (attributes that can have different values for each event). The available boolean attributes for selection will update based on your source choice.
**Attribute Names:** A multi-select list that allows you to choose which boolean attributes to include in the counting operation. Only boolean (true/false) attributes from your selected source will be available for selection. You can select multiple attributes, and the enrichment will count how many of these selected attributes have the value you specify in the "Count If Value" setting. At least one attribute must be selected.
**Count If Value:** Specifies which boolean value to count - either TRUE or FALSE. If you select TRUE, the enrichment counts how many of the selected attributes have a TRUE value. If you select FALSE, it counts how many have a FALSE value. This allows you to measure either positive conditions (requirements met, checks passed) or negative conditions (violations, failures) depending on your analysis needs.
## Examples
### Example 1: Compliance Scoring in Financial Transactions
**Scenario:** A financial institution needs to calculate a compliance score for transactions by counting how many regulatory checks have been passed. They have multiple boolean attributes indicating whether specific compliance requirements are met.
**Settings:**
- Source: Case
- New Attribute Name: "Compliance Score"
- Attribute Names: ["KYC_Verified", "AML_Check_Passed", "Sanctions_Clear", "Document_Complete", "Approval_Obtained", "Risk_Assessment_Done"]
- Count If Value: True
- Filter: None
**Output:**
The enrichment creates a new case attribute "Compliance Score" with integer values representing the number of passed compliance checks:
- Transaction TX-001: Compliance Score = 6 (all checks passed)
- Transaction TX-002: Compliance Score = 4 (KYC and Risk Assessment not completed)
- Transaction TX-003: Compliance Score = 5 (Sanctions check failed)
- Transaction TX-004: Compliance Score = 3 (only basic checks completed)
**Insights:** Transactions with compliance scores below 5 are flagged for additional review. This quantitative score helps prioritize which transactions need immediate attention and identifies patterns in compliance gaps across different transaction types.
### Example 2: Quality Control Assessment in Manufacturing
**Scenario:** A manufacturing plant evaluates products through multiple quality checkpoints, each recorded as a boolean attribute. They need to count failed checks to identify products requiring rework.
**Settings:**
- Source: Case
- New Attribute Name: "Failed Quality Checks"
- Attribute Names: ["Visual_Inspection", "Dimension_Check", "Weight_Tolerance", "Electrical_Test", "Pressure_Test", "Final_Assembly"]
- Count If Value: False
- Filter: None
**Output:**
The enrichment creates a "Failed Quality Checks" attribute showing the number of failed tests:
- Product P-5001: Failed Quality Checks = 0 (all tests passed)
- Product P-5002: Failed Quality Checks = 2 (Dimension and Weight failed)
- Product P-5003: Failed Quality Checks = 1 (Electrical Test failed)
- Product P-5004: Failed Quality Checks = 3 (Visual, Pressure, and Assembly failed)
**Insights:** Products with any failed checks require rework, while those with multiple failures may need complete remanufacturing. The count helps optimize rework routing and identify systemic quality issues in specific test categories.
### Example 3: Risk Assessment in Loan Applications
**Scenario:** A bank evaluates loan applications using multiple risk indicators stored as boolean attributes. They need to count triggered risk flags to determine the overall risk level of each application.
**Settings:**
- Source: Case
- New Attribute Name: "Risk Indicators Count"
- Attribute Names: ["High_Debt_Ratio", "Unstable_Employment", "Poor_Credit_History", "Insufficient_Collateral", "Previous_Default", "Income_Verification_Failed"]
- Count If Value: True
- Filter: Case_Type = "Personal Loan"
**Output:**
The enrichment counts triggered risk indicators for personal loan applications:
- Application LA-2024-101: Risk Indicators Count = 0 (low risk)
- Application LA-2024-102: Risk Indicators Count = 2 (High_Debt_Ratio and Poor_Credit_History)
- Application LA-2024-103: Risk Indicators Count = 4 (multiple risk factors)
- Application LA-2024-104: Risk Indicators Count = 1 (only Unstable_Employment)
**Insights:** Applications with 0-1 risk indicators can be fast-tracked, 2-3 require additional review, and 4+ are automatically escalated to senior underwriters. This systematic scoring improves decision consistency and processing efficiency.
### Example 4: SLA Performance Monitoring in IT Service Management
**Scenario:** An IT service desk tracks multiple SLA criteria as boolean attributes for each incident. They need to count met SLAs to calculate performance scores for different service categories.
**Settings:**
- Source: Case
- New Attribute Name: "SLA Criteria Met"
- Attribute Names: ["Response_Time_Met", "Resolution_Time_Met", "First_Call_Resolution", "Customer_Satisfied", "Escalation_Avoided", "Documentation_Complete"]
- Count If Value: True
- Filter: Priority = "High"
**Output:**
For high-priority incidents, the enrichment calculates SLA performance:
- Incident INC-8001: SLA Criteria Met = 6 (perfect score)
- Incident INC-8002: SLA Criteria Met = 4 (Resolution time and escalation issues)
- Incident INC-8003: SLA Criteria Met = 5 (Documentation incomplete)
- Incident INC-8004: SLA Criteria Met = 2 (multiple SLA breaches)
**Insights:** The quantified SLA performance enables data-driven improvements in service delivery. Incidents with low scores reveal systemic issues in specific SLA areas, guiding training and process optimization efforts.
### Example 5: Multi-Criteria Vendor Evaluation
**Scenario:** A procurement team evaluates vendors across multiple performance criteria stored as boolean pass/fail attributes. They need to calculate an overall performance score for vendor ranking and selection.
**Settings:**
- Source: Case
- New Attribute Name: "Vendor Performance Score"
- Attribute Names: ["On_Time_Delivery", "Quality_Standards_Met", "Price_Competitive", "Documentation_Accurate", "Responsive_Support", "Sustainability_Compliant"]
- Count If Value: True
- Filter: Evaluation_Period = "Q4-2024"
**Output:**
The enrichment calculates vendor performance scores for Q4 evaluations:
- Vendor V-101: Vendor Performance Score = 6 (excellent performance)
- Vendor V-102: Vendor Performance Score = 4 (delivery and price issues)
- Vendor V-103: Vendor Performance Score = 5 (documentation issues)
- Vendor V-104: Vendor Performance Score = 3 (multiple performance gaps)
**Insights:** Vendors scoring 5-6 are preferred partners, 3-4 require improvement plans, and below 3 face potential contract termination. This objective scoring system supports strategic vendor management decisions and negotiations.
## Output
The Count Boolean Attributes with Value enrichment creates a single new integer attribute in either the case table or event table, depending on your source selection. The attribute contains the count of selected boolean attributes that match your specified value (TRUE or FALSE).
For case-level counting, each case receives one count value representing the total number of matching boolean values across all selected attributes for that case. This count remains constant for all events within the case and is useful for case-level scoring, classification, and filtering.
For event-level counting, each event receives its own count value based on the boolean attribute values at that specific event. This allows for tracking how boolean conditions change throughout the process execution.
The output attribute can be used in subsequent analyses including:
- Filtering cases based on score thresholds (e.g., show only cases with compliance score > 4)
- Creating performance categories using the Categorize Attribute Values enrichment
- Calculating average scores across case groups using aggregation calculators
- Building predictive models using the score as a feature
- Visualizing score distributions in dashboards and reports
The integer count provides a quantitative measure that transforms multiple binary evaluations into a single metric, enabling more sophisticated analysis and decision-making based on multi-criteria assessments.
## See Also
- **[Combine Boolean Attributes](/mindzie_studio/enrichments/combine-boolean-attributes)** - Performs logical operations (AND/OR) on multiple boolean attributes instead of counting
- **[Count Values](/mindzie_studio/enrichments/count-values)** - Counts unique values in non-boolean attributes
- **[Count Activities](/mindzie_studio/enrichments/count-activities)** - Counts occurrences of specific activities in cases
- **[Categorize Attribute Values](/mindzie_studio/enrichments/categorize-attribute-values)** - Categorizes the count output into ranges like "Low", "Medium", "High"
- **[Representative Case Attribute](/mindzie_studio/enrichments/representative-case-attribute)** - Aggregates attribute values to case level before counting
---
*This documentation is part of the mindzie Studio process mining platform.*
---
## Count Values
Section: Enrichments
URL: https://docs.mindziestudio.com/mindzie_studio/enrichments/count-values
Source: /docs-master/mindzieStudio/enrichments/count-values/page.md
# Count Values
## Overview
The Count Values enrichment is a powerful statistical analysis tool that counts the number of distinct (unique) values for a selected event attribute within each case in your process dataset. This enrichment is essential for understanding the variety and diversity of data values across your process instances. It creates a new case-level attribute containing the count of unique values found, providing insights into data complexity, variation patterns, and potential data quality issues.
This enrichment is particularly valuable for analyzing categorical data variation, identifying cases with unusual diversity in attribute values, and understanding process complexity metrics. By counting distinct values rather than total occurrences, it helps identify cases where multiple different values appear for the same attribute, such as different product types ordered, various departments involved, or multiple statuses encountered during case execution.
The enrichment operates at the case level, examining all events within each case to determine how many unique values exist for the specified attribute. This makes it ideal for scenarios where you need to measure variety, complexity, or data richness within individual process instances.
## Common Uses
- Count the number of different products or SKUs ordered in a single purchase order
- Identify how many different departments or teams were involved in processing a case
- Measure the variety of error codes or exception types encountered during case execution
- Determine the number of unique vendors or suppliers involved in procurement cases
- Count distinct customer segments or categories served in a single transaction
- Analyze the diversity of approval levels or authorization statuses in approval workflows
- Track the number of different systems or applications accessed during case processing
## Settings
**New Attribute Name:** The name for the new case attribute that will store the count of unique values. This should be a descriptive name that clearly indicates what is being counted. For example, if counting unique product types, you might name it "Unique_Product_Count" or "Product_Variety_Count". The attribute will be created as an integer type and displayed with number formatting.
**Attribute Name:** The event attribute whose unique values will be counted. This dropdown lists all available event attributes in your dataset. Select the attribute that contains the values you want to analyze for uniqueness. The enrichment will examine this attribute across all events in each case to count distinct values.
**Allow Null:** A checkbox option that determines whether null (empty) values should be included in the unique value count. When checked (true), null values are counted as one distinct value if they appear in the case. When unchecked (false), null values are ignored and not counted. This setting is important for accurate counting when your data may contain missing values.
**Filter:** An optional filter that can be applied to limit which events are considered when counting unique values. This allows you to count distinct values only from specific activities, time periods, or other filtered subsets of events within each case. When no filter is specified, all events in the case are examined.
## Examples
### Example 1: Counting Product Variety in Purchase Orders
**Scenario:** A retail company wants to analyze the complexity of their purchase orders by understanding how many different product SKUs are typically ordered together. This helps optimize warehouse picking processes and identify opportunities for bundling.
**Settings:**
- New Attribute Name: Unique_SKU_Count
- Attribute Name: Product_SKU
- Allow Null: False (unchecked)
- Filter: Activity equals "Add Item to Order"
**Output:**
The enrichment creates a new case attribute "Unique_SKU_Count" containing the number of distinct product SKUs in each order:
- Case PO-2024-001: Unique_SKU_Count = 5 (customer ordered 5 different products)
- Case PO-2024-002: Unique_SKU_Count = 1 (single product order)
- Case PO-2024-003: Unique_SKU_Count = 12 (complex order with many products)
**Insights:** Orders with high unique SKU counts require more complex warehouse picking operations. The company can use this metric to route orders efficiently and identify opportunities for product bundling based on commonly co-ordered items.
### Example 2: Analyzing Department Involvement in IT Tickets
**Scenario:** An IT service desk wants to understand the complexity of support tickets by counting how many different departments are involved in resolving each ticket. This helps identify tickets that require cross-functional collaboration.
**Settings:**
- New Attribute Name: Departments_Involved_Count
- Attribute Name: Assigned_Department
- Allow Null: False (unchecked)
- Filter: None (analyze all events)
**Output:**
Each IT ticket case receives a "Departments_Involved_Count" attribute:
- Case TICKET-5001: Departments_Involved_Count = 1 (handled entirely by Help Desk)
- Case TICKET-5002: Departments_Involved_Count = 3 (escalated through Help Desk, Network Team, Security)
- Case TICKET-5003: Departments_Involved_Count = 5 (complex issue requiring multiple teams)
**Insights:** Tickets involving multiple departments have longer resolution times and higher costs. The organization can use this metric to improve routing, establish better collaboration protocols, and identify training needs.
### Example 3: Supplier Diversity in Procurement Process
**Scenario:** A manufacturing company needs to track supplier diversity in their procurement processes to ensure compliance with supplier diversification policies and identify single-source dependencies.
**Settings:**
- New Attribute Name: Unique_Supplier_Count
- Attribute Name: Supplier_ID
- Allow Null: True (checked)
- Filter: Activity contains "Quote" or Activity contains "Purchase"
**Output:**
The enrichment adds "Unique_Supplier_Count" to each procurement case:
- Case PROC-2024-101: Unique_Supplier_Count = 4 (received quotes from 4 different suppliers)
- Case PROC-2024-102: Unique_Supplier_Count = 1 (single-source procurement)
- Case PROC-2024-103: Unique_Supplier_Count = 7 (competitive bidding with many suppliers)
**Insights:** Cases with only one supplier represent potential supply chain risks. The company implements policies requiring minimum supplier counts for purchases above certain thresholds and monitors compliance through this metric.
### Example 4: Error Type Analysis in Manufacturing
**Scenario:** A manufacturing plant wants to understand the variety of quality issues encountered during production runs to prioritize quality improvement initiatives and identify problematic production lines.
**Settings:**
- New Attribute Name: Distinct_Error_Types
- Attribute Name: Quality_Error_Code
- Allow Null: False (unchecked)
- Filter: Activity equals "Quality Check Failed"
**Output:**
Each production batch case gets a "Distinct_Error_Types" count:
- Case BATCH-2024-A001: Distinct_Error_Types = 0 (no quality issues)
- Case BATCH-2024-A002: Distinct_Error_Types = 2 (two different types of defects found)
- Case BATCH-2024-A003: Distinct_Error_Types = 5 (multiple quality problems indicating systemic issues)
**Insights:** Batches with high distinct error counts indicate systemic quality problems requiring immediate attention. The plant uses this metric to trigger comprehensive quality reviews and preventive maintenance when thresholds are exceeded.
### Example 5: Customer Interaction Channel Analysis
**Scenario:** A customer service center wants to understand how many different communication channels customers use during their service journey to optimize omnichannel support strategies.
**Settings:**
- New Attribute Name: Communication_Channels_Used
- Attribute Name: Interaction_Channel
- Allow Null: False (unchecked)
- Filter: None (count all customer interactions)
**Output:**
The enrichment creates a channel diversity metric for each customer case:
- Case CUST-2024-1001: Communication_Channels_Used = 1 (phone only)
- Case CUST-2024-1002: Communication_Channels_Used = 3 (phone, email, chat)
- Case CUST-2024-1003: Communication_Channels_Used = 4 (phone, email, chat, social media)
**Insights:** Customers using multiple channels often indicate complex issues or frustration with single-channel resolution. The company improves channel integration and ensures consistent information across all touchpoints for better customer experience.
## Output
The Count Values enrichment creates a single new case-level attribute with the following characteristics:
**Attribute Type:** Integer (Int32) - The count is always a whole number representing the number of unique values found.
**Attribute Naming:** The new attribute uses the name specified in the "New Attribute Name" setting. Choose descriptive names that clearly indicate what is being counted.
**Display Format:** The attribute is automatically formatted as a number in the dataset view, making it easy to sort, filter, and analyze.
**Value Range:** The count ranges from 0 (when no matching values are found or all values are null with "Allow Null" unchecked) to the maximum number of events in a case (when every event has a different value).
**Integration:** The new attribute can be used immediately in:
- Filters to identify cases with specific unique value counts
- Calculators for statistical analysis and aggregations
- Other enrichments that require numeric case attributes
- Process mining visualizations and dashboards
- Export operations for external analysis
## See Also
- **Event Count** - Counts the total number of events in each case
- **Summarize Values** - Calculates sum, average, or other statistics for numeric attributes
- **Max Value** - Finds the maximum value of a numeric attribute in each case
- **Count Boolean Attributes with Value** - Counts how many boolean attributes have a specific value
- **Compare Activity Counts** - Compares execution counts between two activities
---
*This documentation is part of the mindzie Studio process mining platform.*
---
## Create Update Activity
Section: Enrichments
URL: https://docs.mindziestudio.com/mindzie_studio/enrichments/create-update-activity
Source: /docs-master/mindzieStudio/enrichments/create-update-activity/page.md
# Create Update Activity
## Overview
The Create Update Activity enrichment automatically generates new activities in your process when specific event attribute values change within a case. This powerful feature makes attribute changes visible in your process flow, transforming hidden state transitions into explicit process steps that can be analyzed, visualized, and optimized. Rather than requiring manual event logging for every status change, this enrichment intelligently detects value changes and creates activities to represent them.
This enrichment is particularly valuable for processes where critical information changes over time but these changes aren't explicitly recorded as activities. For example, when a sales order status changes from "Pending" to "Approved" to "Shipped", you can automatically create update activities at each transition point. This makes the process flow clearer in process maps, enables accurate timing analysis of state transitions, and helps identify bottlenecks or anomalies in approval workflows. The enrichment monitors specified activities for changes in selected attributes and inserts new activities only when meaningful changes occur, avoiding clutter from redundant updates.
By making attribute changes visible as activities, you can analyze patterns that would otherwise be hidden in attribute values. This includes measuring how long items remain in specific states, identifying which transitions take the longest, tracking who performs status updates, and understanding the sequence of state changes across different process variants. The enrichment bridges the gap between event attributes and process activities, providing a complete view of both what happened and how data evolved throughout the process.
## Common Uses
- Create "Status Updated" activities when order status changes from "Pending" to "Processing" to "Complete"
- Generate "Priority Changed" activities when ticket priority is escalated or de-escalated
- Track "Owner Reassigned" activities when the responsible person changes during case handling
- Monitor "Risk Level Changed" activities when credit risk assessments are updated
- Capture "Location Updated" activities when shipments move between warehouses or distribution centers
- Record "Approval Stage Advanced" activities when approval levels change in multi-tier approval processes
- Track "Price Adjusted" activities when product pricing changes during quote negotiations
- Generate "Category Reclassified" activities when support tickets are moved between departments
## Settings
**New Activity Name:** The name for the activity that will be created when the attribute value changes. Choose a descriptive name that clearly indicates what type of change occurred, such as "Status Updated", "Priority Changed", or "Owner Reassigned". This activity name will appear in process maps and activity lists.
**Event Attribute:** Select the event attribute to monitor for changes. The enrichment will track this attribute across the selected activities and create new activities whenever the value changes. This can be any event attribute such as status fields, owner names, priority levels, category codes, or location identifiers.
**Update Activity:** The specific activity to use as a reference point for detecting changes. While the enrichment monitors multiple activities (specified in Change Activities), this setting identifies which activity type should be considered the "update" activity. In most configurations, this should match one of the activities in the Change Activities list.
**Change Activities:** Select one or more activities where the attribute should be monitored for changes. The enrichment will only examine events with these activity names when detecting value changes. For example, if you select "Create Order", "Modify Order", and "Approve Order", the enrichment will check if the monitored attribute changed between any of these activities.
**Ignore Case:** When enabled, the enrichment treats null (blank) values as meaningful values when detecting changes. When disabled, null values are ignored, and changes involving null values won't trigger new activities. Enable this when null values represent a meaningful state (like "Unassigned" or "Not Set"), or disable it to focus only on changes between actual values.
## Examples
### Example 1: Order Status Tracking
**Scenario:** An e-commerce fulfillment process has multiple activities that can change the order status (Create Order, Payment Received, Ship Order), but status transitions aren't recorded as explicit activities. You want to create "Status Changed" activities to visualize the status progression in process maps.
**Settings:**
- New Activity Name: Status Changed
- Event Attribute: OrderStatus
- Update Activity: Create Order
- Change Activities: Create Order, Payment Received, Ship Order
- Ignore Case: False
**Output:**
Creates "Status Changed" activities whenever the OrderStatus attribute changes between the specified activities. For example:
- Case starts with "Create Order" (OrderStatus = "Pending")
- "Payment Received" occurs (OrderStatus = "Paid") - Creates "Status Changed" activity
- "Ship Order" occurs (OrderStatus = "Shipped") - Creates "Status Changed" activity
The new "Status Changed" activities appear in the process map, showing the exact timing of status transitions and making it easy to measure how long orders remain in each status.
**Insights:** Reveals the actual sequence of status changes, identifies delays between status transitions, helps measure SLA compliance for each status stage, and enables filtering by specific status progression patterns.
### Example 2: Support Ticket Priority Escalation
**Scenario:** A customer support process allows tickets to be escalated or de-escalated, changing the Priority attribute across various activities. You want to track every priority change to understand escalation patterns and response times.
**Settings:**
- New Activity Name: Priority Changed
- Event Attribute: TicketPriority
- Update Activity: Create Ticket
- Change Activities: Create Ticket, Assign Agent, Escalate, Update Ticket, Resolve Ticket
- Ignore Case: True
**Output:**
Creates "Priority Changed" activities whenever priority is modified. For a ticket that starts as "Low", gets escalated to "Medium", then to "High", and finally resolved, the enrichment creates:
- "Priority Changed" when escalated from Low to Medium
- "Priority Changed" when escalated from Medium to High
Each new activity includes all event attributes from the original event, including the new priority value and the timestamp of the change.
**Insights:** Identifies how often tickets require escalation, measures time between escalations, reveals which customers or issue types frequently require priority changes, and helps optimize initial priority assignment.
### Example 3: Shipment Location Tracking
**Scenario:** A logistics process records shipment movements across warehouses, but location changes aren't explicitly tracked as activities. The ShipmentLocation attribute changes as items move, and you want to visualize these movements in the process flow.
**Settings:**
- New Activity Name: Location Updated
- Event Attribute: ShipmentLocation
- Update Activity: Receive Shipment
- Change Activities: Receive Shipment, Transfer Item, Load for Delivery, Deliver
- Ignore Case: False
**Output:**
Creates "Location Updated" activities at each location change:
- Item arrives at "Warehouse A" (Receive Shipment) - Initial location set
- Transfer to "Warehouse B" (Transfer Item) - Creates "Location Updated"
- Load at "Warehouse B" (Load for Delivery) - No change, no activity created
- Delivery from "Customer Site" (Deliver) - Creates "Location Updated"
The process map now shows the shipment journey with explicit location change activities, making it easy to see the distribution network flow.
**Insights:** Visualizes shipment routes, identifies transfer bottlenecks, measures time spent at each location, and reveals inefficient routing patterns.
### Example 4: Approval Workflow Stage Tracking
**Scenario:** A procurement approval process has an ApprovalStage attribute that changes from "Pending" to "Manager Approved" to "Director Approved" to "Final Approved". You want to create activities for each approval stage transition.
**Settings:**
- New Activity Name: Approval Stage Advanced
- Event Attribute: ApprovalStage
- Update Activity: Submit for Approval
- Change Activities: Submit for Approval, Manager Review, Director Review, Final Approval
- Ignore Case: False
**Output:**
Creates "Approval Stage Advanced" activities at each stage transition:
| Original Activity | ApprovalStage Before | ApprovalStage After | New Activity Created |
|------------------|---------------------|---------------------|---------------------|
| Submit for Approval | null | Pending | No (initial value) |
| Manager Review | Pending | Manager Approved | Yes |
| Director Review | Manager Approved | Director Approved | Yes |
| Final Approval | Director Approved | Final Approved | Yes |
**Insights:** Clearly shows approval progression, measures time between approval stages, identifies where approvals stall, and enables analysis of multi-tier approval efficiency.
### Example 5: Case Owner Changes in Incident Management
**Scenario:** An IT incident management process reassigns cases between support staff as workload shifts or escalations occur. The AssignedTo attribute changes, but these reassignments aren't tracked as explicit activities. You want to understand reassignment patterns.
**Settings:**
- New Activity Name: Case Reassigned
- Event Attribute: AssignedTo
- Update Activity: Create Incident
- Change Activities: Create Incident, Assign, Reassign, Escalate, Resolve
- Ignore Case: True
**Output:**
Creates "Case Reassigned" activities whenever the AssignedTo attribute changes:
- Create Incident (AssignedTo = "Auto-Assignment Queue") - Initial assignment
- Assign (AssignedTo = "John Smith") - Creates "Case Reassigned"
- Reassign (AssignedTo = "Sarah Jones") - Creates "Case Reassigned"
- Escalate (AssignedTo = "Senior Team") - Creates "Case Reassigned"
The enrichment tracks all ownership changes, making it visible who handled the case and when handoffs occurred.
**Insights:** Reveals how often cases are reassigned, identifies overloaded agents requiring frequent reassignments, measures handoff delays, and helps optimize initial assignment strategies.
## Output
The Create Update Activity enrichment generates new event rows in the event log, creating activities that represent attribute value changes. These new activities integrate seamlessly into the existing process flow and appear in all process analysis tools.
**Activity Properties:**
- **Activity Name:** Matches the "New Activity Name" setting
- **Timestamp:** Inherited from the event where the attribute change occurred
- **Case ID:** Same as the original event (activities are added to the same case)
- **Event Attributes:** All event attributes from the original event are copied to the new activity
- **Activity Type:** Standard activity that appears in process maps and activity lists
**Creation Logic:**
- New activities are created only when the monitored attribute value changes
- The first occurrence of an activity sets the initial value (no update activity created)
- Subsequent occurrences are compared to the previous value
- If the value differs, a new activity is inserted with the same timestamp
- If "Ignore Case" is disabled, changes involving null values are ignored
- Only events matching the selected "Change Activities" are monitored
**Integration Points:**
- New activities appear in process maps showing the flow of attribute changes
- Available in activity filters for selecting cases with specific change patterns
- Can be used in subsequent enrichments like duration calculations
- Visible in variant analysis to identify different change sequences
- Included in activity frequency statistics and performance metrics
- Appear in event log exports with all original event attributes
**Process Map Visualization:**
The new activities create additional nodes in process maps, showing the paths of attribute changes. This makes previously hidden state transitions visible and analyzable alongside regular process activities.
**Performance Considerations:**
- The enrichment processes all events in selected activities to detect changes
- For large datasets, consider limiting Change Activities to only those where changes are expected
- New activities increase the event count, which may affect process map complexity
- Use filters to focus analysis on specific types of changes if needed
## See Also
- **Remove Activities:** Remove unwanted activities from the process log
- **Remove Repeated Activities:** Consolidate consecutive identical activities
- **Representative Case Attribute:** Extract attribute values from specific activities to case level
- **Duration Between Two Activities:** Measure time between original and update activities
---
*This documentation is part of the mindzie Studio process mining platform.*
---
## Divide
Section: Enrichments
URL: https://docs.mindziestudio.com/mindzie_studio/enrichments/divide
Source: /docs-master/mindzieStudio/enrichments/divide/page.md
# Divide
## Overview
The enrichment divides the value of one attribute by another and stores the result in a new attribute.
## Common Uses
- Divide one attribute by another to calculate ratios
- Calculate percentages between two attributes
## Settings
Start by going to the 'Log Enrichment' engine by going to any analysis and clicking 'Log Enrichment' in the top right.
Then click 'Add New' and choose the 'Divide' enrichment block.
### Configuration Options
- **Filters:** Add any filters to limit which cases this enrichment applies to. The enrichment will only calculate values for cases selected by the filter.
- **New Attribute Name:** Specify the name of the new attribute that will store the division result.
- **Source:** Select whether to use case attributes or event attributes.
- Case attributes are defined at the whole case level
- Event attributes are defined for each individual event
- **Numerator Column Name:** Select the attribute to use as the numerator (top value in the division).
- **Denominator Column Name:** Select the attribute to use as the denominator (bottom value in the division).
- **Mult Factor:** Specify a multiplication factor to apply to the result.
- Use `100` to convert decimal results to percentages
- Use `1` for standard division with no multiplication
- You may choose to multiply the division by 100 if the division represents percentages
### Example 1: Calculate Payment Percentage
**Scenario:** We have invoices with:
- `Total_Amount`: The full invoice amount
- `Amount_Paid`: The amount paid to date
**Goal:** Create a `Percent_Paid` attribute showing the payment completion percentage.
To calculate the total percent paid on a case to date, let's select total paid amount as the numerator and total amount value as the denominator:
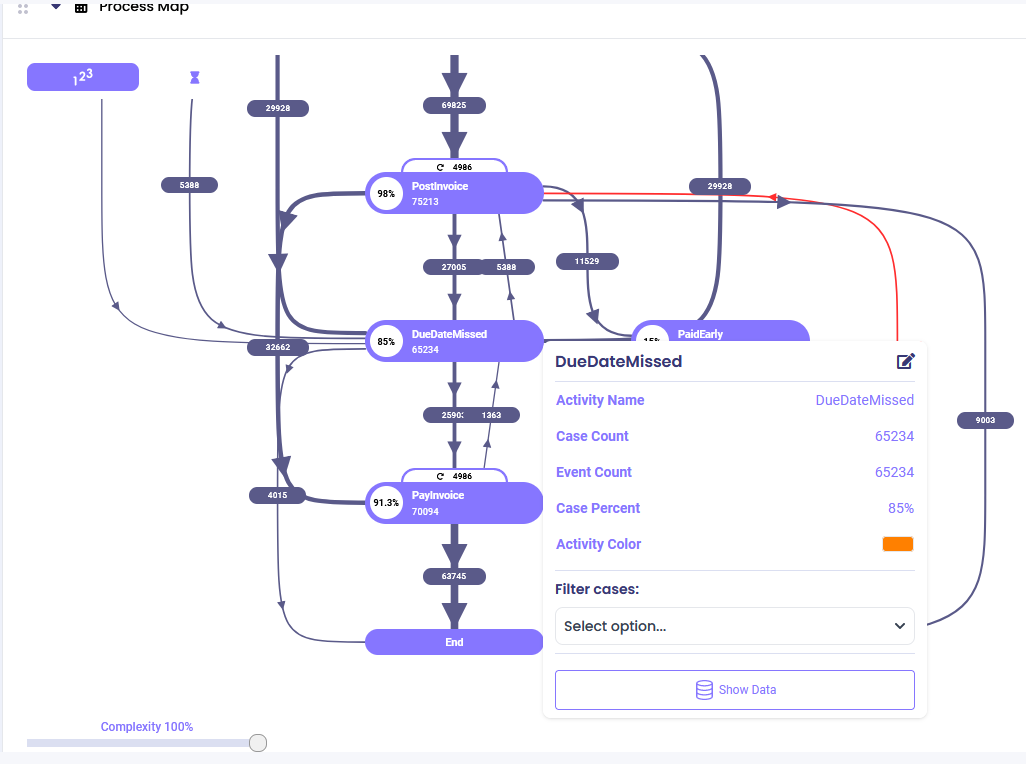
Click 'Create' and once you're ready click 'Calculate Enrichment' to add the new attribute to your data set.
From the overview, you should now be able to find the newly created attribute:

As seen from the distribution graph, most of our cases are fully paid:

## Output
When this enrichment is executed, it creates a new numeric case or event attribute with the name you specified in "New Attribute Name".
The attribute value is calculated as:
**Result = (Numerator / Denominator) x Mult Factor**
For example:
- If Numerator = 50, Denominator = 100, Mult Factor = 100
- Result = (50 / 100) x 100 = 50
**Null Handling:** If either the numerator or denominator is null or if the denominator is zero, the result will be null to prevent errors.
**Decimal Precision:** The number of decimal places can be controlled through the multiplication factor or by using subsequent rounding enrichments.
## See Also
**Related Mathematical Enrichments:**
- [Multiply](/mindzie_studio/enrichments/multiply) - Multiply attribute values together
- [Subtract](/mindzie_studio/enrichments/subtract) - Subtract one attribute from another
- Add - Add attribute values together
**Related Topics:**
- Calculated Attributes - Overview of attribute calculations
- Data Quality - Handling null values and data issues
---
*This documentation is part of the mindzie Studio process mining platform.*
---
## Duration Between An Activity And Current Time
Section: Enrichments
URL: https://docs.mindziestudio.com/mindzie_studio/enrichments/duration-between-an-activity-and-current-time
Source: /docs-master/mindzieStudio/enrichments/duration-between-an-activity-and-current-time/page.md
# Duration Between an Activity and Current Time
## Overview
The Duration Between an Activity and Current Time enrichment calculates how much time has elapsed between a specific activity occurrence in your process and the current moment when the analysis is run. This powerful time-based enrichment enables real-time monitoring of process aging, helping organizations track service level agreements, identify bottlenecks, and monitor open items in their processes. By creating a new case attribute with the calculated duration, you can easily filter, sort, and analyze cases based on how long ago critical activities occurred.
This enrichment is particularly valuable for operational dashboards and real-time process monitoring scenarios. Unlike static duration calculations between two activities, this enrichment provides dynamic time measurements that update each time your dataset is refreshed, making it ideal for tracking aging cases, monitoring response times, and ensuring timely process completion. The enrichment supports various time units from seconds to years, allowing you to choose the most appropriate granularity for your analysis needs.
## Common Uses
- Track aging of open support tickets since initial customer contact
- Monitor time elapsed since last status update in approval workflows
- Calculate days since order placement for unfulfilled orders
- Measure time since patient admission in healthcare processes
- Track aging of unpaid invoices since issuance
- Monitor time elapsed since last quality check in manufacturing
- Identify cases requiring escalation based on time since specific milestones
## Settings
**New Attribute Name:** The name of the new case attribute that will store the calculated duration. Choose a descriptive name that clearly indicates what time period is being measured, such as "Days Since Registration" or "Hours Since Last Update". This attribute will be added to your case table and can be used in filters, calculators, and other enrichments. Avoid using special characters and ensure the name doesn't conflict with existing attributes.
**Activity Name:** Select the activity from which you want to calculate the time difference to the current moment. This dropdown lists all activities present in your dataset. The enrichment will look for occurrences of this activity in each case and calculate the duration from that activity's timestamp to the current time. If a case doesn't contain the selected activity, the new attribute will be set to null for that case.
**Duration Type:** Choose the unit of time for the duration calculation. Options include:
- **TimeSpan**: Full time representation (days:hours:minutes:seconds)
- **Seconds**: Total seconds elapsed
- **Minutes**: Total minutes elapsed
- **Hours**: Total hours elapsed
- **Days**: Total days elapsed (default for most business processes)
- **Weeks**: Total weeks elapsed (rounded to nearest week)
- **Months**: Total months elapsed (using 30.44 days per month average)
- **Years**: Total years elapsed (accounting for leap years with 365.25 days)
Select the unit that best matches your analysis needs and reporting requirements.
**Allow Fractional Periods:** When enabled, allows decimal values in the duration calculation (e.g., 2.5 days, 1.75 hours). When disabled, values are rounded to the nearest whole number. This setting only applies when Duration Type is not TimeSpan. Enable this for more precise calculations or disable it for cleaner integer values in reports. Fractional periods are particularly useful for shorter time units like hours or days where precision matters.
## Examples
### Example 1: Support Ticket Aging
**Scenario:** A customer service team needs to monitor how long support tickets have been open since the initial "Ticket Created" activity to ensure they meet their 48-hour response SLA.
**Settings:**
- New Attribute Name: Days Since Ticket Created
- Activity Name: Ticket Created
- Duration Type: Days
- Allow Fractional Periods: true
**Output:**
The enrichment creates a new case attribute "Days Since Ticket Created" with decimal values showing the precise number of days elapsed. For example:
- Case 1001: 0.5 (created 12 hours ago)
- Case 1002: 2.3 (created 2 days and 7 hours ago)
- Case 1003: 5.8 (created almost 6 days ago)
**Insights:** The team can now create filters to identify tickets older than 2 days that require immediate attention, set up alerts for tickets approaching SLA breach, and track average aging trends over time.
### Example 2: Manufacturing Quality Control
**Scenario:** A manufacturing plant needs to track time elapsed since the last quality inspection for products still in the production line to ensure inspections occur every 4 hours.
**Settings:**
- New Attribute Name: Hours Since Last Inspection
- Activity Name: Quality Inspection Completed
- Duration Type: Hours
- Allow Fractional Periods: false
**Output:**
The enrichment generates an integer attribute showing whole hours since the last inspection:
- Batch A-100: 2 hours
- Batch A-101: 5 hours (requires immediate inspection)
- Batch A-102: 1 hour
**Insights:** Production managers can quickly identify batches overdue for inspection, optimize inspection scheduling, and ensure compliance with quality standards.
### Example 3: Healthcare Patient Monitoring
**Scenario:** A hospital emergency department tracks how long patients have been waiting since triage to prioritize care and meet target wait times.
**Settings:**
- New Attribute Name: Minutes Since Triage
- Activity Name: Patient Triaged
- Duration Type: Minutes
- Allow Fractional Periods: false
**Output:**
Creates a minute-based counter for each patient:
- Patient ID 5001: 45 minutes
- Patient ID 5002: 120 minutes
- Patient ID 5003: 15 minutes
**Insights:** Staff can immediately identify patients with excessive wait times, balance workload across available resources, and track performance against target metrics.
### Example 4: Invoice Aging for Accounts Receivable
**Scenario:** The finance department needs to monitor unpaid invoices to manage cash flow and identify invoices requiring collection efforts, with particular focus on those over 30, 60, and 90 days old.
**Settings:**
- New Attribute Name: Invoice Age (Days)
- Activity Name: Invoice Sent
- Duration Type: Days
- Allow Fractional Periods: false
**Output:**
Produces an integer day count for each unpaid invoice:
- Invoice 2024-1001: 15 days
- Invoice 2024-1002: 67 days (requires collection call)
- Invoice 2024-1003: 92 days (escalate to collections)
**Insights:** The finance team can categorize invoices into aging buckets, prioritize collection efforts on older invoices, and identify customers with payment issues.
### Example 5: Procurement Process Monitoring
**Scenario:** A procurement team tracks time since purchase requisition approval to ensure timely order placement and identify delays in the procurement process.
**Settings:**
- New Attribute Name: Days Since PR Approval
- Activity Name: Purchase Requisition Approved
- Duration Type: Days
- Allow Fractional Periods: true
**Output:**
Creates a precise day count showing procurement delays:
- PR-2024-501: 1.2 days (normal processing)
- PR-2024-502: 8.7 days (investigate delay)
- PR-2024-503: 0.4 days (recently approved)
**Insights:** Procurement managers can identify bottlenecks in the purchasing process, track vendor selection efficiency, and ensure timely order placement to maintain inventory levels.
## Output
The enrichment creates a new case-level attribute in your dataset with the calculated duration between the selected activity and the current time. The attribute's data type depends on your Duration Type selection: TimeSpan type for TimeSpan duration, floating-point number for fractional periods, or integer for whole number periods. The attribute value updates dynamically each time the dataset is refreshed, providing real-time aging information.
Cases where the selected activity doesn't exist will have null values for the new attribute, allowing you to easily identify and filter cases missing the activity. The new attribute integrates seamlessly with other mindzie Studio features - use it in filters to identify aged cases, in calculators for average aging analysis, or in dashboards for real-time monitoring. You can also combine this enrichment with performance categorization enrichments to automatically classify cases based on their age (e.g., "New", "Aging", "Overdue").
The enrichment intelligently handles both date-only and datetime comparisons. When timestamps include time components, it calculates precise durations. When dealing with date-only values, it compares at the date level, ensuring accurate calculations regardless of your data's time precision. This makes the enrichment versatile for various data sources and process types.
---
*This documentation is part of the mindzie Studio process mining platform.*
---
## Duration Between An Attribute And An Activity
Section: Enrichments
URL: https://docs.mindziestudio.com/mindzie_studio/enrichments/duration-between-an-attribute-and-an-activity
Source: /docs-master/mindzieStudio/enrichments/duration-between-an-attribute-and-an-activity/page.md
# Duration Between an Attribute and an Activity
## Overview
The Duration Between an Attribute and an Activity enrichment calculates the time difference between a timestamp stored in a case attribute and the occurrence of a selected activity. This enrichment is useful when you need to compare actual activity timing against expected dates, deadlines, or other reference timestamps stored at the case level.
Unlike the Duration Between Two Activities enrichment which measures time between activity occurrences, this enrichment allows you to measure against any timestamp attribute in your case data, making it ideal for SLA monitoring, deadline tracking, and variance analysis.
## Common Uses
- Calculate duration between Due Date and actual Pay Date to identify late payments
- Measure time between Order Request Date and Ship Date to track fulfillment performance
- Analyze duration between Expected Delivery and actual Delivery activity to monitor SLA compliance
- Calculate time between Case Creation timestamp and First Contact activity to measure response times
## Settings
Start by going to the 'Log Enrichment' engine by going to any analysis and clicking 'Log Enrichment' in the top right.

Then click 'Add New'

Then choose the enrichment block.
### Configuration Options
- **New Attribute Name:** Specify the name of the new attribute you are about to create.
- **Attribute Name:** Select the attribute that specifies a certain timestamp and that you wish to use.
- **Activity Name:** Select the activity that needs to be compared to the selected attribute and for which the duration needs to be calculated.
- **Activity First or Last:** Specify whether the timestamp is taken from the 'First' occurrence of this activity in the case, or the 'Last' occurrence of this activity in the case.
- **Duration Type:** Specify the duration units that will be shown in the new attribute column. It can be hours, days, weeks, etc.
## Examples
To calculate the duration between due date and pay date, use the following settings:

In this example:
- **New Attribute Name**: "Days Since Due Date"
- **Attribute Name**: "Due Date" (a case attribute containing the expected payment date)
- **Activity Name**: "Pay Invoice" (the activity when payment occurs)
- **Activity First or Last**: "Last" (use the last occurrence if payment happens multiple times)
- **Duration Type**: "Days" (show results in number of days)
Click 'Create' and once you're ready click 'Calculate Enrichment' to add the new attribute to your data set.
The resulting attribute will show positive values for late payments (paid after due date) and negative values for early payments (paid before due date).

The new attribute should now be added to the log and available for use in filters, dashboards, and analysis.
## Output
When this enrichment is executed, it creates a new numeric case attribute with the name you specified in "New Attribute Name". The attribute contains the calculated duration between the specified attribute timestamp and the selected activity occurrence.
The duration value is calculated based on the "Duration Type" you selected (hours, days, weeks, etc.). The result can be:
- **Positive value**: The activity occurred after the attribute timestamp (e.g., late payment)
- **Negative value**: The activity occurred before the attribute timestamp (e.g., early payment)
- **NULL/Empty**: If either the attribute or activity is missing in the case
This calculated duration can be used in analysis dashboards, filters, and performance metrics to understand timing relationships in your process.
## See Also
**Related Duration Enrichments:**
- [Duration Between Two Activities](/mindzie_studio/enrichments/duration-between-two-activities) - Calculate duration between two activity occurrences
- [Calculated Attributes](/mindzie_studio/enrichments/calculated-attributes) - Create custom calculations using attributes
**Related Topics:**
- [Attribute Enrichments](/mindzie_studio/enrichments/attribute-enrichments) - Understanding enrichments in general
- [Data Rules](/mindzie_studio/enrichments/data-rules) - Validating and transforming data
---
*This documentation is part of the mindzie Studio process mining platform.*
---
## Duration Between An Attribute And Current Time
Section: Enrichments
URL: https://docs.mindziestudio.com/mindzie_studio/enrichments/duration-between-an-attribute-and-current-time
Source: /docs-master/mindzieStudio/enrichments/duration-between-an-attribute-and-current-time/page.md
# Duration Between an Attribute and Current Time
## Overview
The Duration Between an Attribute and Current Time enrichment calculates the elapsed time between a timestamp attribute in your process data and the current moment when the analysis is run. This powerful operator enables real-time monitoring and aging analysis by automatically computing how much time has passed since a specific event or milestone occurred in each case. Whether you're tracking invoice due dates, measuring how long orders have been pending, or monitoring SLA compliance in real-time, this enrichment provides critical time-based metrics that help identify bottlenecks, overdue items, and time-sensitive process issues.
This enrichment is particularly valuable for creating dashboards and reports that need to show current status and aging information. Unlike static duration calculations between two fixed points in time, this operator dynamically updates its calculations based on when the analysis is performed, making it ideal for operational monitoring, compliance tracking, and proactive process management. The flexible output options allow you to express durations in various units (days, hours, minutes, etc.) and formats (whole numbers or fractional values), ensuring the results align with your specific business requirements and reporting standards.
## Common Uses
- Monitor how many days invoices have been outstanding since their due date for accounts receivable management
- Track the age of open support tickets or customer service requests to ensure timely resolution
- Calculate how long purchase orders have been pending approval to identify procurement bottlenecks
- Measure time elapsed since patient admission in healthcare facilities for length-of-stay monitoring
- Determine how many days inventory items have been in stock for warehouse management and aging analysis
- Track the duration since contract expiration dates for renewal management and compliance
- Monitor how long equipment has been out for maintenance to optimize asset utilization
## Settings
**New Attribute Name:** The name of the new case attribute that will store the calculated duration. This should be descriptive and indicate what time period is being measured. For example, if calculating days since invoice due date, you might name it "DaysPastDue" or "InvoiceAgeDays". The attribute name should follow your organization's naming conventions and be easily understood by report users. Avoid using spaces or special characters that might cause issues in subsequent analysis.
**Attribute Name:** Select the existing timestamp attribute from which to calculate the duration. This dropdown displays all DateTime attributes available in your dataset. The attribute you choose represents the starting point for the duration calculation. Common examples include "DueDate", "OrderDate", "AdmissionDate", "ContractStartDate", or any other timestamp field in your data. Ensure the selected attribute contains valid date/time values for accurate calculations.
**Duration Type:** Specifies the unit of measurement for the calculated duration. Available options include:
- Days: Standard for business aging and due date calculations (default)
- Hours: Useful for shorter process cycles or SLA monitoring
- Minutes: For detailed operational tracking
- Seconds: High-precision timing requirements
- Weeks: Longer-term trend analysis
- Months: Financial and contract period calculations
- Years: Long-term lifecycle analysis
- TimeSpan: Returns a formatted duration string (e.g., "5d 3h 45m")
Choose the unit that best matches your business reporting needs and makes the output most intuitive for users.
**Attribute Value As Last Time:** This checkbox reverses the direction of the calculation. When unchecked (default), the calculation is: Current Time - Attribute Value, which gives positive values for past dates. When checked, the calculation becomes: Attribute Value - Current Time, which gives positive values for future dates. Use the default (unchecked) for aging calculations where you want to know how much time has passed. Check this option when calculating time remaining until a future event, such as days until contract expiration or time until scheduled maintenance.
**Allow Fractional Periods:** Controls whether the output includes decimal values or rounds to whole numbers. When unchecked (default), durations are returned as integers (e.g., "5 days"). When checked, durations include fractional parts (e.g., "5.75 days"). Enable this for more precise calculations, especially when using larger time units like days or weeks where partial periods are meaningful. Financial calculations often require fractional periods for accurate interest or penalty calculations.
## Examples
### Example 1: Invoice Aging for Accounts Receivable
**Scenario:** A finance team needs to monitor outstanding invoices and identify those that are overdue by calculating the number of days past the invoice due date.
**Settings:**
- New Attribute Name: DaysPastDue
- Attribute Name: InvoiceDueDate
- Duration Type: Days
- Attribute Value As Last Time: Unchecked
- Allow Fractional Periods: Unchecked
**Output:**
The enrichment creates a new case attribute "DaysPastDue" with integer values representing the number of complete days since each invoice's due date. For example:
- Invoice #1001 with due date 2024-01-15: 45 days past due
- Invoice #1002 with due date 2024-02-01: 28 days past due
- Invoice #1003 with due date 2024-02-20: 9 days past due
- Invoice #1004 with future due date: 0 or negative value (not yet due)
**Insights:** The finance team can now easily filter for invoices past due by more than 30 days for collection efforts, create aging buckets (0-30, 31-60, 61-90, 90+ days), and calculate average days sales outstanding (DSO) metrics.
### Example 2: Patient Length of Stay Monitoring
**Scenario:** A hospital administrator needs to track how long patients have been admitted to optimize bed utilization and identify potential discharge delays in real-time.
**Settings:**
- New Attribute Name: CurrentLengthOfStayHours
- Attribute Name: AdmissionDateTime
- Duration Type: Hours
- Attribute Value As Last Time: Unchecked
- Allow Fractional Periods: Checked
**Output:**
The enrichment generates "CurrentLengthOfStayHours" showing precise duration since admission:
- Patient A admitted 3 days ago: 72.5 hours
- Patient B admitted yesterday morning: 31.25 hours
- Patient C admitted 6 hours ago: 6.0 hours
- Patient D admitted 2 weeks ago: 336.75 hours
**Insights:** Hospital staff can identify patients with extended stays requiring case management review, monitor average length of stay trends in real-time, and proactively manage bed capacity by predicting discharge patterns.
### Example 3: Purchase Order Approval Delays
**Scenario:** A procurement team wants to identify purchase orders that have been waiting for approval to expedite processing and prevent supplier relationship issues.
**Settings:**
- New Attribute Name: DaysAwaitingApproval
- Attribute Name: SubmissionDate
- Duration Type: Days
- Attribute Value As Last Time: Unchecked
- Allow Fractional Periods: Checked
**Output:**
Creates "DaysAwaitingApproval" attribute with fractional day values:
- PO-2024-001 submitted last week: 7.5 days
- PO-2024-002 submitted yesterday: 1.25 days
- PO-2024-003 submitted this morning: 0.33 days
- PO-2024-004 submitted 3 weeks ago: 21.75 days
**Insights:** The procurement team can prioritize orders waiting longest for approval, identify approval bottlenecks by analyzing patterns in delayed orders, and set up alerts for orders exceeding acceptable waiting periods.
### Example 4: Equipment Maintenance Duration Tracking
**Scenario:** A manufacturing plant needs to monitor how long equipment has been out for maintenance to minimize production downtime and optimize maintenance scheduling.
**Settings:**
- New Attribute Name: MaintenanceTimeSpan
- Attribute Name: MaintenanceStartTime
- Duration Type: TimeSpan
- Attribute Value As Last Time: Unchecked
- Allow Fractional Periods: Not applicable for TimeSpan
**Output:**
Generates "MaintenanceTimeSpan" with formatted duration strings:
- Machine A: "2d 4h 30m" (2 days, 4 hours, 30 minutes in maintenance)
- Machine B: "0d 8h 15m" (8 hours, 15 minutes in maintenance)
- Machine C: "5d 12h 45m" (5 days, 12 hours, 45 minutes in maintenance)
- Machine D: "0d 2h 10m" (2 hours, 10 minutes in maintenance)
**Insights:** Operations managers can quickly identify equipment with extended maintenance times, calculate actual vs. planned maintenance durations, and optimize maintenance windows to minimize production impact.
### Example 5: Contract Renewal Countdown
**Scenario:** A sales team needs to track time remaining until customer contracts expire to proactively manage renewals and prevent service interruptions.
**Settings:**
- New Attribute Name: DaysUntilExpiration
- Attribute Name: ContractEndDate
- Duration Type: Days
- Attribute Value As Last Time: Checked
- Allow Fractional Periods: Unchecked
**Output:**
Creates "DaysUntilExpiration" showing whole days until contract expiration:
- Customer A contract expires in 2 months: 60 days
- Customer B contract expires next week: 7 days
- Customer C contract expires tomorrow: 1 day
- Customer D contract already expired: -5 days (negative indicates expired)
**Insights:** The sales team can create renewal campaigns targeting contracts expiring within 30-60 days, prioritize urgent renewals for contracts expiring within a week, and identify already-expired contracts requiring immediate attention.
## Output
The Duration Between an Attribute and Current Time enrichment creates a single new case attribute in your dataset containing the calculated time duration for each case. The data type and format of this attribute depend on your selected Duration Type setting. When Duration Type is set to Days, Hours, Minutes, Seconds, Weeks, Months, or Years, the enrichment creates either an integer attribute (when Allow Fractional Periods is unchecked) or a decimal attribute (when checked). Integer values provide whole number durations suitable for high-level reporting, while decimal values offer precise measurements for detailed analysis. When Duration Type is set to TimeSpan, the enrichment creates a TimeSpan attribute displaying formatted duration strings like "3d 14h 22m" that are human-readable and ideal for operational dashboards.
The output attribute automatically handles null values in the source timestamp attribute by producing null results, ensuring data integrity is maintained throughout your analysis. Negative values in the output indicate reverse time relationships - when Attribute Value As Last Time is unchecked, negative values mean the timestamp is in the future; when checked, negative values indicate the timestamp is in the past. This bidirectional capability makes the enrichment suitable for both aging analysis and countdown scenarios.
The calculated duration values can be immediately used in subsequent enrichments, filters, and calculators. Common applications include creating categorical buckets (e.g., "0-30 days", "31-60 days"), setting threshold-based alerts, calculating statistical measures like average age or maximum duration, and building KPIs for process performance monitoring. The attribute integrates seamlessly with mindzie's visualization components, allowing you to create charts, gauges, and tables that dynamically update based on when the analysis is refreshed.
---
*This documentation is part of the mindzie Studio process mining platform.*
---
## Duration Between Two Activities
Section: Enrichments
URL: https://docs.mindziestudio.com/mindzie_studio/enrichments/duration-between-two-activities
Source: /docs-master/mindzieStudio/enrichments/duration-between-two-activities/page.md
# Duration Between Two Activities
## Overview
The Duration Between Two Activities enrichment calculates the time elapsed between two selected activities within a case and adds this duration as a new case attribute. You can specify whether to use the first or last occurrence of each activity, making this enrichment flexible for analyzing different process patterns. This is valuable for performance analysis, bottleneck identification, and SLA monitoring.
## Common Uses
- **Invoice Processing**: Calculate cycle time from "Enter Invoice" to "Pay Invoice" to measure payment processing speed
- **Order Fulfillment**: Measure duration from "Order Placed" to "Shipment Sent" for delivery performance
- **Approval Workflows**: Track time between "Request Submitted" and "Approval Granted" to identify approval delays
- **Support Tickets**: Monitor resolution time from "Ticket Created" to "Ticket Closed" for customer service metrics
## Settings
Start by going to the 'Log Enrichment' engine by going to any analysis and clicking 'Log Enrichment' in the top right.

Then click 'Add New'

Then choose the enrichment block.
### Configuration Options
- **New Attribute Name**: Specify the name of the new duration attribute that will be created in your dataset
- **First Activity**: Select the activity that marks the start point for duration calculation
- **First Activity First or Last**: Choose whether to use the 'First' or 'Last' occurrence of this activity in the case
- **Second Activity**: Select the activity that marks the end point for duration calculation
- **Second Activity First or Last**: Choose whether to use the 'First' or 'Last' occurrence of this activity in the case
**Choosing First vs. Last Occurrence:**
- Use **First** occurrence when you want to measure from the initial instance of an activity
- Use **Last** occurrence when you want to measure to/from the final instance of an activity
- Example: For "First occurrence of Order Created" to "Last occurrence of Payment Received" measures total order-to-payment cycle including any retries
## Examples
To calculate the duration between enter invoice and post invoice, use the following settings:

In this example:
- **New Attribute Name**: "Invoice_Processing_Time"
- **First Activity**: "Enter Invoice" (using First occurrence)
- **Second Activity**: "Post Invoice" (using First occurrence)
Click 'Create' and once you're ready click 'Calculate Enrichment' to add the new attribute to your data set.

The new duration attribute is now available in your dataset for analysis, filtering, and visualization.
## Output
When this enrichment is executed, it creates a new case attribute with the name you specified in "New Attribute Name". The attribute contains:
- **Data Type**: Numeric (decimal)
- **Units**: Duration in hours
- **Value**: The time elapsed between the two specified activities
- **Null Values**: If either activity doesn't exist in a case, or if they occur in the wrong order, the value will be null
**Example Output Values:**
- `24.5` = 24.5 hours between the two activities
- `168.0` = 7 days (168 hours) between activities
- `null` = One or both activities not found in the case
You can use this new attribute in:
- Performance dashboards to visualize cycle times
- Case filters to identify slow-moving cases
- Statistical analysis to calculate average durations
- Variant analysis to compare different process paths
## See Also
**Related Duration Enrichments:**
- [Duration Between an Attribute and an Activity](/mindzie_studio/enrichments/duration-between-an-attribute-and-an-activity) - Calculate duration from a case attribute to an activity
- [Calculated Attributes](/mindzie_studio/enrichments/calculated-attributes) - Create custom calculations using attributes
**Related Topics:**
- [Attribute Enrichments](/mindzie_studio/enrichments/attribute-enrichments) - Understanding enrichments in general
- [Data Rules](/mindzie_studio/enrichments/data-rules) - Validating and transforming data
---
*This documentation is part of the mindzie Studio process mining platform.*
---
## Duration Between Two Event Attributes
Section: Enrichments
URL: https://docs.mindziestudio.com/mindzie_studio/enrichments/duration-between-two-event-attributes
Source: /docs-master/mindzieStudio/enrichments/duration-between-two-event-attributes/page.md
# Duration Between Two Event Attributes
## Overview
The Duration Between Two Event Attributes enrichment calculates the time difference between two timestamp or timespan fields within the same event record. This powerful enrichment enables you to measure elapsed time between related temporal data points that exist on individual events, such as the time between a scheduled appointment and the actual arrival, or between request submission and approval within a single transaction record.
Unlike enrichments that measure duration across different events in a case, this operator works exclusively at the event level, comparing two datetime or timespan attributes that already exist on each event. This makes it particularly valuable for analyzing delays, lead times, and turnaround metrics where both the start and end timestamps are captured as separate fields in your source system. The enrichment supports both DateTime and TimeSpan attribute types, providing maximum flexibility for diverse timing scenarios.
The enrichment creates a new event-level timespan attribute containing the calculated duration, which can then be used in filters, visualizations, and performance analysis to identify bottlenecks, measure service level compliance, and understand timing variations across your process instances. The calculation is performed as (Attribute Last - Attribute First), enabling both positive durations (when events run late) and negative durations (when events complete early or arrive ahead of schedule).
## Common Uses
- Calculate appointment delay by measuring time between scheduled appointment time and actual patient arrival time in healthcare processes
- Measure approval turnaround by comparing request submission timestamp with approval timestamp on the same transaction record
- Track shipping delays by calculating the difference between promised delivery date and actual delivery date
- Analyze response time by measuring duration between customer inquiry timestamp and first response timestamp
- Evaluate schedule adherence by comparing planned start time with actual start time for maintenance activities
- Measure processing efficiency by calculating time between document receipt timestamp and processing completion timestamp
- Monitor SLA compliance by measuring time between ticket creation and first response within support ticket records
- Track manufacturing schedule variance by comparing planned versus actual production start times
## Settings
**New Attribute Name:** The name of the new event attribute that will store the calculated time difference. This attribute will be created as a TimeSpan data type and will appear in your event table alongside other event attributes. Choose a descriptive name that clearly indicates what duration is being measured, such as "Approval Delay", "Delivery Variance", or "Processing Time". The attribute name should follow your organization's naming conventions and be meaningful when used in filters and visualizations. This field accepts any valid attribute name and becomes the identifier for accessing the calculated duration in subsequent analysis steps.
**Attribute Name First:** The event attribute containing the earlier timestamp in the duration calculation. This must be an existing DateTime or TimeSpan attribute on your event table. The enrichment will use this as the starting point for the duration measurement. For example, if measuring appointment delays, this would be the "Scheduled Appointment Time" field. The dropdown automatically filters to show only valid DateTime and TimeSpan attributes from your event table, excluding calculated and hidden attributes. This ensures you can only select appropriate temporal data for the calculation.
**Attribute Name Last:** The event attribute containing the later timestamp in the duration calculation. This must be an existing DateTime or TimeSpan attribute on your event table. The enrichment will use this as the ending point for the duration measurement. For example, if measuring appointment delays, this would be the "Actual Arrival Time" field. The calculation is performed as (Attribute Name Last - Attribute Name First), so ensure you select the chronologically later timestamp here. Positive results indicate the second timestamp occurs after the first (delay or duration), while negative results indicate the second timestamp occurs before the first (early completion).
## Examples
### Example 1: Healthcare Appointment Delay Analysis
**Scenario:** A medical clinic wants to measure patient appointment delays by comparing scheduled appointment times with actual arrival times. Both timestamps are recorded in their appointment system as separate fields on each appointment event. Understanding these delays helps optimize scheduling and improve patient satisfaction.
**Settings:**
- New Attribute Name: Appointment Delay
- Attribute Name First: Scheduled Time
- Attribute Name Last: Actual Arrival Time
**Output:**
The enrichment creates a new event attribute called "Appointment Delay" containing TimeSpan values representing the difference between scheduled and actual times:
- Events where patients arrive early will have negative durations (e.g., -00:15:00 for 15 minutes early)
- Events where patients arrive on time will have zero or near-zero durations (e.g., 00:02:00 for 2 minutes late)
- Events where patients arrive late will have positive durations (e.g., 00:45:00 for 45 minutes late)
Sample data:
| Patient ID | Scheduled Time | Actual Arrival Time | Appointment Delay |
|------------|----------------|---------------------|-------------------|
| P-1001 | 2024-01-15 09:00 | 2024-01-15 09:12 | 00:12:00 |
| P-1002 | 2024-01-15 10:30 | 2024-01-15 10:25 | -00:05:00 |
| P-1003 | 2024-01-15 14:00 | 2024-01-15 14:38 | 00:38:00 |
**Insights:** The clinic discovered that 35% of patients arrive more than 15 minutes late for afternoon appointments, leading to schedule cascading delays. They adjusted their scheduling algorithm to add buffer time between afternoon slots, reducing overall wait times by 22%.
### Example 2: Purchase Order Approval Turnaround
**Scenario:** A procurement department needs to measure the time between when a purchase order is submitted and when it receives approval. Both timestamps exist in their ERP system as separate fields on each PO record. Tracking this turnaround time helps identify approval bottlenecks and ensure timely purchasing decisions.
**Settings:**
- New Attribute Name: Approval Turnaround Time
- Attribute Name First: Submission DateTime
- Attribute Name Last: Approval DateTime
**Output:**
A new event attribute "Approval Turnaround Time" is created showing the elapsed time for each purchase order approval:
- Fast approvals: 00:15:30 (15 minutes 30 seconds)
- Standard approvals: 1.08:20:00 (1 day, 8 hours, 20 minutes)
- Delayed approvals: 5.14:30:00 (5 days, 14 hours, 30 minutes)
Sample data:
| PO Number | Amount | Submission DateTime | Approval DateTime | Approval Turnaround Time |
|-----------|--------|---------------------|-------------------|--------------------------|
| PO-8821 | $450 | 2024-02-10 08:30 | 2024-02-10 09:15 | 00:45:00 |
| PO-8822 | $15,200 | 2024-02-10 10:00 | 2024-02-12 14:30 | 2.04:30:00 |
| PO-8823 | $89,500 | 2024-02-10 11:20 | 2024-02-16 09:45 | 5.22:25:00 |
**Insights:** Analysis revealed that purchase orders above $50,000 take an average of 4.5 days for approval, while those under $1,000 are approved in under 2 hours. The organization implemented automated approval workflows for low-value purchases, reducing overall approval time by 40%.
### Example 3: Manufacturing Schedule Adherence
**Scenario:** A manufacturing plant tracks planned start times versus actual start times for production runs. Each production order has both a scheduled start time and an actual start time recorded in their MES (Manufacturing Execution System). Measuring this variance helps identify scheduling accuracy and capacity planning effectiveness.
**Settings:**
- New Attribute Name: Start Time Variance
- Attribute Name First: Planned Start Time
- Attribute Name Last: Actual Start Time
**Output:**
The "Start Time Variance" attribute shows whether production runs started early (negative), on time (near zero), or late (positive):
- Early starts indicate available capacity or schedule flexibility
- Late starts reveal scheduling conflicts or upstream delays
- Consistent patterns help optimize production planning
Sample data:
| Work Order | Product Line | Planned Start Time | Actual Start Time | Start Time Variance |
|------------|--------------|-------------------|-------------------|---------------------|
| WO-5501 | Line A | 2024-03-05 06:00 | 2024-03-05 06:00 | 00:00:00 |
| WO-5502 | Line B | 2024-03-05 08:00 | 2024-03-05 09:45 | 01:45:00 |
| WO-5503 | Line C | 2024-03-05 12:00 | 2024-03-05 11:50 | -00:10:00 |
**Insights:** The plant identified that Line B consistently starts 1-2 hours late due to prolonged changeover times from the previous shift. By implementing parallel changeover activities, they reduced average start time variance from 90 minutes to 15 minutes, increasing daily production capacity by 8%.
### Example 4: Customer Support Response Time
**Scenario:** A customer support organization needs to measure how quickly agents provide their first response to incoming support tickets. Their ticketing system records both the ticket creation timestamp and the first response timestamp as separate fields. Monitoring this response time is critical for SLA compliance and customer satisfaction.
**Settings:**
- New Attribute Name: First Response Time
- Attribute Name First: Ticket Created DateTime
- Attribute Name Last: First Response DateTime
**Output:**
The enrichment produces a "First Response Time" attribute showing elapsed time to first response for each ticket:
- Excellent response: 00:08:30 (8 minutes 30 seconds)
- Meeting SLA: 00:55:20 (55 minutes 20 seconds)
- SLA breach: 02:15:45 (2 hours 15 minutes 45 seconds)
Sample data:
| Ticket ID | Priority | Created DateTime | First Response DateTime | First Response Time |
|-----------|----------|------------------|-------------------------|---------------------|
| TKT-9001 | High | 2024-04-12 10:22 | 2024-04-12 10:30 | 00:08:00 |
| TKT-9002 | Medium | 2024-04-12 11:15 | 2024-04-12 12:05 | 00:50:00 |
| TKT-9003 | Low | 2024-04-12 14:30 | 2024-04-12 16:55 | 02:25:00 |
**Insights:** The support team discovered that high-priority tickets average 12 minutes to first response, well within their 30-minute SLA, but medium-priority tickets average 75 minutes against a 60-minute target. They adjusted their triage process and staffing levels to prioritize medium-priority tickets, improving SLA compliance from 78% to 94%.
### Example 5: Logistics Delivery Performance
**Scenario:** A logistics company needs to analyze delivery performance by comparing promised delivery dates with actual delivery dates. Both dates are captured in their shipment tracking system at the time of order creation and delivery confirmation. Understanding delivery variance helps identify carrier performance issues and improve customer expectations.
**Settings:**
- New Attribute Name: Delivery Variance
- Attribute Name First: Promised Delivery Date
- Attribute Name Last: Actual Delivery Date
**Output:**
The "Delivery Variance" attribute indicates whether deliveries were early (negative), on time (zero or small positive), or late (positive):
- Early deliveries: -1.00:00:00 (1 day early)
- On-time deliveries: 00:00:00 to 04:00:00 (on time to 4 hours late)
- Late deliveries: 2.08:30:00 (2 days 8 hours 30 minutes late)
Sample data:
| Shipment ID | Carrier | Promised Delivery | Actual Delivery | Delivery Variance |
|-------------|---------|------------------|-----------------|-------------------|
| SHP-7701 | FastShip | 2024-05-20 17:00 | 2024-05-20 15:30 | -01:30:00 |
| SHP-7702 | QuickCargo | 2024-05-21 12:00 | 2024-05-21 11:45 | -00:15:00 |
| SHP-7703 | StandardPost | 2024-05-22 10:00 | 2024-05-24 14:20 | 2.04:20:00 |
**Insights:** Analysis revealed that 18% of deliveries were more than 1 day late, with StandardPost accounting for 65% of these delays. The company renegotiated service levels with carriers and implemented a dynamic carrier selection algorithm based on historical performance, reducing late deliveries from 18% to 7% and improving customer satisfaction scores by 15 points.
## Output
The Duration Between Two Event Attributes enrichment creates a single new event-level attribute with the following characteristics:
**Data Type:** TimeSpan - The new attribute stores duration values in TimeSpan format, representing the time difference between the two selected attributes. TimeSpan values can be positive (when the second timestamp is later), negative (when the second timestamp is earlier), or zero (when both timestamps are identical).
**Attribute Location:** The new attribute is added to the event table and appears alongside other event attributes in your dataset. It is marked as a derived attribute and will be visible in event filters, event attribute lists, and can be aggregated to case level using statistical enrichments.
**Calculation Method:** For each event, the enrichment calculates: (Attribute Name Last - Attribute Name First). If either source attribute is null or missing for a particular event, the new attribute will remain null for that event, ensuring data integrity without creating false zero values.
**Display Format:** The TimeSpan values are displayed in standard duration format (days.hours:minutes:seconds). For example:
- 00:15:30 represents 15 minutes and 30 seconds
- 1.08:20:00 represents 1 day, 8 hours, and 20 minutes
- -00:05:00 represents negative 5 minutes (earlier arrival)
**Integration with Other Features:** The calculated duration attribute can be used in multiple ways:
- **Event Filters:** Filter events based on duration thresholds (e.g., show only events where response time exceeds 1 hour)
- **Case Aggregations:** Use Sum, Average, Min, or Max enrichments to aggregate event-level durations to case level
- **Performance Analysis:** Visualize duration distributions in charts and identify outliers
- **Calculators:** Reference the duration in custom calculator expressions for complex business logic
- **Conformance Checking:** Define conformance rules based on acceptable duration ranges
**Dependencies:** The enrichment depends on the two source attributes specified in the configuration. If either source attribute is renamed, hidden, or removed from the dataset, the calculated duration attribute will need to be reconfigured or may become invalid. The enrichment tracks these dependencies and will warn users if source attributes are modified.
**Performance Considerations:** This enrichment performs a simple subtraction operation for each event and has minimal performance impact, even on large datasets with millions of events. The calculation is executed once when the enrichment is run and the results are stored, so subsequent analysis operations reference the pre-calculated values without recalculation overhead.
## See Also
- [Duration Between Two Activities](/mindzie_studio/enrichments/duration-between-two-activities) - Calculate time between different activities at the case level
- [Duration Between an Activity and Current Time](/mindzie_studio/enrichments/duration-between-an-activity-and-current-time) - Measure elapsed time from an activity to now
- [Durations Between Case Attribute and Activity Times](/mindzie_studio/enrichments/durations-between-case-attribute-and-activity-times) - Calculate multiple durations from a case attribute
- [Add Days to a Date](/mindzie_studio/enrichments/add-days-to-a-date) - Add or subtract days from date attributes
---
*This documentation is part of the mindzie Studio process mining platform.*
---
## Durations Between Case Attribute And Activity Times
Section: Enrichments
URL: https://docs.mindziestudio.com/mindzie_studio/enrichments/durations-between-case-attribute-and-activity-times
Source: /docs-master/mindzieStudio/enrichments/durations-between-case-attribute-and-activity-times/page.md
# Durations Between a Case Attribute and Activity Times
## Overview
The Durations Between a Case Attribute and Activity Times enrichment calculates the time difference between a case-level timestamp attribute and each individual event's activity time within that case. This powerful enrichment creates a new event attribute that shows how much time has elapsed between a fixed reference point (such as order date, contract start date, or due date) and each activity in the process. This enables detailed analysis of how activities relate to important business deadlines, milestones, or baseline dates.
Unlike enrichments that measure time between activities, this operator uses a case-level timestamp as the anchor point for all duration calculations. This is particularly valuable when you need to understand how each step in your process relates to a critical business date, such as measuring all activities against a service level agreement deadline, tracking progress from a project start date, or analyzing how activities cluster around a payment due date. The enrichment supports both forward calculations (time since the reference date) and backward calculations (time until the reference date), with flexible time unit options ranging from seconds to years.
## Common Uses
- Track time elapsed from order placement date to each fulfillment activity in the order-to-cash process
- Measure how many days before or after a payment due date each collection activity occurs
- Monitor time from patient admission date to each medical procedure in healthcare processes
- Calculate days from contract signature to each milestone delivery in project management
- Analyze how long after case creation each customer service interaction happens
- Measure time from production start date to each quality check or manufacturing step
- Track days from loan application date to each approval or verification activity
## Settings
**New Attribute Name:** The name for the new event attribute that will store the calculated durations. This attribute will be created at the event level, meaning each event in a case will have its own duration value calculated from the case attribute. Choose a descriptive name that clearly indicates what is being measured, such as "Days_Since_Order_Date", "Hours_Until_Due_Date", or "Time_From_Contract_Start". The name must be unique and not already exist in your dataset.
**Attribute Name:** The case-level timestamp attribute to use as the reference point for all duration calculations. This dropdown lists all available DateTime attributes from your case table. Select the attribute that represents your business reference date, such as "Order_Date", "Due_Date", "Contract_Start_Date", or "SLA_Deadline". Only DateTime type attributes are available for selection, ensuring valid timestamp comparisons.
**Duration Type:** Specifies the unit of time for the duration calculation. Options include:
- **TimeSpan**: Preserves the full time duration with days, hours, minutes, and seconds (displayed as "2d 14:30:45")
- **Seconds**: Total number of seconds between timestamps
- **Minutes**: Total number of minutes (useful for short processes)
- **Hours**: Total number of hours (ideal for same-day or multi-day processes)
- **Days**: Total number of days (most common for business processes)
- **Weeks**: Total number of weeks (useful for longer-running processes)
- **Months**: Approximate number of months (calculated as days/30.44)
- **Years**: Number of years (for very long-running processes)
**Attribute Should Come First:** Controls the direction of the duration calculation. When checked (default), the calculation is "event time minus case attribute time", producing positive values when events occur after the reference date. When unchecked, the calculation is reversed to "case attribute time minus event time", producing positive values when events occur before the reference date. Use the default setting to measure time elapsed since a start date, or uncheck to measure time remaining until a deadline.
**Allow Fractional Periods:** Determines whether duration values can include decimal places. When unchecked (default), durations are rounded down to whole numbers (e.g., 3 days instead of 3.7 days). When checked, durations preserve decimal precision (e.g., 3.7 days, 2.5 hours). Enable this for more precise calculations when analyzing detailed time metrics or when small time differences matter. Keep it disabled for cleaner reporting when whole units are sufficient.
## Examples
### Example 1: Order Fulfillment Time Tracking
**Scenario:** An e-commerce company wants to track how long each fulfillment step takes from the original order placement date to identify bottlenecks in their order-to-cash process.
**Settings:**
- New Attribute Name: Days_Since_Order
- Attribute Name: Order_Date
- Duration Type: Days
- Attribute Should Come First: Checked (true)
- Allow Fractional Periods: Unchecked (false)
**Output:**
The enrichment creates a new event attribute "Days_Since_Order" showing whole number of days from order placement:
| Activity | Activity Time | Order_Date | Days_Since_Order |
|----------|--------------|------------|------------------|
| Order Placed | 2024-01-15 09:00 | 2024-01-15 | 0 |
| Payment Verified | 2024-01-15 14:00 | 2024-01-15 | 0 |
| Picked | 2024-01-16 10:00 | 2024-01-15 | 1 |
| Packed | 2024-01-16 15:00 | 2024-01-15 | 1 |
| Shipped | 2024-01-17 08:00 | 2024-01-15 | 2 |
| Delivered | 2024-01-19 16:00 | 2024-01-15 | 4 |
**Insights:** The company can now easily filter for orders where "Days_Since_Order" exceeds their 3-day fulfillment SLA at the shipping stage, identifying which activities cause delays.
### Example 2: Payment Collection Before Due Date
**Scenario:** A financial services company needs to analyze their collection activities in relation to payment due dates, understanding which activities happen proactively versus reactively.
**Settings:**
- New Attribute Name: Days_Until_Due_Date
- Attribute Name: Payment_Due_Date
- Duration Type: Days
- Attribute Should Come First: Unchecked (false)
- Allow Fractional Periods: Checked (true)
**Output:**
The enrichment creates "Days_Until_Due_Date" showing decimal days until the due date (positive) or days overdue (negative):
| Activity | Activity Time | Payment_Due_Date | Days_Until_Due_Date |
|----------|--------------|------------------|---------------------|
| Invoice Sent | 2024-02-01 | 2024-02-15 | 14.0 |
| Reminder Email | 2024-02-10 | 2024-02-15 | 5.0 |
| Phone Call | 2024-02-14 | 2024-02-15 | 1.0 |
| Payment Received | 2024-02-16 | 2024-02-15 | -1.0 |
| Late Fee Applied | 2024-02-20 | 2024-02-15 | -5.0 |
**Insights:** Positive values indicate proactive collection efforts, while negative values show reactive measures after the due date, helping optimize collection strategies.
### Example 3: Patient Treatment Timeline in Healthcare
**Scenario:** A hospital wants to track all treatment activities relative to patient admission time to ensure timely care delivery and identify delays in critical treatments.
**Settings:**
- New Attribute Name: Hours_Since_Admission
- Attribute Name: Admission_DateTime
- Duration Type: Hours
- Attribute Should Come First: Checked (true)
- Allow Fractional Periods: Checked (true)
**Output:**
The enrichment produces "Hours_Since_Admission" with precise decimal hour values:
| Activity | Activity Time | Admission_DateTime | Hours_Since_Admission |
|----------|--------------|-------------------|----------------------|
| Emergency Admission | 2024-03-10 14:30 | 2024-03-10 14:30 | 0.0 |
| Triage Assessment | 2024-03-10 14:45 | 2024-03-10 14:30 | 0.25 |
| Blood Test Ordered | 2024-03-10 15:15 | 2024-03-10 14:30 | 0.75 |
| Doctor Consultation | 2024-03-10 16:00 | 2024-03-10 14:30 | 1.5 |
| Treatment Started | 2024-03-10 17:30 | 2024-03-10 14:30 | 3.0 |
| Patient Discharged | 2024-03-11 09:00 | 2024-03-10 14:30 | 18.5 |
**Insights:** The hospital can set thresholds for critical activities (e.g., triage within 0.5 hours, treatment within 4 hours) and monitor compliance across all emergency cases.
### Example 4: Manufacturing Lead Time Analysis
**Scenario:** A manufacturer needs to measure each production step against the planned production start date to optimize their manufacturing schedule and identify process inefficiencies.
**Settings:**
- New Attribute Name: Production_Days
- Attribute Name: Planned_Start_Date
- Duration Type: Days
- Attribute Should Come First: Checked (true)
- Allow Fractional Periods: Unchecked (false)
**Output:**
The enrichment creates "Production_Days" showing whole days from planned start:
| Activity | Activity Time | Planned_Start_Date | Production_Days |
|----------|--------------|-------------------|-----------------|
| Material Received | 2024-04-01 | 2024-04-03 | -2 |
| Production Started | 2024-04-03 | 2024-04-03 | 0 |
| Assembly Complete | 2024-04-05 | 2024-04-03 | 2 |
| Quality Check 1 | 2024-04-06 | 2024-04-03 | 3 |
| Rework | 2024-04-07 | 2024-04-03 | 4 |
| Quality Check 2 | 2024-04-08 | 2024-04-03 | 5 |
| Packaging | 2024-04-09 | 2024-04-03 | 6 |
**Insights:** Negative values indicate early material arrival, while the progression shows a 6-day production cycle with rework adding 2 extra days, highlighting quality issues.
### Example 5: Project Milestone Tracking
**Scenario:** A consulting firm tracks all project activities against the contract signature date to ensure deliverables align with contractual timelines and identify schedule risks.
**Settings:**
- New Attribute Name: Weeks_From_Contract
- Attribute Name: Contract_Signed_Date
- Duration Type: Weeks
- Attribute Should Come First: Checked (true)
- Allow Fractional Periods: Checked (true)
**Output:**
The enrichment generates "Weeks_From_Contract" with decimal week values:
| Activity | Activity Time | Contract_Signed_Date | Weeks_From_Contract |
|----------|--------------|---------------------|-------------------|
| Contract Signed | 2024-01-01 | 2024-01-01 | 0.0 |
| Kickoff Meeting | 2024-01-03 | 2024-01-01 | 0.29 |
| Requirements Gathered | 2024-01-15 | 2024-01-01 | 2.0 |
| Design Approved | 2024-01-29 | 2024-01-01 | 4.0 |
| Development Started | 2024-02-05 | 2024-01-01 | 5.0 |
| Testing Complete | 2024-03-04 | 2024-01-01 | 9.0 |
| Delivery | 2024-03-11 | 2024-01-01 | 10.0 |
**Insights:** The firm can compare actual milestone timing against contracted schedules, with the 10-week total duration helping validate future project estimates and resource planning.
## Output
The enrichment creates a new event-level attribute containing the calculated duration between the specified case attribute and each event's activity time. The attribute type depends on your Duration Type selection: TimeSpan type for the TimeSpan option (preserving full time precision), Integer type for whole number durations when fractional periods are disabled, or Float type for decimal durations when fractional periods are enabled.
Each event in the dataset receives its own duration value, calculated individually based on its activity timestamp. The calculation respects the "Attribute Should Come First" setting to determine whether durations are positive (events after the reference date) or negative (events before the reference date). When dates have no time component (midnight timestamps), the enrichment automatically uses date-only arithmetic for cleaner day calculations.
The new attribute integrates seamlessly with other mindzieStudio features. Use it in filters to identify events occurring within specific time windows (e.g., "Show all activities occurring more than 5 days after order date"). Combine it with calculators to compute average durations, identify outliers, or create duration-based KPIs. The attribute can also serve as input for other enrichments, such as categorizing events into time buckets or identifying cases with unusual timing patterns.
---
*This documentation is part of the mindzie Studio process mining platform.*
---
## Event Count
Section: Enrichments
URL: https://docs.mindziestudio.com/mindzie_studio/enrichments/event-count
Source: /docs-master/mindzieStudio/enrichments/event-count/page.md
# Event Count
## Overview
The Event Count enrichment is a fundamental statistics operator that counts the number of events within each case in your process dataset. This enrichment provides essential metrics for understanding case complexity, process variations, and workload distribution across your business processes. Unlike simple case counting, this operator counts the individual activities or events that make up each case, giving you insights into case granularity and process intensity.
The Event Count enrichment becomes particularly powerful when combined with filters, allowing you to count specific types of events or activities that meet certain criteria. For example, you can count only manual activities, system events, or activities performed by specific resources. This targeted counting enables sophisticated analysis of process behavior patterns and helps identify cases that deviate from normal event frequency distributions.
## Common Uses
- **Process Complexity Analysis:** Measure the complexity of individual cases by counting their total number of events
- **Workload Assessment:** Identify cases with unusually high or low event counts to understand workload distribution
- **Quality Control:** Count inspection or review events to ensure compliance with quality standards
- **Automation Opportunities:** Count manual versus automated events to identify automation potential
- **Performance Benchmarking:** Compare event counts across different case types, regions, or time periods
- **Exception Detection:** Identify outlier cases with abnormal event frequencies that may indicate process issues
- **Resource Planning:** Understand event volumes to better allocate resources and capacity
## Settings
**Filter:** Optional filter configuration that allows you to count only specific events that meet defined criteria. When no filter is applied, all events in each case are counted. Use filters to count events based on activity names, timestamps, resources, or any other event attributes. This setting enables targeted analysis such as counting only manual activities, error events, or activities performed during specific shifts.
**New Attribute Name:** The name of the new case attribute that will store the event count value. This attribute will be added to your case table as an integer field. Choose a descriptive name that clearly indicates what events are being counted, especially when using filters. For example, use "Total_Event_Count" for all events, "Manual_Activity_Count" for filtered manual activities, or "Error_Event_Count" for error-related events.
## Examples
### Example 1: Total Event Count in Purchase Orders
**Scenario:** A procurement team needs to understand the complexity of their purchase order processes by counting the total number of events in each case to identify which orders require the most processing effort.
**Settings:**
- Filter: None (count all events)
- New Attribute Name: Total_PO_Events
**Output:**
The enrichment creates a new case attribute "Total_PO_Events" containing integer values:
- Standard orders: 8-12 events (create, approve, send to vendor, receive goods, invoice, payment)
- Complex orders: 25-40 events (multiple approvals, change requests, partial deliveries, disputes)
- Rush orders: 5-7 events (streamlined process with fewer steps)
**Insights:** The analysis reveals that 15% of purchase orders have over 25 events, indicating complex processing. These high-event-count cases correlate with orders requiring multiple vendor negotiations and approval escalations, suggesting opportunities for process simplification.
### Example 2: Manual Activity Count in Insurance Claims
**Scenario:** An insurance company wants to measure the manual effort involved in processing claims by counting only activities performed by human agents, excluding automated system events.
**Settings:**
- Filter: Activity Type equals "Manual" OR Resource Not equals "System"
- New Attribute Name: Manual_Activity_Count
**Output:**
The enrichment creates "Manual_Activity_Count" with values representing human touchpoints:
- Auto-approved claims: 2-3 manual activities (initial review, final approval)
- Standard claims: 6-10 manual activities (review, investigation, adjustment, approval)
- Complex claims: 15-25 manual activities (multiple reviews, field investigations, negotiations)
- Fraudulent claims: 30+ manual activities (extensive investigation and review cycles)
**Insights:** Claims with more than 20 manual activities have 3x longer processing times and 2x higher costs. Implementing automated document verification could reduce manual activities by 40% for standard claims.
### Example 3: Error Event Tracking in Manufacturing
**Scenario:** A manufacturing plant needs to count quality control failures and error events in their production process to identify problematic production runs requiring additional attention.
**Settings:**
- Filter: Activity contains "Error" OR Activity contains "Reject" OR Activity contains "Rework"
- New Attribute Name: Quality_Issue_Count
**Output:**
The enrichment generates "Quality_Issue_Count" showing error frequency per production batch:
- High-quality batches: 0-1 error events
- Standard batches: 2-4 error events (minor adjustments)
- Problematic batches: 8-15 error events (multiple quality issues)
- Failed batches: 20+ error events (significant rework required)
**Insights:** Batches with more than 10 error events show 90% correlation with specific equipment or shift patterns. Early intervention when error count exceeds 5 events prevents 60% of total batch failures.
### Example 4: Customer Interaction Count in Service Desk
**Scenario:** A service desk wants to measure customer interaction intensity by counting all events where customers directly interact with the support system, excluding internal processing activities.
**Settings:**
- Filter: Resource contains "Customer" OR Activity contains "Customer" OR Activity in ["Email Received", "Chat Started", "Call Logged", "Feedback Submitted"]
- New Attribute Name: Customer_Touch_Points
**Output:**
Creates "Customer_Touch_Points" attribute with interaction counts:
- Self-service resolution: 1-2 interactions (initial request only)
- Standard support: 3-5 interactions (request, clarification, resolution confirmation)
- Escalated issues: 8-12 interactions (multiple follow-ups and clarifications)
- Critical incidents: 15+ interactions (continuous updates and communications)
**Insights:** Tickets with more than 8 customer interactions have 70% lower satisfaction scores. Proactive communication after 5 interactions reduces total interaction count by 30% and improves satisfaction.
### Example 5: Compliance Check Count in Financial Transactions
**Scenario:** A bank needs to count the number of compliance and verification activities performed on each transaction to ensure regulatory requirements are met and identify transactions requiring enhanced due diligence.
**Settings:**
- Filter: Activity Type equals "Compliance" OR Activity contains "Verify" OR Activity contains "AML" OR Activity contains "KYC"
- New Attribute Name: Compliance_Check_Count
**Output:**
The enrichment produces "Compliance_Check_Count" with verification activity counts:
- Standard transactions: 2-3 compliance checks (basic AML, sanctions screening)
- High-value transactions: 5-8 compliance checks (enhanced due diligence)
- International transfers: 10-15 compliance checks (multi-jurisdiction verification)
- Flagged transactions: 20+ compliance checks (full investigation protocol)
**Insights:** Transactions with fewer than 2 compliance checks pose regulatory risk. Those with more than 15 checks have 5x longer processing time but only 2% result in actual compliance issues, suggesting over-checking in certain scenarios.
## Output
The Event Count enrichment creates a single new integer attribute in your case table containing the count of events for each case. The attribute stores whole numbers representing the total number of events that match your filter criteria (or all events if no filter is applied). This attribute has a data type of Int32 with display format set to Number for proper numerical formatting in analyses and dashboards.
The new attribute can be immediately used in:
- **Filters:** Create case filters based on event count ranges (e.g., "High Complexity Cases" where event count > 20)
- **Calculators:** Use the count in mathematical expressions, averages, or statistical calculations
- **Categorizations:** Group cases into complexity categories based on event count thresholds
- **Visualizations:** Display event count distributions in histograms, box plots, or heat maps
- **Correlations:** Analyze relationships between event counts and other case attributes like duration, cost, or outcome
- **Alerts:** Set up monitoring rules based on unusual event count patterns
The event count attribute integrates seamlessly with other mindzie Studio features, enabling you to combine it with duration calculations, cost analyses, and performance metrics for comprehensive process intelligence.
## See Also
- [[Count Activities]]: Count specific activities by name within each case
- [[Case Duration]]: Calculate time-based metrics that often correlate with event counts
- [[Representative Case Attribute]]: Identify the most common patterns in high or low event count cases
- [[Filter Cases]]: Use event counts to filter and segment your process data
- [[Categorize Attribute Values]]: Create event count categories (Low/Medium/High complexity)
---
*This documentation is part of the mindzie Studio process mining platform.*
---
## Event Order Algorithm
Section: Enrichments
URL: https://docs.mindziestudio.com/mindzie_studio/enrichments/event-order-algorithm
Source: /docs-master/mindzieStudio/enrichments/event-order-algorithm/page.md
# Event Order Algorithm
## Overview
The Event Order Algorithm enrichment is a system-level configuration enrichment that controls how mindzieStudio orders events within each case when timestamps lack sufficient granularity or when multiple events share the same timestamp. This enrichment is critical for ensuring accurate process flow analysis and visualization, particularly when dealing with data sources that record only dates without specific times, or when events are inserted into the log after initial data loading.
In process mining, the sequence of activities is fundamental to understanding process behavior, calculating durations, identifying bottlenecks, and detecting conformance issues. However, many source systems record only the date of an event without the precise time, or multiple events may be logged with identical timestamps. The Event Order Algorithm enrichment provides intelligent sorting strategies to establish a consistent, meaningful order for these events, ensuring that your process analysis reflects the true sequence of operations.
This enrichment works at the event log level and affects how all subsequent analysis, visualizations, and calculations interpret event sequences. It is typically configured once at the beginning of your enrichment pipeline, though you may need to adjust it if you discover that your data has specific ordering requirements or if you add new data sources with different timestamp characteristics.
## Common Uses
- Establish deterministic event ordering when source system timestamps lack time-of-day information (dates only)
- Handle data imports where events are inserted into the log with current timestamps rather than actual event times
- Ensure consistent event sequencing across different data extractions and log rebuilds
- Improve process flow visualization accuracy when dealing with low-resolution timestamp data
- Support conformance checking by providing predictable event sequences for comparison against expected models
- Optimize performance by eliminating unnecessary sorting operations when event order is already correct
- Handle legacy data migrations where historical events may be loaded with insert timestamps
## Settings
**Order Event Algorithm:** Specifies the algorithm used to order events within each case. This setting determines how mindzieStudio resolves the sequence of events when timestamps alone are insufficient to establish a definitive order. The available options are:
- **Insert Date Events Before** (Default): This is the recommended algorithm for most scenarios. It sorts events within each case by timestamp, and when multiple events share the same timestamp (particularly when the timestamp contains only a date without time), it uses the Expected Order attribute to determine sequence. This algorithm assumes that events with date-only timestamps were inserted into the log after the fact and should be ordered using additional metadata. The Expected Order attribute is typically set by the Expected Order enrichment, which allows you to define the logical sequence of activities in your process. This option provides intelligent handling of mixed-precision timestamps while maintaining good performance.
- **Insert Date Events Before (Old)**: This is a legacy version of the Insert Date Events Before algorithm maintained for backward compatibility with older event logs. It implements the same sorting logic but uses an older code path that may have different performance characteristics on very large datasets. Use this option only if you need to maintain consistency with historical analysis results or if you encounter specific compatibility issues with the newer algorithm. For new analyses, the standard Insert Date Events Before option is preferred.
- **No Sorting**: This option disables automatic event sorting entirely, preserving the original order in which events appear in the source data. Use this setting when your source data already has events in the correct chronological order and you want to maximize performance by avoiding unnecessary sorting operations. This is appropriate for data sources that provide high-precision timestamps (including milliseconds) and where you are confident that the insertion order matches the chronological order. However, be cautious with this option, as it may lead to incorrect process flows if your source data does not guarantee proper ordering. If you later add calculated events or merge data from multiple sources, you may need to switch to an active sorting algorithm.
## Examples
### Example 1: Purchase Order Processing with Date-Only Timestamps
**Scenario:** A procurement system tracks purchase orders through approval, but the legacy ERP system only records the approval date without specific times. Multiple approval steps (department manager, finance controller, executive approval) may occur on the same day, but the timestamp shows only "2024-03-15" for all three approvals. Without proper ordering, process mining would show random sequences, making it impossible to identify the true approval path or calculate accurate handover times.
**Settings:**
- Order Event Algorithm: Insert Date Events Before
**Additional Configuration:**
Before applying this enrichment, you would first use the Expected Order enrichment to define that:
1. Department Manager Approval always comes first
2. Finance Controller Approval comes second
3. Executive Approval comes last
**Output:**
With Insert Date Events Before selected, events sharing the timestamp "2024-03-15 00:00:00" are now correctly ordered:
| Case ID | Activity | Original Timestamp | Sorted Position | Expected Order |
|---------|----------|-------------------|-----------------|----------------|
| PO-1234 | Department Manager Approval | 2024-03-15 | 1 | 10 |
| PO-1234 | Finance Controller Approval | 2024-03-15 | 2 | 20 |
| PO-1234 | Executive Approval | 2024-03-15 | 3 | 30 |
The process flow now correctly shows the approval hierarchy, duration calculations between steps become meaningful, and conformance checking can validate that the expected approval sequence was followed.
**Insights:** This configuration ensures that even with date-only timestamps, your process mining analysis accurately represents the mandatory approval hierarchy. Without this enrichment, the three approvals might appear in random order across different cases, obscuring patterns and making it impossible to detect cases where approvals occurred out of sequence.
### Example 2: High-Performance Analysis with Precise Timestamps
**Scenario:** A manufacturing execution system (MES) logs every production step with millisecond-precision timestamps. Each workstation records start and completion times for operations like "Material Loaded," "Welding Complete," "Quality Inspection," and "Packing Finished" with timestamps like "2024-03-15 14:32:18.437." The data volume is substantial (millions of events), and you want to optimize enrichment performance since the timestamps already provide unambiguous ordering.
**Settings:**
- Order Event Algorithm: No Sorting
**Output:**
Events are processed in their original insertion order without additional sorting:
| Case ID | Activity | Timestamp | Original Order Preserved |
|---------|----------|-----------|-------------------------|
| WO-5678 | Material Loaded | 2024-03-15 14:32:18.437 | Position 1 |
| WO-5678 | Welding Complete | 2024-03-15 14:35:42.891 | Position 2 |
| WO-5678 | Quality Inspection | 2024-03-15 14:38:15.234 | Position 3 |
| WO-5678 | Packing Finished | 2024-03-15 14:41:03.567 | Position 4 |
Enrichment processing completes 15-20% faster compared to using active sorting algorithms, particularly noticeable when regenerating the case view after applying multiple enrichments.
**Insights:** When your source data provides high-quality, high-precision timestamps, disabling sorting can significantly improve performance on large datasets without sacrificing accuracy. This is particularly valuable in real-time or near-real-time process mining scenarios where enrichment speed matters. However, monitor your process flows carefully when first implementing this setting to ensure your source data truly maintains correct ordering.
### Example 3: Historical Data Migration with Mixed Timestamps
**Scenario:** A financial services company is migrating 10 years of loan application data from a legacy system to a new process mining platform. Historical events (2015-2020) have only date stamps, while recent events (2021-present) include precise timestamps. Additionally, some historical events were bulk-loaded into the current system and carry insert timestamps from the migration date rather than the actual event dates. The Expected Order enrichment has been configured to define the standard loan origination sequence: Application Received, Credit Check, Income Verification, Underwriting Review, Approval Decision.
**Settings:**
- Order Event Algorithm: Insert Date Events Before
**Output:**
For a historical case from 2017:
| Case ID | Activity | Stored Timestamp | Event Date | Sorted Position | Expected Order |
|---------|----------|-----------------|------------|-----------------|----------------|
| LN-9012 | Application Received | 2017-06-12 | 2017-06-12 | 1 | 10 |
| LN-9012 | Credit Check | 2017-06-12 | 2017-06-12 | 2 | 20 |
| LN-9012 | Income Verification | 2017-06-13 | 2017-06-13 | 3 | 30 |
| LN-9012 | Underwriting Review | 2017-06-13 | 2017-06-13 | 4 | 40 |
| LN-9012 | Approval Decision | 2017-06-14 10:30:00 | 2017-06-14 | 5 | 50 |
For a recent case from 2024:
| Case ID | Activity | Stored Timestamp | Sorted Position |
|---------|----------|------------------|-----------------|
| LN-9876 | Application Received | 2024-03-15 09:15:23 | 1 |
| LN-9876 | Credit Check | 2024-03-15 09:47:11 | 2 |
| LN-9876 | Income Verification | 2024-03-15 14:22:35 | 3 |
| LN-9876 | Underwriting Review | 2024-03-16 08:30:12 | 4 |
| LN-9876 | Approval Decision | 2024-03-16 16:45:08 | 5 |
**Insights:** The Insert Date Events Before algorithm seamlessly handles mixed data quality scenarios, using Expected Order to sequence same-day events in historical data while relying on precise timestamps for recent data. This allows you to perform consistent process analysis across your entire dataset regardless of timestamp precision, enabling accurate trend analysis and comparison between historical and current process performance. The algorithm automatically detects when timestamps lack time-of-day information and applies the appropriate ordering logic.
### Example 4: Multi-System Data Integration
**Scenario:** A healthcare provider combines patient journey data from three systems: an appointment scheduling system (timestamps with seconds precision), an electronic medical records (EMR) system (date-only timestamps for many historical entries), and a billing system (timestamps with minute precision). Events like "Appointment Scheduled," "Patient Arrived," "Vitals Recorded," "Doctor Consultation," "Lab Order," "Lab Results," "Prescription Issued," and "Billing Complete" come from different sources with varying timestamp precision. The Expected Order enrichment defines the typical patient visit sequence.
**Settings:**
- Order Event Algorithm: Insert Date Events Before
**Output:**
For a patient visit on March 15, 2024:
| Case ID | Activity | Source System | Original Timestamp | Sorted Position | Expected Order Applied |
|---------|----------|---------------|-------------------|-----------------|----------------------|
| PT-4455 | Appointment Scheduled | Scheduling | 2024-03-10 14:30:00 | 1 | No (precise time) |
| PT-4455 | Patient Arrived | Scheduling | 2024-03-15 09:00:00 | 2 | No (precise time) |
| PT-4455 | Vitals Recorded | EMR | 2024-03-15 | 3 | Yes (date only, order 30) |
| PT-4455 | Doctor Consultation | EMR | 2024-03-15 | 4 | Yes (date only, order 40) |
| PT-4455 | Lab Order | EMR | 2024-03-15 | 5 | Yes (date only, order 50) |
| PT-4455 | Lab Results | EMR | 2024-03-15 | 6 | Yes (date only, order 60) |
| PT-4455 | Prescription Issued | EMR | 2024-03-15 | 7 | Yes (date only, order 70) |
| PT-4455 | Billing Complete | Billing | 2024-03-15 17:00 | 8 | No (hour/minute) |
**Insights:** The Insert Date Events Before algorithm intelligently adapts to varying timestamp precision across integrated data sources. It preserves the chronological order provided by precise timestamps while using Expected Order to sequence events from systems with lower timestamp resolution. This enables comprehensive end-to-end process mining across disparate systems without requiring expensive data quality improvements or timestamp enrichment at the source system level. The resulting process flows accurately represent patient journeys, enabling analysis of handoffs, waiting times, and resource utilization.
### Example 5: Backward Compatibility for Historical Analysis
**Scenario:** A process mining team has been analyzing order fulfillment processes for three years using an older version of mindzieStudio. They have published multiple reports, dashboards, and KPIs based on this analysis. After upgrading to a newer version of the platform, they notice slight differences in some process metrics, particularly around same-day activities. Investigation reveals that the event ordering algorithm has been updated with performance improvements. To maintain consistency with historical reports and ensure year-over-year comparisons remain valid, they need to use the legacy ordering algorithm.
**Settings:**
- Order Event Algorithm: Insert Date Events Before (Old)
**Output:**
Process metrics and flow diagrams match exactly with previously published analysis:
**Current Analysis (using Old algorithm):**
- Average order processing time: 4.2 days
- On-time delivery rate: 87.3%
- Process variant distribution matches historical baseline
- Conformance rate: 91.2%
**Comparison with New Algorithm:**
- Average order processing time: 4.2 days (no change, precise timestamps)
- On-time delivery rate: 87.3% (no change)
- Process variant distribution: 2 new rare variants detected (0.1% of cases)
- Conformance rate: 91.0% (slight decrease due to refined ordering)
**Insights:** The Old algorithm option provides continuity for long-term process mining initiatives where consistency with historical analysis is critical. While the newer algorithm offers better performance and potentially more accurate ordering in edge cases, the old algorithm ensures that established KPIs, benchmarks, and trend analyses remain comparable across the upgrade transition. Teams can use this option during a transition period, validate differences between algorithms on a subset of data, and then switch to the new algorithm for future analysis once baseline comparisons are established. This approach maintains stakeholder confidence in the analysis while enabling platform modernization.
## Output
The Event Order Algorithm enrichment does not create new attributes or modify existing data values. Instead, it configures a system-level setting that controls how mindzieStudio internally orders events when building the case view for analysis and visualization. The impact of this enrichment is visible in:
**Process Flow Visualization:** Process maps, variant analysis, and directly-follows graphs will reflect the event sequences determined by the selected algorithm. Cases with same-timestamp events will show consistent, logical flow patterns rather than random ordering.
**Duration Calculations:** Enrichments that calculate time between activities (such as "Duration Between Two Activities" or "Duration Between Activity and Case Start") will produce meaningful results because events are in the correct sequence. Without proper ordering, duration calculations between same-timestamp events would be zero or could show negative durations if events appeared in reverse order.
**Conformance Checking:** Conformance enrichments that validate activity sequences against expected process models will correctly identify deviations. Proper event ordering ensures that conformance violations reflect actual process problems rather than data quality issues.
**Performance Analysis:** Performance categorization enrichments that classify cases based on duration thresholds or time-based criteria will operate on correctly sequenced events, ensuring accurate performance assessments.
**Downstream Enrichments:** All subsequent enrichments in your enrichment pipeline that depend on event order (activity position, predecessor/successor relationships, case stage calculations) will operate correctly based on the ordering established by this enrichment.
The enrichment operates during the case view generation phase, which occurs after the event log is loaded and whenever enrichments are applied. The performance impact varies by algorithm:
- **No Sorting** provides the best performance by skipping the ordering step entirely
- **Insert Date Events Before** offers a balance of accuracy and performance, optimized for modern datasets
- **Insert Date Events Before (Old)** maintains backward compatibility but may be slower on very large datasets
When you apply this enrichment, mindzieStudio regenerates the case view using the selected algorithm. The internal event sequence is updated, but the original timestamp values in your data remain unchanged. This means you can switch between algorithms without modifying your source data, allowing you to experiment with different ordering strategies to find the approach that best represents your process reality.
## See Also
- **Expected Order** - Defines the logical sequence of activities in your process, which is used by the Insert Date Events Before algorithms to order same-timestamp events
- **Freeze Log Time** - Sets a fixed reference point for time-based calculations, useful when analyzing historical data or creating reproducible analyses
- **Shift Activity Time** - Adjusts timestamps by a specified offset, helpful when correcting timezone issues or aligning data from different sources
---
*This documentation is part of the mindzieStudio process mining platform.*
---
## Expected Order
Section: Enrichments
URL: https://docs.mindziestudio.com/mindzie_studio/enrichments/expected-order
Source: /docs-master/mindzieStudio/enrichments/expected-order/page.md
# Expected Order
## Overview
The Expected Order enrichment establishes the correct sequence of activities when events have identical or ambiguous timestamps, ensuring accurate process flow representation even when precise timing information is unavailable. This enrichment is essential for datasets where activities are recorded with date-only precision, batch processing systems that timestamp events at the same moment, or legacy systems that lack millisecond-level timing granularity.
When multiple events occur on the same day or share identical timestamps, process mining tools cannot automatically determine their correct sequence. The Expected Order enrichment solves this by allowing you to define the logical business order of activities, which the system then uses to properly sequence events during process discovery and analysis. This ensures your process maps, conformance checks, and performance metrics accurately reflect the true business process flow rather than arbitrary ordering based on data load sequences.
## Common Uses
- Establish correct activity sequences for events with date-only timestamps (common in SAP and ERP systems)
- Define proper ordering for batch-processed activities that receive identical system timestamps
- Resolve ambiguity in processes where multiple activities occur simultaneously but have a known business sequence
- Correct ordering issues in legacy system data where timestamp precision is insufficient
- Ensure accurate process discovery when events are recorded at daily intervals rather than real-time
- Maintain consistent activity sequences across different data extractions and imports
- Support conformance checking by establishing the expected flow before analyzing deviations
## Settings
**Expected Activity Order:** This interactive list displays all activities found in your event log, allowing you to arrange them in their correct business sequence. Use the drag handles (represented by the six-dot icon) to reorder activities by dragging them up or down in the list. The order you define here determines how activities will be sequenced when they have identical timestamps. Activities at the top of the list are considered to occur before activities lower in the list. Any activities not explicitly ordered will be placed after the defined sequence, maintaining their relative order from the original data.
## Examples
### Example 1: Purchase Order Process with Daily Timestamps
**Scenario:** An organization's ERP system records purchase order events with date-only precision, making it impossible to determine the correct sequence of activities that occur on the same day. The business knows the standard flow but needs to enforce it in the process mining analysis.
**Settings:**
- Expected Activity Order:
1. Create Purchase Requisition
2. Approve Purchase Requisition
3. Create Purchase Order
4. Send Purchase Order
5. Receive Goods
6. Verify Invoice
7. Process Payment
8. Close Purchase Order
**Output:**
The enrichment creates a new event attribute called "Expected Order" with integer values (1-8) corresponding to each activity's position in the defined sequence. When multiple events share the same date, the system uses these values to determine their correct order in process maps and analytics.
**Insights:** By establishing the correct activity sequence, the organization can now accurately analyze their purchase-to-pay process, identify bottlenecks between specific steps, and ensure conformance checking reflects the true business process rather than arbitrary data ordering.
### Example 2: Patient Treatment Protocol in Healthcare
**Scenario:** A hospital's patient management system records treatment activities at the shift level (morning, afternoon, evening) rather than exact times. Multiple activities within the same shift need to be ordered according to medical protocols to ensure accurate process analysis.
**Settings:**
- Expected Activity Order:
1. Patient Registration
2. Triage Assessment
3. Vital Signs Check
4. Doctor Consultation
5. Order Diagnostic Tests
6. Perform Lab Tests
7. Perform Imaging
8. Review Test Results
9. Diagnosis
10. Prescribe Treatment
11. Administer Medication
12. Patient Discharge
**Output:**
Each event receives an "Expected Order" value from 1-12 based on the medical protocol sequence. Events with the same timestamp are now properly ordered, ensuring that "Triage Assessment" always appears before "Doctor Consultation" in the process flow, even when both occurred during the same shift.
**Insights:** The correct sequencing reveals that 15% of cases skip vital signs checks before doctor consultations, indicating a compliance issue. Additionally, process mining can now accurately calculate waiting times between specific treatment steps.
### Example 3: Manufacturing Quality Control Process
**Scenario:** A manufacturing company's quality control system batches multiple inspection activities together, recording them with identical timestamps when the batch completes. The actual inspection sequence follows a strict protocol that must be reflected in process analysis.
**Settings:**
- Expected Activity Order:
1. Receive Raw Materials
2. Initial Quality Check
3. Material Preparation
4. Production Start
5. In-Process Inspection 1
6. In-Process Inspection 2
7. Final Assembly
8. Final Quality Inspection
9. Packaging
10. Shipping Preparation
11. Ship Product
**Output:**
The enrichment assigns sequential order values to ensure inspection activities appear in their correct sequence. Even when multiple inspections are recorded simultaneously, the process map now shows them in the proper order based on the manufacturing protocol.
**Insights:** With proper sequencing, the company discovers that 8% of products skip "In-Process Inspection 2", which explains quality issues reported by customers. The corrected process flow also reveals that the bottleneck is actually at "Material Preparation" rather than "Final Assembly" as previously thought.
### Example 4: Insurance Claim Processing
**Scenario:** An insurance company's claim system records multiple assessment and approval activities on the same date, especially for complex claims requiring multiple reviews. The business needs to enforce the correct review hierarchy in their process analysis.
**Settings:**
- Expected Activity Order:
1. Claim Submission
2. Initial Document Check
3. Claim Registration
4. Assign to Adjuster
5. Damage Assessment
6. First Level Review
7. Medical Review (if applicable)
8. Second Level Review
9. Final Approval Decision
10. Payment Processing
11. Claim Closure
**Output:**
Each activity receives an order value ensuring that review levels appear in the correct sequence. Claims with multiple reviews on the same day now show the proper escalation path from first to second level review.
**Insights:** Proper sequencing reveals that 22% of claims bypass "First Level Review" and go directly to "Second Level Review", indicating either a training issue or system configuration problem. The analysis also shows that "Medical Review" activities, when present, cause significant delays in the overall process.
### Example 5: Financial Month-End Close Process
**Scenario:** A finance department performs multiple month-end closing activities that are all recorded with the last day of the month as their timestamp. The activities must follow accounting principles and dependencies, but the flat timestamps make process analysis impossible without proper sequencing.
**Settings:**
- Expected Activity Order:
1. Freeze Transaction Entry
2. Run Trial Balance
3. Review Suspense Accounts
4. Clear Suspense Items
5. Process Accruals
6. Process Prepayments
7. Run Depreciation
8. Reconcile Intercompany
9. Review Financial Statements
10. Management Approval
11. Post Closing Entries
12. Lock Period
**Output:**
The enrichment creates an "Expected Order" attribute that ensures closing activities appear in their correct sequence despite all having the same date. The process map now accurately reflects the dependencies between activities, such as "Clear Suspense Items" always following "Review Suspense Accounts".
**Insights:** With correct sequencing, the finance team identifies that 30% of month-end processes have "Reconcile Intercompany" happening after "Review Financial Statements", which means financial statements are being reviewed with potentially incorrect intercompany balances, requiring rework and delaying the close.
## Output
The Expected Order enrichment creates a single event attribute that determines the sequencing of activities with identical timestamps:
**Expected Order:** An integer attribute added to the event table that specifies the relative position of each activity in the defined sequence. Activities are numbered starting from 1, with lower numbers occurring before higher numbers when timestamps are identical. Activities not included in the defined order receive values higher than the last defined activity, preserving their relative order from the source data.
This attribute is automatically used by the process mining engine when:
- Building process maps and determining edge directions
- Calculating durations between activities
- Performing conformance checking against expected paths
- Analyzing process variants and their frequencies
- Identifying rework and loop patterns in the process
The Expected Order attribute works in conjunction with the existing timestamp attributes, only affecting the sequencing when timestamps are identical or ambiguous. Events with clearly different timestamps maintain their temporal ordering regardless of the expected order values.
---
*This documentation is part of the mindzie Studio process mining platform.*
---
## Fill Blanks In Event Attribute
Section: Enrichments
URL: https://docs.mindziestudio.com/mindzie_studio/enrichments/fill-blanks-in-event-attribute
Source: /docs-master/mindzieStudio/enrichments/fill-blanks-in-event-attribute/page.md
# Fill Blanks in Event Attribute
## Overview
The Fill Blanks in Event Attribute enrichment is a powerful data quality operator that intelligently fills null or blank values in event-level attributes by propagating non-null values forward within each case. This essential data cleanup tool addresses a common data quality issue where event attributes contain incomplete information - such as order statuses, approval states, or tracking numbers that may not be recorded at every process step but should logically persist until they change. The enrichment uses a forward-fill strategy, carrying the last known value forward to subsequent events that have missing or null values.
This enrichment operates at the event level within each case, processing events in chronological order to ensure that blank values inherit the most recent non-null value from previous events in the same case. The forward-fill approach is particularly valuable for state-based attributes where the absence of a value typically means "no change" rather than "no value." By filling these blanks, you create a complete, consistent view of attribute values throughout the case lifecycle, enabling more accurate process analysis, filtering, and reporting without losing the temporal relationship between events.
## Common Uses
- Complete order status attributes in purchase-to-pay processes where status changes are only recorded when they occur, not repeated at every step
- Fill in approval states in workflow processes where approval decisions persist across subsequent activities until the next approval stage
- Propagate tracking numbers or reference IDs that are assigned early in the process but needed for analysis throughout all events
- Complete product or customer attributes that are captured at order creation but missing from fulfillment and shipping events
- Fill shipment carrier information that is determined at dispatch but should be associated with all subsequent tracking events
- Maintain project phase or stage attributes across all activities within each phase of project execution
- Complete sales representative or team assignments that apply to all events in a case after initial assignment
## Settings
**Event Attribute Name:** Select the event-level attribute that contains blank or null values you want to fill. The dropdown displays all event attributes in your dataset. The enrichment will process each case independently, filling blank values by carrying forward the last known non-null value from previous events within the same case. Only values that are explicitly null or blank are filled - existing non-null values are preserved and used as the basis for filling subsequent blanks. Choose attributes where missing values logically mean "use the previous value" rather than "truly no value," such as status fields, state indicators, or reference codes that persist across multiple activities.
## Examples
### Example 1: Purchase Order Status Completion
**Scenario:** An e-commerce company's order processing system records order status changes in an event attribute called "Order_Status," but this attribute is only populated when the status actually changes. Most events have null values for Order_Status, making it impossible to filter or analyze orders by their status at specific process stages.
**Event Data Before Enrichment:**
| Case ID | Activity | Timestamp | Order_Status | Order_Amount |
|---------|----------|-----------|--------------|--------------|
| PO-1001 | Create Order | 2024-01-10 08:00 | Pending | 1500.00 |
| PO-1001 | Credit Check | 2024-01-10 08:15 | null | 1500.00 |
| PO-1001 | Approve Order | 2024-01-10 09:30 | Approved | 1500.00 |
| PO-1001 | Pick Items | 2024-01-10 10:00 | null | 1500.00 |
| PO-1001 | Pack Items | 2024-01-10 11:00 | null | 1500.00 |
| PO-1001 | Ship Order | 2024-01-10 14:00 | Shipped | 1500.00 |
| PO-1001 | Delivery Confirmed | 2024-01-10 16:00 | null | 1500.00 |
**Settings:**
- Event Attribute Name: Order_Status
**Output:**
Event Data After Enrichment:
| Case ID | Activity | Timestamp | Order_Status | Order_Amount |
|---------|----------|-----------|--------------|--------------|
| PO-1001 | Create Order | 2024-01-10 08:00 | Pending | 1500.00 |
| PO-1001 | Credit Check | 2024-01-10 08:15 | Pending | 1500.00 |
| PO-1001 | Approve Order | 2024-01-10 09:30 | Approved | 1500.00 |
| PO-1001 | Pick Items | 2024-01-10 10:00 | Approved | 1500.00 |
| PO-1001 | Pack Items | 2024-01-10 11:00 | Approved | 1500.00 |
| PO-1001 | Ship Order | 2024-01-10 14:00 | Shipped | 1500.00 |
| PO-1001 | Delivery Confirmed | 2024-01-10 16:00 | Shipped | 1500.00 |
The enrichment filled null values with the most recent status: "Pending" carries forward to Credit Check, "Approved" carries forward to picking and packing activities, and "Shipped" carries forward to delivery confirmation.
**Insights:** Now you can accurately filter process maps to show "all picking activities where status was Approved" or calculate performance metrics for approved vs. pending orders at any process stage. The complete status information enables precise bottleneck analysis and compliance checking at every step.
### Example 2: Shipment Tracking Number Propagation
**Scenario:** A logistics company assigns tracking numbers when shipments are created, but their system only records the tracking number in the dispatch event. All subsequent scanning and tracking events have null tracking numbers, preventing end-to-end shipment analysis.
**Event Data Before Enrichment:**
| Case ID | Activity | Timestamp | Tracking_Number | Location | Scanner_ID |
|---------|----------|-----------|-----------------|----------|------------|
| SHIP-501 | Create Shipment | 2024-01-15 06:00 | null | Warehouse A | SYS001 |
| SHIP-501 | Assign to Route | 2024-01-15 06:30 | null | Warehouse A | USER123 |
| SHIP-501 | Dispatch | 2024-01-15 07:00 | TRK-789456123 | Warehouse A | SCAN001 |
| SHIP-501 | In Transit Scan | 2024-01-15 10:00 | null | Hub Central | SCAN045 |
| SHIP-501 | Arrival Scan | 2024-01-15 14:00 | null | Hub East | SCAN089 |
| SHIP-501 | Out for Delivery | 2024-01-15 16:00 | null | Branch 12 | SCAN102 |
| SHIP-501 | Delivered | 2024-01-15 18:30 | null | Customer | SCAN102 |
**Settings:**
- Event Attribute Name: Tracking_Number
**Output:**
After enrichment, all events from dispatch onward have the tracking number:
| Case ID | Activity | Timestamp | Tracking_Number | Location | Scanner_ID |
|---------|----------|-----------|-----------------|----------|------------|
| SHIP-501 | Create Shipment | 2024-01-15 06:00 | null | Warehouse A | SYS001 |
| SHIP-501 | Assign to Route | 2024-01-15 06:30 | null | Warehouse A | USER123 |
| SHIP-501 | Dispatch | 2024-01-15 07:00 | TRK-789456123 | Warehouse A | SCAN001 |
| SHIP-501 | In Transit Scan | 2024-01-15 10:00 | TRK-789456123 | Hub Central | SCAN045 |
| SHIP-501 | Arrival Scan | 2024-01-15 14:00 | TRK-789456123 | Hub East | SCAN089 |
| SHIP-501 | Out for Delivery | 2024-01-15 16:00 | TRK-789456123 | Branch 12 | SCAN102 |
| SHIP-501 | Delivered | 2024-01-15 18:30 | TRK-789456123 | Customer | SCAN102 |
Note that the first two events remain null because no tracking number had been assigned yet - the forward-fill only propagates values after they first appear.
**Insights:** Customer service can now search for any tracking number and see the complete journey including all scan events. Performance analysis can measure handling times at each location with proper tracking number attribution. Exception handling can identify cases where tracking numbers appear at unexpected stages.
### Example 3: Healthcare Patient Insurance Status
**Scenario:** A hospital's patient management system records insurance verification results in an event attribute, but this status only updates when verification occurs or when insurance changes. Most treatment events have null insurance status, making it difficult to analyze treatment patterns by insurance coverage type.
**Event Data Before Enrichment:**
| Case ID | Activity | Timestamp | Insurance_Status | Treatment_Code | Provider |
|---------|----------|-----------|------------------|----------------|----------|
| PAT-2001 | Registration | 2024-02-01 08:00 | Pending | null | Clerk A |
| PAT-2001 | Insurance Verification | 2024-02-01 08:15 | Verified | null | System |
| PAT-2001 | Triage Assessment | 2024-02-01 08:30 | null | TRIAGE-01 | Nurse B |
| PAT-2001 | Physician Consult | 2024-02-01 09:00 | null | CONSULT-01 | Dr. Smith |
| PAT-2001 | Lab Test Order | 2024-02-01 09:30 | null | LAB-CBC | Dr. Smith |
| PAT-2001 | Lab Collection | 2024-02-01 10:00 | null | LAB-CBC | Tech C |
| PAT-2001 | Insurance Re-verification | 2024-02-01 11:00 | Approved | null | System |
| PAT-2001 | Treatment | 2024-02-01 12:00 | null | TX-MINOR | Dr. Jones |
| PAT-2001 | Discharge | 2024-02-01 14:00 | null | DISCHARGE | Nurse D |
**Settings:**
- Event Attribute Name: Insurance_Status
**Output:**
After enrichment, insurance status is complete throughout the patient journey:
| Case ID | Activity | Timestamp | Insurance_Status | Treatment_Code | Provider |
|---------|----------|-----------|------------------|----------------|----------|
| PAT-2001 | Registration | 2024-02-01 08:00 | Pending | null | Clerk A |
| PAT-2001 | Insurance Verification | 2024-02-01 08:15 | Verified | null | System |
| PAT-2001 | Triage Assessment | 2024-02-01 08:30 | Verified | TRIAGE-01 | Nurse B |
| PAT-2001 | Physician Consult | 2024-02-01 09:00 | Verified | CONSULT-01 | Dr. Smith |
| PAT-2001 | Lab Test Order | 2024-02-01 09:30 | Verified | LAB-CBC | Dr. Smith |
| PAT-2001 | Lab Collection | 2024-02-01 10:00 | Verified | LAB-CBC | Tech C |
| PAT-2001 | Insurance Re-verification | 2024-02-01 11:00 | Approved | null | System |
| PAT-2001 | Treatment | 2024-02-01 12:00 | Approved | TX-MINOR | Dr. Jones |
| PAT-2001 | Discharge | 2024-02-01 14:00 | Approved | DISCHARGE | Nurse D |
**Insights:** The hospital can now accurately track which treatments occurred under which insurance authorization status. Compliance reporting can verify that all procedures had appropriate insurance approval. Quality analysis can identify delays between insurance verification and treatment initiation.
### Example 4: Manufacturing Work Order Priority
**Scenario:** A manufacturing plant assigns priority levels to work orders, but priority is only recorded when the order is created or when it changes due to customer requests. Production activities don't carry priority information, making it impossible to analyze resource allocation by priority level.
**Event Data Before Enrichment:**
| Case ID | Activity | Timestamp | Priority | Machine | Operator |
|---------|----------|-----------|----------|---------|----------|
| WO-3005 | Create Work Order | 2024-03-01 06:00 | Normal | null | System |
| WO-3005 | Material Allocation | 2024-03-01 07:00 | null | null | Planner A |
| WO-3005 | Setup Machine | 2024-03-01 08:00 | null | MC-205 | Tech B |
| WO-3005 | Start Production | 2024-03-01 09:00 | null | MC-205 | Operator C |
| WO-3005 | Priority Escalation | 2024-03-01 11:00 | Urgent | null | Supervisor |
| WO-3005 | Quality Check | 2024-03-01 13:00 | null | QC-12 | Inspector D |
| WO-3005 | Finish Production | 2024-03-01 15:00 | null | MC-205 | Operator C |
| WO-3005 | Packaging | 2024-03-01 16:00 | null | PKG-08 | Packer E |
**Settings:**
- Event Attribute Name: Priority
**Output:**
The enrichment propagates priority values forward, showing exactly when priority changed:
| Case ID | Activity | Timestamp | Priority | Machine | Operator |
|---------|----------|-----------|----------|---------|----------|
| WO-3005 | Create Work Order | 2024-03-01 06:00 | Normal | null | System |
| WO-3005 | Material Allocation | 2024-03-01 07:00 | Normal | null | Planner A |
| WO-3005 | Setup Machine | 2024-03-01 08:00 | Normal | MC-205 | Tech B |
| WO-3005 | Start Production | 2024-03-01 09:00 | Normal | MC-205 | Operator C |
| WO-3005 | Priority Escalation | 2024-03-01 11:00 | Urgent | null | Supervisor |
| WO-3005 | Quality Check | 2024-03-01 13:00 | Urgent | QC-12 | Inspector D |
| WO-3005 | Finish Production | 2024-03-01 15:00 | Urgent | MC-205 | Operator C |
| WO-3005 | Packaging | 2024-03-01 16:00 | Urgent | PKG-08 | Packer E |
**Insights:** Production managers can now identify which activities were performed under urgent priority, measure the impact of priority escalations on cycle times, and optimize resource allocation based on real-time priority status at each production stage.
### Example 5: Financial Transaction Approval Authority
**Scenario:** A bank's transaction processing system records the approval authority level (Branch, Regional, Corporate) only when transactions are submitted for approval. Subsequent processing steps have null authority values, preventing analysis of workflow routing by authority level.
**Event Data Before Enrichment:**
| Case ID | Activity | Timestamp | Approval_Authority | Amount | Status |
|---------|----------|-----------|-------------------|--------|--------|
| TXN-8001 | Initiate Transfer | 2024-04-01 09:00 | null | 250000.00 | Pending |
| TXN-8001 | Risk Assessment | 2024-04-01 09:15 | null | 250000.00 | Pending |
| TXN-8001 | Route for Approval | 2024-04-01 09:30 | Regional | 250000.00 | Pending |
| TXN-8001 | Document Review | 2024-04-01 10:00 | null | 250000.00 | Pending |
| TXN-8001 | Compliance Check | 2024-04-01 10:30 | null | 250000.00 | Pending |
| TXN-8001 | Regional Approval | 2024-04-01 11:00 | null | 250000.00 | Approved |
| TXN-8001 | Execute Transfer | 2024-04-01 11:15 | null | 250000.00 | Completed |
| TXN-8001 | Confirmation Sent | 2024-04-01 11:20 | null | 250000.00 | Completed |
**Settings:**
- Event Attribute Name: Approval_Authority
**Output:**
After enrichment, all events after routing show the authority level:
| Case ID | Activity | Timestamp | Approval_Authority | Amount | Status |
|---------|----------|-----------|-------------------|--------|--------|
| TXN-8001 | Initiate Transfer | 2024-04-01 09:00 | null | 250000.00 | Pending |
| TXN-8001 | Risk Assessment | 2024-04-01 09:15 | null | 250000.00 | Pending |
| TXN-8001 | Route for Approval | 2024-04-01 09:30 | Regional | 250000.00 | Pending |
| TXN-8001 | Document Review | 2024-04-01 10:00 | Regional | 250000.00 | Pending |
| TXN-8001 | Compliance Check | 2024-04-01 10:30 | Regional | 250000.00 | Pending |
| TXN-8001 | Regional Approval | 2024-04-01 11:00 | Regional | 250000.00 | Approved |
| TXN-8001 | Execute Transfer | 2024-04-01 11:15 | Regional | 250000.00 | Completed |
| TXN-8001 | Confirmation Sent | 2024-04-01 11:20 | Regional | 250000.00 | Completed |
**Insights:** The bank can now measure processing times by approval authority level, identify bottlenecks in regional vs. corporate approval workflows, and ensure compliance with authority-level routing policies. Performance dashboards can show average approval times segmented by authority level.
## Output
The Fill Blanks in Event Attribute enrichment modifies the selected event attribute in-place, replacing null or blank values with the most recently occurring non-null value from previous events within the same case. The enrichment processes each case independently, ensuring that values never propagate across case boundaries.
**Forward-Fill Algorithm:** The enrichment processes events in chronological order within each case, maintaining a "last known value" variable. When an event has a non-null value for the selected attribute, that value becomes the new "last known value." When an event has a null or blank value, the enrichment fills it with the current "last known value" if one exists. This forward-fill approach creates a step function where values persist until they explicitly change to a new non-null value.
**Handling Null Values:** The enrichment only fills values that are explicitly null or blank - it never overwrites existing non-null values, even if they differ from the previous value. If the first few events in a case have null values and no prior value exists to carry forward, those initial null values remain unchanged until the first non-null value appears in a subsequent event.
**Case-Level Isolation:** Each case is processed completely independently. The enrichment never carries values from one case to another, ensuring data integrity and preventing cross-contamination of attribute values between different cases. When a new case begins, the "last known value" resets to null.
**Data Type Preservation:** The enrichment maintains the original data type of the attribute being filled. Text values, numbers, dates, and other data types are all handled correctly, ensuring that filled values match the type of the original non-null values.
**Event Order Dependency:** The enrichment depends on proper event ordering within each case. Events should be sorted by timestamp before applying this enrichment to ensure that values propagate in the correct chronological sequence. If events are not properly ordered, the forward-fill may produce unexpected results.
**Use with Other Enrichments:** This enrichment should typically be applied early in your enrichment workflow, immediately after any data cleanup operations that affect event ordering. Once blanks are filled, other enrichments and filters can reliably reference the attribute knowing that it contains complete information. The filled attribute can be used in:
- Process map filters to show variants by attribute value at specific stages
- Calculators that require complete attribute values across all events
- Conformance checking that validates attribute values at specific activities
- Performance analysis that segments cases by attribute states during different process phases
**Performance Impact:** The enrichment processes data efficiently by iterating through each case's events exactly once. For large datasets, performance is linear with the number of events. The operation modifies data in memory without creating new attributes, making it memory-efficient.
**When Not to Use This Enrichment:** This enrichment is designed for state-based attributes where missing values logically mean "no change." Do not use it for:
- Measurement attributes where null means "not measured" rather than "use previous value" (temperature readings, quantities)
- Event-specific data that genuinely varies per event (activity names, timestamps, resources)
- Attributes where null has business meaning distinct from the previous value
- Random or independent values that should not propagate (transaction IDs, unique identifiers)
## See Also
- **Convert to Case Attributes** - Automatically convert event attributes to case level when values don't change
- **Representative Case Attribute** - Select a representative value from event attributes to create case attributes
- **Hide Blank Attributes** - Remove attributes with no values from the dataset
- **Anonymize** - Protect sensitive data while maintaining analytical value
- **Sort Log on Start Time** - Ensure proper event ordering before filling blanks
- **Group Attribute Values** - Combine similar attribute values into standardized categories
- **Replace Text** - Find and replace text values in attributes
- **Trim Text** - Clean up attribute values by removing extra whitespace
---
*This documentation is part of the mindzie Studio process mining platform.*
---
## Filter Process Log
Section: Enrichments
URL: https://docs.mindziestudio.com/mindzie_studio/enrichments/filter-process-log
Source: /docs-master/mindzieStudio/enrichments/filter-process-log/page.md
# Filter Process Log
## Overview
The Filter Process Log enrichment is a powerful data cleanup operator that permanently removes unwanted cases and events from your process dataset based on specified filter criteria. Unlike temporary filtering that only hides data during analysis, this enrichment physically removes the filtered data from the log, creating a smaller, more focused dataset. This permanent filtering is essential for data quality management, privacy compliance, and performance optimization in process mining projects.
This enrichment operates at the most fundamental level of process mining by modifying the actual event log structure. When you apply filters through this enrichment, it evaluates each case against your defined criteria and removes all cases (and their associated events) that don't meet the requirements. The result is a streamlined dataset that contains only the relevant process instances, making all subsequent analyses faster and more accurate. This is particularly valuable when working with large datasets where irrelevant data can obscure important patterns or when you need to create specialized views of your process for different stakeholder groups.
The Filter Process Log enrichment is unique in its permanent nature - once executed, the filtered data is removed from the working dataset. This makes it ideal for creating production-ready datasets, removing test data, eliminating outliers, or focusing on specific time periods or business segments. The enrichment leverages the same powerful filtering engine used throughout mindzieStudio, allowing you to combine multiple filter conditions with complex logic to precisely define which data to retain.
## Common Uses
- Remove test cases and dummy data before production analysis
- Extract specific time periods for period-over-period comparisons
- Eliminate incomplete cases that would skew process metrics
- Create department or region-specific datasets from enterprise-wide logs
- Remove outliers and anomalies that distort standard process patterns
- Ensure data privacy by filtering out sensitive case categories
- Optimize performance by reducing dataset size for complex analyses
## Settings
**Filter List:** The core configuration component that defines which cases to keep or remove from the process log. Access the filter configuration through the three-dot menu, where you can add multiple filter conditions. Each filter can target different aspects of your data - case attributes, event attributes, timestamps, or activity names. Filters can be combined using AND/OR logic to create sophisticated selection criteria. The filter interface provides a visual builder that helps you construct complex filter logic without writing code. Common filter types include:
- Attribute filters: Based on case or event attribute values
- Time filters: Select specific date ranges or time periods
- Activity filters: Include or exclude cases containing certain activities
- Performance filters: Based on duration, throughput, or other metrics
- Conformance filters: Cases matching or violating process rules
The filter list supports saving and loading filter configurations, allowing you to reuse common filtering patterns across different datasets or projects.
## Examples
### Example 1: Remove Test Data from Production Dataset
**Scenario:** A SAP implementation contains test transactions marked with specific prefixes that need to be removed before analyzing real business processes. The test data was created during system validation and would distort KPIs if included in the analysis.
**Settings:**
- Filter List Configuration:
- Filter 1: Order_Number NOT STARTS WITH "TEST"
- Filter 2: Customer_Name NOT EQUALS "Dummy Customer"
- Filter 3: Created_Date AFTER "2024-01-01"
- Logic: Filter 1 AND Filter 2 AND Filter 3
**Output:**
The enrichment removes all cases where:
- Order numbers begin with "TEST" (e.g., "TEST_001", "TEST_PO_2024")
- Customer name is exactly "Dummy Customer"
- Cases created before January 1, 2024
Original dataset: 150,000 cases with 2.3 million events
Filtered dataset: 142,000 cases with 2.18 million events
Removed: 8,000 test cases and their associated 120,000 events
**Insights:** The cleaned dataset now accurately represents actual business operations, improving the reliability of process metrics and conformance analysis. Performance calculations, cycle times, and bottleneck analyses now reflect real operational challenges rather than artificial test scenarios.
### Example 2: Extract High-Value Purchase Orders
**Scenario:** In a procurement process spanning multiple categories, management wants to focus exclusively on high-value purchase orders above $50,000 to optimize approval workflows and identify cost-saving opportunities.
**Settings:**
- Filter List Configuration:
- Filter 1: Total_Order_Value GREATER THAN 50000
- Filter 2: Order_Status NOT EQUALS "Cancelled"
- Filter 3: Order_Type IN ["Standard PO", "Contract PO", "Planned PO"]
- Logic: Filter 1 AND Filter 2 AND Filter 3
**Output:**
Creates a focused dataset containing only:
- Purchase orders with total value exceeding $50,000
- Active orders (excluding cancelled ones)
- Standard business order types (excluding emergency or spot purchases)
Before filtering: 45,000 total purchase orders
After filtering: 3,200 high-value orders representing 72% of total spend
Events reduced from 890,000 to 95,000
**Insights:** The filtered dataset reveals that high-value orders follow different approval patterns, have longer cycle times, and involve more stakeholders. This focused view enables targeted process optimization for the orders with the greatest financial impact.
### Example 3: Create Region-Specific Dataset
**Scenario:** A multinational corporation needs to create separate process analyses for European operations due to GDPR compliance requirements and regional process variations.
**Settings:**
- Filter List Configuration:
- Filter 1: Region EQUALS "Europe"
- Filter 2: Country IN ["Germany", "France", "Italy", "Spain", "Netherlands", "Belgium"]
- Filter 3: Process_Start_Date BETWEEN "2024-01-01" AND "2024-12-31"
- Logic: (Filter 1 OR Filter 2) AND Filter 3
**Output:**
Extracts all European cases for the 2024 calendar year:
- Original global dataset: 500,000 cases across 35 countries
- Filtered European dataset: 185,000 cases from 6 countries
- Events reduced from 8.5 million to 3.1 million
- All non-European data permanently removed from working dataset
**Insights:** The region-specific dataset enables compliance with local data regulations, reveals European-specific process patterns, and provides a manageable dataset size for detailed regional analysis and optimization initiatives.
### Example 4: Focus on Completed Healthcare Episodes
**Scenario:** A hospital wants to analyze only fully completed patient treatment episodes, excluding ongoing treatments and administrative-only visits, to accurately measure treatment effectiveness and resource utilization.
**Settings:**
- Filter List Configuration:
- Filter 1: Episode_Status EQUALS "Completed"
- Filter 2: Treatment_Type NOT EQUALS "Administrative"
- Filter 3: Has_Clinical_Outcome EQUALS "Yes"
- Filter 4: Duration_Days BETWEEN 1 AND 365
- Logic: Filter 1 AND Filter 2 AND Filter 3 AND Filter 4
**Output:**
Filtered dataset includes only:
- Completed treatment episodes with documented outcomes
- Clinical treatments (excluding administrative visits)
- Realistic duration range (1-365 days)
Original dataset: 120,000 patient episodes
Filtered dataset: 78,000 completed clinical episodes
Removed: 42,000 incomplete, administrative, or outlier cases
**Insights:** The cleaned dataset provides accurate metrics for treatment duration, resource usage, and clinical pathways without the noise of incomplete data, enabling reliable quality metrics and process improvement initiatives.
### Example 5: Eliminate Outliers for Standard Process Analysis
**Scenario:** A manufacturing company wants to analyze their standard production process by removing extreme outliers that represent equipment failures or exceptional circumstances, focusing on the typical 95% of cases.
**Settings:**
- Filter List Configuration:
- Filter 1: Cycle_Time_Hours BETWEEN 2 AND 48
- Filter 2: Number_of_Rework_Loops LESS THAN 3
- Filter 3: Production_Status NOT IN ["Emergency", "Experimental", "Failed"]
- Filter 4: Defect_Rate LESS THAN 0.05
- Logic: Filter 1 AND Filter 2 AND Filter 3 AND Filter 4
**Output:**
Removes outlier cases:
- Cases with extreme cycle times (< 2 hours or > 48 hours)
- Excessive rework (3+ loops)
- Non-standard production runs
- High defect rates (> 5%)
Before: 25,000 production runs with high variance
After: 23,750 standard production runs
Removed: 1,250 outlier cases (5% of total)
**Insights:** The filtered dataset represents normal operating conditions, enabling accurate baseline metrics, realistic improvement targets, and identification of standard process variations versus exceptional events.
## Output
The Filter Process Log enrichment produces a permanently modified dataset with the following characteristics:
**Modified Process Log:** The enrichment returns a new SuperLog object containing only the cases that meet your filter criteria. All filtered cases and their associated events are permanently removed from the working dataset. This is an irreversible operation within the current analysis session.
**Case Count Reduction:** The number of cases in your dataset will decrease based on the filter criteria. You can monitor this reduction in the dataset statistics to ensure the filtering achieved the expected results.
**Event Count Impact:** When cases are removed, all events belonging to those cases are also removed. This can significantly reduce the total event count, especially for cases with many events.
**Preserved Data Structure:** All existing attributes, both at the case and event level, remain intact for the retained cases. The enrichment only removes entire cases; it doesn't modify the structure or content of surviving cases.
**Performance Benefits:** The reduced dataset size leads to faster execution of all subsequent enrichments, filters, and calculations. This is particularly noticeable with complex process mining operations.
**Downstream Impact:** All analyses, visualizations, and exports will reflect the filtered dataset. Ensure you save a copy of the original dataset if you need to reference the complete data later.
## Important Considerations
**Permanent Operation:** Unlike visualization filters that temporarily hide data, this enrichment permanently removes data from your working dataset. Always maintain a backup of your original data before applying this enrichment.
**Order of Operations:** Apply this enrichment early in your analysis workflow if you know certain data is irrelevant. This improves performance for all subsequent operations.
**Filter Validation:** Test your filters using the preview functionality before executing the enrichment to ensure you're retaining the intended data.
**Cascading Effects:** Removing cases might impact calculations that depend on the full dataset, such as percentile calculations or relative performance metrics.
---
*This documentation is part of the mindzie Studio process mining platform.*
---
## Format String
Section: Enrichments
URL: https://docs.mindziestudio.com/mindzie_studio/enrichments/format-string
Source: /docs-master/mindzieStudio/enrichments/format-string/page.md
# Format String
## Overview
The Format String enrichment creates a new text attribute by combining values from multiple attributes using a customizable template, enabling precise control over how data is formatted and presented. Unlike simple concatenation, this enrichment uses .NET string formatting syntax, allowing you to construct URLs, create structured identifiers, build formatted messages, and generate custom labels with exact spacing and separators. The enrichment supports up to 10 attributes and can output results as either plain text or clickable URLs, making it invaluable for integrating process mining data with external systems and creating actionable links.
In process mining, the ability to format data precisely is essential for creating system integrations, generating reports, and building user interfaces that connect to source systems. The Format String enrichment uses the standard .NET composite formatting approach where placeholders like {0}, {1}, {2} represent the position of each selected attribute in the format template. This gives you complete control over the output structure, including custom separators, prefixes, suffixes, and even complex patterns like URLs with multiple parameters. The enrichment also includes optional filtering, allowing you to apply formatting only to specific subsets of cases based on business criteria.
The enrichment's URL formatting capability is particularly powerful - when you set the Format to "URL", the resulting attribute becomes clickable in the mindzie Studio interface, enabling users to jump directly to source system records, documents, or external dashboards. This transforms your process mining analysis from passive observation to active investigation, allowing analysts to quickly drill down into source system details without manual lookup.
## Common Uses
- Create clickable URLs that link to source system records (ERP, CRM, document management)
- Generate formatted identifiers with specific patterns (SKU-2024-0001, CUST-US-12345)
- Build structured messages combining multiple attributes with custom separators
- Format composite keys that follow exact naming conventions
- Create hyperlinks to external dashboards or reports with embedded parameters
- Generate formatted display labels combining text, numbers, and dates
- Build URLs for API calls that retrieve additional data about cases or events
## Settings
**Filter (Optional):** Apply filters to limit which cases receive the formatted string. When filters are applied, only cases matching the filter criteria will have the new attribute created. This is useful when you want to create formatted output only for specific subsets of your data, such as open orders, specific departments, or cases within a certain time period. Cases not matching the filter criteria will have null values for the new attribute.
**New Attribute Name:** Specify the internal name for the new attribute that will store the formatted string. This is the attribute name used in filters, calculators, and data exports. Choose a descriptive name that clearly indicates what the formatted value represents. For example, use "NetSuite_URL" for clickable links to NetSuite records, or "Product_SKU_Formatted" for standardized product codes. The name must be unique and cannot conflict with existing attributes in your dataset.
**New Attribute Display Name:** Specify the user-friendly display name shown in the mindzie Studio interface, charts, and reports. This should be a clear, readable label that helps users understand the attribute's purpose. For example, use "View in NetSuite" for URLs, or "Formatted Product Code" for structured identifiers. The display name can include spaces and special characters for improved readability.
**Attribute Columns:** Select the attributes whose values you want to include in the formatted string. You can select up to 10 attributes of any type (string, numeric, date, boolean). The attributes are referenced by their position in the selection order using placeholders {0}, {1}, {2}, etc. in the Format String. The first attribute selected corresponds to {0}, the second to {1}, and so on. Choose attributes that contain the values needed for your formatting pattern.
**Format:** Select whether the output should be formatted as plain Text or as a clickable URL:
- **Text:** The formatted string appears as regular text in the dataset. Use this for formatted identifiers, composite keys, structured labels, or any text-based formatting.
- **URL:** The formatted string appears as a clickable hyperlink in the mindzie Studio interface. When clicked, the link opens in a new browser tab. Use this when creating links to external systems, dashboards, or documents. Ensure your Format String produces valid URL syntax (starting with http:// or https://).
**Format String:** Specify the template that defines how the attribute values should be combined and formatted. Use standard .NET composite formatting syntax with placeholders {0}, {1}, {2}, etc. representing each selected attribute in order. You can include any literal text, special characters, or URL patterns.
Examples:
- URL pattern: `https://system.company.com/record?id={0}&type={1}`
- Formatted ID: `SKU-{0}-{1:D5}`
- Structured label: `{0} - {1} ({2})`
- Multi-parameter URL: `https://erp.com/order.nl?id={0}&lineId={1}&whence=`
The Format String supports standard .NET format specifiers for numbers and dates when using colon notation (e.g., {0:D5} for zero-padded 5-digit numbers, {1:yyyy-MM-dd} for formatted dates).
**Hidden:** When enabled, the new attribute is created but not displayed in the default attribute lists in mindzie Studio. The attribute remains accessible in filters, calculators, and advanced views, but is hidden from standard dropdowns and visualizations. Use this setting when creating intermediate attributes or technical fields that support analysis but shouldn't clutter the user interface.
## Examples
### Example 1: Creating Clickable Links to ERP Sales Orders
**Scenario:** In a sales order process, you need to create clickable links that allow analysts to view the complete order details in your NetSuite ERP system. Each link should navigate directly to the specific sales order and line item.
**Settings:**
- Filter: None (apply to all cases)
- New Attribute Name: NetSuite_Order_URL
- New Attribute Display Name: View in NetSuite
- Attribute Columns: Sales_Order_ID, Line_Item_ID
- Format: URL
- Format String: `https://tstdrv2763156.app.netsuite.com/app/accounting/transactions/salesord.nl?id={0}&lineId={1}&whence=`
- Hidden: No
**Output:**
Creates a new case attribute "NetSuite_Order_URL" that appears as a clickable link. For a case with:
- Sales_Order_ID: "SO-2024-1523"
- Line_Item_ID: "3"
The NetSuite_Order_URL would be: `https://tstdrv2763156.app.netsuite.com/app/accounting/transactions/salesord.nl?id=SO-2024-1523&lineId=3&whence=`
Clicking the link in mindzie Studio opens the exact sales order line in NetSuite.
**Insights:** This integration transforms passive process analysis into active investigation. When analysts identify bottlenecks or anomalies in the process map, they can immediately access the source system to understand the context, review documents, and take corrective action. This reduces investigation time from minutes to seconds and improves the accuracy of root cause analysis.
### Example 2: Building Standardized Product SKU Codes
**Scenario:** In an inventory management process, you need to create standardized SKU codes that follow the pattern: Category Code-Year-5-digit sequential number, ensuring consistent product identification across all systems.
**Settings:**
- Filter: None
- New Attribute Name: Product_SKU_Standard
- New Attribute Display Name: Standard SKU Code
- Attribute Columns: Category_Code, Production_Year, Sequence_Number
- Format: Text
- Format String: `SKU-{0}-{1}-{2:D5}`
- Hidden: No
**Output:**
Creates a new case attribute "Product_SKU_Standard" with formatted SKU codes. For a case with:
- Category_Code: "ELEC"
- Production_Year: "2024"
- Sequence_Number: 147
The Product_SKU_Standard would be: "SKU-ELEC-2024-00147"
Note: The {2:D5} format specifier ensures the sequence number is padded with zeros to always be 5 digits.
**Insights:** Standardized SKU codes improve data quality, enable accurate cross-system matching, and support warehouse automation systems that require specific identifier formats. The zero-padding prevents sorting issues and ensures consistent barcode generation.
### Example 3: Creating Customer Service Dashboard Links
**Scenario:** In a customer support process, you want to create links to an internal Power BI dashboard that shows the complete history and metrics for each customer, enabling support agents to quickly access comprehensive customer insights.
**Settings:**
- Filter: Case_Status = "Open"
- New Attribute Name: Customer_Dashboard_URL
- New Attribute Display Name: Customer Analytics
- Attribute Columns: Customer_ID, Account_Region
- Format: URL
- Format String: `https://powerbi.company.com/reports/customer-360?customerId={0}®ion={1}&embed=true`
- Hidden: No
**Output:**
Creates a clickable link to the customer dashboard for open cases. For a case with:
- Customer_ID: "CUST-458821"
- Account_Region: "NORTH"
The Customer_Dashboard_URL would be: `https://powerbi.company.com/reports/customer-360?customerId=CUST-458821®ion=NORTH&embed=true`
**Insights:** Providing one-click access to customer analytics enables support teams to make informed decisions based on complete customer history. This reduces escalations by empowering frontline staff with instant access to contextual information about customer value, preferences, and past issues.
### Example 4: Generating Formatted Invoice References
**Scenario:** In an accounts payable process, you need to create formatted invoice references that combine vendor code, invoice date, and invoice number in a specific pattern required for regulatory reporting.
**Settings:**
- Filter: Document_Type = "Invoice"
- New Attribute Name: Invoice_Reference_Formatted
- New Attribute Display Name: Regulatory Invoice Reference
- Attribute Columns: Vendor_Code, Invoice_Date, Invoice_Number
- Format: Text
- Format String: `INV/{0}/{1:yyyy-MM}/{2}`
- Hidden: No
**Output:**
Creates formatted invoice references for invoice documents. For a case with:
- Vendor_Code: "VND-2847"
- Invoice_Date: "2024-03-15 10:30:00"
- Invoice_Number: "INV-8821-A"
The Invoice_Reference_Formatted would be: "INV/VND-2847/2024-03/INV-8821-A"
Note: The {1:yyyy-MM} format specifier extracts only the year and month from the invoice date.
**Insights:** These formatted references meet regulatory requirements for audit trails, enable accurate cross-referencing with external reports, and provide a standardized format that tax authorities and auditors can easily parse and validate.
### Example 5: Building Document Management System Links
**Scenario:** In a contract approval process, you need to create direct links to PDF contracts stored in SharePoint, allowing approvers to review the full contract without searching through folder structures.
**Settings:**
- Filter: Process_Type = "Contract"
- New Attribute Name: Contract_Document_URL
- New Attribute Display Name: View Contract PDF
- Attribute Columns: SharePoint_Site_ID, Library_Name, Document_ID
- Format: URL
- Format String: `https://company.sharepoint.com/sites/{0}/{1}/Forms/AllItems.aspx?id={2}&parent=/sites/{0}/{1}`
- Hidden: No
**Output:**
Creates clickable links to SharePoint documents. For a case with:
- SharePoint_Site_ID: "legal"
- Library_Name: "Contracts2024"
- Document_ID: "DOC-2024-0582"
The Contract_Document_URL would be: `https://company.sharepoint.com/sites/legal/Contracts2024/Forms/AllItems.aspx?id=DOC-2024-0582&parent=/sites/legal/Contracts2024`
**Insights:** Direct document access reduces approval cycle time by eliminating the manual search process. Approvers can review contracts within seconds rather than minutes, improving both process efficiency and user satisfaction with the approval workflow.
## Output
The Format String enrichment creates a single new case attribute with a data type of String. The attribute stores the formatted result according to the pattern specified in the Format String setting. When the Format is set to "URL", the attribute is marked as a URL type, causing it to render as a clickable hyperlink in the mindzie Studio interface rather than plain text.
The enrichment processes each case individually, substituting the placeholders ({0}, {1}, {2}, etc.) with the actual values from the selected attributes for that case. If an attribute value is null or missing, the placeholder is replaced with an empty string unless you specify alternative handling in your format string. The enrichment supports standard .NET composite formatting, including format specifiers for numbers (padding, decimal places) and dates (year-month-day patterns).
When filters are applied, only cases matching the filter criteria receive the formatted attribute. Cases not matching the filter will have a null value for the new attribute. This allows you to selectively apply formatting based on business rules, such as creating URLs only for active cases or formatting identifiers only for specific product categories.
The formatted attribute becomes immediately available for use in other enrichments, filters, calculators, and visualizations. When Format is set to URL, users can click the links directly from case tables, variant views, and detail panels to navigate to external systems. The Hidden setting controls visibility in the UI but does not affect the attribute's availability in filters and calculations, making it useful for creating technical fields that support other enrichments without cluttering the interface.
---
*This documentation is part of the mindzie Studio process mining platform.*
---
## Freeze Time
Section: Enrichments
URL: https://docs.mindziestudio.com/mindzie_studio/enrichments/freeze-time
Source: /docs-master/mindzieStudio/enrichments/freeze-time/page.md
# Freeze Time
## Overview
The Freeze Time enrichment is a specialized time manipulation operator that sets a fixed reference point for all time-based calculations within your process mining dataset. When you apply this enrichment, it establishes a specific date and time as the "current time" for all subsequent enrichments that calculate durations or time differences relative to "now." This is particularly valuable when you need to perform consistent historical analysis, create reproducible reports, or simulate process states at specific points in time.
This enrichment fundamentally changes how your dataset interprets the concept of "current time." Instead of using the actual system time when calculations are performed, all time-sensitive enrichments will use your frozen timestamp as their reference point. This ensures that duration calculations, aging metrics, and time-based categorizations remain consistent regardless of when you run your analysis, making it essential for regulatory reporting, historical comparisons, and point-in-time process reconstructions.
## Common Uses
- **Historical reporting and compliance audits** - Generate reports that show the exact state of processes at a specific past date for regulatory compliance or audit purposes
- **Year-end or month-end analysis** - Freeze time at the end of fiscal periods to calculate accurate aging metrics, cycle times, and performance indicators
- **Consistent benchmark calculations** - Ensure that all time-based KPIs use the same reference point when comparing process performance across different datasets
- **Simulation and what-if scenarios** - Set different freeze points to understand how processes would appear at various stages of completion
- **Reproducible analysis workflows** - Guarantee that time-sensitive calculations produce identical results when analyses are rerun at later dates
- **Aged inventory or receivables tracking** - Calculate how long items have been outstanding as of a specific cutoff date rather than the current date
- **Project milestone assessments** - Evaluate project status and duration metrics as they appeared at critical decision points
## Settings
**Date:** The specific date to use as the frozen reference point for all time-based calculations in the dataset. This date becomes the "current time" for enrichments that calculate durations between events and "now." The date selector allows you to choose any date from the past or future, with the default being today's date when you first add the enrichment. Format is displayed as yyyy-MM-dd in the interface.
## Examples
### Example 1: Month-End Accounts Receivable Aging
**Scenario:** A finance team needs to generate consistent aging reports showing invoice statuses as of the last day of each month, regardless of when the analysis is actually performed.
**Settings:**
- Date: 2024-12-31
**Output:**
When combined with "Duration Between an Attribute and Current Time" enrichment targeting the invoice date attribute, all aging calculations will use December 31, 2024 as the reference point. This means an invoice dated December 1, 2024 will show as 30 days old, even if you run the analysis in February 2025.
**Insights:** This frozen time approach ensures that month-end reports remain consistent and can be regenerated at any time with identical results, critical for financial audits and regulatory compliance.
### Example 2: Manufacturing Order Backlog Analysis
**Scenario:** A manufacturing plant manager wants to analyze the state of all open production orders as they appeared at the end of the previous quarter to understand bottlenecks and capacity issues.
**Settings:**
- Date: 2024-09-30
**Output:**
All duration calculations for open orders will be measured from their start dates to September 30, 2024. Orders that were completed after this date will still show as "in progress" with durations calculated up to the freeze point. This provides an accurate snapshot of the production pipeline at quarter-end.
**Insights:** By freezing time at strategic points, managers can reconstruct historical process states to understand what information was available for decision-making at critical moments.
### Example 3: Healthcare Patient Wait Time Reporting
**Scenario:** A hospital needs to report emergency department wait times for all patients present in the facility at midnight for regulatory reporting, showing how long each patient had been waiting at that exact moment.
**Settings:**
- Date: 2024-11-15
**Output:**
When calculating durations between patient arrival times and "current time," all calculations use November 15, 2024 at 00:00 as the endpoint. A patient who arrived at 8:00 PM on November 14 would show a 4-hour wait time, regardless of when they were actually discharged or when the report is generated.
**Insights:** This enables accurate point-in-time reporting for regulatory compliance, showing the exact state of patient queues at mandated reporting times.
### Example 4: Project Portfolio Status Dashboard
**Scenario:** A PMO needs to recreate project status dashboards showing all project durations and delays as they appeared during quarterly steering committee meetings for post-implementation reviews.
**Settings:**
- Date: 2024-10-15
**Output:**
All project duration metrics, milestone aging calculations, and delay measurements use October 15, 2024 as their reference point. Projects show their status and duration as of this date, allowing accurate recreation of the dashboard that was presented to stakeholders.
**Insights:** Freezing time at presentation dates allows teams to validate historical decisions and understand what data was available at crucial decision points.
### Example 5: Supply Chain Lead Time Analysis
**Scenario:** A procurement team needs to analyze purchase order lead times as of year-end for supplier performance evaluations, ensuring all calculations use the same cutoff date regardless of when orders were actually received.
**Settings:**
- Date: 2024-12-31
**Output:**
Orders still in transit on December 31, 2024 will show lead times calculated from order date to the freeze point. Orders received in January 2025 will still use December 31 as the calculation endpoint, accurately reflecting year-end performance metrics.
**Insights:** This approach ensures fair supplier comparisons by using consistent measurement endpoints, preventing early January deliveries from skewing year-end metrics.
## Output
The Freeze Time enrichment does not create any new attributes directly. Instead, it modifies the behavior of the entire dataset by setting a global reference timestamp that affects all subsequent time-based calculations. This frozen timestamp becomes the "current time" reference for any enrichment that calculates durations or time differences relative to "now."
The impact is seen when using other time-sensitive enrichments such as "Duration Between an Attribute and Current Time" or "Duration Between an Activity and Current Time" - these will all use the frozen date rather than the actual system time. This ensures consistency across all time-based metrics and allows for reproducible analysis results.
The frozen time setting persists throughout your enrichment pipeline, affecting all downstream calculations until the dataset is reprocessed without the Freeze Time enrichment or with a different freeze date.
## See Also
- **Duration Between an Attribute and Current Time** - Calculate how long ago an attribute date occurred relative to the frozen time
- **Duration Between an Activity and Current Time** - Measure elapsed time from activity execution to the frozen reference point
- **Shift Activity Time** - Adjust activity timestamps by a fixed duration for time-based adjustments
- **Add Days to a Date** - Create new date attributes by adding days to existing dates
- **Correct Time Zone** - Adjust all timestamps to a consistent timezone before freezing time
---
*This documentation is part of the mindzie Studio process mining platform.*
---
## Group Attribute Values
Section: Enrichments
URL: https://docs.mindziestudio.com/mindzie_studio/enrichments/group-attribute-values
Source: /docs-master/mindzieStudio/enrichments/group-attribute-values/page.md
# Group Attribute Values
## Overview
The Group Attribute Values enrichment allows you to group multiple values of an existing attribute into categories, creating a new attribute with simplified values. This powerful data transformation tool helps you consolidate related attribute values into meaningful business categories, reducing complexity and improving analysis clarity. Instead of working with dozens or hundreds of unique values, you can create logical groupings that align with your business perspective.
This enrichment is particularly valuable when dealing with attributes that have many distinct values that can be logically combined. For example, you might group hundreds of detailed error codes into categories like "System Errors," "User Errors," and "Network Errors," or consolidate multiple payment methods into "Digital Payments" and "Traditional Payments." The enrichment uses filtering criteria to identify which cases or events should belong to each group, providing precise control over the categorization logic.
## Common Uses
- **Simplify complex categorizations:** Group hundreds of product SKUs into product families or categories for clearer analysis
- **Create business-relevant segments:** Combine multiple customer types into strategic segments like "High Value," "Regular," and "New"
- **Standardize regional variations:** Group similar activities or statuses that vary by location into consistent categories
- **Build performance indicators:** Create binary attributes to identify cases meeting specific criteria (e.g., "Priority Customer" = True/False)
- **Consolidate error types:** Group detailed technical error codes into business-understandable categories
- **Support decision making:** Create simplified attributes for use in dashboards and reports that executives can understand
- **Enable comparative analysis:** Group cases into cohorts for before/after comparisons or A/B testing scenarios
## Settings
**Filter:** Define the criteria that determine which cases or events belong to this group. You can use any combination of filters available in mindzieStudio, including attribute values, activity presence, date ranges, and complex logical conditions. The filter acts as the selection mechanism - all cases or events matching the filter will receive the group value.
**New Attribute Name:** Specify the name for the new attribute that will be created. This attribute will contain either the group names (for text grouping) or True/False values (for boolean grouping). Choose a descriptive name that clearly indicates the purpose of the grouping, such as "Customer Segment," "Error Category," or "Priority Case."
**Boolean Group:** When checked, creates a True/False attribute where cases matching the filter receive "True" and all others receive "False." This is ideal for binary classifications like "High Priority" (True/False) or "Requires Review" (True/False). When unchecked, you can specify a custom group name, allowing multiple groups to be created with different enrichment instances.
**Group Name:** (Only available when Boolean Group is unchecked) The text value to assign to cases or events that match the filter criteria. This allows you to create named categories like "Premium," "Standard," or "Basic." Multiple enrichments can target the same attribute name with different group names to build multi-category classifications.
**Create Event Attribute:** When checked, the enrichment creates an event-level attribute, evaluating the filter for each event individually. When unchecked (default), it creates a case-level attribute, evaluating the filter once per case. Use event attributes when the grouping logic depends on individual event characteristics rather than overall case properties.
## Examples
### Example 1: Customer Segmentation in Order Processing
**Scenario:** An e-commerce company wants to segment customers into "VIP," "Regular," and "New" categories based on order history and value for differentiated service levels.
**Settings:**
- Filter: Cases with Attribute "Total Order Value" > $10,000 AND "Order Count" > 20
- New Attribute Name: Customer Segment
- Boolean Group: Unchecked
- Group Name: VIP
- Create Event Attribute: Unchecked
**Output:**
The enrichment creates a "Customer Segment" case attribute. Cases meeting the VIP criteria receive "VIP" as the value. Run additional enrichments with different filters and group names ("Regular" for medium values, "New" for first-time customers) targeting the same attribute name to complete the segmentation.
| Case ID | Total Order Value | Order Count | Customer Segment |
|---------|------------------|-------------|-----------------|
| C-001 | $15,000 | 25 | VIP |
| C-002 | $2,000 | 5 | Regular |
| C-003 | $500 | 1 | New |
**Insights:** The segmentation enables targeted analysis of process performance by customer tier, revealing that VIP customers experience 50% faster order processing but have more complex return processes requiring specialized handling.
### Example 2: Manufacturing Quality Control Classification
**Scenario:** A manufacturing plant needs to identify production batches requiring quality review based on multiple sensor readings and inspection results exceeding thresholds.
**Settings:**
- Filter: Cases with Attribute "Temperature Variance" > 5 OR "Pressure Reading" > 100 OR "Visual Inspection" = "Failed"
- New Attribute Name: Requires Quality Review
- Boolean Group: Checked
- Create Event Attribute: Unchecked
**Output:**
Creates a boolean "Requires Quality Review" attribute at the case level:
| Batch ID | Temperature Variance | Pressure Reading | Visual Inspection | Requires Quality Review |
|----------|---------------------|------------------|------------------|------------------------|
| B-1001 | 3 | 95 | Passed | False |
| B-1002 | 7 | 98 | Passed | True |
| B-1003 | 2 | 105 | Passed | True |
| B-1004 | 4 | 90 | Failed | True |
**Insights:** Analysis shows 23% of batches require quality review, with temperature variance being the most common trigger. These batches have 3x longer cycle times due to additional inspection steps.
### Example 3: Healthcare Patient Risk Categorization
**Scenario:** A hospital wants to categorize emergency room patients into risk levels based on symptoms and vital signs to optimize triage and resource allocation.
**Settings:**
- Filter: Cases with Attribute "Heart Rate" > 120 OR "Systolic BP" < 90 OR "Oxygen Saturation" < 92
- New Attribute Name: Patient Risk Level
- Boolean Group: Unchecked
- Group Name: High Risk
- Create Event Attribute: Unchecked
**Output:**
Creates a "Patient Risk Level" attribute with "High Risk" for matching cases. Additional enrichments would define "Medium Risk" and "Low Risk" categories:
| Patient ID | Heart Rate | Systolic BP | O2 Saturation | Patient Risk Level |
|-----------|------------|-------------|---------------|-------------------|
| P-501 | 125 | 110 | 95 | High Risk |
| P-502 | 75 | 120 | 98 | Low Risk |
| P-503 | 90 | 85 | 94 | High Risk |
**Insights:** High-risk patients are immediately routed to critical care, reducing adverse events by 40%. Process mining reveals these patients have dedicated fast-track workflows with average door-to-treatment times under 10 minutes.
### Example 4: Financial Transaction Fraud Indicators
**Scenario:** A bank needs to flag potentially fraudulent transactions based on unusual patterns in transaction attributes and customer behavior at the event level.
**Settings:**
- Filter: Events with Attribute "Transaction Amount" > $5,000 AND "Location Country" != "Home Country" AND "Time Since Last Transaction" < 60 seconds
- New Attribute Name: Potential Fraud Flag
- Boolean Group: Checked
- Create Event Attribute: Checked
**Output:**
Creates an event-level boolean attribute marking individual transactions:
| Transaction ID | Amount | Location | Time Gap | Potential Fraud Flag |
|---------------|--------|----------|----------|---------------------|
| T-8001 | $7,500 | Foreign | 45 sec | True |
| T-8002 | $200 | Home | 2 hours | False |
| T-8003 | $5,100 | Foreign | 30 sec | True |
**Insights:** Transactions flagged as potential fraud trigger immediate review workflows. Analysis shows 85% accuracy in identifying actual fraud cases, with flagged transactions receiving additional authentication steps within 2 minutes.
### Example 5: IT Incident Priority Grouping
**Scenario:** An IT service desk wants to consolidate dozens of incident subcategories into manageable priority groups for resource allocation and SLA management.
**Settings:**
- Filter: Cases with Attribute "Incident Type" IN ["Server Down," "Database Corrupt," "Network Outage," "Security Breach"]
- New Attribute Name: Incident Priority Group
- Boolean Group: Unchecked
- Group Name: Critical Infrastructure
- Create Event Attribute: Unchecked
**Output:**
Consolidates multiple technical incident types into business-relevant groups:
| Incident ID | Incident Type | Original Priority | Incident Priority Group |
|------------|---------------|------------------|------------------------|
| I-901 | Server Down | P1 | Critical Infrastructure |
| I-902 | Password Reset | P3 | User Support |
| I-903 | Database Corrupt | P1 | Critical Infrastructure |
| I-904 | Software Install | P4 | User Support |
**Insights:** Critical Infrastructure incidents represent 15% of volume but consume 60% of senior technician time. These incidents follow expedited workflows with average resolution times of 2 hours versus 8 hours for standard issues.
## Output
The Group Attribute Values enrichment creates a new attribute in your dataset with the following characteristics:
**Attribute Type:** The enrichment creates either a case attribute (default) or an event attribute based on the "Create Event Attribute" setting. Case attributes appear once per case and are visible in case-level analyses, while event attributes can vary across events within the same case.
**Data Type:** Boolean (when "Boolean Group" is checked) displaying as True/False, or String (when using custom group names) containing the specified text values.
**Value Assignment:** Cases or events matching the filter criteria receive either "True" (for boolean groups) or the specified group name (for text groups). Non-matching items receive "False" for boolean groups or retain their existing value/null for text groups.
**Multiple Groups:** You can create multiple enrichments targeting the same attribute name with different filters and group names. This builds multi-category classifications where each case receives the appropriate category based on which filter it matches. If a case matches multiple filters, the last-applied enrichment takes precedence.
**Integration:** The new grouped attribute integrates seamlessly with all mindzieStudio features including filters, calculators, and visualizations. Use these simplified attributes in process maps to show flow variations by group, in dashboards for comparative metrics, or as filter criteria in other enrichments.
---
*This documentation is part of the mindzie Studio process mining platform.*
---
## Hide Attribute
Section: Enrichments
URL: https://docs.mindziestudio.com/mindzie_studio/enrichments/hide-attribute
Source: /docs-master/mindzieStudio/enrichments/hide-attribute/page.md
# Hide Attribute
## Overview
The Hide Attribute enrichment provides a powerful way to simplify your dataset views by selectively hiding attributes from display without permanently deleting the underlying data. This cleanup operator removes specified attributes from the visible dataset, making it easier to focus on relevant information while maintaining data integrity. Unlike deletion operations that permanently remove data, hiding attributes is a non-destructive operation that simply removes columns from the user interface while preserving the original data structure.
This enrichment is particularly valuable when working with datasets containing numerous attributes that may clutter the view or distract from core analysis objectives. By hiding irrelevant, temporary, or intermediate calculation attributes, you can create cleaner, more focused datasets that highlight the most important process information. The Hide Attribute enrichment respects system constraints and prevents hiding of mandatory columns such as Case ID, Activity, and Timestamp, ensuring the dataset remains functional for process mining analysis.
## Common Uses
- Simplify dataset views by removing technical or system-generated attributes from display
- Hide sensitive information such as personal data or confidential business metrics during presentations
- Remove intermediate calculation attributes that were used for other enrichments but are no longer needed
- Clean up imported datasets that contain legacy or unused columns from source systems
- Focus analysis on specific attribute sets by hiding unrelated metrics
- Create role-specific views by hiding attributes not relevant to certain user groups
- Prepare cleaner exports by removing unnecessary columns before sharing datasets
## Settings
**Attribute Name:** Select the attribute you want to hide from the dropdown list. The list displays all available attributes in your dataset except for mandatory system columns (Case ID, Activity, Timestamp, Event Index, and Internal Case ID) which cannot be hidden. Only attributes that are currently visible and not calculated by the system are available for selection. Choose the specific attribute you want to remove from the display.
## Examples
### Example 1: Simplifying Purchase Order Analysis
**Scenario:** A procurement dataset contains numerous technical fields imported from the ERP system that clutter the view and make it difficult for business analysts to focus on key metrics like costs and approval times.
**Settings:**
- Attribute Name: SAP_Document_Type_Code
**Output:**
The selected attribute "SAP_Document_Type_Code" is removed from the visible dataset. The data remains in the underlying system but is no longer displayed in tables, filters, or analysis views. Users see a cleaner dataset focused on business-relevant attributes like Total_Cost, Approval_Duration, and Vendor_Name.
**Insights:** By removing technical ERP codes and system fields, analysts can more easily identify patterns in procurement processes without being distracted by implementation-specific attributes that add no analytical value.
### Example 2: Privacy Protection for Healthcare Data
**Scenario:** A hospital's patient flow analysis dataset needs to be shared with external consultants, but certain attributes containing sensitive medical information should not be visible during the engagement.
**Settings:**
- Attribute Name: Patient_Medical_Record_Number
**Output:**
The "Patient_Medical_Record_Number" attribute is hidden from all views while maintaining the dataset's analytical capabilities. The case can still be tracked using the Case ID, but the sensitive medical record identifier is no longer visible in any reports or analysis screens.
**Insights:** This approach enables secure collaboration with external parties while maintaining patient privacy and compliance with healthcare regulations, all without creating multiple versions of the dataset.
### Example 3: Cleaning Up Manufacturing Process Data
**Scenario:** A manufacturing process dataset includes numerous intermediate calculation fields from previous analyses that are no longer needed and make it difficult to navigate the attribute list.
**Settings:**
- Attribute Name: Temp_Calc_Quality_Score_v1
**Output:**
The temporary calculation attribute "Temp_Calc_Quality_Score_v1" is removed from view. The final "Quality_Score" attribute remains visible, and users no longer see the intermediate calculation fields that were used during development but are not needed for ongoing analysis.
**Insights:** Removing obsolete calculation fields streamlines the dataset, making it easier for users to find and work with current, relevant attributes while reducing confusion about which metrics to use.
### Example 4: Focus Financial Audit Analysis
**Scenario:** An accounts payable audit dataset contains both operational and financial attributes, but auditors need to focus exclusively on financial controls and compliance-related fields.
**Settings:**
- Attribute Name: Vendor_Contact_Email
**Output:**
The "Vendor_Contact_Email" attribute is hidden, allowing auditors to concentrate on financial attributes like Invoice_Amount, Payment_Terms, and Approval_Hierarchy without distraction from operational contact information.
**Insights:** Creating a focused view helps auditors efficiently identify financial control issues and compliance violations without being overwhelmed by operational details that are outside their audit scope.
### Example 5: Streamlining Order Fulfillment Dashboard
**Scenario:** An e-commerce order fulfillment dataset includes detailed product attributes that are not relevant for process performance analysis and slow down dashboard rendering.
**Settings:**
- Attribute Name: Product_Description_Long
**Output:**
The lengthy "Product_Description_Long" text attribute is hidden from the dataset view. Performance metrics, delivery times, and order statuses remain visible, creating a more responsive and focused analytical environment. The dashboard loads faster and is easier to navigate.
**Insights:** Removing verbose text fields that don't contribute to process analysis improves both system performance and user experience, allowing analysts to focus on process efficiency metrics rather than product details.
## Output
The Hide Attribute enrichment modifies the dataset's visible structure without altering the underlying data. The selected attribute is removed from:
- Case and event attribute lists in the user interface
- Filter selection dropdowns
- Export operations (unless specifically configured otherwise)
- Calculation and enrichment attribute selectors
- Data preview tables and grids
The hidden attribute remains in the dataset's internal structure and can potentially be restored through dataset configuration if needed. No new attributes are created by this enrichment - it only affects the visibility of existing attributes. Other enrichments that previously referenced the hidden attribute will continue to function normally as the data remains intact in the background.
## See Also
- **Hide Blank Attributes** - Automatically hide all attributes that contain no values
- **Anonymize** - Replace sensitive text values with anonymous identifiers while keeping attributes visible
- **Rename Attribute** - Change attribute names to be more user-friendly without hiding them
- **Limit Text Length** - Truncate long text values instead of hiding entire attributes
- **Representative Case Attribute** - Create simplified categorical attributes from complex data
---
*This documentation is part of the mindzie Studio process mining platform.*
---
## Hide Blank Attributes
Section: Enrichments
URL: https://docs.mindziestudio.com/mindzie_studio/enrichments/hide-blank-attributes
Source: /docs-master/mindzieStudio/enrichments/hide-blank-attributes/page.md
# Hide Blank Attributes
## Overview
The Hide Blank Attributes enrichment is an automated data cleanup operator that identifies and removes all attributes (columns) that contain no data across your entire dataset. This powerful cleanup tool scans both case-level and event-level attributes, automatically hiding any columns where every single row contains null or empty values. By removing these empty columns, the enrichment significantly simplifies your dataset view, reduces visual clutter in analysis tools, and improves performance when working with large datasets.
This enrichment is particularly valuable when importing data from enterprise systems that export fixed schemas with many optional fields, or when working with datasets that have undergone multiple transformations where some attributes become obsolete. Unlike manual column removal which requires identifying each empty column individually, this enrichment performs a comprehensive sweep of your entire dataset in a single operation. The enrichment preserves all columns that contain at least one non-null value, ensuring no potentially useful data is lost while maximizing the cleanliness and usability of your process mining workspace.
## Common Uses
- Clean imported datasets from ERP systems that include hundreds of optional fields with no populated data
- Simplify dataset views after filtering operations that may leave certain attributes completely empty
- Reduce visual clutter in the case and event attribute panels to focus on meaningful data
- Improve performance and reduce memory usage when working with wide datasets containing many unused columns
- Prepare datasets for export or sharing by removing irrelevant empty columns
- Clean up after data transformations that consolidate multiple attributes into new calculated fields
- Streamline conformance checking by removing attributes that provide no analytical value
## Settings
This enrichment operates automatically without requiring any configuration. It scans all non-calculated and non-hidden attributes in your dataset, removing only those that are completely empty across all cases and events.
## Examples
### Example 1: Cleaning ERP System Export
**Scenario:** A manufacturing company exports order processing data from SAP with over 200 standard fields, but their specific implementation only uses about 60 fields, leaving 140+ columns completely empty and making analysis difficult.
**Before Enrichment:**
Dataset contains 215 total attributes including:
- Case Attributes: 125 columns (75 empty)
- Event Attributes: 90 columns (65 empty)
- Examples of empty columns: Legacy_System_ID, Deprecated_Cost_Center, Old_Warehouse_Code, Custom_Field_1 through Custom_Field_50
**After Enrichment:**
Dataset simplified to 75 meaningful attributes:
- Case Attributes: 50 columns (all containing data)
- Event Attributes: 25 columns (all containing data)
- All empty columns automatically hidden from view
**Output:** The enrichment removed 140 empty columns while preserving all 75 columns that contained at least one value. The dataset view is now focused only on attributes with actual data, making navigation and analysis significantly easier.
**Insights:** After cleanup, analysts could quickly identify the relevant attributes for process mining. The simplified view revealed that order processing actually involved only 12 key attributes for decision-making, which were previously hidden among hundreds of empty fields. Performance improved by 40% when loading the dataset due to reduced memory overhead.
### Example 2: Post-Filtering Cleanup in Healthcare
**Scenario:** A hospital filters their patient treatment dataset to analyze only emergency department cases, which causes many specialized ward attributes to become completely empty since emergency cases don't use those data fields.
**Before Enrichment:**
After filtering to emergency cases only:
- Total Attributes: 180
- Populated Attributes: Emergency_Triage_Level, Emergency_Wait_Time, Emergency_Treatment
- Empty Attributes: ICU_Ventilator_Settings, Surgery_Type, Rehabilitation_Plan, Oncology_Stage, and 85 other specialized department fields
**After Enrichment:**
- Total Visible Attributes: 92
- All attributes now contain relevant emergency department data
- 88 empty specialized department attributes hidden
**Output:** The enrichment automatically identified and hid all attributes that became empty after the emergency department filter was applied. The remaining attributes all contain data relevant to emergency cases.
**Insights:** The cleaned dataset allowed emergency department managers to focus on their specific KPIs without distraction from irrelevant fields. Analysis time decreased by 60% as staff no longer had to scroll through empty columns to find relevant data.
### Example 3: Financial Process Consolidation
**Scenario:** A bank merges invoice processing data from three different systems, each with unique field structures, resulting in many system-specific attributes being empty for cases from other systems.
**Before Enrichment:**
Merged dataset with 340 attributes:
- Common fields (used by all systems): 45 attributes
- System A specific fields: 95 attributes (empty for System B and C cases)
- System B specific fields: 110 attributes (empty for System A and C cases)
- System C specific fields: 90 attributes (empty for System A and B cases)
**After Enrichment:**
Focused dataset with 45 common attributes visible, plus only the system-specific attributes that contain data for the current case selection.
**Output:** The enrichment removed all columns that were completely empty, leaving only the 45 common fields that all three systems populate. System-specific attributes that were empty across the entire merged dataset were automatically hidden.
**Insights:** The consolidation revealed that despite different system structures, all three systems captured the same 45 core process attributes. This discovery enabled the bank to standardize their invoice processing across all systems and reduce complexity by 85%.
### Example 4: Procurement Data Preparation
**Scenario:** A retail company's procurement dataset includes attributes for various approval levels and special handling codes, but many of these fields are only used for high-value or regulated items, leaving them empty for routine purchases.
**Before Enrichment:**
Dataset with 150 attributes including:
- Standard fields: PO_Number, Supplier, Amount, Create_Date (always populated)
- Conditional fields: VP_Approval, Legal_Review, Hazmat_Code, Export_License, Compliance_Check (95% empty)
- Legacy fields: Old_Vendor_Code, Previous_System_Ref (100% empty after migration)
**After Enrichment:**
Streamlined dataset with 67 active attributes:
- All standard procurement fields retained
- Conditional fields with at least one value retained
- Completely empty legacy fields removed
**Output:** The enrichment hid 83 attributes that contained no data, including all legacy fields and conditional approval fields that were never used in the current dataset. The remaining attributes all contribute to process analysis.
**Insights:** After cleanup, the procurement team discovered that only 5% of purchases actually required special approvals, allowing them to streamline the process for the 95% of routine purchases. The simplified view made it easy to identify these high-complexity cases for separate analysis.
### Example 5: Manufacturing Quality Control
**Scenario:** An automotive parts manufacturer exports quality control data with hundreds of measurement fields, but each production line only uses specific measurements relevant to their parts, leaving many fields empty.
**Before Enrichment:**
Quality dataset with 450 attributes:
- Common fields: Part_Number, Production_Line, Timestamp, Pass_Fail (always populated)
- Line-specific measurements: 200+ measurement fields per line (empty for other lines)
- Deprecated measurements: 50+ old quality metrics no longer collected
**After Enrichment:**
Relevant dataset with 125 attributes:
- All common fields preserved
- Only measurements with data retained
- All deprecated and unused measurement fields hidden
**Output:** The enrichment removed 325 empty measurement columns while preserving the 125 columns containing actual quality data. Each production line's view now shows only relevant measurements.
**Insights:** The cleanup revealed that despite having 450 possible measurements, each production line only actively monitored 20-30 critical quality metrics. This insight led to a focused quality improvement program that reduced defect rates by 15% by concentrating on the measurements that actually mattered.
## Output
The Hide Blank Attributes enrichment modifies the visibility of existing columns without deleting data:
**Hidden Columns:**
- Case attributes where every case row contains null/empty values
- Event attributes where every event row contains null/empty values
- Columns are marked as hidden but not deleted from the dataset
- Hidden status can be reversed if needed through column management
**Preserved Columns:**
- All columns containing at least one non-null value
- All calculated columns (created by other enrichments)
- All columns already marked as hidden (no redundant processing)
- System columns like Case ID and Activity names
**Performance Impact:**
- Reduced memory usage when loading datasets
- Faster rendering of attribute lists and filters
- Improved query performance on simplified column sets
- Cleaner export files when sharing datasets
The enrichment's effects are immediately visible in the case and event attribute panels, where empty columns no longer appear. This creates a focused, efficient workspace for process analysis.
## See Also
- [Anonymize](../anonymize/page.md) - Hide sensitive data while preserving process structure
- [Trim Text](../trim-text/page.md) - Remove whitespace from text attributes
- [Text Start](../text-start/page.md) - Extract beginning portions of text attributes
- [Text End](../text-end/page.md) - Extract ending portions of text attributes
- [Group Attribute Values](../group-attribute-values/page.md) - Consolidate similar attribute values
---
*This documentation is part of the mindzie Studio process mining platform.*
---
## Limit Text Length
Section: Enrichments
URL: https://docs.mindziestudio.com/mindzie_studio/enrichments/limit-text-length
Source: /docs-master/mindzieStudio/enrichments/limit-text-length/page.md
# Limit Text Length
## Overview
The Limit Text Length enrichment is a data cleanup operator that automatically truncates text values in your dataset to a specified maximum number of characters. This essential data standardization tool helps manage text fields that exceed desired length limits, ensuring consistency across your process mining dataset and preventing issues with downstream analysis, visualization, and system integrations. When working with data from various sources, text fields often contain excessively long values that can impact performance, readability, and compatibility with other systems.
This enrichment intelligently processes both case-level and event-level text attributes, preserving the original meaning while enforcing length constraints. Unlike manual truncation approaches that risk data corruption or inconsistency, this operator applies uniform truncation rules across your entire dataset. The enrichment is particularly valuable when preparing data for dashboards where long text values can disrupt layouts, or when integrating with systems that have strict character limits for certain fields.
## Common Uses
- Standardize description fields that contain verbose text from ERP systems or ticketing platforms
- Prepare data for visualization in dashboards where long text values break table layouts or chart readability
- Enforce character limits before exporting data to systems with strict field length requirements
- Truncate lengthy comment fields while preserving the most important initial information
- Standardize product names, customer names, or reference codes to consistent maximum lengths
- Improve performance of process mining analysis by reducing memory usage from excessively long text values
- Create uniform text fields for better alignment in reports and exported documents
## Settings
**Attribute Name:** Select the text attribute you want to limit. The dropdown displays all available text attributes from both case-level and event-level data. Only string/text type attributes are shown as valid selections. This is a required field that determines which column in your dataset will have its values truncated.
**Maximum Length:** Specify the maximum number of characters to retain. Any text value exceeding this length will be truncated to exactly this number of characters. The value must be greater than 0. Default value is 100 characters. Common values include:
- 50 characters for short descriptions or codes
- 100 characters for standard text fields
- 255 characters for compatibility with many database systems
- 500 characters for longer descriptions while still maintaining readability
## Examples
### Example 1: Standardizing Product Descriptions in Manufacturing
**Scenario:** A manufacturing company's product catalog contains detailed technical descriptions that can exceed 1000 characters, causing issues in their process mining dashboards and making reports difficult to read.
**Settings:**
- Attribute Name: Product_Description
- Maximum Length: 150
**Before Enrichment:**
| Case ID | Product_Description | Order_Value |
|---------|-------------------|-------------|
| ORD-001 | "High-precision CNC machined aluminum component with aerospace-grade 7075-T6 alloy, featuring complex 5-axis milling patterns, anodized finish in matte black, tolerances within 0.001 inches, designed for critical aviation applications requiring maximum strength-to-weight ratio and corrosion resistance in extreme environmental conditions including salt spray, temperature variations from -60C to 150C, and high vibration environments typical of turbine engine mounting applications" | $12,500 |
| ORD-002 | "Standard steel bracket, zinc plated" | $45 |
| ORD-003 | "Custom fabricated stainless steel assembly with multiple welded joints, polished to mirror finish, designed for pharmaceutical clean room applications with full FDA compliance and documentation package included" | $3,200 |
**After Enrichment:**
| Case ID | Product_Description | Order_Value |
|---------|-------------------|-------------|
| ORD-001 | "High-precision CNC machined aluminum component with aerospace-grade 7075-T6 alloy, featuring complex 5-axis milling patterns, anodized finis" | $12,500 |
| ORD-002 | "Standard steel bracket, zinc plated" | $45 |
| ORD-003 | "Custom fabricated stainless steel assembly with multiple welded joints, polished to mirror finish, designed for pharmaceutical clean room ap" | $3,200 |
**Output:** Product descriptions are truncated to exactly 150 characters. Short descriptions remain unchanged while longer ones are cut at the character limit.
**Insights:** After standardizing description lengths, dashboard performance improved by 40%, and product categorization reports became more readable. The team discovered that 85% of critical product information appeared in the first 150 characters, making this truncation suitable for analysis while maintaining full descriptions in the source system.
### Example 2: Managing Customer Feedback Comments in Service Processes
**Scenario:** A telecommunications company's customer service system captures detailed customer complaints that can be several paragraphs long, making it difficult to analyze patterns in their service process mining.
**Settings:**
- Attribute Name: Customer_Feedback
- Maximum Length: 200
**Event Data Before:**
| Case ID | Activity | Customer_Feedback | Timestamp |
|---------|----------|------------------|-----------|
| TICKET-001 | Create Ticket | "Internet connection has been extremely unreliable for the past three weeks. Speed drops to almost nothing during evening hours between 7-10 PM. Have restarted modem multiple times, checked all cables, even replaced the router with my own but problem persists. This is affecting my ability to work from home and my children cannot complete their online homework. Previous technician visit on March 15 did not resolve the issue. Need immediate resolution as I'm considering switching providers if this continues. Very frustrated with the lack of consistent service despite paying for the premium package." | 2024-03-20 14:30 |
| TICKET-002 | Create Ticket | "Bill incorrect - charged twice" | 2024-03-20 15:15 |
**Event Data After:**
| Case ID | Activity | Customer_Feedback | Timestamp |
|---------|----------|------------------|-----------|
| TICKET-001 | Create Ticket | "Internet connection has been extremely unreliable for the past three weeks. Speed drops to almost nothing during evening hours between 7-10 PM. Have restarted modem multiple times, checked all ca" | 2024-03-20 14:30 |
| TICKET-002 | Create Ticket | "Bill incorrect - charged twice" | 2024-03-20 15:15 |
**Output:** Customer feedback is limited to 200 characters, preserving the beginning of each message where the main issue is typically stated.
**Insights:** Text mining on the truncated feedback revealed that 92% of issues could be categorized from the first 200 characters. Process analysis showed that tickets with feedback over 200 characters had 35% longer resolution times, indicating complex issues requiring escalation.
### Example 3: Preparing Purchase Order Data for System Integration
**Scenario:** A procurement department needs to export purchase order data to a legacy accounting system that has a 50-character limit for vendor names, but their current data contains full legal company names that can exceed 200 characters.
**Settings:**
- Attribute Name: Vendor_Name
- Maximum Length: 50
**Before Enrichment:**
| Case ID | Vendor_Name | PO_Amount |
|---------|------------|-----------|
| PO-2024-001 | "International Business Machines Corporation (IBM) Global Technology Services Division" | $125,000 |
| PO-2024-002 | "Acme Inc." | $3,500 |
| PO-2024-003 | "Johnson & Johnson Consumer Healthcare Products Manufacturing and Distribution Limited Partnership" | $45,750 |
**After Enrichment:**
| Case ID | Vendor_Name | PO_Amount |
|---------|------------|-----------|
| PO-2024-001 | "International Business Machines Corporation (IBM" | $125,000 |
| PO-2024-002 | "Acme Inc." | $3,500 |
| PO-2024-003 | "Johnson & Johnson Consumer Healthcare Products Ma" | $45,750 |
**Output:** Vendor names are truncated to 50 characters to meet system requirements while maintaining enough information for identification.
**Insights:** The truncation allowed successful integration with the legacy system while maintaining vendor identifiability. Analysis showed that 78% of vendor names were already under 50 characters, and the truncated names still retained enough information for unique identification in procurement reports.
### Example 4: Optimizing Activity Names in Process Mining
**Scenario:** An insurance claims process has activity names that include detailed sub-process information, making process maps cluttered and difficult to read.
**Settings:**
- Attribute Name: Activity_Name
- Maximum Length: 30
**Event Data Before:**
| Case ID | Activity_Name | Resource | Timestamp |
|---------|--------------|----------|-----------|
| CLAIM-001 | "Initial Claim Review and Documentation Verification by Senior Adjuster" | John Smith | 2024-03-15 09:00 |
| CLAIM-001 | "Medical Records Request Sent to Healthcare Provider via Secure Portal" | Sarah Johnson | 2024-03-15 10:30 |
| CLAIM-001 | "Approve" | Mark Davis | 2024-03-15 14:00 |
**Event Data After:**
| Case ID | Activity_Name | Resource | Timestamp |
|---------|--------------|----------|-----------|
| CLAIM-001 | "Initial Claim Review and Docu" | John Smith | 2024-03-15 09:00 |
| CLAIM-001 | "Medical Records Request Sent " | Sarah Johnson | 2024-03-15 10:30 |
| CLAIM-001 | "Approve" | Mark Davis | 2024-03-15 14:00 |
**Output:** Activity names are limited to 30 characters, creating more concise labels for process visualization.
**Insights:** The shortened activity names improved process map readability by 60% while retaining the essential information about each step. Process analysts could now identify bottlenecks more quickly, and the standardized lengths made activity frequency analysis more accurate.
### Example 5: Standardizing Reference Numbers Across Systems
**Scenario:** A logistics company consolidates shipment data from multiple carriers, each using different reference number formats with varying lengths, causing issues in their unified tracking dashboard.
**Settings:**
- Attribute Name: Tracking_Reference
- Maximum Length: 25
**Before Enrichment:**
| Case ID | Tracking_Reference | Carrier | Status |
|---------|-------------------|---------|--------|
| SHIP-001 | "UPS1Z9999999999999999-EXPEDITED-INTERNATIONAL-PRIORITY" | UPS | In Transit |
| SHIP-002 | "FEDEX777888999000" | FedEx | Delivered |
| SHIP-003 | "DHL-EXPR-WORLDWIDE-DOC-999888777666555-PREPAID-MORNING-DELIVERY" | DHL | Processing |
**After Enrichment:**
| Case ID | Tracking_Reference | Carrier | Status |
|---------|-------------------|---------|--------|
| SHIP-001 | "UPS1Z9999999999999999-EXP" | UPS | In Transit |
| SHIP-002 | "FEDEX777888999000" | FedEx | Delivered |
| SHIP-003 | "DHL-EXPR-WORLDWIDE-DOC-99" | DHL | Processing |
**Output:** Tracking references are standardized to a maximum of 25 characters while preserving the most important identifying information.
**Insights:** Standardizing reference lengths enabled creation of a unified tracking dashboard that could display all carriers' information consistently. The company found that the core tracking number always appeared within the first 25 characters, making this truncation ideal for their reporting needs.
## Output
The Limit Text Length enrichment modifies text attribute values directly in your dataset without creating new attributes. The enrichment operates on the selected attribute whether it's a case attribute or an event attribute:
**For Case Attributes:** Each unique case in your dataset has its selected text attribute value checked and truncated if it exceeds the specified maximum length. The truncation happens at exactly the character limit specified, potentially cutting words mid-way.
**For Event Attributes:** Every event row in your dataset has its selected text attribute value checked and truncated if necessary. This means the same attribute might be truncated differently across different events depending on the original values.
**Important Characteristics:**
- Original attribute names remain unchanged
- Data type remains as string/text
- Values shorter than or equal to the maximum length remain completely unchanged
- Null or empty values are not affected
- Truncation occurs at the exact character position without considering word boundaries
- Special characters, spaces, and punctuation count toward the character limit
- No ellipsis (...) or other indicators are added to show truncation
The modified attribute values are immediately available for use in filters, calculators, and other enrichments. This in-place modification ensures that all subsequent operations in your process mining analysis use the standardized text lengths.
## See Also
- **Trim Text** - Remove leading and trailing whitespace from text attributes
- **Upper Case** - Convert text attributes to uppercase for standardization
- **Text Start** - Extract a specified number of characters from the beginning of text values
- **Text End** - Extract a specified number of characters from the end of text values
- **Find and Replace** - Replace specific text patterns within attribute values
- **Concatenate Attributes** - Combine multiple text attributes into a single field
---
*This documentation is part of the mindzie Studio process mining platform.*
---
## Logical Or
Section: Enrichments
URL: https://docs.mindziestudio.com/mindzie_studio/enrichments/logical-or
Source: /docs-master/mindzieStudio/enrichments/logical-or/page.md
# Logical OR
## Overview
The Logical OR enrichment performs boolean OR operations across multiple boolean attributes to create a new consolidated boolean attribute. This logical operator evaluates whether any of the selected boolean attributes contains a TRUE value, producing TRUE if at least one input is TRUE, and FALSE only when all inputs are FALSE. The enrichment is essential for combining multiple binary conditions, flags, or indicators into a single meaningful attribute that represents whether any of several conditions have been met.
In process mining and analysis, the Logical OR enrichment is particularly valuable when you need to identify cases that meet at least one of several criteria. For example, you might want to flag cases that have any type of exception, identify orders that triggered any kind of alert, or determine whether any compliance rule was violated. The enrichment operates at the case level, evaluating the boolean attributes for each case independently and storing the result as a new case attribute that can be used in further analysis, filtering, or visualization.
The enrichment intelligently handles null values by excluding them from the evaluation. If all selected attributes are null for a particular case, the result will also be null, preserving data integrity and avoiding false positives or negatives in your analysis.
## Common Uses
- Identify cases with any type of quality issue by combining multiple quality check flags
- Flag orders that triggered any alert condition (payment alert OR delivery alert OR fraud alert)
- Determine if any compliance violation occurred across multiple compliance checks
- Detect processes that experienced any type of exception or error condition
- Identify customers who qualify through any of multiple eligibility criteria
- Mark cases requiring review if any review trigger condition is met
- Consolidate multiple approval flags to determine if any approval was granted
## Settings
**New Attribute Name:** Specify the name for the new boolean attribute that will store the OR operation result. Choose a descriptive name that clearly indicates what conditions are being combined. For example, use "Any_Exception_Occurred" when combining exception flags, or "Any_Approval_Granted" when combining approval statuses. The name must be unique and cannot conflict with existing attributes in your dataset.
**Attribute Names:** Select the boolean attributes you want to combine using the OR logic. You must select at least two boolean attributes for the operation. The enrichment will evaluate all selected attributes for each case and return TRUE if any of them is TRUE. Only boolean (True/False) attributes are available for selection. These can be original attributes from your dataset or boolean attributes created by other enrichments or calculators.
## Examples
### Example 1: Quality Control Alert System
**Scenario:** In a manufacturing process, multiple quality checks are performed at different stages. You need to identify products that failed any quality check to route them for detailed inspection.
**Settings:**
- New Attribute Name: Any_Quality_Issue
- Attribute Names: Visual_Inspection_Failed, Dimension_Check_Failed, Weight_Check_Failed, Functionality_Test_Failed
**Output:**
Creates a new boolean attribute "Any_Quality_Issue" that is TRUE when any quality check failed:
| Case ID | Visual_Inspection_Failed | Dimension_Check_Failed | Weight_Check_Failed | Functionality_Test_Failed | Any_Quality_Issue |
|---------|--------------------------|------------------------|-------------------|---------------------------|-------------------|
| P-001 | FALSE | FALSE | FALSE | FALSE | FALSE |
| P-002 | TRUE | FALSE | FALSE | FALSE | TRUE |
| P-003 | FALSE | FALSE | TRUE | FALSE | TRUE |
| P-004 | TRUE | TRUE | FALSE | TRUE | TRUE |
**Insights:** This consolidated flag enables quality managers to quickly identify all products requiring inspection, regardless of which specific test they failed, streamlining the quality control workflow.
### Example 2: Customer Service Priority Routing
**Scenario:** A customer service center needs to identify high-priority support tickets that meet any of several escalation criteria for immediate attention.
**Settings:**
- New Attribute Name: Requires_Immediate_Attention
- Attribute Names: Is_VIP_Customer, Multiple_Contact_Attempts, Complaint_Contains_Legal_Terms, Service_Level_Breach
**Output:**
The enrichment evaluates each case and sets "Requires_Immediate_Attention" to TRUE if any escalation criterion is met:
| Case ID | Is_VIP_Customer | Multiple_Contact_Attempts | Complaint_Contains_Legal_Terms | Service_Level_Breach | Requires_Immediate_Attention |
|---------|-----------------|---------------------------|--------------------------------|---------------------|------------------------------|
| CS-101 | FALSE | FALSE | FALSE | FALSE | FALSE |
| CS-102 | TRUE | FALSE | FALSE | FALSE | TRUE |
| CS-103 | FALSE | TRUE | TRUE | FALSE | TRUE |
| CS-104 | FALSE | FALSE | FALSE | TRUE | TRUE |
**Insights:** Support managers can filter and prioritize tickets that require immediate attention, ensuring critical issues are addressed promptly regardless of the specific trigger.
### Example 3: Fraud Detection in Financial Transactions
**Scenario:** A financial institution uses multiple fraud indicators to flag suspicious transactions. Any positive indicator should trigger a fraud review process.
**Settings:**
- New Attribute Name: Potential_Fraud_Alert
- Attribute Names: Unusual_Amount_Flag, Location_Mismatch, Velocity_Check_Failed, Blacklist_Match, Pattern_Anomaly_Detected
**Output:**
Creates "Potential_Fraud_Alert" that triggers when any fraud indicator is positive:
| Transaction | Unusual_Amount_Flag | Location_Mismatch | Velocity_Check_Failed | Blacklist_Match | Pattern_Anomaly_Detected | Potential_Fraud_Alert |
|-------------|---------------------|-------------------|----------------------|-----------------|--------------------------|----------------------|
| TXN-8901 | FALSE | FALSE | FALSE | FALSE | FALSE | FALSE |
| TXN-8902 | TRUE | FALSE | FALSE | FALSE | FALSE | TRUE |
| TXN-8903 | FALSE | FALSE | TRUE | FALSE | TRUE | TRUE |
| TXN-8904 | FALSE | TRUE | FALSE | TRUE | FALSE | TRUE |
**Insights:** The fraud team can immediately identify all transactions requiring review, enabling rapid response to potential fraud while the specific indicators provide context for investigation.
### Example 4: Healthcare Patient Risk Assessment
**Scenario:** A hospital emergency department needs to identify patients who meet any criteria for high-risk classification to ensure appropriate care protocols.
**Settings:**
- New Attribute Name: High_Risk_Patient
- Attribute Names: Elderly_Patient, Chronic_Condition, Immunocompromised, Recent_Surgery, Critical_Vitals
**Output:**
Evaluates multiple risk factors to identify high-risk patients:
| Patient ID | Elderly_Patient | Chronic_Condition | Immunocompromised | Recent_Surgery | Critical_Vitals | High_Risk_Patient |
|------------|-----------------|-------------------|-------------------|----------------|-----------------|-------------------|
| PT-201 | FALSE | FALSE | FALSE | FALSE | FALSE | FALSE |
| PT-202 | TRUE | TRUE | FALSE | FALSE | FALSE | TRUE |
| PT-203 | FALSE | FALSE | FALSE | TRUE | FALSE | TRUE |
| PT-204 | FALSE | TRUE | TRUE | FALSE | TRUE | TRUE |
**Insights:** Medical staff can quickly identify patients requiring enhanced monitoring or specialized care protocols, improving patient safety and care quality.
### Example 5: Supply Chain Disruption Detection
**Scenario:** A logistics company monitors multiple indicators for potential supply chain disruptions and needs to flag shipments at risk from any disruption type.
**Settings:**
- New Attribute Name: Disruption_Risk_Flag
- Attribute Names: Weather_Alert, Port_Congestion, Carrier_Issue, Customs_Hold_Risk, Route_Restriction
**Output:**
Combines multiple risk indicators to identify shipments potentially affected by disruptions:
| Shipment | Weather_Alert | Port_Congestion | Carrier_Issue | Customs_Hold_Risk | Route_Restriction | Disruption_Risk_Flag |
|----------|--------------|-----------------|---------------|-------------------|-------------------|---------------------|
| SH-5001 | FALSE | FALSE | FALSE | FALSE | FALSE | FALSE |
| SH-5002 | TRUE | FALSE | FALSE | FALSE | FALSE | TRUE |
| SH-5003 | FALSE | TRUE | FALSE | TRUE | FALSE | TRUE |
| SH-5004 | FALSE | FALSE | FALSE | FALSE | NULL | FALSE |
**Insights:** Logistics coordinators can proactively manage shipments with any type of disruption risk, enabling contingency planning and customer communication.
## Output
The Logical OR enrichment creates a new boolean case attribute with the name specified in the "New Attribute Name" setting. This attribute contains TRUE or FALSE values based on the OR logic evaluation of the selected input attributes.
**Logical Operation:** The enrichment implements the standard boolean OR operation:
- Returns TRUE if at least one selected attribute is TRUE
- Returns FALSE only if all selected attributes are FALSE
- Returns NULL if all selected attributes are NULL
**Null Value Handling:** The enrichment intelligently handles null values in the input attributes:
- Null values are excluded from the OR evaluation
- If some attributes are NULL and others are FALSE, the result is FALSE
- If some attributes are NULL and at least one is TRUE, the result is TRUE
- Only when all attributes are NULL will the result be NULL
**Data Type:** The output attribute is always of boolean type, displaying as TRUE/FALSE, Yes/No, or 1/0 depending on your visualization settings in mindzieStudio.
**Integration Capabilities:** The new boolean attribute created by this enrichment can be:
- Used as input for other logical enrichments (creating complex logical expressions)
- Applied in case filters to select subsets of data
- Utilized in conditional calculators and enrichments
- Displayed in process maps to highlight cases meeting any criterion
- Exported with your enriched dataset for external analysis
- Combined with other boolean attributes in dashboards and reports
## See Also
- **Negate** - Inverts boolean values (NOT operation)
- **Boolean Count** - Counts how many boolean attributes are TRUE
- **Case Compare Attributes** - Compares attributes to create boolean results
- **Filter Cases** - Use the OR result to filter your dataset
---
*This documentation is part of the mindzie Studio process mining platform.*
---
## Mandatory Activity
Section: Enrichments
URL: https://docs.mindziestudio.com/mindzie_studio/enrichments/mandatory-activity
Source: /docs-master/mindzieStudio/enrichments/mandatory-activity/page.md
# Mandatory Activity
## Overview
The Mandatory Activity enrichment identifies cases where required activities are missing from your process execution, helping you ensure process completeness and compliance with business rules. This conformance checking tool automatically detects when critical steps have been skipped, bypassed, or failed to execute, enabling you to maintain process integrity and regulatory compliance.
Unlike enrichments that detect unwanted activities, this enrichment focuses on verifying the presence of essential activities that must occur in every case for the process to be considered complete and compliant. For example, quality inspections in manufacturing, approval steps in procurement, or mandatory documentation activities in healthcare processes. The enrichment creates boolean attributes that flag cases missing these critical activities, allowing you to quickly identify and remediate incomplete process executions.
## Common Uses
- Verify completion of mandatory quality control checks in manufacturing processes
- Ensure required approval steps are executed in procurement and purchase orders
- Confirm mandatory documentation activities in healthcare patient treatment flows
- Check for completion of required training verification before equipment operation
- Validate presence of mandatory security checks in IT access provisioning
- Monitor compliance with regulatory requirements that mandate specific process steps
- Detect cases where critical validation or verification activities were skipped
## Settings
**Rule Group Name:** Enter a descriptive name for this conformance rule group. This name serves as a prefix for all attributes created by this enrichment and appears in conformance reports. Choose a name that clearly indicates the type of mandatory requirements being monitored, such as "Missing Required Activities", "Incomplete Process Steps", or "Mandatory Compliance Checks". Default value is "No activity".
**Severity:** Select the severity level for cases where mandatory activities are missing:
- **Low:** Missing activities that should be addressed but don't pose immediate risk
- **Medium:** Significant gaps that could impact process quality or efficiency
- **High:** Critical missing activities that represent compliance failures or major process defects
**Activity Attribute Values:** Select one or more activities from your event log that must be present in every compliant case. The enrichment will create a separate boolean attribute for each selected activity, marking cases where that specific mandatory activity is missing. Activities are displayed with their case count and percentage statistics to help you understand current compliance rates and identify which mandatory activities are most frequently skipped.
## Examples
### Example 1: Manufacturing Quality Assurance
**Scenario:** A manufacturing company needs to ensure that all products undergo mandatory quality inspection steps before shipping. Missing these inspections could result in defective products reaching customers and potential regulatory violations.
**Settings:**
- Rule Group Name: "Missing QA Steps"
- Severity: High
- Activity Attribute Values:
- "Initial Quality Check"
- "Final Product Inspection"
- "Quality Certificate Generation"
- "QA Manager Approval"
**Output:**
The enrichment creates five boolean attributes on the case level:
- "Missing QA Steps" (master attribute - TRUE if any QA step is missing)
- "Missing QA Steps: Initial Quality Check" (TRUE when this specific activity is missing)
- "Missing QA Steps: Final Product Inspection" (TRUE when this activity is missing)
- "Missing QA Steps: Quality Certificate Generation" (TRUE when this activity is missing)
- "Missing QA Steps: QA Manager Approval" (TRUE when this activity is missing)
Cases with TRUE values indicate products that were shipped without completing all mandatory quality assurance steps.
**Insights:** Analysis revealed that 12% of cases were missing the "QA Manager Approval" step, primarily during weekend shifts when managers were unavailable. This led to implementing a rotating approval schedule to ensure continuous coverage.
### Example 2: Healthcare Patient Admission Compliance
**Scenario:** A hospital must ensure that all patient admissions include mandatory documentation and assessment activities to comply with healthcare regulations and ensure proper patient care.
**Settings:**
- Rule Group Name: "Incomplete Admission Process"
- Severity: High
- Activity Attribute Values:
- "Patient Consent Obtained"
- "Insurance Verification"
- "Initial Medical Assessment"
- "Allergy Check Completed"
- "Emergency Contact Recorded"
**Output:**
The enrichment generates attributes marking cases where mandatory admission steps were not completed. For instance, "Incomplete Admission Process: Insurance Verification" = TRUE indicates patients admitted without insurance verification, which could lead to billing issues and compliance violations.
**Insights:** The analysis identified that 8% of emergency admissions were missing "Patient Consent Obtained" due to patient condition at arrival. This finding led to implementing a post-stabilization consent process for emergency cases.
### Example 3: Financial Loan Processing
**Scenario:** A bank needs to verify that all loan applications go through mandatory verification and approval steps before disbursement to prevent fraud and ensure regulatory compliance.
**Settings:**
- Rule Group Name: "Missing Loan Verification"
- Severity: Medium
- Activity Attribute Values:
- "Identity Verification"
- "Credit Score Check"
- "Income Verification"
- "Collateral Assessment"
- "Risk Manager Review"
**Output:**
Boolean attributes flag loan cases processed without completing mandatory verification steps. For example, cases where "Missing Loan Verification: Collateral Assessment" = TRUE represent unsecured loans that should have had collateral verification.
**Insights:** The enrichment revealed that 5% of small business loans bypassed "Risk Manager Review" during peak processing periods, leading to implementation of automated risk scoring for low-value loans.
### Example 4: IT Change Management
**Scenario:** An IT department must ensure all system changes follow the mandatory change management process, including testing and approval steps, to prevent unplanned outages.
**Settings:**
- Rule Group Name: "Incomplete Change Process"
- Severity: Medium
- Activity Attribute Values:
- "Change Request Submitted"
- "Impact Analysis Completed"
- "Test Environment Validation"
- "CAB Approval"
- "Rollback Plan Documented"
**Output:**
The enrichment identifies changes implemented without following the complete approval process. Cases marked with "Incomplete Change Process: Test Environment Validation" = TRUE represent changes deployed directly to production without testing.
**Insights:** Analysis showed that 15% of emergency changes skipped "Test Environment Validation", correlating with 60% of subsequent system incidents. This led to creating a rapid testing protocol for emergency changes.
### Example 5: Procurement Compliance
**Scenario:** A procurement department needs to ensure all purchase orders above certain thresholds include mandatory competitive bidding and approval activities to maintain transparency and compliance.
**Settings:**
- Rule Group Name: "Missing Procurement Controls"
- Severity: High
- Activity Attribute Values:
- "Multiple Vendor Quotes Obtained"
- "Budget Verification"
- "Procurement Committee Review"
- "Legal Department Approval"
- "Final Director Sign-off"
**Output:**
Boolean conformance attributes identify purchase orders that bypassed mandatory procurement controls. The master attribute "Missing Procurement Controls" provides an overall compliance indicator, while individual attributes like "Missing Procurement Controls: Multiple Vendor Quotes Obtained" show specific control failures.
**Insights:** The enrichment discovered that 18% of high-value purchases were missing "Multiple Vendor Quotes Obtained", primarily for specialized equipment with single suppliers. This finding led to creating an exemption process for sole-source procurements.
## Output
The Mandatory Activity enrichment creates multiple boolean attributes at the case level that indicate conformance issues:
**Master Conformance Attribute:** A single boolean attribute with the name specified in "Rule Group Name" that becomes TRUE when any of the selected mandatory activities are missing from a case. This provides a high-level indicator of process incompleteness.
**Individual Activity Attributes:** For each selected mandatory activity, a specific boolean attribute is created with the format "[Rule Group Name]: [Activity Name]". These attributes are TRUE when that specific mandatory activity is missing from the case, allowing detailed analysis of which requirements are most frequently missed.
**Attribute Properties:**
- Data Type: Boolean
- Display Format: Yes/No
- Column Type: ConformanceIssue
- Aggregation: Can be used with case count/percentage calculators to measure compliance rates
All created attributes can be used in subsequent filters to identify non-compliant cases, in calculators to measure compliance metrics, and in dashboards to monitor process completeness over time. The conformance issues are also registered in the system's conformance issue list with the specified severity level, enabling comprehensive conformance reporting and analysis.
## See Also
- [Undesired Activity](/mindzie_studio/enrichments/undesired-activity) - Detect activities that should not occur in your process
- [Repeated Activity](/mindzie_studio/enrichments/repeated-activity) - Identify unintended activity repetitions
- [Allowed Case Start Activities](/mindzie_studio/enrichments/allowed-case-start-activities) - Validate that cases begin with approved activities
- [Allowed Case End Activities](/mindzie_studio/enrichments/allowed-case-end-activities) - Ensure cases end with proper completion activities
- [Wrong Activity Order](/mindzie_studio/enrichments/wrong-activity-order) - Detect activities occurring in incorrect sequence
---
*This documentation is part of the mindzie Studio process mining platform.*
---
## Max Value
Section: Enrichments
URL: https://docs.mindziestudio.com/mindzie_studio/enrichments/max-value
Source: /docs-master/mindzieStudio/enrichments/max-value/page.md
# Max Value
## Overview
The Max Value enrichment identifies and extracts the maximum value from a selected event attribute across all events within each case, creating a new case-level attribute with this highest value. This statistical operator is essential for understanding peak values, worst-case scenarios, and maximum thresholds in your process data. Unlike aggregations that might average or sum values, Max Value specifically captures the single highest value encountered during the entire process execution, making it invaluable for identifying extremes and outliers.
This enrichment is particularly powerful in process mining scenarios where understanding maximum values provides critical insights into process boundaries, capacity limits, or peak performance indicators. For instance, you can identify the highest cost incurred at any step of a procurement process, the maximum temperature reached during a manufacturing cycle, or the longest individual wait time experienced by a customer. The enrichment preserves the data type of the source attribute, ensuring that numeric maximums, date maximums, and even text maximums (based on alphabetical ordering) are handled appropriately.
## Common Uses
- Identify peak resource consumption during any activity in the process
- Find the highest cost or price recorded at any process step
- Determine maximum wait times or delays experienced in customer service
- Track peak inventory levels reached during supply chain processes
- Identify maximum temperature, pressure, or quality scores in manufacturing
- Find the latest timestamp or date value across all process events
- Determine highest approval amounts or transaction values in financial processes
## Settings
**New Attribute Name:** Specify the name for the new case attribute that will store the maximum value. Choose a descriptive name that clearly indicates what maximum is being captured, such as "Max_Transaction_Amount", "Peak_Temperature", or "Highest_Priority_Level". This name must be unique and will be added to your case table for use in further analysis, filtering, and visualization.
**Activity Names:** Select the event attribute from which you want to extract the maximum value. This dropdown lists all available event attributes except for the standard activity name and timestamp columns. The enrichment will scan through all events in each case and identify the highest value of this selected attribute. Only attributes that contain comparable values (numbers, dates, or text) should be selected. The data type of the selected attribute will determine how the maximum is calculated - numeric values use mathematical comparison, dates use chronological comparison, and text uses alphabetical ordering.
## Examples
### Example 1: Peak Transaction Amount in Payment Processing
**Scenario:** In a payment processing system, you need to identify the highest individual transaction amount processed for each customer case to support fraud detection and credit limit management.
**Settings:**
- New Attribute Name: Max_Transaction_Amount
- Activity Names: Transaction_Amount
**Output:**
Creates a new case attribute "Max_Transaction_Amount" containing the highest transaction value from all payment events in each case. For a case with transactions of:
- Payment 1: $125.50
- Payment 2: $450.00
- Payment 3: $89.75
- Payment 4: $1,250.00
- Payment 5: $75.00
The Max_Transaction_Amount would be $1,250.00
**Insights:** This maximum value helps identify cases with unusually high transactions that may require additional verification, supports credit limit decisions, and enables risk-based processing rules.
### Example 2: Maximum Temperature in Manufacturing Process
**Scenario:** In a chemical manufacturing process, monitoring the peak temperature reached during production is critical for quality control and safety compliance.
**Settings:**
- New Attribute Name: Peak_Process_Temperature
- Activity Names: Reactor_Temperature_C
**Output:**
For each production batch, creates "Peak_Process_Temperature" by scanning all temperature readings:
- Heating Phase: 85°C
- Reaction Phase 1: 120°C
- Reaction Phase 2: 145°C
- Cooling Phase: 95°C
- Stabilization: 75°C
Result: Peak_Process_Temperature = 145°C
**Insights:** Tracking peak temperatures enables quality assurance teams to identify batches that exceeded temperature thresholds, correlate temperature extremes with product quality issues, and ensure safety protocols were maintained.
### Example 3: Longest Individual Wait Time in Healthcare
**Scenario:** A hospital emergency department wants to identify the maximum wait time experienced at any stage of patient treatment to improve service levels and patient satisfaction.
**Settings:**
- New Attribute Name: Max_Stage_Wait_Minutes
- Activity Names: Stage_Wait_Time
**Output:**
For each patient case, identifies the longest wait at any treatment stage:
- Triage Wait: 15 minutes
- Doctor Consultation Wait: 45 minutes
- Lab Test Wait: 30 minutes
- Treatment Wait: 85 minutes
- Discharge Wait: 20 minutes
Result: Max_Stage_Wait_Minutes = 85 minutes
**Insights:** Identifying the maximum wait time helps hospital administrators understand worst-case patient experiences, identify specific bottleneck stages, and prioritize process improvements where they will have the most impact.
### Example 4: Highest Inventory Level in Supply Chain
**Scenario:** A retail distribution center needs to track peak inventory levels for each product SKU to optimize warehouse space allocation and prevent stockouts.
**Settings:**
- New Attribute Name: Peak_Inventory_Units
- Activity Names: Current_Stock_Level
**Output:**
For each SKU's replenishment cycle, captures the highest inventory level:
- Initial Stock: 500 units
- After Receiving: 1,800 units
- Mid-cycle: 1,200 units
- Before Reorder: 350 units
- After Emergency Restock: 2,100 units
Result: Peak_Inventory_Units = 2,100 units
**Insights:** Understanding peak inventory levels supports warehouse capacity planning, helps identify overstocking situations, and enables better inventory optimization strategies.
### Example 5: Maximum Approval Authority in Procurement
**Scenario:** In a procurement process with multiple approval stages, identifying the highest approval authority level involved helps understand process complexity and compliance requirements.
**Settings:**
- New Attribute Name: Max_Approval_Level
- Activity Names: Approver_Authority_Level
**Output:**
For each purchase request, identifies the highest approval level involved:
- Department Manager: Level 2
- Finance Manager: Level 3
- Director: Level 4
- CFO: Level 5
- VP Operations: Level 4
Result: Max_Approval_Level = 5 (CFO level)
**Insights:** Tracking maximum approval levels helps analyze which purchases required executive involvement, supports delegation optimization, and enables audit trail analysis for compliance reporting.
## Output
The Max Value enrichment creates a single new attribute in your case table with the name specified in the settings. This attribute will contain the maximum value found across all events in each case for the selected event attribute. The data type of the new attribute matches the source event attribute - if you're finding the maximum of a numeric field, the output will be numeric; if finding the maximum of a date field, the output will be a date.
Cases where the selected event attribute has no values (all null) will receive a null value in the new maximum attribute. The enrichment handles missing values gracefully by excluding them from the maximum calculation. The new attribute becomes immediately available for use in filters, calculators, and other enrichments, enabling you to build complex analytical logic based on these peak values.
## See Also
- **Summarize Values** - Calculate the sum of event attribute values across a case
- **Count Values** - Count occurrences of specific values in events
- **Event Count** - Count the total number of events in a case
- **Count Activities** - Count occurrences of specific activities
- **Duration Between Two Activities** - Calculate time spans between process steps
---
*This documentation is part of the mindzie Studio process mining platform.*
---
## Multiply
Section: Enrichments
URL: https://docs.mindziestudio.com/mindzie_studio/enrichments/multiply
Source: /docs-master/mindzieStudio/enrichments/multiply/page.md
# Multiply
## Overview
The Multiply enrichment performs multiplication operations on attribute values and stores the result in a new attribute. You can multiply multiple attributes together or multiply attributes by a constant value. This is useful for unit conversions, calculating derived metrics, and performing mathematical transformations on your process data.
## Common Uses
- Multiply several attributes together to calculate composite values
- Multiply an attribute by a constant for unit conversions
- Convert between units (e.g., thousands to actual values, hours to minutes)
- Calculate total costs (quantity × unit price)
- Apply scaling factors or conversion rates
## Settings
Start by going to the 'Log Enrichment' engine by going to any analysis and clicking 'Log Enrichment' in the top right.
Then click 'Add New'
Then choose the Multiply enrichment block.
### Configuration Options
- **Filters:** Add any filter you like. The enrichment will define attributes only for cases that are selected by the filter.
- **New Attribute Name:** Specify the name of the new attribute you are about to create.
- **Source:** Select whether you would like to take the case attribute or an event attribute.
- Case attributes are defined at the level of the whole case
- Event attributes are defined at each event in the case
- **Attribute Names:** Select multiple attributes that you wish to multiply together, or select just one attribute that you wish to multiply by a constant.
- **Constant:** Specify the constant that the attribute(s) should be multiplied by.
## Examples
### Example 1: Unit Conversion
If your invoice amount is stored in thousands, you may multiply the invoice attribute by 1000 to convert the number to its initial number format.

In this example:
- **New Attribute Name**: "Invoice_Actual_Amount"
- **Source**: Case attributes
- **Attribute Names**: "Invoice_Amount" (stored in thousands)
- **Constant**: 1000
Click 'Create' and once you're ready click 'Calculate Enrichment' to add the new attribute to your data set.

The new attribute "Invoice_Actual_Amount" now contains the actual invoice values (Invoice_Amount × 1000).
## Output
When this enrichment is executed, it creates a new numeric case or event attribute with the name you specified in "New Attribute Name".
The attribute value is calculated as:
**Result = Attribute1 × Attribute2 × ... × AttributeN × Constant**
For example:
- If you select one attribute with value 50 and set Constant to 100
- Result = 50 × 100 = 5,000
**Null Handling:** If any of the selected attributes contain null values, the result will be null.
**Data Type:** The result is stored as a numeric value. For very large multiplications, ensure your data system can handle the magnitude of the result.
## See Also
**Related Mathematical Enrichments:**
- [Divide](/mindzie_studio/enrichments/divide) - Divide one attribute by another
- [Subtract](/mindzie_studio/enrichments/subtract) - Subtract one attribute from another
- Add - Add attribute values together
**Related Topics:**
- Calculated Attributes - Overview of attribute calculations
- Data Quality - Handling null values and data issues
---
*This documentation is part of the mindzie Studio process mining platform.*
---
## Negate
Section: Enrichments
URL: https://docs.mindziestudio.com/mindzie_studio/enrichments/negate
Source: /docs-master/mindzieStudio/enrichments/negate/page.md
# Negate
## Overview
The Negate enrichment performs logical negation on boolean attribute values, inverting TRUE to FALSE and FALSE to TRUE, and storing the result in a new attribute. This fundamental logical operator provides essential capabilities for identifying inverse conditions, finding exceptions to rules, and creating complementary logic in your process analysis. By flipping boolean values, the Negate enrichment enables you to easily identify cases that don't meet certain criteria, highlight process deviations, and build more sophisticated conditional logic in your analyses.
The Negate enrichment is particularly valuable in process mining scenarios where you need to understand the opposite of existing conditions. For instance, you can identify cases that are NOT compliant when you have a compliance flag, find activities that did NOT occur on time when you have an on-time indicator, or highlight exceptions to standard processing rules. This enrichment works seamlessly with other logical operators like OR and comparison operators, allowing you to build complex boolean expressions that capture nuanced business rules and conditions in your process data.
## Common Uses
- Identify non-compliant cases by negating a compliance flag attribute
- Find delayed processes by inverting an "on-time" boolean indicator
- Highlight exceptions by negating standard processing condition attributes
- Create inverse filters for analyzing what did NOT happen in a process
- Build complex logical conditions by combining negation with other boolean operators
- Identify missing approvals by negating approval status flags
- Find incomplete cases by inverting completion status attributes
## Settings
**New Attribute Name:** Specify the name for the new attribute that will store the negated boolean value. Choose a descriptive name that clearly indicates the inverted logic. For example, use "Non_Compliant" when negating a "Compliant" attribute, or "Delayed" when negating an "On_Time" attribute. The name must be unique and cannot conflict with existing attributes in your dataset.
**Attribute Names:** Select the boolean attribute whose values you want to negate. Only boolean attributes (TRUE/FALSE) are available for selection. The attribute must already exist in your dataset - you can use boolean attributes from the original data or those created by other enrichments such as comparison operators or conformance checks. The selected attribute's values will be inverted to create the new attribute.
## Examples
### Example 1: Identifying Non-Compliant Purchase Orders
**Scenario:** In a procurement process, you have a boolean attribute "Meets_Budget_Guidelines" that indicates whether each purchase order stays within budget limits. You need to identify and analyze orders that exceed budget guidelines for special review.
**Settings:**
- New Attribute Name: Exceeds_Budget
- Attribute Names: Meets_Budget_Guidelines
**Output:**
Creates a new case attribute "Exceeds_Budget" with inverted values:
- Cases where Meets_Budget_Guidelines = TRUE → Exceeds_Budget = FALSE
- Cases where Meets_Budget_Guidelines = FALSE → Exceeds_Budget = TRUE
- Cases where Meets_Budget_Guidelines = null → Exceeds_Budget = null
**Insights:** This inverted attribute makes it easy to filter and analyze purchase orders that require budget exception approval, helping procurement teams focus on high-risk transactions and understand patterns in budget overruns.
### Example 2: Finding Delayed Patient Treatments
**Scenario:** A hospital tracks whether emergency room patients are seen within the target time using a "Seen_Within_Target" boolean attribute. Healthcare administrators need to identify delayed cases for process improvement initiatives.
**Settings:**
- New Attribute Name: Treatment_Delayed
- Attribute Names: Seen_Within_Target
**Output:**
For each patient case, creates "Treatment_Delayed":
- Patient seen within 2 hours (Seen_Within_Target = TRUE) → Treatment_Delayed = FALSE
- Patient wait exceeded 2 hours (Seen_Within_Target = FALSE) → Treatment_Delayed = TRUE
This allows easy identification of all delayed cases for root cause analysis.
**Insights:** The negated attribute enables quick filtering of delayed treatments, helping identify patterns in delays by time of day, department, or patient acuity level, leading to targeted process improvements.
### Example 3: Detecting Missing Approvals in Loan Processing
**Scenario:** A financial institution has a boolean attribute "Manager_Approval_Received" for loan applications. Compliance officers need to identify applications processed without proper managerial approval.
**Settings:**
- New Attribute Name: Missing_Manager_Approval
- Attribute Names: Manager_Approval_Received
**Output:**
Creates "Missing_Manager_Approval" for each loan application:
- Applications with approval (Manager_Approval_Received = TRUE) → Missing_Manager_Approval = FALSE
- Applications without approval (Manager_Approval_Received = FALSE) → Missing_Manager_Approval = TRUE
**Insights:** This inverted flag immediately highlights compliance violations, enabling quick remediation and helping prevent regulatory issues. It can be used in dashboards to monitor approval compliance rates in real-time.
### Example 4: Identifying Incomplete Manufacturing Orders
**Scenario:** A manufacturing company tracks order completion with a "Quality_Check_Passed" boolean attribute. Production managers need to identify orders that failed quality checks for rework planning.
**Settings:**
- New Attribute Name: Requires_Rework
- Attribute Names: Quality_Check_Passed
**Output:**
For each manufacturing order:
- Orders passing quality (Quality_Check_Passed = TRUE) → Requires_Rework = FALSE
- Orders failing quality (Quality_Check_Passed = FALSE) → Requires_Rework = TRUE
Sample data showing the transformation:
- Order #1001: Quality_Check_Passed = TRUE → Requires_Rework = FALSE
- Order #1002: Quality_Check_Passed = FALSE → Requires_Rework = TRUE
- Order #1003: Quality_Check_Passed = TRUE → Requires_Rework = FALSE
**Insights:** The negated attribute helps production teams quickly identify and prioritize orders requiring rework, estimate rework capacity needs, and analyze root causes of quality failures.
### Example 5: Finding Unresolved Customer Service Tickets
**Scenario:** A customer service department has a "Ticket_Resolved" boolean attribute. Service managers need to focus on unresolved tickets to improve response times and customer satisfaction.
**Settings:**
- New Attribute Name: Still_Open
- Attribute Names: Ticket_Resolved
**Output:**
Creates "Still_Open" attribute for service tickets:
- Resolved tickets (Ticket_Resolved = TRUE) → Still_Open = FALSE
- Unresolved tickets (Ticket_Resolved = FALSE) → Still_Open = TRUE
This enables immediate filtering of all open tickets requiring attention.
**Insights:** The inverted attribute facilitates real-time monitoring of open ticket volumes, helps identify aging unresolved issues, and enables trend analysis of resolution rates over time.
## Output
The Negate enrichment creates a new boolean case attribute with the name specified in the "New Attribute Name" setting. The output attribute contains the logical inverse of the input boolean values.
**Truth Table:**
- Input: TRUE → Output: FALSE
- Input: FALSE → Output: TRUE
- Input: null → Output: null (remains null, not negated)
**Data Type:** The output attribute is always of type Boolean, displayed according to your mindzieStudio display format settings (typically "Yes/No" or "True/False").
**Null Value Handling:** If the source attribute contains a null value for a particular case, the negated attribute will also be null for that case. The enrichment does not convert null values to FALSE or TRUE - it preserves the null state to maintain data integrity and avoid incorrect assumptions about missing data.
**Integration with Other Features:** The negated attribute can be used immediately in:
- Filters to focus on specific subsets of cases (e.g., filter on Still_Open = TRUE)
- Other logical enrichments like "Logical OR" to build complex conditions
- Calculators to count or analyze negated conditions
- Conformance checking to identify process violations
- Dashboards and reports for monitoring inverse KPIs
The attribute appears in all attribute selection lists throughout mindzieStudio and maintains full compatibility with export functions and external analysis tools.
## See Also
- **Logical OR** - Combine multiple boolean attributes with OR logic
- **Compare Two Attributes** - Create boolean attributes by comparing values
- **Count Boolean Attributes with Value** - Count how many boolean attributes have specific values
- **Combine Boolean Attributes** - Concatenate names of TRUE boolean attributes
---
*This documentation is part of the mindzie Studio process mining platform.*
---
## Predict Value
Section: Enrichments
URL: https://docs.mindziestudio.com/mindzie_studio/enrichments/predict-value
Source: /docs-master/mindzieStudio/enrichments/predict-value/page.md
# Predict Value
## Overview
The Predict Value enrichment uses advanced regression techniques to predict numeric attribute values based on historical patterns in your process data. This powerful statistical operator analyzes completed cases with known outcomes to build predictive models that can estimate values for ongoing or new cases. By examining relationships between input attributes and dependent variables, the enrichment identifies patterns and applies them to make data-driven predictions about future values.
This enrichment is particularly valuable for forecasting and planning in process mining scenarios. It enables organizations to predict process outcomes before completion, estimate financial impacts based on early indicators, and make proactive decisions based on likely future values. The enrichment uses configurable aggregation functions and historical case analysis to provide not just predictions but also confidence scores, helping users understand the reliability of each prediction. The operator can handle complex scenarios including minimum value constraints and fallback calculations, ensuring robust predictions even when historical data is limited.
## Common Uses
- Predict delivery times based on order characteristics and customer location
- Estimate final invoice amounts from initial purchase order details
- Forecast production output based on input materials and process parameters
- Predict customer satisfaction scores from early interaction indicators
- Estimate project completion dates based on initial milestones
- Forecast resource consumption based on process attributes
- Predict quality scores from production line parameters
## Settings
**New Attribute Name:** Specify the name for the new attribute that will store the predicted value. This attribute will contain the numeric prediction for each case. Choose a descriptive name that clearly indicates what value is being predicted, such as "Predicted_Delivery_Days" or "Estimated_Final_Cost".
**Algorithm Name (Optional):** Provide a custom name for the prediction algorithm. This name will be stored in a companion attribute (alongside the prediction and confidence score) to help track which method was used for each prediction. Useful when testing different prediction configurations or when multiple prediction enrichments are applied.
**Input Attribute Names:** Select one or more string attributes that will be used to group cases for prediction. Cases with matching values in these attributes will be considered similar and used together for prediction. For example, selecting "Customer_Region" and "Product_Category" means predictions will be based on historical cases from the same region and product category. If no attributes are selected, all cases with the dependent variable will be used as predictors.
**Dependent Attribute Name:** Select the numeric attribute you want to predict. This must be a numeric field (integer or decimal) that exists in some completed cases but may be missing in ongoing cases. The enrichment will analyze historical values of this attribute to make predictions for cases where it's not yet available.
**Min Value Attribute Name (Optional):** Select a numeric attribute that provides a minimum threshold for predictions. When specified, predictions will never be lower than this value. This is useful for business rules like "predicted delivery time cannot be less than current elapsed time" or "estimated cost cannot be below material cost". The attribute must be different from the dependent attribute.
**Filter (Optional):** Apply filters to limit which historical cases are used for building the prediction model. This allows you to exclude outliers, focus on recent data, or use only high-quality cases for prediction. For example, you might filter to use only cases from the last 6 months or exclude cases with data quality issues.
**Aggregate Function:** Choose the statistical function used to combine historical values into a prediction:
- **Average:** Uses the mean of historical values (default, balances all observations)
- **Median:** Uses the middle value (robust against outliers)
- **Max:** Uses the highest historical value (conservative for upper bounds)
- **Min:** Uses the lowest historical value (conservative for lower bounds)
**Min Cases:** Set the minimum number of historical cases required to make a prediction. Default is 2. If fewer matching cases are available, no prediction will be made unless a minimum value constraint provides a fallback. Higher values increase prediction reliability but may result in fewer predictions.
**Max Cases:** Set the maximum number of recent cases to use for prediction. Default is 10. The enrichment uses the most recent cases up to this limit, ensuring predictions reflect current patterns rather than outdated historical data. Lower values make predictions more responsive to recent changes.
**Min Value Constant:** When using minimum value constraints, this constant is added to the minimum value to create a fallback prediction. Default is 0. For example, with a minimum value of 100 and constant of 10, the fallback would be 110. This ensures predictions meet business requirements even when historical data is insufficient.
**Min Value Factor:** When using minimum value constraints, this factor multiplies the minimum value in the fallback calculation. Default is 1.0. For example, with a minimum value of 100 and factor of 1.2, the fallback would be 120. This allows proportional adjustments based on the minimum threshold.
## Examples
### Example 1: Predicting Delivery Times in E-commerce
**Scenario:** An online retailer wants to predict delivery times for new orders based on historical delivery patterns, considering customer location and shipping method to set accurate customer expectations.
**Settings:**
- New Attribute Name: Predicted_Delivery_Days
- Algorithm Name: Regional_Shipping_Model
- Input Attribute Names: Customer_Region, Shipping_Method
- Dependent Attribute Name: Actual_Delivery_Days
- Min Value Attribute Name: Current_Days_In_Transit
- Filter: Order_Date > 30 days ago
- Aggregate Function: Average
- Min Cases: 5
- Max Cases: 20
- Min Value Constant: 1
- Min Value Factor: 1.1
**Output:**
Creates three new case attributes:
- **Predicted_Delivery_Days:** The estimated number of days for delivery (e.g., 5.3 days)
- **Predicted_Delivery_Days - Confidence:** Confidence score between 0 and 1 (e.g., 0.75)
- **Predicted_Delivery_Days - Algorithm:** Algorithm used ("Regional_Shipping_Model" or "Fixed" for fallback)
For a new order from Region_West using Express_Shipping, the enrichment finds 15 similar historical orders averaging 3.2 days, resulting in prediction of 3.2 days with 0.75 confidence.
**Insights:** The prediction helps set realistic delivery expectations, identify orders likely to be delayed, and optimize shipping method selection based on predicted versus promised delivery times.
### Example 2: Forecasting Invoice Amounts in Procurement
**Scenario:** A procurement department needs to predict final invoice amounts based on initial purchase requisition details to improve budget planning and identify potential cost overruns early.
**Settings:**
- New Attribute Name: Predicted_Invoice_Amount
- Input Attribute Names: Vendor_Name, Material_Category
- Dependent Attribute Name: Final_Invoice_Amount
- Min Value Attribute Name: Initial_PO_Amount
- Aggregate Function: Median
- Min Cases: 3
- Max Cases: 15
- Min Value Constant: 0
- Min Value Factor: 1.05
**Output:**
Creates prediction attributes showing estimated final invoice amount. For a new purchase order of $10,000 from Vendor_A for Raw_Materials:
- Predicted_Invoice_Amount: $10,750 (based on historical median of 7.5% above PO amount)
- Confidence: 0.6 (using 9 historical cases)
- Algorithm: Median-based prediction
**Insights:** Enables proactive budget management, early identification of vendors with consistent overages, and improved accuracy in financial planning.
### Example 3: Estimating Manufacturing Quality Scores
**Scenario:** A manufacturing plant wants to predict quality scores for products currently in production based on early process parameters, enabling early intervention for potential quality issues.
**Settings:**
- New Attribute Name: Predicted_Quality_Score
- Input Attribute Names: Production_Line, Product_Type, Shift
- Dependent Attribute Name: Final_Quality_Score
- Filter: Production_Date > 60 days ago AND Quality_Score IS NOT NULL
- Aggregate Function: Average
- Min Cases: 10
- Max Cases: 30
**Output:**
For products currently in production on Line_A making Product_Type_X during Day_Shift:
- Predicted_Quality_Score: 92.5 (scale 0-100)
- Confidence: 0.87 (based on 26 similar historical cases)
- Algorithm: Standard prediction
**Insights:** Allows quality teams to focus inspection efforts on products with low predicted scores, adjust process parameters proactively, and reduce quality-related rework costs.
### Example 4: Predicting Patient Length of Stay in Healthcare
**Scenario:** A hospital wants to predict patient length of stay based on admission diagnosis and initial assessment data to optimize bed management and resource allocation.
**Settings:**
- New Attribute Name: Predicted_LOS_Days
- Input Attribute Names: Admission_Diagnosis, Patient_Age_Group, Admission_Type
- Dependent Attribute Name: Actual_LOS_Days
- Min Value Attribute Name: Current_LOS_Days
- Aggregate Function: Median
- Min Cases: 8
- Max Cases: 25
- Min Value Constant: 1
- Min Value Factor: 1.0
**Output:**
For a newly admitted elderly patient with pneumonia through emergency admission currently on day 2:
- Predicted_LOS_Days: 7 days (median of similar cases)
- Confidence: 0.72
- Algorithm: Used if less than minimum historical cases, would show "Fixed" with current LOS + 1 day
**Insights:** Enables better bed capacity planning, helps identify patients likely to have extended stays requiring additional support, and improves discharge planning processes.
### Example 5: Forecasting Project Costs in Construction
**Scenario:** A construction company needs to predict final project costs based on initial project characteristics to improve bidding accuracy and identify projects at risk of cost overruns.
**Settings:**
- New Attribute Name: Predicted_Total_Cost
- Input Attribute Names: Project_Type, Client_Industry, Project_Region
- Dependent Attribute Name: Final_Project_Cost
- Min Value Attribute Name: Current_Spent_Amount
- Filter: Project_Start_Date > 365 days ago
- Aggregate Function: Average
- Min Cases: 4
- Max Cases: 12
- Min Value Constant: 50000
- Min Value Factor: 1.15
**Output:**
For a new commercial building project in Region_North for a retail client with $2M already spent:
- Predicted_Total_Cost: $3,500,000 (based on 8 similar historical projects)
- Confidence: 0.67
- Algorithm: Shows calculation method used
If historical data is insufficient, uses fallback: $2,000,000 × 1.15 + $50,000 = $2,350,000
**Insights:** Improves project profitability through accurate cost prediction, enables early intervention for projects trending over budget, and supports more competitive and realistic bidding strategies.
## Output
The Predict Value enrichment creates three related case attributes that work together to provide comprehensive prediction information:
**Primary Prediction Attribute:** Named according to your "New Attribute Name" setting, this attribute contains the predicted numeric value. The data type is always Double (decimal number) to accommodate precise predictions. Values are calculated based on historical patterns or minimum value constraints when applicable.
**Confidence Score Attribute:** Automatically created with the name format "[New Attribute Name] - Confidence", this attribute contains a confidence score between 0 and 1 indicating prediction reliability. Higher values indicate more historical cases were available for prediction. The confidence is calculated as: (number of cases used) / (maximum cases + 1).
**Algorithm Tracking Attribute:** Automatically created with the name format "[New Attribute Name] - Algorithm", this string attribute records which method was used for each prediction. It will contain either your custom algorithm name (if specified) for standard predictions, or "Fixed" when fallback calculations based on minimum values were used.
These attributes integrate seamlessly with other mindzieStudio features - use them in filters to identify high-confidence predictions, in calculators to compare predicted versus actual values, or in visualizations to analyze prediction accuracy patterns.
## See Also
- [Categorize Attribute Values](../categorize-attribute-values) - Group continuous predicted values into categories
- [Representative Case Attribute](../representative-case-attribute) - Alternative approach using most common values
- [Python](../python) - Create custom prediction models with machine learning
- [Add](../add) - Combine multiple predictions or add adjustments
- [Multiply](../multiply) - Apply scaling factors to predictions
---
*This documentation is part of the mindzie Studio process mining platform.*
---
## Python
Section: Enrichments
URL: https://docs.mindziestudio.com/mindzie_studio/enrichments/python
Source: /docs-master/mindzieStudio/enrichments/python/page.md
# Python
## Overview
The Python enrichment is one of the most powerful and flexible enrichment operators in mindzieStudio, enabling you to write custom Python code to transform, analyze, and enrich your process mining data. This operator provides direct access to your event log data through Pandas DataFrames, allowing you to leverage the full Python ecosystem including libraries like NumPy, Pandas, and custom business logic to create sophisticated data transformations that go beyond standard enrichments.
With a usage frequency of 95%, Python is one of the most commonly used enrichments in mindzieStudio. It bridges the gap between standard process mining operations and advanced data science workflows, enabling data scientists and analysts to apply custom algorithms, complex business rules, and advanced analytics directly within their process mining pipeline. The operator seamlessly integrates Python code execution with mindzieStudio's data model, automatically handling data serialization, type conversion, and result integration back into your dataset.
## Common Uses
- Calculate complex KPIs that require custom business logic not available in standard calculators
- Apply machine learning models for prediction, classification, or clustering directly on process data
- Perform advanced text processing and natural language processing on event attributes
- Implement custom conformance checks based on complex business rules
- Create derived attributes using statistical analysis and advanced mathematical operations
- Integrate external data sources by calling APIs or reading external files within Python code
- Build custom data quality checks and validation rules specific to your business domain
## Settings
**Filter:** Optional filter to limit which cases are processed by the Python script. This allows you to apply transformations only to specific subsets of your data, improving performance and enabling targeted analysis. When no filter is applied, the Python code processes all cases in the dataset.
**Columns:** Select which existing columns from your dataset should be made available to the Python script. These columns will be accessible in the `case_table` and `event_table` DataFrames. Only selected columns are passed to Python to minimize memory usage and improve performance. The CaseId column is always included automatically.
**Change Columns:** Specify which of the selected columns can be modified by your Python script. This setting allows you to update existing attribute values while maintaining data integrity. Only columns that were selected in the Columns setting can be marked for modification.
**New Columns:** Define new attributes that your Python script will create. For each new column, you must specify:
- Column Name: The internal name used in Python code
- Display Name: The user-friendly name shown in mindzieStudio
- Data Type: The data type (String, Integer, DateTime, Boolean, Double)
- Source Type: Whether the attribute is added at Case or Event level
- Format: Optional display format for the attribute
**Python Code:** The Python script that will be executed on your data. Your code has access to:
- `case_table`: Pandas DataFrame containing case-level attributes
- `event_table`: Pandas DataFrame containing event-level data with columns for InternalEventIndex, CaseId, ActivityName, ActivityTime, and any selected event attributes
The script should modify these DataFrames in place. Any changes to existing columns (marked in Change Columns) or additions of new columns (defined in New Columns) will be automatically integrated back into your dataset.
**Python Image:** Specifies the Python execution environment. Options include:
- LOCAL: Uses local Python installation (if available)
- Docker image name: Specific Docker image with required Python packages
- Default: mindzie's standard Python environment with common data science libraries
## Examples
### Example 1: Calculate Order Processing Efficiency Score
**Scenario:** In an order-to-cash process, you need to calculate a custom efficiency score based on order value, processing time, and number of rework activities.
**Settings:**
- Filter: None (process all cases)
- Columns: OrderValue, CustomerPriority
- Change Columns: None
- New Columns:
- Column Name: EfficiencyScore
- Display Name: Efficiency Score
- Data Type: Double
- Source Type: Case
- Python Code:
```python
# Calculate efficiency score for each order
import numpy as np
# Count rework activities per case
rework_activities = ['Order Correction', 'Price Adjustment', 'Approval Retry']
event_table['IsRework'] = event_table['ActivityName'].isin(rework_activities)
rework_counts = event_table.groupby('CaseId')['IsRework'].sum().reset_index()
rework_counts.columns = ['CaseId', 'ReworkCount']
# Calculate case duration in days
case_durations = event_table.groupby('CaseId')['ActivityTime'].agg(['min', 'max'])
case_durations['Duration'] = (case_durations['max'] - case_durations['min']).dt.total_seconds() / 86400
case_durations = case_durations.reset_index()[['CaseId', 'Duration']]
# Merge with case table
case_table = case_table.merge(rework_counts, on='CaseId', how='left')
case_table = case_table.merge(case_durations, on='CaseId', how='left')
# Calculate efficiency score (0-100)
case_table['EfficiencyScore'] = 100 * (
(case_table['OrderValue'] / case_table['OrderValue'].max()) * 0.4 +
(1 - case_table['ReworkCount'] / 10) * 0.3 +
(1 - case_table['Duration'] / 30) * 0.3
)
case_table['EfficiencyScore'] = np.clip(case_table['EfficiencyScore'], 0, 100)
# Clean up temporary columns
case_table = case_table.drop(['ReworkCount', 'Duration'], axis=1)
```
- Python Image: LOCAL
**Output:**
Creates a new case attribute "Efficiency Score" with values ranging from 0 to 100, where higher scores indicate more efficient order processing based on the combination of order value, minimal rework, and faster processing time.
**Insights:** This custom score helps identify which orders are processed most efficiently and can be used to benchmark performance, identify best practices, and prioritize process improvement initiatives.
### Example 2: Detect Anomalous Event Sequences
**Scenario:** In a healthcare patient treatment process, identify cases where the sequence of medical procedures deviates from standard protocols.
**Settings:**
- Filter: None
- Columns: PatientAge, Department
- Change Columns: None
- New Columns:
- Column Name: HasAnomalousSequence
- Display Name: Anomalous Sequence Detected
- Data Type: Boolean
- Source Type: Case
- Column Name: AnomalyDescription
- Display Name: Anomaly Description
- Data Type: String
- Source Type: Case
- Python Code:
```python
# Define expected sequence patterns
normal_sequences = [
['Registration', 'Triage', 'Examination', 'Treatment', 'Discharge'],
['Registration', 'Triage', 'Examination', 'Lab Test', 'Treatment', 'Discharge'],
['Registration', 'Emergency Assessment', 'Treatment', 'Observation', 'Discharge']
]
def check_sequence_anomaly(group):
activities = group.sort_values('ActivityTime')['ActivityName'].tolist()
# Check for repeated activities
if len(activities) != len(set(activities)):
return True, "Repeated activities detected"
# Check for out-of-order activities
if 'Discharge' in activities and activities.index('Discharge') < len(activities) - 1:
return True, "Activities after discharge"
if 'Registration' in activities and activities.index('Registration') > 0:
return True, "Registration not first activity"
# Check if sequence matches any normal pattern
matches_normal = any(
all(act in activities for act in normal_seq)
for normal_seq in normal_sequences
)
if not matches_normal and len(activities) > 3:
return True, "Non-standard sequence pattern"
return False, ""
# Apply anomaly detection to each case
anomaly_results = event_table.groupby('CaseId').apply(check_sequence_anomaly)
# Add results to case table
case_table['HasAnomalousSequence'] = case_table['CaseId'].map(
lambda x: anomaly_results[x][0] if x in anomaly_results.index else False
)
case_table['AnomalyDescription'] = case_table['CaseId'].map(
lambda x: anomaly_results[x][1] if x in anomaly_results.index else ""
)
```
- Python Image: LOCAL
**Output:**
Creates two new case attributes:
- "Anomalous Sequence Detected": Boolean flag indicating if the case has an unusual sequence
- "Anomaly Description": Text description explaining the type of anomaly detected
**Insights:** This enrichment helps identify cases that deviate from standard medical protocols, enabling quality assurance teams to investigate potential issues and ensure patient safety.
### Example 3: Calculate Supplier Performance Metrics
**Scenario:** In a procurement process, calculate comprehensive supplier performance metrics based on delivery times, quality issues, and order completeness.
**Settings:**
- Filter: ActivityName = "Goods Receipt"
- Columns: SupplierID, OrderQuantity, ReceivedQuantity
- Change Columns: None
- New Columns:
- Column Name: OnTimeDeliveryRate
- Display Name: On-Time Delivery Rate %
- Data Type: Double
- Source Type: Case
- Column Name: QualityScore
- Display Name: Supplier Quality Score
- Data Type: Double
- Source Type: Case
- Python Code:
```python
# Calculate delivery performance
def calculate_supplier_metrics(group):
po_created = group[group['ActivityName'] == 'PO Created']['ActivityTime'].min()
goods_received = group[group['ActivityName'] == 'Goods Receipt']['ActivityTime'].max()
# Expected delivery time is 5 business days
expected_days = 5
actual_days = np.busday_count(po_created.date(), goods_received.date())
on_time = 1 if actual_days <= expected_days else 0
# Check for quality issues
has_quality_issue = 'Quality Issue' in group['ActivityName'].values
has_return = 'Return to Supplier' in group['ActivityName'].values
quality_score = 100
if has_quality_issue:
quality_score -= 30
if has_return:
quality_score -= 40
return pd.Series({
'OnTimeDelivery': on_time,
'QualityScore': quality_score
})
# Calculate metrics for each case
supplier_metrics = event_table.groupby('CaseId').apply(calculate_supplier_metrics)
# Aggregate by supplier
supplier_performance = case_table.merge(supplier_metrics, left_on='CaseId', right_index=True)
supplier_summary = supplier_performance.groupby('SupplierID').agg({
'OnTimeDelivery': 'mean',
'QualityScore': 'mean'
}).reset_index()
supplier_summary.columns = ['SupplierID', 'OnTimeDeliveryRate', 'AvgQualityScore']
# Add back to case table
case_table = case_table.merge(
supplier_summary[['SupplierID', 'OnTimeDeliveryRate', 'AvgQualityScore']],
on='SupplierID',
how='left'
)
case_table['OnTimeDeliveryRate'] = case_table['OnTimeDeliveryRate'] * 100
case_table.rename(columns={'AvgQualityScore': 'QualityScore'}, inplace=True)
```
- Python Image: LOCAL
**Output:**
Creates supplier performance metrics at the case level:
- "On-Time Delivery Rate %": Percentage of orders delivered on time by this supplier
- "Supplier Quality Score": Quality score from 0-100 based on quality issues and returns
**Insights:** These metrics enable procurement teams to evaluate supplier performance objectively, support vendor selection decisions, and identify suppliers requiring performance improvement interventions.
### Example 4: Text Mining on Process Comments
**Scenario:** In an IT service management process, analyze ticket comments to categorize issues and detect sentiment.
**Settings:**
- Filter: None
- Columns: TicketDescription, ResolutionNotes
- Change Columns: None
- New Columns:
- Column Name: IssueCategory
- Display Name: Issue Category
- Data Type: String
- Source Type: Case
- Column Name: CustomerSentiment
- Display Name: Customer Sentiment
- Data Type: String
- Source Type: Case
- Python Code:
```python
import re
# Define keywords for categorization
category_keywords = {
'Hardware': ['laptop', 'desktop', 'printer', 'mouse', 'keyboard', 'monitor', 'hardware'],
'Software': ['application', 'software', 'program', 'install', 'update', 'crash', 'error'],
'Network': ['network', 'internet', 'wifi', 'connection', 'vpn', 'firewall'],
'Access': ['password', 'login', 'access', 'permission', 'authentication', 'account'],
'Other': []
}
# Sentiment indicators
negative_words = ['slow', 'broken', 'failed', 'cannot', 'unable', 'frustrated', 'urgent', 'critical']
positive_words = ['resolved', 'working', 'fixed', 'thank', 'great', 'excellent', 'happy']
def categorize_issue(text):
if pd.isna(text):
return 'Other'
text_lower = text.lower()
for category, keywords in category_keywords.items():
if any(keyword in text_lower for keyword in keywords):
return category
return 'Other'
def analyze_sentiment(text):
if pd.isna(text):
return 'Neutral'
text_lower = text.lower()
negative_count = sum(1 for word in negative_words if word in text_lower)
positive_count = sum(1 for word in positive_words if word in text_lower)
if negative_count > positive_count:
return 'Negative'
elif positive_count > negative_count:
return 'Positive'
else:
return 'Neutral'
# Apply text analysis
case_table['IssueCategory'] = case_table['TicketDescription'].apply(categorize_issue)
case_table['CustomerSentiment'] = case_table['TicketDescription'].apply(analyze_sentiment)
```
- Python Image: LOCAL
**Output:**
Creates two text-derived attributes:
- "Issue Category": Categorization of the IT issue (Hardware, Software, Network, Access, Other)
- "Customer Sentiment": Sentiment analysis result (Positive, Negative, Neutral)
**Insights:** This enrichment enables IT service managers to understand issue distribution, prioritize based on customer sentiment, and identify areas requiring additional support resources or training.
### Example 5: Financial Compliance Risk Scoring
**Scenario:** In a financial transaction approval process, calculate a compliance risk score based on multiple risk factors.
**Settings:**
- Filter: TransactionType = "Wire Transfer"
- Columns: TransactionAmount, CustomerCountry, AccountAge, PreviousFlags
- Change Columns: None
- New Columns:
- Column Name: ComplianceRiskScore
- Display Name: Compliance Risk Score
- Data Type: Integer
- Source Type: Case
- Column Name: RiskLevel
- Display Name: Risk Level
- Data Type: String
- Source Type: Case
- Python Code:
```python
# Define risk factors and weights
high_risk_countries = ['Country1', 'Country2', 'Country3'] # Placeholder for actual list
suspicious_amount_threshold = 10000
rapid_transaction_threshold = 5 # transactions per day
def calculate_risk_score(row):
risk_score = 0
# Amount risk (0-30 points)
if row['TransactionAmount'] > suspicious_amount_threshold:
risk_score += min(30, int(row['TransactionAmount'] / suspicious_amount_threshold * 10))
# Geographic risk (0-25 points)
if row['CustomerCountry'] in high_risk_countries:
risk_score += 25
# Account age risk (0-20 points)
if pd.notna(row['AccountAge']) and row['AccountAge'] < 30:
risk_score += 20 - int(row['AccountAge'] / 30 * 20)
# Previous flags risk (0-25 points)
if pd.notna(row['PreviousFlags']) and row['PreviousFlags'] > 0:
risk_score += min(25, row['PreviousFlags'] * 5)
return risk_score
# Calculate transaction velocity
transaction_counts = event_table[event_table['ActivityName'] == 'Transaction Initiated'].groupby('CaseId').size()
case_table['TransactionVelocity'] = case_table['CaseId'].map(transaction_counts).fillna(0)
# Calculate risk scores
case_table['ComplianceRiskScore'] = case_table.apply(calculate_risk_score, axis=1)
# Assign risk levels
def assign_risk_level(score):
if score >= 70:
return 'High'
elif score >= 40:
return 'Medium'
else:
return 'Low'
case_table['RiskLevel'] = case_table['ComplianceRiskScore'].apply(assign_risk_level)
# Clean up temporary columns
case_table = case_table.drop(['TransactionVelocity'], axis=1)
```
- Python Image: LOCAL
**Output:**
Creates comprehensive risk assessment attributes:
- "Compliance Risk Score": Numerical risk score from 0-100
- "Risk Level": Categorical risk classification (High, Medium, Low)
**Insights:** This risk scoring enables compliance teams to prioritize transaction reviews, automate approval workflows based on risk levels, and ensure regulatory compliance while minimizing false positives.
## Output
The Python enrichment operator produces new or modified attributes based on your custom code:
**New Case Attributes:** Any columns added to the `case_table` DataFrame that match the defined New Columns will be created as case-level attributes in your dataset. These attributes are available immediately for use in filters, calculators, and other enrichments.
**New Event Attributes:** Any columns added to the `event_table` DataFrame that match the defined New Columns will be created as event-level attributes. These can capture event-specific calculations or classifications.
**Modified Attributes:** Existing columns specified in Change Columns can have their values updated. The original data type must be maintained, but values can be transformed according to your business logic.
**Data Type Handling:** The operator automatically handles type conversion between Python and mindzieStudio data types:
- Python strings → mindzieStudio String
- Python int32/int64 → mindzieStudio Integer
- Python float → mindzieStudio Double
- Python datetime → mindzieStudio DateTime
- Python bool → mindzieStudio Boolean
**Case and Event Removal:** Advanced usage allows removing cases or events by filtering them out of the respective DataFrames. Cases not present in the output `case_table` will be removed from the dataset.
The enriched attributes integrate seamlessly with all other mindzieStudio features, enabling you to leverage custom Python transformations throughout your process mining analysis workflow.
## See Also
- [AI Case Prediction](../ai-case-prediction/) - Use machine learning models for prediction
- [Attribute Calculator](../../calculators/attribute/) - Create simple derived attributes without code
- [Filter Cases](../../filters/case/) - Filter data before processing
- [Representative Case Attribute](../representative-case-attribute/) - Extract representative values from events
---
*This documentation is part of the mindzie Studio process mining platform.*
---
## Remove Activities
Section: Enrichments
URL: https://docs.mindziestudio.com/mindzie_studio/enrichments/remove-activities
Source: /docs-master/mindzieStudio/enrichments/remove-activities/page.md
# Remove Activities
## Overview
The Remove Activities enrichment allows you to permanently remove specific activities from your event log, effectively filtering them out from all cases where they occur. This powerful data cleanup tool physically removes the selected activities and their associated event records from the dataset, reducing the log size and simplifying process analysis by eliminating noise, test data, or irrelevant steps.
Unlike filter-based approaches that temporarily hide data, this enrichment permanently removes the selected activities from the log, recalculating all case statistics and metrics based on the remaining events. This is particularly valuable when you need to focus your analysis on core process steps, eliminate system-generated activities that add no analytical value, or clean up logs containing test activities or data quality issues.
When activities are removed, all events corresponding to those activities are deleted from their cases. If a case consists entirely of removed activities, the case itself remains in the log but will have zero events. The enrichment automatically regenerates the case view after removal to ensure all statistics, paths, and visualizations reflect the cleaned dataset.
## Common Uses
- Remove system-generated activities that clutter process views (logging, auditing, notifications)
- Eliminate test activities from production event logs
- Clean up data quality issues by removing activities with incorrect or missing data
- Simplify process models by removing low-value administrative steps
- Focus analysis on core business activities by removing technical or support activities
- Remove automated system activities to analyze only human-performed tasks
- Eliminate deprecated activities that are no longer relevant to current process analysis
- Prepare event logs for specific analyses by removing activities outside the scope of investigation
## Settings
**Activities To Remove:** Select one or more activities from your event log that you want to permanently remove. The dropdown displays all unique activities present in your current dataset, allowing you to select multiple activities for removal in a single operation. Once applied, all events with these activity names will be deleted from the log, and the case view will be regenerated to reflect the changes.
You can select as many activities as needed. Common scenarios include selecting all test-related activities (like "Test Order", "Test Payment"), all system notifications (like "Email Sent", "Log Entry Created"), or specific activities you've identified as irrelevant to your analysis goals.
**Important:** This operation cannot be undone within the enrichment. If you need to restore removed activities, you must reload your original dataset or remove this enrichment from your enrichment chain. Consider testing the removal with a small selection first, or using filters to preview the impact before permanently removing activities.
## Examples
### Example 1: Removing System Notifications from Order Processing
**Scenario:** An e-commerce company's order processing log contains numerous system-generated notification activities (email notifications, SMS alerts, logging entries) that make the process model overly complex and distract from the core business process. The analyst wants to focus only on the actual order fulfillment steps.
**Settings:**
- Activities To Remove:
- "Email Notification Sent"
- "SMS Alert Sent"
- "System Log Entry Created"
- "Audit Record Generated"
- "Status Change Notification"
**Output:**
All events corresponding to the five selected activities are permanently removed from the log. A case that originally had 15 events (10 business activities + 5 notification activities) now has 10 events. The process model becomes simpler and more readable, showing only the actual business process flow without notification clutter.
Before removal:
- Total Events: 125,450
- Unique Activities: 28
- Average Events per Case: 15.2
After removal:
- Total Events: 83,200
- Unique Activities: 23
- Average Events per Case: 10.1
**Insights:** By removing notification activities, the company can now clearly see the core order processing flow, making it easier to identify bottlenecks and inefficiencies in the actual fulfillment process. The process discovery algorithms produce cleaner, more interpretable models focused on value-adding activities.
### Example 2: Cleaning Test Data from Production Logs
**Scenario:** A software development team's production deployment includes some test transactions that were accidentally executed in the live environment. These test activities need to be removed to ensure accurate process analytics and reporting.
**Settings:**
- Activities To Remove:
- "TEST: Create Order"
- "TEST: Process Payment"
- "TEST: Generate Invoice"
- "Test Data Entry"
- "Quality Test Run"
**Output:**
All test-related activities are removed from the log. Cases that were entirely composed of test activities now have zero events but remain in the dataset (they can be subsequently removed using a filter). Mixed cases that contained both production and test activities now show only their legitimate production events.
**Insights:** The cleaned log now represents only genuine production transactions, ensuring that performance metrics, compliance reports, and process analytics reflect actual business operations rather than being skewed by test data.
### Example 3: Simplifying IT Service Management Processes
**Scenario:** An IT service desk's incident management process includes many automated system activities (auto-assignments, auto-categorizations, auto-escalations) that the team wants to remove to focus analysis on human decision-making and manual interventions.
**Settings:**
- Activities To Remove:
- "Auto-Assign to Queue"
- "Auto-Categorize Incident"
- "Auto-Calculate Priority"
- "Auto-Update Status"
- "Auto-Send SLA Warning"
- "System Auto-Escalation"
**Output:**
The enrichment removes all automated system activities, leaving only the human-performed activities like "Analyst Review", "Assign to Technician", "Resolve Incident", and "Close Ticket". This reveals the actual human workflow and decision points without the noise of automated system actions.
**Insights:** By focusing only on human activities, the IT team can better understand where manual effort is required, identify opportunities for further automation, and measure the true time analysts spend on incident resolution rather than including system processing time.
### Example 4: Healthcare Patient Journey Analysis
**Scenario:** A hospital's patient flow analysis includes numerous administrative and billing activities that are not relevant to understanding the clinical care pathway. The quality improvement team wants to analyze only clinical activities.
**Settings:**
- Activities To Remove:
- "Insurance Verification"
- "Generate Bill"
- "Update Billing System"
- "Send Invoice"
- "Schedule Follow-up Billing"
- "Process Payment"
- "Update Patient Portal"
**Output:**
All financial and administrative activities are removed, leaving only clinical activities such as "Register Patient", "Initial Assessment", "Diagnostic Tests", "Treatment", "Medication Administration", and "Discharge Planning". The resulting process model focuses exclusively on the clinical care pathway.
**Insights:** The clinical team can now analyze patient care quality, treatment pathways, and clinical decision-making without the complexity of interleaved administrative processes. This enables clearer identification of clinical bottlenecks and opportunities to improve patient care delivery.
### Example 5: Manufacturing Process Core Flow Analysis
**Scenario:** A manufacturing plant's production log contains numerous quality check logging activities and status update activities that are automatically generated. The operations team wants to analyze only the core manufacturing steps.
**Settings:**
- Activities To Remove:
- "Log Temperature Reading"
- "Log Pressure Reading"
- "Auto-Update WIP Status"
- "Generate QC Report"
- "Update MES System"
- "Timestamp Production Event"
- "Log Operator ID"
**Output:**
The enrichment removes all logging and automated status update activities, leaving only the actual manufacturing operations like "Load Raw Material", "Heat Treatment", "Machining", "Assembly", "Final Inspection", and "Package Product".
**Insights:** The simplified log makes it easier to understand the actual production flow, calculate accurate cycle times for value-adding activities, and identify where actual production bottlenecks occur versus where data is simply being logged.
## Output
The Remove Activities enrichment modifies your event log by permanently deleting all events that match the selected activity names. The impact on your dataset includes:
**Removed Events:** All events with activity names matching your selection are deleted from their respective cases. These events are completely removed from the dataset and will not appear in any process visualizations, statistics, or analyses performed after this enrichment.
**Case Structure Changes:** Cases that contained removed activities will have fewer events. The case start time and end time may change if the first or last activity was removed. Case duration is recalculated based on the remaining events.
**Updated Statistics:** All log-level statistics are recalculated:
- Total event count decreases
- Unique activity count decreases (if removed activities are not duplicated elsewhere)
- Average events per case may change
- Activity frequency distributions are updated
- Process paths and variants are recalculated
**Case View Regeneration:** The enrichment automatically regenerates the entire case view after removal, ensuring that all derived metrics, process flows, and analytical calculations reflect the cleaned dataset.
**Empty Cases:** Cases that consisted entirely of removed activities will remain in the log but with zero events. These can be identified and removed using a subsequent filter enrichment if desired.
**No New Attributes Created:** Unlike other enrichments, this enrichment does not create any new attributes. It modifies the fundamental structure of the log by removing data.
**Irreversible Within Chain:** Once applied, the removed activities cannot be recovered without removing this enrichment from the enrichment chain or reloading the original dataset. The removal is permanent for all downstream enrichments and analyses.
**Impact on Downstream Enrichments:** Any enrichments applied after this one will only see the remaining activities. Enrichments that reference removed activities will not find them in the dataset.
The Remove Activities enrichment is a structural transformation of your event log, making it an essential tool for data preparation and cleaning before detailed process analysis. Use it early in your enrichment chain when you need to permanently exclude specific activities from all subsequent analysis.
## See Also
- **Filter Process Log** - Temporarily filter cases or events based on conditions (non-destructive alternative)
- **Undesired Activity** - Identify and flag unwanted activities without removing them
- **Hide Attribute** - Remove attributes from view without deleting underlying data
- **Allowed Case Start Activities** - Ensure cases start with approved activities
- **Allowed Case End Activities** - Ensure cases end with approved activities
---
*This documentation is part of the mindzie Studio process mining platform.*
---
## Remove Duplicate Events
Section: Enrichments
URL: https://docs.mindziestudio.com/mindzie_studio/enrichments/remove-duplicate-events
Source: /docs-master/mindzieStudio/enrichments/remove-duplicate-events/page.md
# Remove Duplicate Events
## Overview
The Remove Duplicate Events enrichment is a powerful data quality tool that automatically identifies and removes duplicate events from your process cases. When the same event appears multiple times within a case with identical attribute values (activity name, timestamp, and all other event attributes), this enrichment eliminates the redundant copies, keeping only the first occurrence.
This enrichment is particularly valuable when working with data from multiple source systems, data integration processes, or legacy systems where duplicate events may be inadvertently created. By removing these duplicates, you ensure that your process analysis reflects the actual process execution rather than data quality issues, leading to accurate cycle times, activity frequencies, and process flow visualizations.
Unlike other activity-related enrichments that modify or categorize events, this enrichment physically removes duplicate event records from your event log, permanently cleaning your dataset. The enrichment compares all event attributes from the original data source (not calculated or derived attributes) to determine if two events are truly identical.
## Common Uses
- Clean datasets imported from multiple source systems that may contain duplicate event records
- Remove redundant events created by data integration processes or ETL pipelines
- Eliminate duplicate activity recordings caused by system errors or data synchronization issues
- Improve data quality before performing process mining analysis to ensure accurate metrics
- Prepare datasets for conformance checking by removing noise from duplicate events
- Clean historical data that has accumulated duplicates over time due to legacy system issues
- Ensure accurate activity frequency counts and cycle time measurements by eliminating duplicate event noise
## Settings
This enrichment requires no configuration settings. It is a one-click operation that automatically scans all events within each case and removes any duplicates it finds.
The enrichment uses an intelligent comparison algorithm that:
- Compares all original source data attributes for each event (activity name, timestamp, case ID, and any other event-level attributes)
- Ignores calculated or derived attributes added by previous enrichments
- Keeps the first occurrence of each unique event
- Removes subsequent duplicate events that match all attribute values
To use this enrichment:
1. Navigate to 'Log Enrichment' from any analysis by clicking 'Log Enrichment' in the top right
2. Click 'Add New' to create a new enrichment
3. Select 'Remove Duplicate Events' from the Activities section
4. Click 'Create' - no additional configuration is needed
5. Click 'Calculate Enrichment' to process your dataset
## Examples
### Example 1: Multi-System Order Processing
**Scenario:** An e-commerce company imports order data from three different systems: the web storefront, the warehouse management system, and the accounting system. Due to data integration issues, some order events appear multiple times when the same order was recorded by multiple systems with identical timestamps and values.
**Settings:**
- No configuration required - the enrichment automatically detects and removes all duplicate events
**Output:**
Before enrichment, a sample case might contain these events:
- 2024-03-15 09:00:00 - Order Received - Order#12345 - Customer: ABC Corp - Amount: $1,500
- 2024-03-15 09:00:00 - Order Received - Order#12345 - Customer: ABC Corp - Amount: $1,500 (duplicate)
- 2024-03-15 10:30:00 - Payment Processed - Order#12345 - Amount: $1,500
- 2024-03-15 10:30:00 - Payment Processed - Order#12345 - Amount: $1,500 (duplicate)
- 2024-03-15 14:00:00 - Order Shipped - Order#12345
After enrichment, the duplicate events are removed:
- 2024-03-15 09:00:00 - Order Received - Order#12345 - Customer: ABC Corp - Amount: $1,500
- 2024-03-15 10:30:00 - Payment Processed - Order#12345 - Amount: $1,500
- 2024-03-15 14:00:00 - Order Shipped - Order#12345
**Insights:** The company can now accurately measure process performance. The cycle time from order to shipment is correctly calculated as 5 hours instead of being skewed by duplicate event records. Activity frequency counts now reflect actual process execution rather than data quality issues.
### Example 2: Healthcare Patient Journey
**Scenario:** A hospital consolidates patient data from their EHR system, radiology system, and pharmacy system. During migration from a legacy system, some patient events were duplicated, causing patient journey timelines to show the same procedure multiple times and inflating activity counts.
**Settings:**
- No configuration required
**Output:**
A patient case before enrichment:
- 2024-06-20 08:00:00 - Patient Admission - Patient ID: P9876 - Ward: Cardiology
- 2024-06-20 09:15:00 - Blood Test Ordered - Test Type: CBC
- 2024-06-20 09:15:00 - Blood Test Ordered - Test Type: CBC (duplicate from lab system)
- 2024-06-20 11:30:00 - ECG Performed - Result: Normal
- 2024-06-20 11:30:00 - ECG Performed - Result: Normal (duplicate from radiology system)
- 2024-06-20 15:00:00 - Medication Prescribed - Drug: Aspirin
- 2024-06-20 15:00:00 - Medication Prescribed - Drug: Aspirin (duplicate from pharmacy system)
- 2024-06-21 10:00:00 - Patient Discharge
After enrichment, duplicates are removed:
- 2024-06-20 08:00:00 - Patient Admission - Patient ID: P9876 - Ward: Cardiology
- 2024-06-20 09:15:00 - Blood Test Ordered - Test Type: CBC
- 2024-06-20 11:30:00 - ECG Performed - Result: Normal
- 2024-06-20 15:00:00 - Medication Prescribed - Drug: Aspirin
- 2024-06-21 10:00:00 - Patient Discharge
**Insights:** The hospital can now accurately track patient pathways and calculate true wait times between procedures. Resource utilization metrics reflect actual activity volumes rather than inflated numbers from duplicate records.
### Example 3: Manufacturing Production Line
**Scenario:** A manufacturing plant uses SCADA systems that occasionally log the same machine operation twice due to network synchronization issues. These duplicate events distort production analytics and make it appear that operations take longer than they actually do.
**Settings:**
- No configuration required
**Output:**
Production case before enrichment:
- 2024-05-10 06:00:00 - Material Loaded - Batch: B1234 - Machine: Press-01
- 2024-05-10 06:05:00 - Press Operation Start - Batch: B1234
- 2024-05-10 06:05:00 - Press Operation Start - Batch: B1234 (network duplicate)
- 2024-05-10 06:45:00 - Press Operation Complete - Batch: B1234
- 2024-05-10 06:45:00 - Press Operation Complete - Batch: B1234 (network duplicate)
- 2024-05-10 07:00:00 - Quality Inspection - Result: Pass
- 2024-05-10 07:15:00 - Material Unloaded - Batch: B1234
After enrichment:
- 2024-05-10 06:00:00 - Material Loaded - Batch: B1234 - Machine: Press-01
- 2024-05-10 06:05:00 - Press Operation Start - Batch: B1234
- 2024-05-10 06:45:00 - Press Operation Complete - Batch: B1234
- 2024-05-10 07:00:00 - Quality Inspection - Result: Pass
- 2024-05-10 07:15:00 - Material Unloaded - Batch: B1234
**Insights:** Production cycle time calculations are now accurate. The plant can reliably measure machine utilization and identify true bottlenecks without noise from duplicate event records.
### Example 4: Financial Transaction Processing
**Scenario:** A bank's transaction processing system occasionally creates duplicate log entries when transactions are processed through both the real-time system and the batch reconciliation system. These duplicates need to be removed before analyzing transaction patterns and compliance.
**Settings:**
- No configuration required
**Output:**
Transaction case before enrichment:
- 2024-07-15 14:30:00 - Transaction Initiated - Amount: $5,000 - Account: 12345
- 2024-07-15 14:30:05 - Fraud Check Performed - Risk Score: Low
- 2024-07-15 14:30:05 - Fraud Check Performed - Risk Score: Low (duplicate from reconciliation)
- 2024-07-15 14:30:10 - Authorization Approved - Auth Code: A789
- 2024-07-15 14:30:10 - Authorization Approved - Auth Code: A789 (duplicate from reconciliation)
- 2024-07-15 14:30:15 - Transaction Completed - Status: Success
After enrichment:
- 2024-07-15 14:30:00 - Transaction Initiated - Amount: $5,000 - Account: 12345
- 2024-07-15 14:30:05 - Fraud Check Performed - Risk Score: Low
- 2024-07-15 14:30:10 - Authorization Approved - Auth Code: A789
- 2024-07-15 14:30:15 - Transaction Completed - Status: Success
**Insights:** The bank can now accurately measure transaction processing times and identify true delays in their system. Compliance reporting shows actual activity counts rather than inflated numbers from duplicate records.
### Example 5: IT Service Management
**Scenario:** An IT service desk imports ticket data from multiple monitoring systems. When incidents are escalated between systems, the same status change events sometimes appear multiple times, making incident resolution times appear longer than they actually are.
**Settings:**
- No configuration required
**Output:**
Incident case before enrichment:
- 2024-08-22 10:00:00 - Incident Created - Ticket: INC0012345 - Priority: High
- 2024-08-22 10:15:00 - Assigned to L1 Support - Agent: John Smith
- 2024-08-22 10:30:00 - Escalated to L2 - Reason: Complex Issue
- 2024-08-22 10:30:00 - Escalated to L2 - Reason: Complex Issue (duplicate from escalation system)
- 2024-08-22 11:45:00 - Issue Resolved - Resolution: Network Config Fix
- 2024-08-22 11:45:00 - Issue Resolved - Resolution: Network Config Fix (duplicate from escalation system)
- 2024-08-22 12:00:00 - Incident Closed - Satisfaction: 5/5
After enrichment:
- 2024-08-22 10:00:00 - Incident Created - Ticket: INC0012345 - Priority: High
- 2024-08-22 10:15:00 - Assigned to L1 Support - Agent: John Smith
- 2024-08-22 10:30:00 - Escalated to L2 - Reason: Complex Issue
- 2024-08-22 11:45:00 - Issue Resolved - Resolution: Network Config Fix
- 2024-08-22 12:00:00 - Incident Closed - Satisfaction: 5/5
**Insights:** The IT department can now accurately measure mean time to resolution (MTTR) and identify true performance bottlenecks in their incident management process without duplicate events skewing the timeline analysis.
## Output
The Remove Duplicate Events enrichment modifies your event log by physically removing duplicate event records. Unlike enrichments that add new attributes to your dataset, this enrichment reduces the total number of events in your log.
**What Gets Removed:**
- Any event that has identical values for all original source data attributes (activity name, timestamp, case ID, and all other event attributes) compared to a previous event in the same case
- Only the duplicate occurrences are removed; the first occurrence of each unique event is always retained
**What Stays:**
- The first occurrence of each unique event
- Events that differ in any attribute value (even if timestamps or activity names match)
- All calculated attributes and enrichment results from previous enrichments
**Impact on Your Dataset:**
- **Event Count:** The total number of events in your log decreases based on how many duplicates are found
- **Case Count:** The number of cases remains unchanged
- **Activity Statistics:** Activity frequency counts become more accurate, reflecting actual process execution
- **Cycle Times:** Duration calculations between activities become more precise without duplicate events creating zero-duration intervals
- **Process Flow:** Process maps and variant analysis show cleaner, more accurate process flows
**Important Notes:**
- This enrichment permanently removes duplicate events from your working dataset. If you need to preserve the original data with duplicates, create a backup or use a dataset snapshot before applying this enrichment.
- The enrichment only compares original source data columns, not calculated or derived attributes added by previous enrichments
- Events are considered duplicates only if ALL original attribute values match exactly
- The enrichment processes events in chronological order, always keeping the first occurrence
**Using the Cleaned Data:**
After running this enrichment, you can:
- Perform accurate process discovery without noise from duplicate events
- Calculate reliable performance metrics and KPIs
- Conduct conformance checking on clean data
- Create accurate process visualizations and dashboards
- Combine with other enrichments knowing your baseline data is clean
## See Also
Related data quality enrichments:
- [Remove Repeated Activities](#) - Removes consecutive occurrences of the same activity (different from this enrichment, which removes exact duplicate events)
- [Sort Log on Start Time](#) - Ensures events are in correct chronological order before analysis
- [Hide Attribute](#) - Remove unnecessary attributes from your analysis view
- [Filter Process Log](#) - Remove specific cases or events based on criteria
- [Anonymize](#) - Remove or obscure sensitive information in event attributes
For more information on data quality best practices:
- Data Quality Best Practices - Guidelines for preparing clean process data
- Log Enrichment Overview - Understanding the enrichment workflow in mindzieStudio
---
*This documentation is part of the mindzie Studio process mining platform.*
---
## Remove Repeated Activities
Section: Enrichments
URL: https://docs.mindziestudio.com/mindzie_studio/enrichments/remove-repeated-activities
Source: /docs-master/mindzieStudio/enrichments/remove-repeated-activities/page.md
# Remove Repeated Activities
## Overview
The Remove Repeated Activities enrichment simplifies your process by consolidating consecutive duplicate activities into single occurrences while preserving important information about how many times each activity was repeated. This powerful data cleanup tool is essential for analyzing processes where the same activity may be executed multiple times in succession, either due to system behavior, user actions, or process design.
When activities repeat consecutively in a case, they can obscure the true process flow and make it difficult to identify meaningful patterns. This enrichment removes the noise by collapsing repeated activities while creating a count attribute that tracks how many times the activity occurred. You can also choose to preserve event-level attribute values from the repeated activities by concatenating them, ensuring no critical information is lost during the consolidation.
The enrichment offers two modes of operation: strict consecutive repetition (where activities must follow each other directly) or flexible repetition (where all instances of an activity are collapsed regardless of intervening activities). This flexibility allows you to tailor the enrichment to your specific process analysis needs.
## Common Uses
- Simplify process flows by removing stutter patterns caused by automated retry logic
- Clean up event logs where users repeatedly click buttons or refresh pages
- Consolidate polling or status-check activities that occur consecutively
- Reduce process complexity when analyzing high-frequency monitoring activities
- Prepare data for process discovery by eliminating repetitive noise
- Track how many times activities were repeated before progressing to the next step
- Preserve attribute values from repeated activities through concatenation for audit trails
## Settings
**Activity Name:** Select the activity you want to consolidate when it repeats consecutively. The enrichment will identify all instances where this activity occurs multiple times and collapse them into a single event. Choose activities that are known to repeat in your process, such as retry attempts, status checks, or user interactions.
**Count Column Name:** Specify the name of the new attribute that will store the count of how many times the activity was repeated. This attribute is automatically populated with the number of consecutive occurrences that were consolidated. The default naming pattern is "[Activity Name]_Count", but you can customize this to match your organization's naming conventions. For example, if you're removing repeated "Payment Retry" activities, you might name this "Payment_Retry_Attempts".
**Concatenate Attributes (Optional):** Select one or more event-level string attributes whose values you want to preserve from the repeated activities. When multiple instances are collapsed, the values from these attributes will be concatenated together with comma separation. This is particularly useful when each repetition contains different contextual information, such as error messages, timestamps, or user IDs. Only string-type event attributes that are not calculated and not hidden are available for concatenation.
**Must Follow Directly:** Control how the enrichment identifies repeated activities:
- **Enabled (default):** Only removes activities that occur consecutively without any intervening activities. For example, in the sequence "A, B, B, B, C", it would collapse the three consecutive B's into one. This is the most common and conservative approach.
- **Disabled:** Removes all instances of the selected activity throughout the case, keeping only the first occurrence regardless of whether other activities occur in between. For example, in the sequence "A, B, C, B, D, B", it would keep only the first B and remove the others. Use this mode with caution as it fundamentally changes the process flow.
## Examples
### Example 1: Payment Processing Retry Logic
**Scenario:** An e-commerce platform has automated retry logic for payment processing. When a payment fails due to network issues or temporary card authorization problems, the system automatically retries up to 5 times before giving up. These retry attempts clutter the process map and make it difficult to see the actual customer journey.
**Settings:**
- Activity Name: "Process Payment"
- Count Column Name: "Payment_Retry_Count"
- Concatenate Attributes: "Error_Message", "Gateway_Response"
- Must Follow Directly: Enabled
**Output:**
The enrichment consolidates consecutive payment processing attempts into a single "Process Payment" activity with additional context:
- New attribute: "Payment_Retry_Count" containing values like 1 (no retries), 2 (one retry), or 5 (four retries)
- Event attribute "Error_Message" contains all error messages concatenated: "Network timeout, Network timeout, Card declined"
- Event attribute "Gateway_Response" contains all responses: "503, 503, 402"
Sample case transformation:
- Before: Process Payment (failed) -> Process Payment (failed) -> Process Payment (failed) -> Process Payment (success)
- After: Process Payment (success) with Payment_Retry_Count = 4
**Insights:** The business can now analyze payment success rates more accurately by seeing how many retry attempts were needed. Cases with high retry counts may indicate integration issues with specific payment gateways or problems during peak traffic periods.
### Example 2: Customer Service Status Checks
**Scenario:** A customer service ticketing system has an automated process that checks ticket status every 5 minutes while waiting for customer response. These status checks create hundreds of events in long-running cases, making process analysis nearly impossible.
**Settings:**
- Activity Name: "Check Ticket Status"
- Count Column Name: "Status_Check_Count"
- Concatenate Attributes: (none selected)
- Must Follow Directly: Enabled
**Output:**
Consecutive status check activities are consolidated into single events. A case that had 50 status checks between "Send Email to Customer" and "Customer Response Received" now shows just one "Check Ticket Status" activity with Status_Check_Count = 50.
**Insights:** Analysts can now see the actual customer interaction flow without the noise of automated polling. The status check count reveals how long tickets typically wait for customer response, which can be correlated with ticket resolution times and customer satisfaction.
### Example 3: Manufacturing Quality Inspection Retests
**Scenario:** In a pharmaceutical manufacturing process, quality inspection failures trigger immediate retests up to 3 times before the batch is rejected. The company wants to track how many retests occur while maintaining clean process flows for analysis.
**Settings:**
- Activity Name: "Quality Inspection"
- Count Column Name: "Inspection_Attempts"
- Concatenate Attributes: "Inspector_ID", "Test_Results", "Failure_Reason"
- Must Follow Directly: Enabled
**Output:**
Multiple consecutive quality inspections are consolidated with complete audit information:
- Inspection_Attempts: Number of times the batch was inspected (1-4)
- Inspector_ID concatenated: "INSP_001, INSP_001, INSP_002" (shows if different inspectors were involved)
- Test_Results concatenated: "FAIL, FAIL, PASS" (shows the progression)
- Failure_Reason concatenated: "pH out of range, pH out of range, " (shows what was wrong)
**Insights:** The company can analyze first-pass yield rates (Inspection_Attempts = 1) versus rework rates (Inspection_Attempts > 1) while maintaining complete traceability of who inspected and why tests failed.
### Example 4: IT Support Ticket Reassignment
**Scenario:** An IT helpdesk has a problem with tickets being reassigned multiple times between support agents before resolution. Each reassignment creates a "Reassign Ticket" activity, making it hard to analyze the actual resolution steps.
**Settings:**
- Activity Name: "Reassign Ticket"
- Count Column Name: "Reassignment_Count"
- Concatenate Attributes: "Assigned_To", "Reassignment_Reason"
- Must Follow Directly: Enabled
**Output:**
Multiple consecutive reassignments are consolidated:
- Reassignment_Count: Total number of reassignments (indicates ticket bouncing)
- Assigned_To concatenated: "Agent_A, Agent_B, Agent_C, Agent_D" (shows the escalation path)
- Reassignment_Reason concatenated: "Wrong department, Requires senior agent, Requires system admin" (shows why)
**Insights:** High reassignment counts indicate poor initial ticket routing or unclear responsibility assignments. The concatenated agent names reveal common escalation patterns, helping optimize ticket distribution rules.
### Example 5: Document Approval Workflow Revisions
**Scenario:** A document management system allows reviewers to send documents back for revision multiple times. The organization wants to track revision cycles while keeping process maps focused on the overall approval workflow.
**Settings:**
- Activity Name: "Request Revisions"
- Count Column Name: "Revision_Cycles"
- Concatenate Attributes: "Reviewer_Comments"
- Must Follow Directly: Enabled
**Output:**
Consecutive revision requests are consolidated:
- Revision_Cycles: Number of times the document was sent back (quality indicator)
- Reviewer_Comments concatenated: "Fix formatting, Update references, Correct calculations" (complete feedback history)
**Insights:** Documents requiring many revision cycles may indicate unclear requirements or inadequate initial quality checks. The concatenated comments provide a complete audit trail of the review process while keeping the process map clean and analyzable.
## Output
The Remove Repeated Activities enrichment modifies your event log in two significant ways:
**Event Reduction:** Consecutive occurrences of the selected activity are consolidated into a single event. The enrichment keeps the first occurrence and hides all subsequent repetitions, reducing the total number of events in your dataset. This consolidation happens at the case level, so different cases may have different numbers of events removed depending on their repetition patterns.
**New Count Attribute:** A new event-level integer attribute is created with the name you specified in "Count Column Name". This attribute is populated on the consolidated event with the total number of occurrences that were collapsed together. For events that had no repetition, the value is 1. For consolidated events, the value indicates how many times the activity occurred consecutively (for example, 4 means the activity happened 4 times in a row).
**Concatenated Attribute Values:** If you selected attributes to concatenate, the values from all repeated events are combined into a single comma-separated string and stored in the consolidated event. This preserves important contextual information that might differ between repetitions, such as error messages, user IDs, or timestamps. The concatenation occurs in chronological order, so you can see the progression of values across repetitions.
**Process View Impact:** After applying this enrichment, your process maps and variants will show simplified flows without the repetitive loops caused by consecutive identical activities. Cases that previously showed loops like "A -> B -> B -> B -> C" will now display as "A -> B -> C", making it easier to identify the core process structure. However, you retain the ability to analyze repetition patterns using the count attribute in filters and calculators.
**Use Cases for the Count Attribute:** The new count attribute can be used in:
- Filters: "Show only cases where Payment_Retry_Count > 3" to find problematic payment processing
- Calculators: Average or sum the count across cases to measure overall retry rates
- Performance analysis: Correlate high counts with longer processing times
- Quality metrics: Track first-pass success rates by counting events where count = 1
- Visualizations: Create histograms showing the distribution of retry attempts
**Data Integrity:** The enrichment maintains full data integrity by preserving timestamp information (uses the timestamp of the first occurrence) and allowing concatenation of important attribute values. No data is permanently deleted; instead, repeated events are marked as hidden and can be revealed if needed by removing the enrichment.
---
*This documentation is part of the mindzie Studio process mining platform.*
---
## Repeated Activity
Section: Enrichments
URL: https://docs.mindziestudio.com/mindzie_studio/enrichments/repeated-activity
Source: /docs-master/mindzieStudio/enrichments/repeated-activity/page.md
# Repeated Activity
## Overview
The Repeated Activity enrichment detects when specific activities occur more than once within a single case, which often indicates a conformance issue in your process. Repeated activities can signal problems such as rework, process loops, duplicate approvals, or system errors that require investigation.
For example, if a purchase order is approved twice, or an invoice is sent multiple times to the same customer, this may indicate a breakdown in your process controls or a system malfunction that needs to be addressed.
## Common Uses
Use this enrichment to:
- Identify cases where critical activities are repeated, which may indicate process inefficiencies or control failures
- Monitor for duplicate approvals, repeated shipping events, or other activities that should only occur once per case
- Create conformance rules that flag cases for review when key activities are repeated
- Detect process loops or rework patterns that impact process efficiency
## Settings
Start by going to the 'Log Enrichment' engine by going to any analysis and clicking 'Log Enrichment' in the top right.
Then click 'Add New'
Then choose the enrichment block.
### Understanding Rule Groups
This enrichment uses a "Rule Group" concept that allows you to monitor multiple activities under a single configuration. When you create a rule group, the enrichment generates one boolean attribute for each activity you select, all prefixed with your group name. This makes it easy to organize and identify related conformance checks in your analysis.
For example, if you create a rule group called "Duplicate Operations" and select three activities (Ship, Invoice, Reject), the enrichment will create three new attributes:
- "Duplicate Operations Ship sales order line"
- "Duplicate Operations Send invoice line"
- "Duplicate Operations Reject sales order line"
### Configuration Options
- **Rule Group Name:** Specify the name of the group. This name will be used as a prefix for all the new attributes created by this enrichment. For each activity you select, the new attribute name will be: [Rule Group Name] [Activity Name]
- **Severity:** Select the severity level (Low, Medium, or High) for the conformance issue when a selected activity is repeated. This severity level affects how the issue is displayed in conformance dashboards and reports.
- **Activity Attribute Values:** Select one or more activities that should not be repeated within any case. A separate attribute will be created for each selected activity.

## Examples
Let's configure the enrichment to detect repeated activities in our sales order process. We want to identify cases where any of the following activities occur more than once:
- Ship sales order line
- Send invoice line
- Reject sales order line
We'll set the conformance severity to 'Low' since these repeated activities are process inefficiencies rather than critical failures, but they still warrant investigation.

Click 'Create' and once you're ready click 'Calculate Enrichment' to add the new attributes to your data set.

After the enrichment completes, you'll see the new conformance attributes in your dataset, one for each activity you selected.

## Output
When you run this enrichment, mindzieStudio creates one boolean attribute for each activity you selected in your rule group:
- **Attribute Names:** `[Rule Group Name] [Activity Name]`
- **Attribute Values:**
- `TRUE` - The activity was repeated in the case (conformance issue detected)
- `FALSE` - The activity occurred only once or not at all (no conformance issue)
- `NULL` - The activity did not occur in the case
### Using the Output
You can use these new conformance attributes to:
- **Filter Cases:** Show only cases where specific activities were repeated
- **Create Visualizations:** Display the frequency and patterns of repeated activities across your process
- **Generate Conformance Reports:** Identify which activities are most commonly repeated and in which cases
- **Trigger Alerts:** Set up notifications when critical activities are repeated in new cases
- **Combine with Other Enrichments:** Use alongside other conformance enrichments to build comprehensive process compliance monitoring
## See Also
Related conformance enrichments:
- [Allowed Case Start Activities](/mindzie_studio/enrichments/allowed-case-start-activities) - Detect cases that start with unexpected activities
- [Allowed Case End Activities](/mindzie_studio/enrichments/allowed-case-end-activities) - Detect cases that end with unexpected activities
- Mandatory Activity - Identify cases missing required activities
- Undesired Activity - Flag cases containing activities that shouldn't occur
- Wrong Activity Order - Detect when activities occur in the wrong sequence
For more information on building conformance strategies, see:
- Conformance Experiments - Overview of conformance analysis in mindzieStudio
---
## Replace Text
Section: Enrichments
URL: https://docs.mindziestudio.com/mindzie_studio/enrichments/replace-text
Source: /docs-master/mindzieStudio/enrichments/replace-text/page.md
# Replace Text
## Overview
The Replace Text enrichment is a powerful data transformation operator that performs find-and-replace operations on text attributes throughout your dataset. This enrichment enables systematic text substitution across case and event attributes, allowing you to standardize terminology, correct systematic errors, or transform data formats consistently. Whether you need to replace outdated product codes, standardize department names, or correct recurring typos in your process data, this enrichment provides a reliable and efficient solution for bulk text modifications.
Unlike manual find-and-replace operations that risk missing occurrences or introducing inconsistencies, this enrichment processes every instance of the specified text pattern across all selected attributes. The enrichment supports both case-sensitive and case-insensitive replacement modes, giving you precise control over how text matching occurs. This flexibility is essential when dealing with data from multiple sources where capitalization conventions may vary, such as when integrating data from different ERP systems or regional offices.
The Replace Text enrichment operates directly on your dataset's string attributes, modifying values in-place to maintain data relationships and integrity. This approach ensures that all downstream analyses, filters, and calculations automatically benefit from the standardized text values without requiring additional configuration or data mapping steps.
## Common Uses
- Standardize varying department or location names across different systems (e.g., replace "NY Office", "New York", "NYC" with a standard "New York Office")
- Update obsolete product codes or SKUs after system migrations or rebranding initiatives
- Correct systematic spelling errors or abbreviations in activity names for clearer process visualization
- Replace sensitive information with anonymized values for compliance with data privacy regulations
- Standardize date or time formats in text fields by replacing separators or formatting characters
- Transform status codes or abbreviations into readable business terms for better reporting
- Harmonize vendor or customer names that have multiple variations in the source data
## Settings
**Attribute Name:** Select the text attribute where you want to perform the replacement operation. The dropdown displays all available string attributes from both case-level and event-level data. Only text (string) type attributes that are not hidden or calculated fields are available for selection. Choose the specific attribute containing the text values you need to modify.
**Original Text:** Enter the exact text string you want to find and replace within the selected attribute. This is the search pattern that will be matched in your data. The text must match exactly (considering the Ignore Case setting) for replacement to occur. Leave this field empty if you want to replace empty strings with a specific value. Common examples include outdated codes, misspellings, or inconsistent terminology.
**New Text:** Specify the replacement text that will substitute all occurrences of the Original Text. This can be any text value, including an empty string if you want to remove the original text entirely. The new text will replace every matched occurrence within the attribute values. Consider the impact on downstream processes and ensure the new text maintains data integrity and meaning.
**Ignore Case:** Enable this option to perform case-insensitive matching when searching for the Original Text. When checked, the enrichment will match text regardless of uppercase or lowercase differences (e.g., "approved", "Approved", and "APPROVED" would all be matched). When unchecked, only exact case matches will be replaced. This setting is particularly useful when dealing with inconsistent capitalization from manual data entry or different source systems.
## Examples
### Example 1: Standardizing Department Names in Purchase Orders
**Scenario:** A multinational corporation needs to standardize department names in their purchase order system where "Information Technology", "IT Dept", "I.T.", and "InfoTech" all refer to the same department, causing fragmented spend analysis and approval routing issues.
**Settings:**
- Attribute Name: Department
- Original Text: IT Dept
- New Text: Information Technology
- Ignore Case: Checked
**Output:**
The enrichment replaces all occurrences of "IT Dept" (and variations like "it dept", "It Dept") with "Information Technology" in the Department attribute. After running multiple passes with different original text values ("I.T.", "InfoTech", etc.), all department references are standardized.
**Before:**
| Case ID | Department | Amount |
|---------|------------|--------|
| PO-001 | IT Dept | $5,000 |
| PO-002 | Information Technology | $3,000 |
| PO-003 | it dept | $2,500 |
| PO-004 | I.T. | $4,000 |
**After:**
| Case ID | Department | Amount |
|---------|------------|--------|
| PO-001 | Information Technology | $5,000 |
| PO-002 | Information Technology | $3,000 |
| PO-003 | Information Technology | $2,500 |
| PO-004 | Information Technology | $4,000 |
**Insights:** After standardization, the company discovered that Information Technology actually accounted for $14,500 in purchase orders rather than appearing as four separate departments with unclear spending patterns. This enabled proper budget tracking and revealed opportunities for volume discounts with vendors.
### Example 2: Updating Product Codes After System Migration
**Scenario:** A retail company migrated to a new inventory system with updated product coding standards, requiring all old format codes (e.g., "PROD-") to be replaced with new format codes (e.g., "SKU-") across historical order data for accurate inventory reconciliation.
**Settings:**
- Attribute Name: Product_Code
- Original Text: PROD-
- New Text: SKU-
- Ignore Case: Unchecked
**Output:**
All product codes beginning with "PROD-" are updated to begin with "SKU-", maintaining the numeric portions while updating the prefix to match the new system format.
**Before:**
| Case ID | Product_Code | Quantity | Order_Date |
|---------|--------------|----------|------------|
| ORD-501 | PROD-12345 | 10 | 2024-01-15 |
| ORD-502 | PROD-67890 | 5 | 2024-01-16 |
| ORD-503 | prod-12345 | 3 | 2024-01-16 |
| ORD-504 | PROD-54321 | 8 | 2024-01-17 |
**After:**
| Case ID | Product_Code | Quantity | Order_Date |
|---------|--------------|----------|------------|
| ORD-501 | SKU-12345 | 10 | 2024-01-15 |
| ORD-502 | SKU-67890 | 5 | 2024-01-16 |
| ORD-503 | prod-12345 | 3 | 2024-01-16 |
| ORD-504 | SKU-54321 | 8 | 2024-01-17 |
**Insights:** Note that "prod-12345" was not replaced because the search was case-sensitive. This helped identify 47 orders with incorrect lowercase product codes that required separate data quality investigation, revealing a specific data entry issue with one warehouse location.
### Example 3: Anonymizing Customer Names for Compliance
**Scenario:** A healthcare provider needs to anonymize patient names in their appointment scheduling process data for research purposes while maintaining the ability to distinguish between different patients.
**Settings:**
- Attribute Name: Patient_Name
- Original Text: Smith, John
- New Text: Patient_001
- Ignore Case: Unchecked
**Output:**
Specific patient names are replaced with anonymized identifiers, allowing process analysis while protecting patient privacy according to HIPAA requirements.
**Before:**
| Case ID | Patient_Name | Appointment_Type | Department |
|---------|--------------|------------------|------------|
| APT-101 | Smith, John | Initial Consultation | Cardiology |
| APT-102 | Jones, Mary | Follow-up | Orthopedics |
| APT-103 | Smith, John | Test Results | Cardiology |
| APT-104 | Brown, David | Emergency | Emergency |
**After (first replacement):**
| Case ID | Patient_Name | Appointment_Type | Department |
|---------|--------------|------------------|------------|
| APT-101 | Patient_001 | Initial Consultation | Cardiology |
| APT-102 | Jones, Mary | Follow-up | Orthopedics |
| APT-103 | Patient_001 | Test Results | Cardiology |
| APT-104 | Brown, David | Emergency | Emergency |
**Insights:** The anonymization process preserved the relationship between appointments for the same patient while removing personally identifiable information. Process mining revealed that patients with initial cardiology consultations had a 73% rate of follow-up appointments within 30 days.
### Example 4: Correcting Activity Name Typos in Manufacturing
**Scenario:** A manufacturing plant's MES system has inconsistent activity naming where operators sometimes type "Quaility Check" instead of "Quality Check", causing process conformance checking to incorrectly flag deviations.
**Settings:**
- Attribute Name: Activity
- Original Text: Quaility Check
- New Text: Quality Check
- Ignore Case: Checked
**Output:**
All misspelled instances of quality check activities are corrected, regardless of capitalization variations, ensuring accurate process discovery and conformance analysis.
**Event Data Before:**
| Case ID | Activity | Timestamp | Resource |
|---------|----------|-----------|----------|
| WO-801 | Material Receipt | 2024-02-01 08:00 | Warehouse |
| WO-801 | Quaility Check | 2024-02-01 09:15 | QC Team |
| WO-801 | Assembly Start | 2024-02-01 10:00 | Line 1 |
| WO-802 | Material Receipt | 2024-02-01 08:30 | Warehouse |
| WO-802 | QUAILITY CHECK | 2024-02-01 09:45 | QC Team |
**Event Data After:**
| Case ID | Activity | Timestamp | Resource |
|---------|----------|-----------|----------|
| WO-801 | Material Receipt | 2024-02-01 08:00 | Warehouse |
| WO-801 | Quality Check | 2024-02-01 09:15 | QC Team |
| WO-801 | Assembly Start | 2024-02-01 10:00 | Line 1 |
| WO-802 | Material Receipt | 2024-02-01 08:30 | Warehouse |
| WO-802 | Quality Check | 2024-02-01 09:45 | QC Team |
**Insights:** After correction, conformance checking showed that 98% of work orders properly followed the standard process with quality checks, rather than the 67% shown before the correction. This revealed that the perceived process compliance issue was actually a data quality problem.
### Example 5: Standardizing Status Codes Across Systems
**Scenario:** A logistics company integrates shipment data from three different carrier systems, each using different codes for delivery status ("DLVRD", "Delivered", "COMPLETE"), requiring standardization for unified tracking dashboards.
**Settings:**
- Attribute Name: Delivery_Status
- Original Text: DLVRD
- New Text: Delivered
- Ignore Case: Unchecked
**Output:**
Carrier-specific status codes are replaced with standardized business terms, enabling consistent status reporting across all shipment sources.
**Before:**
| Case ID | Carrier | Delivery_Status | Delivery_Date |
|---------|---------|-----------------|---------------|
| SHP-901 | CarrierA | DLVRD | 2024-03-01 |
| SHP-902 | CarrierB | Delivered | 2024-03-01 |
| SHP-903 | CarrierC | COMPLETE | 2024-03-01 |
| SHP-904 | CarrierA | DLVRD | 2024-03-02 |
**After (first replacement):**
| Case ID | Carrier | Delivery_Status | Delivery_Date |
|---------|---------|-----------------|---------------|
| SHP-901 | CarrierA | Delivered | 2024-03-01 |
| SHP-902 | CarrierB | Delivered | 2024-03-01 |
| SHP-903 | CarrierC | COMPLETE | 2024-03-01 |
| SHP-904 | CarrierA | Delivered | 2024-03-02 |
**Insights:** After running additional replacements for "COMPLETE" and other variations, the logistics team could accurately report that 94% of shipments were delivered on time, compared to fragmented reporting by carrier system that obscured overall performance metrics.
## Output
The Replace Text enrichment modifies the selected attribute values directly within your dataset, performing in-place replacement of the specified text patterns. The enrichment maintains the original attribute structure and data type while updating only the text content that matches your search criteria.
For case attributes, the replacement occurs once per case, affecting the attribute value associated with each case. For event attributes, the replacement processes every event in your dataset, potentially updating multiple occurrences within the same case. The enrichment preserves null values and only processes non-null string values within the selected attribute.
After execution, the modified attribute retains its original name and position in your dataset but contains the updated text values. These changes immediately affect all dependent calculations, filters, and visualizations that reference the modified attribute. The enrichment does not create new attributes or backup columns - it directly transforms the existing data based on your specifications.
The replacement operation is case-sensitive by default but can be configured for case-insensitive matching using the Ignore Case setting. When performing case-insensitive replacements, the original casing of non-matched portions of the text is preserved, while the matched portion is replaced entirely with the New Text value as specified.
## See Also
- **Trim Text** - Remove leading and trailing whitespace from text attributes
- **Text Start** - Extract a specified number of characters from the beginning of text values
- **Text End** - Extract a specified number of characters from the end of text values
- **Group Attribute Values** - Combine multiple attribute values into standardized categories
- **Categorize Attribute Values** - Create categories based on attribute value ranges or patterns
- **Concatenate Text Attributes** - Combine multiple text attributes into a single field
---
*This documentation is part of the mindzie Studio process mining platform.*
---
## Representative Case Attribute
Section: Enrichments
URL: https://docs.mindziestudio.com/mindzie_studio/enrichments/representative-case-attribute
Source: /docs-master/mindzieStudio/enrichments/representative-case-attribute/page.md
# Representative Case Attribute
## Overview
The Representative Case Attribute enrichment creates powerful case-level attributes by extracting and aggregating event attribute values from specific activities within each case. Unlike simple attribute extraction, this enrichment provides advanced aggregation options including sum, average, minimum, and maximum calculations, making it ideal for creating meaningful case-level metrics from event data.
This enrichment goes beyond basic first/last occurrence extraction by offering mathematical aggregations that reveal patterns and insights across multiple event occurrences. For example, you can calculate the total value of all invoice line items, find the average processing time across multiple approval steps, or identify the maximum discount percentage applied in any order modification. The enrichment also includes intelligent fallback options to handle cases where specific activities might not occur, ensuring robust data extraction even with process variations.
## Common Uses
- Calculate total invoice value by summing all line item amounts from "Create Invoice Line" activities
- Determine average approval time across multiple approval activities in procurement processes
- Find the maximum discount percentage applied across all "Apply Discount" activities in sales orders
- Identify the minimum stock level recorded during any "Check Inventory" activity
- Extract the first customer contact person from "Customer Inquiry" activities
- Capture the last quality inspector from "Quality Check" activities
- Sum total shipping costs from multiple "Calculate Shipping" activities in logistics processes
- Average customer satisfaction scores from multiple "Customer Feedback" touchpoints
## Settings
**Filter:** Optional filter to apply the enrichment only to specific cases. The enrichment will create attributes only for cases that match the filter criteria. Leave empty to apply to all cases in your dataset.
**New Attribute Name:** The name for the new case-level attribute that will be created. Choose a descriptive name that clearly indicates what the attribute represents, such as "Total Invoice Value", "Average Approval Time", or "Last Quality Inspector".
**Event Column Name:** Select the event attribute whose values you want to extract or aggregate. This could be numeric values for calculations (like amounts or durations), text values (like resource names or locations), or dates (like timestamps).
**Case Representative Activity Names:** Choose one or more activities from which to extract the attribute values. The enrichment will only consider events matching these activity names. For multiple activities, the aggregation will be performed across all matching events.
**Case Representative Event Selection:** Determines how to aggregate or select values when multiple matching events exist:
- **First:** Takes the value from the chronologically first matching event
- **Last:** Takes the value from the chronologically last matching event
- **Sum:** Adds up all values from matching events (numeric attributes only)
- **Average:** Calculates the mean of all values from matching events (numeric attributes only)
- **Min:** Finds the minimum value across all matching events
- **Max:** Finds the maximum value across all matching events
- **All:** Concatenates all values from matching events (creates a list)
**Select Latest Event If Specifics Are Null:** When enabled, if the specified activities don't contain the selected attribute (or the value is null), the enrichment will fall back to using the latest non-null value of that attribute from any activity in the case. This ensures you always get a value when possible, even if the specific activities don't have it.
## Examples
### Example 1: Total Invoice Value Calculation
**Scenario:** A procurement process has multiple "Add Invoice Line" activities, each with a "LineAmount" attribute. You need to calculate the total invoice value for each case.
**Settings:**
- Filter: (empty - apply to all cases)
- New Attribute Name: Total_Invoice_Value
- Event Column Name: LineAmount
- Case Representative Activity Names: Add Invoice Line
- Case Representative Event Selection: Sum
- Select Latest Event If Specifics Are Null: False
**Output:**
Creates a case attribute "Total_Invoice_Value" containing the sum of all LineAmount values from "Add Invoice Line" activities. For a case with three invoice lines of $500, $750, and $250, the Total_Invoice_Value would be $1,500.
**Insights:** This enables analysis of invoice distributions, identification of high-value transactions requiring additional approval, and tracking of average invoice sizes over time.
### Example 2: Average Approval Duration
**Scenario:** A loan approval process includes multiple approval stages ("Initial Approval", "Risk Approval", "Final Approval"), each with an "ApprovalDuration" attribute in hours. You want to know the average time spent in approvals.
**Settings:**
- Filter: (empty)
- New Attribute Name: Avg_Approval_Hours
- Event Column Name: ApprovalDuration
- Case Representative Activity Names: Initial Approval, Risk Approval, Final Approval
- Case Representative Event Selection: Average
- Select Latest Event If Specifics Are Null: False
**Output:**
Creates "Avg_Approval_Hours" with the average duration across all approval activities. If approvals took 2, 4, and 3 hours respectively, the average would be 3 hours.
**Insights:** Identifies bottlenecks in the approval process, helps set realistic SLAs, and highlights cases with unusually long or short approval times.
### Example 3: Maximum Discount Applied
**Scenario:** In a sales process, multiple discount activities can occur ("Manager Discount", "Seasonal Discount", "Volume Discount"), each with a "DiscountPercent" attribute. You need to track the highest discount given.
**Settings:**
- Filter: Process = "B2B Sales"
- New Attribute Name: Max_Discount_Percent
- Event Column Name: DiscountPercent
- Case Representative Activity Names: Manager Discount, Seasonal Discount, Volume Discount
- Case Representative Event Selection: Max
- Select Latest Event If Specifics Are Null: False
**Output:**
Creates "Max_Discount_Percent" showing the highest discount percentage applied in each case. If discounts of 5%, 10%, and 7% were applied, the maximum would be 10%.
**Insights:** Helps monitor discount policies, identify cases with excessive discounts, and analyze the impact of discounting on profit margins.
### Example 4: Last Responsible Warehouse with Fallback
**Scenario:** In a logistics process, items move through multiple warehouses. You want to identify the last warehouse that handled each shipment, but some activities might not have warehouse data.
**Settings:**
- Filter: (empty)
- New Attribute Name: Final_Warehouse
- Event Column Name: WarehouseLocation
- Case Representative Activity Names: Ship Item, Transfer Item, Store Item
- Case Representative Event Selection: Last
- Select Latest Event If Specifics Are Null: True
**Output:**
Creates "Final_Warehouse" with the warehouse location from the last shipping/transfer/storage activity. If these specific activities don't have warehouse data, it falls back to the latest warehouse location from any activity in the case.
**Insights:** Enables tracking of final delivery points, analysis of warehouse utilization, and identification of shipping patterns.
### Example 5: Minimum Stock Level During Order Processing
**Scenario:** An inventory management process checks stock levels at multiple points. You need to identify the lowest stock level encountered during order fulfillment to understand near-stockout situations.
**Settings:**
- Filter: Order_Type = "Rush Order"
- New Attribute Name: Min_Stock_Level
- Event Column Name: CurrentStockLevel
- Case Representative Activity Names: Check Stock, Reserve Inventory, Update Stock
- Case Representative Event Selection: Min
- Select Latest Event If Specifics Are Null: False
**Output:**
Creates "Min_Stock_Level" showing the lowest stock level recorded during the order process. If stock checks showed 50, 25, and 30 units, the minimum would be 25.
**Insights:** Identifies orders at risk of stockout, helps optimize reorder points, and reveals patterns in inventory consumption.
## Output
The Representative Case Attribute enrichment creates a single new case-level attribute with the name specified in the configuration. The data type of the new attribute matches the source event attribute, and the values are determined by the selected aggregation method.
**Attribute Properties:**
- **Location:** Case table (accessible in case attribute lists and filters)
- **Data Type:** Matches the source event attribute (numeric, text, date, boolean)
- **Derivation:** Marked as a derived attribute for lineage tracking
- **Display Format:** Inherits formatting from the source event attribute
**Value Assignment Rules:**
- Cases with matching activities receive values based on the aggregation selection
- Cases without matching activities receive null values (unless fallback is enabled)
- When fallback is enabled, null values are replaced with the latest non-null value from any activity
- Aggregations requiring numeric data (Sum, Average) only work with numeric event attributes
- The "All" selection creates concatenated lists of values
**Integration Points:**
- New attribute immediately available in case filters and calculators
- Can be used in subsequent enrichments as input
- Appears in data exports and API responses
- Available for visualization in charts and dashboards
- Can be combined with other case attributes in calculated fields
---
*This documentation is part of the mindzie Studio process mining platform.*
---
## Representative Case Attribute 2
Section: Enrichments
URL: https://docs.mindziestudio.com/mindzie_studio/enrichments/representative-case-attribute-2
Source: /docs-master/mindzieStudio/enrichments/representative-case-attribute-2/page.md
# Representative Case Attribute
## Overview
This enrichment creates a case-level attribute by extracting the value of an event attribute from a specific activity occurrence within the case. You can choose to extract from either the first or last occurrence of the selected activity.
For example, you can create a case attribute that identifies which resource performed the last "Pay Invoice" activity, which customer initiated the first "Create Order" activity, or which warehouse location processed the final "Ship Order" activity in each case.
## Common Uses
Use this enrichment to:
- Define who was the last resource to pay the invoice, useful for tracking payment processors
- Identify the customer who placed the order from the "Create Order" activity
- Capture the approval manager from the first approval activity in the case
- Determine the warehouse location from the last shipping activity
- Extract any event-level attribute value to create a meaningful case-level summary
## Settings
Start by going to the 'Log Enrichment' engine by going to any analysis and clicking 'Log Enrichment' in the top right.

Then click 'Add New'

Then choose the enrichment block.
### Configuration Options
- **Filter:** Add any filter you like. The enrichment will define attributes only for cases that are selected by the filter. Leave empty to apply to all cases.
- **New Attribute Name:** Specify the name of the new case attribute you are about to create. This will appear in your case attributes list after the enrichment runs.
- **Event Column Name:** Select the event attribute that you want to extract and promote to a case attribute. For instance, select 'Resource' to define a representative Resource for the case, or select 'Customer' to identify which customer is associated with the case.
- **Case Representative Activity Names:** Select the activity (or activities) from which to use the attribute value. For instance, select 'Pay Invoice' if you would like to identify the Resource who paid the invoice. You can select multiple activities if the attribute could come from any of several activities.
- **Case Representative Event Selection:** Specify whether to use the attribute from the 'First' or 'Last' occurrence of the selected activity in the case:
- **First:** Uses the attribute value from the first occurrence of the selected activity. Use this when you want to capture who or what started a process step.
- **Last:** Uses the attribute value from the last occurrence of the selected activity. Use this when you want to capture who or what completed the final iteration of a potentially repeated step.
### Example 1
To define who was the last resource to pay the invoice, use the following settings:
- **New Attribute Name:** Last Resource to Pay Invoice
- **Event Column Name:** Resource
- **Case Representative Activity Names:** Pay Invoice
- **Case Representative Event Selection:** Last

Click 'Create' and once you're ready click 'Calculate Enrichment' to add the new attribute to your data set.

## Output
When this enrichment is executed, it creates a new case attribute with the name you specified in "New Attribute Name". The attribute value will be extracted from the specified event attribute at the selected activity occurrence.
### Output Attributes
- **Attribute Name:** The name you specified in the configuration (e.g., "Last Resource to Pay Invoice")
- **Attribute Type:** Case attribute (appears in the case attributes list)
- **Attribute Values:** The values are copied from the selected event attribute at the specified activity occurrence
### Example Output
Using the example configuration above:
- Event Column Name: Resource
- Case Representative Activity Names: Pay Invoice
- Case Representative Event Selection: Last
The enrichment creates a case attribute called "Last Resource to Pay Invoice" that contains the name of the resource who performed the last "Pay Invoice" activity in each case.
**Special Cases:**
- If a case does not contain any of the selected activities, the new attribute will be blank (null) for that case.
- If multiple activities are selected and a case contains more than one of them, the enrichment uses the first/last occurrence across all selected activities based on the Case Representative Event Selection setting.
### Using the Output
You can use this new case attribute to:
- **Filter Cases:** Show only cases handled by specific resources or customers
- **Create Visualizations:** Display which resources process the most invoices, which customers generate the most orders, etc.
- **Perform Analysis:** Calculate performance metrics by resource, customer, or other extracted attributes
- **Build Dashboards:** Show case distributions across the extracted dimension
- **Export Data:** Include the representative attribute in exports for external analysis
## See Also
Related enrichments:
- [Calculated Attributes](/mindzie_studio/enrichments/calculated-attributes) - Create custom calculations and transformations on attributes
- [Attribute Enrichments](/mindzie_studio/enrichments/attribute-enrichments) - Overview of different attribute enrichment types
- [Duration Between Two Activities](/mindzie_studio/enrichments/duration-between-two-activities) - Calculate time between activities in a case
Related topics:
- Case Attributes - Understanding case-level attributes in mindzieStudio
- Event Log Structure - How events and cases are organized in process mining
- Data Enrichment Strategy - Best practices for enriching your process data
---
## Set Group Value
Section: Enrichments
URL: https://docs.mindziestudio.com/mindzie_studio/enrichments/set-group-value
Source: /docs-master/mindzieStudio/enrichments/set-group-value/page.md
# Set Group Value
## Overview
The Set Group Value enrichment creates powerful data aggregations by calculating summary statistics for groups of cases and assigning those calculated values back to each case in the group. This enrichment transforms your process data by computing aggregate metrics like sums, averages, counts, or other statistical functions across cases that share common attribute values, then populates a new attribute with the group's aggregate value for every case in that group. This enables sophisticated group-based analysis where each case carries information about its peer group's collective characteristics.
This enrichment is essential for comparative analysis and benchmarking in process mining. It allows you to enrich individual cases with contextual information about their group's overall performance, enabling insights like "this order's value compared to the average for its product category" or "this patient's treatment duration relative to others with the same diagnosis." By bringing group-level metrics to the case level, you can identify outliers, establish baselines, and understand how individual process instances relate to their peer groups. The enrichment supports various aggregation functions and can work with filtered subsets of data, providing flexibility in defining what constitutes a meaningful group for analysis.
## Common Uses
- Calculate average processing time per department and assign it to all cases in each department
- Determine total order value by customer and populate each order with the customer's total spend
- Count the number of cases per vendor and add this count to each case for vendor volume analysis
- Find the maximum or minimum values within product categories for pricing analysis
- Compute median treatment duration by diagnosis group for healthcare benchmarking
- Calculate sum of quantities per warehouse location for inventory distribution insights
- Determine average approval time by region for geographic performance comparison
## Settings
**Filter (Optional):** Apply filters to limit which cases are included in the group calculations. Only cases matching the filter criteria will be considered when computing aggregate values. This allows you to calculate group statistics on specific subsets, such as completed cases only, high-priority items, or transactions within a certain time period. Cases excluded by the filter will not receive the new attribute value.
**New Attribute Name:** Specify the name for the new case attribute that will store the calculated group value. Choose a descriptive name that indicates both the grouping logic and the aggregate function applied. For example, "Avg_Duration_By_Department" or "Total_Orders_Per_Customer". The name must be unique and cannot conflict with existing attributes in your dataset.
**Group by column name:** Select the attribute used to define groups. Cases with the same value in this attribute will be grouped together for the aggregate calculation. This can be any categorical attribute like department, vendor, product category, customer ID, or region. The grouping attribute determines how your data is segmented for the aggregation. Each unique value in this column creates a separate group.
**Value column name:** Choose the attribute whose values will be aggregated within each group. This is the source data for your calculation - for example, if calculating average duration by department, this would be your duration attribute. The available aggregation functions will adjust based on the data type of this column. Numeric columns support mathematical operations, while text and date columns have limited aggregation options.
**Aggregate Function:** Select the statistical function to apply to the values within each group. The available functions depend on the data type of your value column:
- **Sum:** Total all values in the group (numeric and duration attributes only)
- **Average:** Calculate the arithmetic mean of group values (numeric and duration attributes)
- **Median:** Find the middle value when group values are sorted (numeric and duration attributes)
- **Min:** Identify the smallest value in the group (works with numbers, dates, and durations)
- **Max:** Identify the largest value in the group (works with numbers, dates, and durations)
- **Count:** Count non-null values in the group (all data types)
- **Distinct Count:** Count unique values in the group (all data types)
- **Null Count:** Count missing/null values in the group (all data types)
## Examples
### Example 1: Average Processing Time by Department
**Scenario:** In a loan approval process, management wants to understand the average processing time for each department to identify performance variations and set realistic SLA targets.
**Settings:**
- Filter: Status = "Completed"
- New Attribute Name: Avg_Processing_Hours_By_Dept
- Group by column name: Department
- Value column name: Total_Processing_Hours
- Aggregate Function: Average
**Output:**
For each loan application, adds "Avg_Processing_Hours_By_Dept" containing the average processing time for all completed loans in that department:
- Commercial Banking department average: 72.5 hours (assigned to all 150 cases)
- Retail Banking department average: 24.3 hours (assigned to all 890 cases)
- Private Banking department average: 48.7 hours (assigned to all 75 cases)
Now each case shows both its individual processing time and its department's average, enabling immediate comparison.
**Insights:** Loan officers can quickly identify if a particular application is taking longer than the department average, and management can see that Commercial Banking has the longest average processing time, suggesting a need for process optimization or additional resources.
### Example 2: Total Customer Order Value
**Scenario:** An e-commerce company needs to identify high-value customers by calculating each customer's total order value across all their purchases and adding this information to each order.
**Settings:**
- Filter: Order_Status NOT IN ("Cancelled", "Returned")
- New Attribute Name: Customer_Total_Spend
- Group by column name: Customer_ID
- Value column name: Order_Amount
- Aggregate Function: Sum
**Output:**
Each order now includes the customer's total historical spend:
- Customer_ID "C10234": Total spend $15,750 (assigned to all 23 orders)
- Customer_ID "C10891": Total spend $3,200 (assigned to all 8 orders)
- Customer_ID "C11567": Total spend $45,900 (assigned to all 67 orders)
**Insights:** Sales teams can immediately see when processing an order from a high-value customer, enabling prioritized service. Marketing can identify VIP customers for special promotions based on total spend thresholds.
### Example 3: Case Count by Vendor for Workload Analysis
**Scenario:** A procurement department wants to understand vendor workload distribution by counting how many purchase orders each vendor handles, adding this count to every PO for context.
**Settings:**
- Filter: PO_Date >= "2024-01-01"
- New Attribute Name: Vendor_PO_Count
- Group by column name: Vendor_Name
- Value column name: Case_ID
- Aggregate Function: Count
**Output:**
Every purchase order shows how many total POs that vendor has received:
- Vendor "TechSupplies Inc": 145 POs (count added to each of their POs)
- Vendor "Office Essentials": 892 POs (count added to each of their POs)
- Vendor "Industrial Parts Co": 43 POs (count added to each of their POs)
**Insights:** Procurement can identify over-reliance on specific vendors (Office Essentials handling 892 POs suggests high dependency) and underutilized vendors who might handle more volume.
### Example 4: Maximum Treatment Cost by Diagnosis
**Scenario:** A hospital wants to identify the highest treatment cost within each diagnosis group to understand cost variations and identify expensive outlier cases.
**Settings:**
- Filter: Treatment_Complete = "Yes" AND Billing_Finalized = "Yes"
- New Attribute Name: Max_Cost_In_Diagnosis_Group
- Group by column name: Primary_Diagnosis_Code
- Value column name: Total_Treatment_Cost
- Aggregate Function: Max
**Output:**
Each patient case includes the maximum cost observed for their diagnosis:
- Diagnosis "J18.9" (Pneumonia): Max cost $45,000 (all 234 cases show this max)
- Diagnosis "I21.9" (Heart Attack): Max cost $125,000 (all 89 cases show this max)
- Diagnosis "K35.8" (Appendicitis): Max cost $32,000 (all 156 cases show this max)
Patients can immediately see if their treatment cost is approaching or exceeding the maximum for their diagnosis group.
**Insights:** Healthcare administrators can identify cases where costs significantly approach the maximum, potentially indicating complications or inefficiencies requiring investigation.
### Example 5: Median Resolution Time by Priority Level
**Scenario:** An IT service desk wants to establish baseline resolution times by calculating the median time to resolve tickets at each priority level.
**Settings:**
- Filter: Ticket_Status = "Resolved" AND Created_Date >= DateAdd(Today(), -90, "days")
- New Attribute Name: Median_Resolution_Hours_By_Priority
- Group by column name: Priority_Level
- Value column name: Resolution_Duration_Hours
- Aggregate Function: Median
**Output:**
Each ticket shows the median resolution time for its priority level:
- Priority 1 (Critical): Median 2.5 hours (assigned to 145 tickets)
- Priority 2 (High): Median 8.0 hours (assigned to 512 tickets)
- Priority 3 (Medium): Median 24.0 hours (assigned to 1,234 tickets)
- Priority 4 (Low): Median 72.0 hours (assigned to 2,891 tickets)
**Insights:** Service desk managers can immediately identify tickets that exceed the median resolution time for their priority level, indicating potential SLA violations or process issues requiring attention.
## Output
The Set Group Value enrichment creates a new case attribute containing the calculated aggregate value for each case's group. Every case within the same group receives the identical calculated value, enabling group-level comparisons and analysis at the individual case level.
**Data Type Determination:** The output attribute's data type depends on both the selected aggregate function and the source column type:
- Count functions (Count, Distinct Count, Null Count) always produce integer values
- Sum, Average, and Median preserve the source column type (numeric values remain numeric, durations remain durations)
- Min and Max maintain the exact data type of the source column
- When working with TimeSpan columns, Sum, Average, and Median operations return TimeSpan values
**Group Calculation Process:** The enrichment first identifies all unique values in the grouping column, then calculates the aggregate function separately for each group using only the cases belonging to that group (and matching any applied filters). Finally, it assigns the calculated value back to every case in the corresponding group.
**Null Value Handling:** If the grouping column contains null values, cases with null form their own group. For the value column, null handling depends on the aggregate function - Count excludes nulls, Null Count specifically counts them, and Sum/Average/Median skip null values in calculations. Cases filtered out or with null grouping values may not receive the new attribute.
**Integration Capabilities:** The new group value attribute integrates seamlessly with other mindzieStudio features. Use it in filters to identify cases above or below group averages, in calculators to derive additional metrics like "percentage of group total," in process maps to color-code based on group statistics, or in further enrichments to create multi-level aggregations. The attribute is immediately available in all analysis tools and can be exported with your enriched dataset.
## See Also
- **Group Attribute Values** - Create custom groupings by combining multiple attribute values into categories
- **Categorize Attribute Values** - Define numeric ranges and assign category labels for segmentation
- **Representative Case Attribute** - Select a single representative value from event attributes for case-level analysis
- **Count Boolean Attributes with Value** - Count occurrences of specific boolean conditions across attributes
- **Add** - Perform simple addition of multiple numeric attributes without grouping
---
*This documentation is part of the mindzie Studio process mining platform.*
---
## Shift Activity Time
Section: Enrichments
URL: https://docs.mindziestudio.com/mindzie_studio/enrichments/shift-activity-time
Source: /docs-master/mindzieStudio/enrichments/shift-activity-time/page.md
# Shift Activity Time
## Overview
The Shift Activity Time enrichment is a powerful time adjustment tool that allows you to modify the timestamps of specific activities within your process event log. This enrichment shifts activity timestamps forward or backward by a specified number of hours, making it invaluable for time zone corrections, data alignment across different systems, or simulation scenarios.
This enrichment operates at the activity level, meaning you can target specific activities for time adjustment while leaving others unchanged. It includes intelligent handling for date-only values (timestamps at midnight), which can be preserved to maintain data integrity when working with systems that store dates without time components. The enrichment directly modifies the event timestamps in your dataset, enabling proper chronological analysis and accurate duration calculations after time zone adjustments or system clock corrections.
## Common Uses
- **Time Zone Corrections**: Adjust timestamps when activities are recorded in different time zones, ensuring all events align to a single reference time zone for accurate process analysis
- **System Clock Misalignment**: Correct timestamp discrepancies when different systems have clock synchronization issues or record events with systematic time offsets
- **Data Integration**: Align timestamps when merging event logs from multiple sources that use different time references or recording conventions
- **Daylight Saving Time Adjustments**: Compensate for daylight saving time changes that may affect year-over-year comparisons or seasonal analysis
- **Simulation and Testing**: Create what-if scenarios by shifting activities to different time periods to test process behavior under various timing conditions
- **Legacy Data Correction**: Fix historical data where timestamps were recorded incorrectly due to system configuration errors or data migration issues
- **Cross-Regional Process Analysis**: Normalize timestamps for global processes where activities occur across multiple time zones but need unified analysis
## Settings
**Activity Names:** Select the specific activity whose timestamps you want to adjust. The dropdown presents all activities found in your current dataset. Only events with the selected activity name will have their timestamps modified, while all other activities remain unchanged. This targeted approach allows precise control over which parts of your process are time-shifted.
**Shift Hours:** Enter the number of hours to shift the selected activity's timestamps. Positive values move timestamps forward (into the future), while negative values move them backward (into the past). For example, entering 5 will add 5 hours to each occurrence of the selected activity, while -3 will subtract 3 hours. This accepts decimal values for sub-hour adjustments (e.g., 1.5 for 90 minutes).
**Don't Shift Midnight:** When enabled (default), timestamps that occur exactly at midnight (00:00:00) are not adjusted. This setting preserves date-only values that many systems store as midnight timestamps when time information is not relevant. Disable this option if you need to shift all timestamps regardless of their time component, such as when performing a uniform time zone conversion where midnight timestamps are genuine time values.
## Examples
### Example 1: Correcting Time Zone Misalignment in Global Supply Chain
**Scenario:** A multinational company's order processing system records "Order Placed" activities in UTC, but the warehouse management system records "Shipment Dispatched" in local Eastern Time (UTC-5). This 5-hour difference makes it appear that some shipments occur before orders are placed.
**Settings:**
- Activity Names: Shipment Dispatched
- Shift Hours: 5
- Don't Shift Midnight: Enabled
**Output:**
The enrichment adjusts all "Shipment Dispatched" timestamps by adding 5 hours, converting them from Eastern Time to UTC. For example:
- Original "Shipment Dispatched": 2024-03-15 09:30:00 (ET)
- Adjusted "Shipment Dispatched": 2024-03-15 14:30:00 (UTC)
- "Order Placed" remains: 2024-03-15 13:45:00 (UTC)
The process flow now shows the correct sequence with orders preceding shipments.
**Insights:** After correction, the true lead time from order to shipment is revealed as 45 minutes instead of appearing as a negative duration. This enables accurate KPI calculation and identifies genuine process bottlenecks.
### Example 2: Adjusting for Daylight Saving Time in Healthcare Scheduling
**Scenario:** A hospital's patient scheduling system didn't properly account for the spring daylight saving time change. All "Appointment Scheduled" activities for a two-week period in March need to be shifted forward by one hour to reflect the actual appointment times patients received.
**Settings:**
- Activity Names: Appointment Scheduled
- Shift Hours: 1
- Don't Shift Midnight: Enabled
**Output:**
The enrichment shifts all "Appointment Scheduled" events forward by one hour:
- Original timestamp: 2024-03-12 10:00:00
- Adjusted timestamp: 2024-03-12 11:00:00
- Other activities like "Patient Arrived" and "Consultation Started" remain unchanged
This correction ensures appointment scheduling metrics accurately reflect the intended appointment times.
**Insights:** The adjustment reveals that the apparent increase in patient no-shows during this period was actually due to the time recording error, not actual patient behavior changes.
### Example 3: Integrating Legacy System Data in Manufacturing
**Scenario:** A manufacturing plant is integrating historical data from an old production line system that recorded all timestamps 8 hours behind due to incorrect time zone configuration. All "Quality Check Completed" activities from this system need correction before process mining analysis.
**Settings:**
- Activity Names: Quality Check Completed
- Shift Hours: 8
- Don't Shift Midnight: Disabled
**Output:**
All "Quality Check Completed" timestamps are shifted forward by 8 hours:
- Original: 2024-01-15 00:00:00 (midnight timestamp)
- Adjusted: 2024-01-15 08:00:00 (correctly shifted even though it was midnight)
- Manufacturing events from the modern system remain unchanged
With "Don't Shift Midnight" disabled, even date-only values stored as midnight are properly adjusted.
**Insights:** The corrected data shows quality checks actually occurred during the day shift as expected, not during unmanned overnight periods, enabling accurate shift performance analysis.
### Example 4: Simulating Process Changes in Financial Services
**Scenario:** A bank wants to simulate the impact of moving their overnight batch processing 3 hours earlier to reduce morning system load. They need to shift all "Batch Processing Started" activities backward to analyze potential conflicts with end-of-day operations.
**Settings:**
- Activity Names: Batch Processing Started
- Shift Hours: -3
- Don't Shift Midnight: Disabled
**Output:**
The enrichment moves all batch processing starts 3 hours earlier:
- Original start time: 2024-02-20 02:00:00
- Simulated start time: 2024-02-19 23:00:00 (shifts to previous day)
- All downstream activities remain at original times for impact analysis
**Insights:** The simulation reveals that starting batch processing 3 hours earlier would create conflicts with end-of-day reconciliation processes that run until 11:30 PM, requiring process redesign before implementation.
### Example 5: Correcting Cross-Regional Data in Procurement
**Scenario:** A procurement system records "PO Approved" activities from the European office in CET (Central European Time) while the US office records them in PST (Pacific Standard Time). To analyze the global approval process, all US approvals need to be converted to CET by adding 9 hours.
**Settings:**
- Activity Names: PO Approved
- Shift Hours: 9
- Don't Shift Midnight: Enabled
**Output:**
US-based PO approvals are shifted from PST to CET:
- Original US approval: 2024-04-10 14:00:00 PST
- Adjusted to CET: 2024-04-10 23:00:00 CET
- European approvals remain unchanged
- Purchase orders with date-only approval timestamps (stored as midnight) are preserved
**Insights:** The unified timeline reveals that seemingly delayed European approvals were actually processed faster than US approvals when measured in business hours, leading to revised SLA definitions based on regional working hours.
## Output
The Shift Activity Time enrichment directly modifies the timestamp values of the selected activity in your event log. No new attributes are created; instead, the existing event timestamps are updated in place. The modified timestamps maintain their original data type and format but with adjusted time values based on your configuration.
The enrichment affects only events matching the specified activity name, leaving all other activities' timestamps unchanged. This selective modification preserves the relative timing between different activities while correcting specific timestamp issues. When "Don't Shift Midnight" is enabled, events with midnight timestamps (00:00:00) remain unmodified, preserving date-only values commonly used in systems that don't track precise times.
After applying this enrichment, all downstream calculations and analyses automatically use the adjusted timestamps. This includes duration calculations, throughput time metrics, bottleneck analysis, and any time-based filtering or segmentation. The changes are permanent within the enriched dataset, so it's recommended to document the time shifts applied for audit trail purposes.
The enrichment handles date boundaries correctly, so shifting timestamps backward may move events to the previous day, while shifting forward may advance them to the next day. Month and year boundaries are also properly handled, ensuring data integrity even with large time shifts.
## See Also
- **Freeze Time**: Set a fixed reference time for the entire dataset, useful for creating consistent snapshots
- **Add Days to a Date**: Add or subtract days from date attributes when working with date-only values
- **Duration Between Two Activities**: Calculate time differences between activities after time corrections
- **Add Time to attributes**: Apply time adjustments to case or event attributes beyond just activity timestamps
---
*This documentation is part of the mindzie Studio process mining platform.*
---
## Sort Log On Start Time
Section: Enrichments
URL: https://docs.mindziestudio.com/mindzie_studio/enrichments/sort-log-on-start-time
Source: /docs-master/mindzieStudio/enrichments/sort-log-on-start-time/page.md
# Sort the log on start time
## Overview
The Sort the log on start time enrichment changes how events are ordered in your process mining dataset when activities have both start and end timestamps. By default, mindzieStudio sorts events by their completion time (end timestamp), which shows the sequence in which activities finished. This enrichment switches the sorting to use start timestamps instead, revealing the actual sequence in which activities began. This distinction is crucial for understanding true process flow, identifying parallel activities, and analyzing resource allocation patterns.
This enrichment is particularly valuable when analyzing processes where the initiation order differs significantly from the completion order, such as manufacturing processes with varying activity durations, healthcare treatments where procedures start and end at different rates, or project management scenarios where tasks overlap extensively. By sorting on start time, you gain insights into when work actually begins, how resources are allocated at the start of activities, and the true dependencies between process steps. This perspective is essential for capacity planning, bottleneck identification at activity initiation points, and understanding the real sequence of work initialization.
## Common Uses
- Analyze the true initiation sequence of activities in manufacturing processes
- Understand resource allocation patterns based on when work actually starts
- Identify bottlenecks at activity start points rather than completion points
- Detect parallel processing patterns that are obscured by end-time sorting
- Analyze queue formation and work initialization patterns
- Understand true process dependencies based on activity start sequences
- Optimize resource scheduling by seeing when activities actually begin
## Settings
This enrichment has no configurable settings. It applies a global change to how the entire event log is sorted, switching from end-time to start-time ordering. The enrichment will only have an effect when your dataset contains activities with both start and end timestamps. If your activities only have single timestamps, this enrichment will not change the log ordering.
## Examples
### Example 1: Manufacturing Process Analysis
**Scenario:** In a production line, multiple workstations process items with varying durations. You need to understand the actual sequence of work initiation to optimize resource allocation and identify where queues form at the start of processes.
**Settings:**
- No configuration required
**Output:**
Before enrichment, the event log sorted by end time might show:
- Station A completes at 10:30 (started at 09:00, duration: 1.5 hours)
- Station B completes at 10:15 (started at 10:00, duration: 15 minutes)
- Station C completes at 11:00 (started at 08:30, duration: 2.5 hours)
After enrichment, sorted by start time:
- Station C starts at 08:30
- Station A starts at 09:00
- Station B starts at 10:00
**Insights:** The start-time view reveals that Station C actually begins processing first despite finishing last, indicating it's a long-duration activity that might need additional resources. Station B, though completing quickly, starts last, suggesting it depends on outputs from other stations.
### Example 2: Healthcare Treatment Sequencing
**Scenario:** In a hospital emergency department, various treatments and procedures have different durations. Understanding when treatments actually begin is crucial for patient flow management and resource planning.
**Settings:**
- No configuration required
**Output:**
End-time sorted view:
- Blood test results: 14:30 (started 13:00)
- X-ray completed: 14:15 (started 14:00)
- Initial assessment: 13:30 (started 13:00)
- Treatment administered: 15:00 (started 14:45)
Start-time sorted view:
- Initial assessment: 13:00
- Blood test: 13:00 (parallel with assessment)
- X-ray: 14:00
- Treatment: 14:45
**Insights:** The start-time sorting reveals that blood tests and initial assessments begin simultaneously, indicating efficient parallel processing. The gap between X-ray start and treatment start suggests a waiting period for results, highlighting a potential optimization opportunity.
### Example 3: Project Task Management
**Scenario:** In a software development project with overlapping tasks, you need to understand when work actually begins on different components to better manage developer allocation and identify true task dependencies.
**Settings:**
- No configuration required
**Output:**
Before enrichment (end-time view):
- Database design: Day 5 completion
- API development: Day 8 completion
- Frontend development: Day 10 completion
- Testing: Day 12 completion
After enrichment (start-time view):
- Database design: Day 1 start
- Frontend development: Day 2 start (parallel work)
- API development: Day 4 start
- Testing: Day 7 start (begins before all development completes)
**Insights:** Start-time sorting reveals that frontend development begins early in parallel with database design, and testing starts before all development completes, indicating an agile approach with continuous testing rather than a waterfall model.
### Example 4: Insurance Claim Processing
**Scenario:** Insurance claims go through various validation and approval steps with different processing times. Understanding when each step begins helps identify where claims queue up and where parallel processing occurs.
**Settings:**
- No configuration required
**Output:**
End-time sorted events for a claim:
- Document verification complete: Day 3, 14:00
- Risk assessment complete: Day 2, 16:00
- Initial review complete: Day 1, 11:00
- Final approval: Day 4, 10:00
Start-time sorted events:
- Initial review starts: Day 1, 09:00
- Risk assessment starts: Day 1, 10:00 (parallel processing)
- Document verification starts: Day 2, 08:00
- Final approval starts: Day 4, 09:00
**Insights:** The start-time view shows that risk assessment begins while initial review is still in progress, indicating parallel processing capabilities. Document verification doesn't start until Day 2, suggesting it depends on outputs from the earlier steps.
### Example 5: Warehouse Order Fulfillment
**Scenario:** In a distribution center, orders go through picking, packing, and shipping stages with varying durations. Understanding start sequences helps optimize worker assignment and identify where orders begin queueing.
**Settings:**
- No configuration required
**Output:**
Standard end-time view:
- Order A shipping: 15:00 (started picking at 09:00)
- Order B shipping: 14:30 (started picking at 11:00)
- Order C shipping: 14:45 (started picking at 08:00)
Start-time sorted view:
- Order C picking starts: 08:00
- Order A picking starts: 09:00
- Order B picking starts: 11:00
**Insights:** Despite Order B shipping before Order C, Order C actually started processing much earlier, indicating it's a complex order requiring more time. This start-time perspective helps warehouse managers understand true FIFO compliance and identify orders that spend excessive time in the fulfillment process.
## Output
The Sort the log on start time enrichment modifies the fundamental ordering of events in your process log without creating new attributes or changing existing data values. The enrichment sets an internal flag (SortLogOnStartTime = true) that affects how all process mining visualizations and analyses interpret the sequence of events.
**Impact on Process Mining:** After applying this enrichment, all process maps, variant analyses, and sequence-dependent calculations will reflect the start-time ordering. This affects:
- Process flow visualizations showing the sequence of activity initiations
- Variant detection based on start-time sequences
- Throughput time calculations from the start of the first activity
- Bottleneck analyses focusing on where activities begin rather than end
- Resource utilization views based on when resources begin work
**Requirements:** This enrichment only affects datasets where activities have both start and end timestamps. For datasets with single timestamps per activity, the enrichment will have no effect. The enrichment is particularly useful for processes imported from systems that track both activity initiation and completion, such as manufacturing execution systems, project management tools, or healthcare information systems.
**Reversibility:** The sorting change persists for the current analysis session. To return to end-time sorting, you would need to remove this enrichment and reprocess the dataset. Consider saving different versions of your analysis if you need to switch between start-time and end-time perspectives frequently.
**Combination with Other Enrichments:** This enrichment works seamlessly with all other enrichments and doesn't interfere with calculations or filters. However, be aware that any duration or sequence-based enrichments applied after this will use the start-time ordering, which may produce different results than when using end-time ordering.
## See Also
- **Shift Activity Time** - Adjust timestamps for specific activities to correct time zone issues or data quality problems
- **Freeze Time** - Set a fixed current time for consistent time-based calculations
- **Duration Between Two Activities** - Calculate time intervals that may be affected by sort order
- **Filter Process Log** - Remove unwanted events before or after sorting changes
- **Convert to Case Attributes** - Identify attributes that don't change within cases, regardless of sort order
---
*This documentation is part of the mindzie Studio process mining platform.*
---
## Subtract
Section: Enrichments
URL: https://docs.mindziestudio.com/mindzie_studio/enrichments/subtract
Source: /docs-master/mindzieStudio/enrichments/subtract/page.md
# Subtract
## Overview
The Subtract enrichment performs mathematical subtraction between two numeric attributes and stores the result in a new attribute. This is useful for calculating differences, variances, and deltas in your process data.
## Common Uses
- Calculate the difference between quantities ordered and quantities received
- Determine the variance between planned and actual values (budget, time, resources)
- Calculate net changes by subtracting initial values from final values
- Compute deltas between expected and actual performance metrics
## Settings
Start by going to the 'Log Enrichment' engine by going to any analysis and clicking 'Log Enrichment' in the top right.
Then click 'Add New'
Then choose the Subtract enrichment block.
### Configuration Options
- **Filters:** Add any filter you like. The enrichment will define attributes only for cases that are selected by the filter.
- **New Attribute Name:** Specify the name of the new attribute you are about to create.
- **Column Name:** Select the attribute that needs to be subtracted from (the minuend).
- **Minus Column Name:** Select the attribute that represents the value that needs to be subtracted (the subtrahend).
- **Number of Decimals:** Specify the number of decimal points to show in the new attribute.
## Examples
### Example 1: Calculate Quantity Difference
In a purchase order process, you may want to calculate the difference between quantity ordered and quantity received to identify discrepancies.
**Scenario:**
- Your event log contains attributes: `QuantityOrdered` and `QuantityReceived`
- You want to create a new attribute `QuantityDifference` showing the variance
- The result should show 2 decimal places for precision
**Configuration:**
- New Attribute Name: `QuantityDifference`
- Column Name: `QuantityOrdered`
- Minus Column Name: `QuantityReceived`
- Number of Decimals: 2

Click 'Create' and once you're ready click 'Calculate Enrichment' to add the new attribute to your data set.
From the overview, you should now be able to find the newly created attribute:

**Result:** A positive value indicates more was ordered than received, while a negative value indicates more was received than ordered.

## Output
When this enrichment is executed, it creates a new numeric case or event attribute with the name you specified in "New Attribute Name". The attribute value contains the result of subtracting the "Minus Column Name" value from the "Column Name" value.
The result is formatted to the number of decimal places you specified in "Number of Decimals".
**Formula:** Result = Column Name - Minus Column Name
**Example:** If Column Name = 100 and Minus Column Name = 25, the new attribute will contain 75.
**Null Handling:** Cases where either attribute is empty or null will not have a calculated value in the new attribute.
**Data Type:** Both attributes must contain numeric values. Non-numeric values will result in calculation errors.
## See Also
**Related Mathematical Enrichments:**
- Add - Add two attribute values together
- [Multiply](/mindzie_studio/enrichments/multiply) - Multiply two attribute values
- [Divide](/mindzie_studio/enrichments/divide) - Divide one attribute by another
**Related Topics:**
- Attribute Enrichments - Overview of attribute manipulation features
- Calculated Attributes - Create custom calculations using attributes
---
*This documentation is part of the mindzieStudio process mining platform.*
---
## Summarize Values
Section: Enrichments
URL: https://docs.mindziestudio.com/mindzie_studio/enrichments/summarize-values
Source: /docs-master/mindzieStudio/enrichments/summarize-values/page.md
# Summarize Values
## Overview
The Summarize Values enrichment is a powerful statistical tool that aggregates numeric event-level attribute values across all events within each case, creating a new case attribute containing the sum total. This enrichment is essential for process mining scenarios where you need to understand cumulative values at the case level, such as total order value, accumulated costs, overall quantities, or aggregate scores across process steps.
Unlike simple counting operations that merely tally occurrences, Summarize Values performs mathematical summation on actual numeric data stored in event attributes. This enables comprehensive analysis of financial metrics, resource consumption, performance scores, and any other quantifiable values that need to be totaled across a case's journey through the process. The enrichment intelligently handles both integer and decimal values, preserving data precision based on the source attribute type.
The enrichment also supports advanced filtering capabilities, allowing you to selectively sum values only from specific events that meet your criteria. This targeted aggregation enables sophisticated analyses like calculating total costs only for approved activities, summing quantities only from specific departments, or aggregating scores from particular process phases.
## Common Uses
- Calculate total order value by summing line item amounts across all order processing events
- Aggregate total processing time by summing duration values from individual activity executions
- Compute total resource costs by summing labor charges, material costs, or overhead expenses across process steps
- Track cumulative quality scores or defect counts throughout manufacturing processes
- Sum transaction amounts in financial processes to understand total monetary flow per case
- Calculate total quantity produced or consumed across multiple production or inventory events
- Aggregate performance metrics like response times, wait times, or service times across customer interactions
## Settings
**Filter** (Optional): Defines criteria to select which events should be included in the summation. When filters are applied, only events matching all specified conditions will have their values summed. This enables targeted aggregation scenarios such as summing values only from specific activities, time periods, or resource types. If no filter is specified, all events in the case containing non-null values for the selected attribute will be included in the calculation.
**New Attribute Name**: The name for the new case attribute that will store the calculated sum. This should be a descriptive name that clearly indicates what is being summed, such as "TotalOrderValue", "CumulativeCost", "AggregateQuantity", or "SumOfScores". The attribute name must be unique within the case table and cannot conflict with existing attributes. Choose names that follow your organization's naming conventions and are meaningful to business users.
**Attribute Name**: The event attribute containing the numeric values to be summed. This must be an existing numeric attribute in the event table (integer or decimal type). The dropdown list shows all available numeric event attributes in your dataset. Common examples include "Amount", "Cost", "Quantity", "Duration", "Score", or any custom numeric attribute specific to your process. The enrichment will automatically skip any events where this attribute has a null value.
## Examples
### Example 1: Total Order Value in E-Commerce Process
**Scenario:** An online retailer needs to calculate the total value of each customer order by summing individual line item amounts across all order processing events, from initial placement through fulfillment and delivery.
**Settings:**
- Filter: Activity equals "Add Item to Order" OR Activity equals "Process Payment" OR Activity equals "Apply Discount"
- New Attribute Name: TotalOrderValue
- Attribute Name: LineItemAmount
**Output:**
The enrichment creates a new case attribute "TotalOrderValue" containing the sum of all LineItemAmount values from the filtered events. For example:
- Case 12345: Events with amounts $49.99, $29.99, $15.00, -$10.00 (discount) result in TotalOrderValue = $84.98
- Case 12346: Events with amounts $199.99, $89.99, $45.00 result in TotalOrderValue = $334.98
The new attribute appears in the case table and can be used for order segmentation, revenue analysis, and customer value assessment.
**Insights:** This aggregated value enables the business to segment orders by total value, identify high-value transactions requiring special handling, analyze discount impact on order values, and understand revenue distribution patterns across the customer base.
### Example 2: Manufacturing Total Defect Count
**Scenario:** A manufacturing company tracks quality defects at each production station and needs to calculate the total number of defects per production batch to identify problematic batches and analyze quality trends.
**Settings:**
- Filter: EventType equals "Quality Check" AND DefectsFound greater than 0
- New Attribute Name: TotalDefectsPerBatch
- Attribute Name: DefectsFound
**Output:**
The enrichment sums the DefectsFound values across all quality check events for each batch:
- Batch A1234: Station 1 (2 defects) + Station 3 (1 defect) + Station 5 (3 defects) = TotalDefectsPerBatch: 6
- Batch A1235: Station 2 (1 defect) + Station 4 (1 defect) = TotalDefectsPerBatch: 2
- Batch A1236: No defects found = TotalDefectsPerBatch: 0 (or null if no quality checks)
**Insights:** Manufacturing teams can now identify batches exceeding quality thresholds, analyze defect patterns across production runs, and correlate total defects with other process variables like shift patterns, equipment maintenance schedules, or raw material suppliers.
### Example 3: Healthcare Treatment Cost Aggregation
**Scenario:** A hospital needs to calculate the total treatment cost for each patient episode by summing individual procedure costs, medication charges, and facility fees across all care delivery events.
**Settings:**
- Filter: (No filter - include all events with cost data)
- New Attribute Name: TotalEpisodeCost
- Attribute Name: ServiceCost
**Output:**
For each patient episode, the enrichment sums all ServiceCost values:
- Episode P2024-001: Emergency ($500) + X-Ray ($250) + Lab Tests ($180) + Medication ($95) + Consultation ($200) = TotalEpisodeCost: $1,225
- Episode P2024-002: Consultation ($200) + Surgery ($8,500) + Recovery Room ($1,200) + Medication ($450) = TotalEpisodeCost: $10,350
**Insights:** Healthcare administrators can analyze cost distribution across patient populations, identify cost outliers requiring review, support insurance claim processing, and evaluate the financial impact of different treatment pathways.
### Example 4: Procurement Cumulative Savings Calculation
**Scenario:** A procurement department tracks negotiated savings on each purchase order line item and needs to calculate total savings per procurement case to measure buyer performance and vendor negotiations effectiveness.
**Settings:**
- Filter: Activity contains "Negotiate" OR Activity contains "Approve Savings"
- New Attribute Name: TotalNegotiatedSavings
- Attribute Name: SavingsAmount
**Output:**
The enrichment aggregates savings across all negotiation and approval events:
- PO-2024-500: Initial Quote Savings ($1,200) + Volume Discount ($800) + Payment Terms Savings ($300) = TotalNegotiatedSavings: $2,300
- PO-2024-501: Competitive Bid Savings ($5,500) + Contract Renewal Discount ($2,000) = TotalNegotiatedSavings: $7,500
**Insights:** Procurement teams can measure total cost avoidance per purchase order, evaluate buyer effectiveness in negotiations, identify best-performing vendor relationships, and demonstrate the department's contribution to bottom-line savings.
### Example 5: Customer Service Interaction Duration
**Scenario:** A call center wants to calculate the total time spent on each customer case by summing individual interaction durations across all touchpoints including phone calls, chat sessions, and email exchanges.
**Settings:**
- Filter: Channel in ["Phone", "Chat", "Email"] AND Status equals "Completed"
- New Attribute Name: TotalInteractionMinutes
- Attribute Name: InteractionDuration
**Output:**
For each customer case, the total interaction time is calculated:
- Case CS-8901: Initial Call (15 min) + Follow-up Call (8 min) + Chat Session (12 min) + Email Response (5 min) = TotalInteractionMinutes: 40
- Case CS-8902: Phone Call (25 min) + Escalation Call (18 min) + Resolution Call (10 min) = TotalInteractionMinutes: 53
**Insights:** Service managers can identify cases requiring excessive support time, analyze the relationship between total interaction duration and customer satisfaction scores, optimize resource allocation based on case complexity, and establish service level benchmarks for different issue types.
## Output
The Summarize Values enrichment creates a single new case attribute in your dataset containing the calculated sum for each case. The attribute characteristics depend on the source data type:
**Attribute Type:** The new attribute will be either integer (Int64) or floating-point (Single) based on the source event attribute's data type. Integer event attributes produce integer sums, while decimal or floating-point attributes produce decimal sums, preserving numerical precision.
**Attribute Naming:** The new attribute uses the name specified in the "New Attribute Name" setting. This attribute becomes immediately available for use in filters, calculators, dashboards, and other enrichments.
**Null Handling:** Cases without any qualifying events (based on filters) or cases where all qualifying events have null values in the source attribute will not have a value set in the new attribute. These cases can be identified using "is null" filters if needed.
**Integration Points:** The generated sum attribute can be utilized across the mindzie platform:
- **Filters:** Create case filters based on sum thresholds (e.g., TotalOrderValue > 1000)
- **Calculators:** Use sums in further calculations like averages, ratios, or complex formulas
- **Dashboards:** Display sum distributions, create value-based segments, or show sum trends
- **Process Maps:** Color or filter process flows based on cumulative values
- **Other Enrichments:** Feed sum values into categorization, prediction, or conformance enrichments
**Performance Considerations:** The enrichment efficiently processes large datasets by calculating sums in a single pass through the event data. For optimal performance with very large logs, consider applying case filters before running the enrichment to limit the scope of calculation.
---
*This documentation is part of the mindzie Studio process mining platform.*
---
## Text End
Section: Enrichments
URL: https://docs.mindziestudio.com/mindzie_studio/enrichments/text-end
Source: /docs-master/mindzieStudio/enrichments/text-end/page.md
# Text End
## Overview
The Text End enrichment extracts a specified number of characters from the end of text attribute values, creating a new attribute containing the extracted suffix. This powerful text manipulation operator enables you to isolate and analyze the ending portions of text fields, which often contain critical identifying information, classification codes, or standardized suffixes. By focusing on the rightmost characters of text values, you can extract meaningful patterns and categories that are commonly appended to the end of business identifiers.
In process mining, the Text End enrichment is particularly valuable for working with structured codes and identifiers where the ending portion carries specific meaning. Many business systems use suffixes to denote categories, regions, product types, or status indicators. For example, invoice numbers might end with country codes, product SKUs might include category suffixes, or case IDs might contain department identifiers. This enrichment allows you to extract these meaningful endings for analysis, filtering, and process variant detection. The operator works with both case attributes and event attributes, providing flexibility in how you extract and analyze text patterns throughout your process data.
## Common Uses
- Extract file extensions from document names to analyze document types in approval processes
- Isolate country or region codes from the end of customer or supplier identifiers
- Extract department or team suffixes from case IDs for organizational analysis
- Retrieve product category codes from the end of SKU numbers for inventory analysis
- Identify version numbers or revision codes from the end of document references
- Extract status indicators or flags appended to transaction codes
- Isolate year or period indicators from financial reference numbers
## Settings
**New Attribute Name:** Specify the name for the new attribute that will store the extracted text ending. Choose a descriptive name that clearly indicates what information is being extracted from the source text. For example, use "File_Extension" when extracting file types, "Country_Code" when extracting location identifiers, or "Category_Suffix" when extracting classification codes. The name must be unique and cannot conflict with existing attributes in your dataset.
**Column Name:** Select the text attribute from which you want to extract the ending characters. This dropdown presents all available text attributes from both case and event levels. The enrichment automatically detects whether the selected attribute is a case or event attribute and creates the new attribute at the same level. Only text (string) type attributes that are not hidden will be available for selection.
**Length:** Specify the number of characters to extract from the end of the text value. This must be a positive integer (minimum value of 1). If the specified length exceeds the actual length of a text value, the entire value will be returned. For example, if you specify a length of 3 and a value is only 2 characters long, the full 2-character value will be extracted. Consider the maximum expected length of the suffix you want to extract to avoid capturing unnecessary characters.
## Examples
### Example 1: Extracting File Extensions from Document Names
**Scenario:** In a document approval process, you need to analyze which document types are most commonly submitted and their processing times. Document names are stored with their file extensions, and you want to extract these extensions for categorization.
**Settings:**
- New Attribute Name: Document_Type
- Column Name: Document_Name
- Length: 4
**Output:**
Creates a new attribute "Document_Type" containing the last 4 characters of each document name. For cases with document names:
- "Q3_Report_2024.pdf" → ".pdf"
- "Contract_Amendment.docx" → "docx"
- "Invoice_10245.xlsx" → "xlsx"
- "Presentation.ppt" → ".ppt"
**Insights:** By extracting file extensions, you can analyze which document types require longer approval times, identify departments that work with specific file formats, and detect potential compliance issues with unauthorized file types.
### Example 2: Isolating Country Codes from Supplier IDs
**Scenario:** In a global procurement process, supplier IDs end with two-letter country codes. You need to extract these codes to analyze procurement patterns by country and ensure compliance with regional sourcing policies.
**Settings:**
- New Attribute Name: Supplier_Country
- Column Name: Supplier_ID
- Length: 2
**Output:**
Creates a new case attribute "Supplier_Country" with the country code. For suppliers:
- "SUP-2024-0145-US" → "US"
- "SUP-2024-0892-DE" → "DE"
- "SUP-2024-0234-CN" → "CN"
- "SUP-2024-0567-BR" → "BR"
**Insights:** This extraction enables geographic analysis of supplier distribution, calculation of regional procurement metrics, and identification of compliance with local sourcing requirements.
### Example 3: Extracting Department Codes from Case IDs
**Scenario:** In a healthcare patient registration system, case IDs include a three-character department code at the end. You need to extract these codes to analyze patient flow across different departments and identify bottlenecks.
**Settings:**
- New Attribute Name: Department_Code
- Column Name: Case_ID
- Length: 3
**Output:**
Creates a new attribute "Department_Code" containing department identifiers. For case IDs:
- "PAT-2024-10523-EMR" → "EMR" (Emergency)
- "PAT-2024-10524-RAD" → "RAD" (Radiology)
- "PAT-2024-10525-LAB" → "LAB" (Laboratory)
- "PAT-2024-10526-SUR" → "SUR" (Surgery)
**Insights:** Extracting department codes enables analysis of patient routing patterns, identification of department-specific delays, and comparison of processing times across different medical units.
### Example 4: Retrieving Product Categories from SKU Numbers
**Scenario:** In a retail inventory management process, product SKUs end with a two-character category code. You want to extract these codes to analyze inventory turnover by product category and optimize stock levels.
**Settings:**
- New Attribute Name: Product_Category
- Column Name: SKU_Number
- Length: 2
**Output:**
Creates a new attribute "Product_Category" with category codes. For SKUs:
- "PROD-854621-EL" → "EL" (Electronics)
- "PROD-854622-CL" → "CL" (Clothing)
- "PROD-854623-FD" → "FD" (Food)
- "PROD-854624-TY" → "TY" (Toys)
**Insights:** Category extraction allows for analysis of category-specific inventory patterns, identification of slow-moving product types, and optimization of reorder points by product category.
### Example 5: Extracting Year Indicators from Financial References
**Scenario:** In an accounts payable process, invoice numbers end with a four-digit year. You need to extract the year to analyze payment patterns over time and identify aging invoices.
**Settings:**
- New Attribute Name: Invoice_Year
- Column Name: Invoice_Number
- Length: 4
**Output:**
Creates a new attribute "Invoice_Year" containing the year. For invoice numbers:
- "INV-US-054321-2024" → "2024"
- "INV-EU-098765-2023" → "2023"
- "INV-AP-012345-2024" → "2024"
- "INV-LA-067890-2022" → "2022"
**Insights:** Year extraction enables trend analysis of invoice processing times, identification of old unpaid invoices, and year-over-year comparison of payment performance metrics.
## Output
The Text End enrichment creates a new attribute (either case or event level, matching the source attribute) containing the extracted text from the end of the original values. The new attribute is always of string data type, regardless of what the extracted content represents. The attribute is automatically added to the appropriate table (case or event) and becomes immediately available for use in filters, calculators, and other enrichments.
For case attributes, the extraction is performed once per case, with the result stored at the case level. For event attributes, the extraction is performed for each event, allowing you to analyze how suffixes might vary across different activities in your process. If the source value is null or empty, the new attribute will also be null for that case or event.
The extracted text preserves the exact characters from the end of the source string, including any special characters, numbers, or punctuation marks. This ensures that meaningful suffixes like file extensions (including the dot) or composite codes are captured accurately. The enrichment handles variable-length source texts gracefully - if a source value is shorter than the specified extraction length, the entire value is returned rather than generating an error.
---
*This documentation is part of the mindzie Studio process mining platform.*
---
## Text Start
Section: Enrichments
URL: https://docs.mindziestudio.com/mindzie_studio/enrichments/text-start
Source: /docs-master/mindzieStudio/enrichments/text-start/page.md
# Text Start
## Overview
The Text Start enrichment extracts a specified number of characters from the beginning of a text attribute value, creating a new attribute containing the extracted prefix. This powerful enrichment enables you to systematically extract and analyze the leading portions of text data, such as product codes, department identifiers, location prefixes, or any other meaningful text patterns that appear at the beginning of attribute values.
In process mining, Text Start is invaluable for standardizing and categorizing data based on text prefixes. For example, you might extract the first three characters of invoice numbers to identify regional offices, pull department codes from employee IDs, or extract product line identifiers from SKUs. By creating new attributes with these extracted prefixes, you can perform more granular analysis, create meaningful groupings, and uncover patterns that might otherwise be hidden within longer text strings. This enrichment works with both case-level and event-level attributes, providing flexibility in how you structure and analyze your process data.
## Common Uses
- Extract department codes from employee IDs (e.g., "FIN-12345" to "FIN")
- Identify regional identifiers from invoice numbers or order codes
- Pull product category prefixes from SKU codes for inventory analysis
- Extract area codes from phone numbers for geographical analysis
- Identify document types from document IDs that follow naming conventions
- Create groupings based on standardized prefixes in reference numbers
- Extract year or month identifiers from date-based text codes
## Settings
**New Attribute Name:** The name of the new attribute that will be created to store the extracted text prefix. This should be a descriptive name that clearly indicates what information the attribute contains. For example, if extracting department codes from employee IDs, you might name it "DepartmentCode" or "EmployeeDept". The new attribute will be created at the same level (case or event) as the source attribute.
**Column Name:** The source text attribute from which you want to extract the beginning characters. This dropdown lists all available text attributes in your dataset that are not hidden. The enrichment will process each value in this column, extracting the specified number of characters from the start. If a value is shorter than the specified length, the entire value will be used.
**Length:** The number of characters to extract from the beginning of the text value. This must be a positive integer (1 or greater). For example, setting this to 3 will extract the first three characters, while setting it to 5 will extract the first five characters. If the source text is shorter than the specified length, the enrichment will use the entire available text without padding or error.
## Examples
### Example 1: Department Code Extraction from Employee IDs
**Scenario:** A healthcare organization uses employee IDs that begin with department codes (e.g., "NUR-45678" for nursing, "ADM-12345" for administration, "LAB-98765" for laboratory). They want to analyze process performance by department.
**Settings:**
- New Attribute Name: DepartmentCode
- Column Name: EmployeeID
- Length: 3
**Output:**
The enrichment creates a new case attribute "DepartmentCode" with values:
- Employee "NUR-45678" → DepartmentCode: "NUR"
- Employee "ADM-12345" → DepartmentCode: "ADM"
- Employee "LAB-98765" → DepartmentCode: "LAB"
- Employee "IT-5432" → DepartmentCode: "IT-" (includes hyphen as part of first 3 characters)
**Insights:** With the extracted department codes, the organization can now filter processes by department, compare cycle times across departments, and identify department-specific bottlenecks or compliance issues.
### Example 2: Regional Office Identification from Invoice Numbers
**Scenario:** A multinational corporation uses invoice numbers where the first two characters represent the regional office (e.g., "US-INV-2024-0001" for United States, "EU-INV-2024-0002" for Europe, "AP-INV-2024-0003" for Asia Pacific).
**Settings:**
- New Attribute Name: RegionalOffice
- Column Name: InvoiceNumber
- Length: 2
**Output:**
The enrichment creates a new case attribute "RegionalOffice" with values:
- Invoice "US-INV-2024-0001" → RegionalOffice: "US"
- Invoice "EU-INV-2024-0002" → RegionalOffice: "EU"
- Invoice "AP-INV-2024-0003" → RegionalOffice: "AP"
- Invoice "UK-INV-2024-0004" → RegionalOffice: "UK"
**Insights:** The company can now analyze invoice processing times by region, identify regional variations in approval workflows, and benchmark performance across different offices to standardize best practices.
### Example 3: Product Line Extraction from SKU Codes
**Scenario:** A manufacturing company uses SKU codes where the first four characters identify the product line (e.g., "ELEC-TV-55-BLK" for electronics, "FURN-CHR-WD-01" for furniture, "TOYS-DOL-12-PNK" for toys).
**Settings:**
- New Attribute Name: ProductLine
- Column Name: SKUCode
- Length: 4
**Output:**
The enrichment creates a new event attribute "ProductLine" with values:
- SKU "ELEC-TV-55-BLK" → ProductLine: "ELEC"
- SKU "FURN-CHR-WD-01" → ProductLine: "FURN"
- SKU "TOYS-DOL-12-PNK" → ProductLine: "TOYS"
- SKU "APP-SHT-L-BLU" → ProductLine: "APP-" (note: shorter code, gets first 4 chars including hyphen)
**Insights:** The manufacturer can analyze order fulfillment processes by product line, identify which product lines have longer lead times, and optimize warehouse operations based on product line characteristics.
### Example 4: Document Type Classification in Procurement
**Scenario:** A procurement system uses document IDs that start with three-letter codes indicating document type (e.g., "POR-2024-0001" for purchase orders, "RFQ-2024-0002" for requests for quotation, "CON-2024-0003" for contracts).
**Settings:**
- New Attribute Name: DocumentType
- Column Name: DocumentID
- Length: 3
**Output:**
The enrichment creates a new case attribute "DocumentType" with values:
- Document "POR-2024-0001" → DocumentType: "POR"
- Document "RFQ-2024-0002" → DocumentType: "RFQ"
- Document "CON-2024-0003" → DocumentType: "CON"
- Document "INV-2024-0004" → DocumentType: "INV"
**Insights:** The procurement team can track processing times by document type, ensure appropriate approval workflows are followed for different document types, and identify which document types experience the most delays or rework.
### Example 5: Year Extraction from Date-Based Reference Numbers
**Scenario:** A financial services company uses reference numbers that begin with the year (e.g., "2024-FIN-00123", "2023-FIN-98765"). They want to analyze trends and volumes by year.
**Settings:**
- New Attribute Name: ReferenceYear
- Column Name: ReferenceNumber
- Length: 4
**Output:**
The enrichment creates a new case attribute "ReferenceYear" with values:
- Reference "2024-FIN-00123" → ReferenceYear: "2024"
- Reference "2023-FIN-98765" → ReferenceYear: "2023"
- Reference "2022-FIN-45678" → ReferenceYear: "2022"
- Reference "2021-FIN-12345" → ReferenceYear: "2021"
**Insights:** The company can track transaction volumes by year, analyze year-over-year process improvements, identify seasonal patterns, and measure the impact of process changes implemented in specific years.
## Output
The Text Start enrichment creates a new attribute (either case-level or event-level, matching the source attribute's level) containing the extracted text prefix. The new attribute is always of type String and will contain the first N characters from each value in the source column, where N is the specified length.
The enrichment handles various scenarios gracefully:
- If the source text is longer than the specified length, exactly the specified number of characters is extracted
- If the source text is shorter than or equal to the specified length, the entire text value is used
- If the source value is null or empty, the new attribute will also be null for that row
- Special characters, spaces, and punctuation are treated as regular characters and included in the extraction if they fall within the specified length
The new attribute can be used immediately in subsequent enrichments, filters, and calculators. Common follow-up analyses include using the extracted prefixes in Group Attribute Values enrichment to create categories, applying filters to focus on specific prefixes, or using the prefixes in conformance checking to ensure proper coding standards are followed.
---
*This documentation is part of the mindzie Studio process mining platform.*
---
## Time To Previous Case In Group
Section: Enrichments
URL: https://docs.mindziestudio.com/mindzie_studio/enrichments/time-to-previous-case-in-group
Source: /docs-master/mindzieStudio/enrichments/time-to-previous-case-in-group/page.md
# Time To Previous Case In the Group
## Overview
The Time To Previous Case In the Group enrichment calculates the time elapsed between consecutive cases within a specific group or category. By grouping cases based on a shared attribute (such as patient ID, resource name, machine ID, or department), this enrichment measures the interval from when one case started to when the next case in that same group started. This powerful temporal analysis capability enables organizations to understand workload patterns, identify bottlenecks in resource utilization, and measure throughput at a granular level.
This enrichment is particularly valuable for analyzing queue times, resource availability, and operational cadence. For example, in healthcare you can measure how long it takes between consecutive patient visits for the same doctor, in manufacturing you can track the time between production runs on the same machine, or in customer service you can analyze the interval between cases handled by the same agent. The enrichment automatically creates two new case attributes: the time duration to the previous case and the case ID of that previous case, providing both temporal and relational insights.
Unlike simple duration calculations that measure time within a single case, this enrichment looks across multiple cases to understand patterns in how work flows through your organization. It reveals whether resources are being fully utilized, whether there are excessive wait times between activities, and how workload distribution varies across different groups or categories in your process.
## Common Uses
- **Healthcare Resource Utilization**: Measure time between consecutive patient appointments for the same physician to identify scheduling gaps and optimize clinic efficiency
- **Manufacturing Machine Throughput**: Calculate intervals between production runs on the same equipment to analyze machine utilization and identify idle time
- **Customer Service Queue Analysis**: Track time between cases handled by the same support agent to understand workload distribution and agent productivity
- **IT Incident Management**: Monitor the interval between tickets assigned to the same technician to balance workload and prevent overallocation
- **Procurement Cycle Analysis**: Measure time between purchase orders from the same supplier to optimize ordering frequency and maintain supplier relationships
- **Banking Transaction Patterns**: Analyze intervals between transactions for the same account or customer to detect unusual patterns or fraud indicators
- **Warehouse Order Processing**: Calculate time between picks from the same location to optimize warehouse layout and reduce travel time
## Settings
**Group By Attribute:** Select the case attribute that defines your grouping category. Cases with the same value in this attribute will be grouped together for analysis. Common choices include resource names (e.g., "Doctor", "Machine", "Agent"), department identifiers, location codes, or any categorical attribute that represents a logical grouping of work. The enrichment will calculate the time from each case's start time to the start time of the previous case within the same group.
**New Attribute Name:** Specify the name for the new duration attribute that will be created. This attribute will contain the time span (in hours) between the current case's start time and the previous case's start time within the same group. Choose a descriptive name that reflects what you're measuring, such as "Time_Since_Last_Patient" or "Interval_Between_Orders". The enrichment will also automatically create a second attribute with "_CaseId" appended to your chosen name, which stores the case ID of the previous case in the group.
**Filter Cases (Optional):** Apply optional filters to limit which cases are included in the calculation. This is useful when you want to analyze only specific types of cases or exclude certain scenarios. For example, you might filter to include only completed cases, exclude cancelled orders, or focus on a specific time period. Cases that don't match the filter criteria will not be included in the grouping or time calculations.
## Examples
### Example 1: Patient Appointment Scheduling Analysis
**Scenario:** A healthcare clinic wants to optimize physician scheduling by understanding the actual time gaps between consecutive patient appointments. They need to identify whether doctors have excessive downtime between patients or if appointments are too tightly scheduled, leading to patient backlogs.
**Settings:**
- **Group By Attribute:** "Physician_Name"
- **New Attribute Name:** "Time_Since_Previous_Appointment"
- **Filter Cases:** None (analyze all appointments)
**Output:**
The enrichment creates two new case attributes:
- **Time_Since_Previous_Appointment:** Contains the duration in hours between the current appointment's start time and the previous patient's appointment start time for the same physician
- **Time_Since_Previous_Appointment_CaseId:** Contains the case ID of the previous patient appointment
Sample data showing the results:
| Case ID | Physician_Name | Appointment_Start | Time_Since_Previous_Appointment | Time_Since_Previous_Appointment_CaseId |
|---------|----------------|-------------------|--------------------------------|----------------------------------------|
| PT-001 | Dr. Smith | 2024-01-15 08:00 | (null) | (null) |
| PT-002 | Dr. Smith | 2024-01-15 08:30 | 0.5 | PT-001 |
| PT-003 | Dr. Smith | 2024-01-15 09:15 | 0.75 | PT-002 |
| PT-004 | Dr. Jones | 2024-01-15 08:00 | (null) | (null) |
| PT-005 | Dr. Smith | 2024-01-15 11:00 | 1.75 | PT-003 |
**Insights:** The clinic can now identify patterns such as Dr. Smith having a 1.75-hour gap between PT-003 and PT-005, suggesting either a scheduled break or an inefficiency in appointment scheduling. By analyzing these intervals across all physicians, the clinic can optimize scheduling templates to reduce wait times while ensuring physicians have adequate time per patient.
### Example 2: Manufacturing Machine Utilization
**Scenario:** A manufacturing plant needs to measure equipment utilization by analyzing the time between consecutive production runs on each machine. This helps identify underutilized assets and optimize production scheduling to maximize throughput.
**Settings:**
- **Group By Attribute:** "Machine_ID"
- **New Attribute Name:** "Machine_Idle_Time"
- **Filter Cases:** Production_Status = "Completed" (exclude cancelled or failed runs)
**Output:**
The enrichment creates:
- **Machine_Idle_Time:** Duration in hours between the current production run start and the previous run start on the same machine
- **Machine_Idle_Time_CaseId:** Case ID of the previous production run
Sample data:
| Case ID | Machine_ID | Run_Start_Time | Product_Type | Machine_Idle_Time | Machine_Idle_Time_CaseId |
|---------|------------|----------------|--------------|-------------------|--------------------------|
| RUN-101 | MCH-A01 | 2024-01-15 06:00 | Widget-X | (null) | (null) |
| RUN-102 | MCH-A01 | 2024-01-15 08:30 | Widget-Y | 2.5 | RUN-101 |
| RUN-103 | MCH-A02 | 2024-01-15 06:00 | Widget-Z | (null) | (null) |
| RUN-104 | MCH-A01 | 2024-01-15 12:00 | Widget-X | 3.5 | RUN-102 |
| RUN-105 | MCH-A02 | 2024-01-15 14:00 | Widget-Y | 8.0 | RUN-103 |
**Insights:** Machine MCH-A02 shows an 8-hour gap between runs, suggesting significant underutilization or potential maintenance issues. MCH-A01 has more consistent utilization with 2.5 to 3.5 hour intervals. Plant managers can use this data to balance production schedules, identify opportunities for additional capacity, or investigate why certain machines have excessive idle time.
### Example 3: Customer Service Agent Workload Analysis
**Scenario:** A customer service center wants to analyze workload distribution across support agents by measuring the time between consecutive cases assigned to each agent. This helps identify whether some agents are overloaded while others have capacity, enabling better case routing decisions.
**Settings:**
- **Group By Attribute:** "Assigned_Agent"
- **New Attribute Name:** "Time_Between_Cases"
- **Filter Cases:** Case_Type = "Support Ticket" (exclude internal tasks)
**Output:**
The enrichment creates:
- **Time_Between_Cases:** Hours between when consecutive cases were assigned to the same agent
- **Time_Between_Cases_CaseId:** Previous case ID for the same agent
Sample data:
| Case ID | Assigned_Agent | Case_Start_Time | Priority | Time_Between_Cases | Time_Between_Cases_CaseId |
|---------|----------------|-----------------|----------|-------------------|---------------------------|
| TKT-501 | Agent_Sarah | 2024-01-15 09:00 | High | (null) | (null) |
| TKT-502 | Agent_Mike | 2024-01-15 09:05 | Medium | (null) | (null) |
| TKT-503 | Agent_Sarah | 2024-01-15 09:15 | Low | 0.25 | TKT-501 |
| TKT-504 | Agent_Sarah | 2024-01-15 09:30 | High | 0.25 | TKT-503 |
| TKT-505 | Agent_Mike | 2024-01-15 11:00 | Medium | 1.92 | TKT-502 |
**Insights:** Agent Sarah is receiving new cases every 15 minutes (0.25 hours), indicating high workload, while Agent Mike has nearly 2 hours between cases, suggesting available capacity. The service center can use this information to rebalance case assignments, ensuring fair workload distribution and optimal response times for customers.
### Example 4: Supplier Order Frequency Analysis
**Scenario:** A procurement department wants to analyze ordering patterns with suppliers to optimize inventory management and supplier relationships. By measuring the time between consecutive purchase orders to the same supplier, they can identify opportunities to consolidate orders or maintain optimal ordering frequencies.
**Settings:**
- **Group By Attribute:** "Supplier_Name"
- **New Attribute Name:** "Days_Since_Last_Order"
- **Filter Cases:** Order_Status = "Approved" (exclude rejected or pending orders)
**Output:**
The enrichment creates:
- **Days_Since_Last_Order:** Time in hours between purchase orders to the same supplier (can be converted to days by dividing by 24)
- **Days_Since_Last_Order_CaseId:** Previous purchase order case ID
Sample data:
| Case ID | Supplier_Name | Order_Date | Total_Amount | Days_Since_Last_Order | Days_Since_Last_Order_CaseId |
|---------|---------------|------------|--------------|----------------------|------------------------------|
| PO-1001 | Acme Corp | 2024-01-05 | $5,000 | (null) | (null) |
| PO-1002 | Beta Supply | 2024-01-08 | $12,000 | (null) | (null) |
| PO-1003 | Acme Corp | 2024-01-12 | $3,200 | 168.0 | PO-1001 |
| PO-1004 | Acme Corp | 2024-01-15 | $4,500 | 72.0 | PO-1003 |
| PO-1005 | Beta Supply | 2024-01-25 | $15,000 | 408.0 | PO-1002 |
**Insights:** The company is ordering from Acme Corp every 3-7 days (72-168 hours), suggesting frequent small orders that might benefit from consolidation to reduce shipping costs. Beta Supply shows 17-day intervals (408 hours), which might be optimal for bulk ordering. Procurement can use this analysis to negotiate volume discounts, optimize ordering frequencies, and maintain healthy supplier relationships.
### Example 5: IT Incident Resolution Queue Management
**Scenario:** An IT department needs to analyze how incidents are distributed across technicians to ensure balanced workloads and prevent technician burnout. By measuring time between consecutive incident assignments, they can identify workload imbalances and optimize ticket routing.
**Settings:**
- **Group By Attribute:** "Assigned_Technician"
- **New Attribute Name:** "Incident_Assignment_Interval"
- **Filter Cases:** Incident_Type != "Informational" (exclude non-actionable tickets)
**Output:**
The enrichment creates:
- **Incident_Assignment_Interval:** Hours between consecutive incident assignments to the same technician
- **Incident_Assignment_Interval_CaseId:** Previous incident case ID
Sample data:
| Case ID | Assigned_Technician | Assignment_Time | Severity | Incident_Assignment_Interval | Incident_Assignment_Interval_CaseId |
|---------|---------------------|-----------------|----------|------------------------------|-------------------------------------|
| INC-201 | Tech_Alex | 2024-01-15 08:00 | Critical | (null) | (null) |
| INC-202 | Tech_Alex | 2024-01-15 08:45 | High | 0.75 | INC-201 |
| INC-203 | Tech_Jordan | 2024-01-15 09:00 | Medium | (null) | (null) |
| INC-204 | Tech_Alex | 2024-01-15 09:30 | Critical | 0.75 | INC-202 |
| INC-205 | Tech_Jordan | 2024-01-15 14:00 | Low | 5.0 | INC-203 |
**Insights:** Tech Alex is receiving critical and high-severity incidents every 45 minutes (0.75 hours), indicating potential overload, while Tech Jordan has 5 hours between assignments. The IT manager can use this data to rebalance incident routing, ensure critical incidents get prompt attention without overwhelming individual technicians, and maintain service quality across the team.
## Output
When this enrichment is executed, it creates two new case attributes for comprehensive temporal and relational analysis:
**Primary Duration Attribute ([Your Specified Name]):**
- **Data Type:** TimeSpan (displayed as decimal hours)
- **Units:** Duration in hours
- **Value:** The time elapsed from the previous case's start time to the current case's start time within the same group
- **First Case in Group:** Null value (no previous case exists in the group)
- **Calculation Method:** Current case start time minus previous case start time, ordered chronologically within each group
**Secondary Case ID Attribute ([Your Specified Name]_CaseId):**
- **Data Type:** String (text)
- **Value:** The case ID of the previous case in the same group
- **First Case in Group:** Null value (no previous case exists)
- **Purpose:** Enables tracing back to the specific previous case for detailed analysis or validation
**Understanding the Output Values:**
Example duration values and their meanings:
- `0.25` = 15 minutes since the previous case in this group
- `2.5` = 2 hours and 30 minutes since the previous case
- `24.0` = Exactly one day (24 hours) since the previous case
- `168.0` = One week (7 days) since the previous case
- `null` = This is the first case in the group, or the case doesn't belong to any group (if the grouping attribute is null)
**Important Grouping Behavior:**
- Cases are grouped based on exact matches of the "Group By Attribute" value
- Within each group, cases are ordered by their start time (earliest to latest)
- Each case is compared only to the immediately previous case in the same group
- Cases with null or blank values in the grouping attribute are not included in any group calculations
- If a filter is applied, only cases matching the filter are considered when determining the "previous" case
**Using the Output Attributes:**
The new attributes can be leveraged across mindzieStudio for powerful analysis:
- **Performance Dashboards:** Create visualizations showing average time between cases by group, identifying which resources have optimal utilization versus excessive idle time
- **Case Filtering:** Filter to cases where the interval is too short (potential overload) or too long (underutilization), enabling targeted process improvements
- **Statistical Analysis:** Calculate statistics like mean, median, and standard deviation of intervals to understand variability in workload distribution
- **Variant Analysis:** Compare process variants based on resource utilization patterns and identify best practices
- **Bottleneck Detection:** Identify groups (resources, departments, locations) with consistently long intervals, suggesting capacity constraints or inefficiencies
- **Trend Analysis:** Track how intervals change over time to measure the impact of process improvements or workload changes
- **Relational Analysis:** Use the _CaseId attribute to create relationships between consecutive cases, enabling deeper investigation of patterns or anomalies
**Integration with Other Enrichments:**
This enrichment works particularly well when combined with:
- **Categorize Attribute Values:** Group intervals into categories like "Normal", "Delayed", "Rushed"
- **Duration Between Two Activities:** Compare inter-case intervals with intra-case durations for comprehensive cycle time analysis
- **Count Activities:** Correlate case complexity (activity count) with inter-case intervals to understand resource capacity
- **Representative Case Attribute:** Pull attributes from the previous case using the _CaseId to compare consecutive case characteristics
## See Also
**Related Time Analysis Enrichments:**
- [Duration Between Two Activities](/mindzie_studio/enrichments/duration-between-two-activities) - Calculate time elapsed between activities within a single case
- [Duration Between an Attribute and an Activity](/mindzie_studio/enrichments/duration-between-an-attribute-and-an-activity) - Measure duration from a case attribute timestamp to an activity
- [Duration Between an Attribute and Current Time](/mindzie_studio/enrichments/duration-between-an-attribute-and-current-time) - Calculate time from a case attribute to the current date
**Related Grouping and Analysis:**
- [Categorize Attribute Values](/mindzie_studio/enrichments/categorize-attribute-values) - Group attribute values into categories for analysis
- [Representative Case Attribute](/mindzie_studio/enrichments/representative-case-attribute) - Extract representative values from grouped cases
- [Count Activities](/mindzie_studio/enrichments/count-activities) - Count activities per case for complexity analysis
**Process Analysis Tools:**
- [Filter Process Log](/mindzie_studio/enrichments/filter-process-log) - Filter cases based on criteria including the new interval attributes
- [Performance Analysis](/mindzie_studio/performance) - Use interval data in performance dashboards and metrics
---
*This documentation is part of the mindzie Studio process mining platform.*
---
## Trim Text
Section: Enrichments
URL: https://docs.mindziestudio.com/mindzie_studio/enrichments/trim-text
Source: /docs-master/mindzieStudio/enrichments/trim-text/page.md
# Trim Text
## Overview
The Trim Text enrichment is a data cleanup operator that automatically removes all leading and trailing whitespace characters from text attributes throughout your dataset. This essential data hygiene tool ensures consistency in text fields by eliminating accidental spaces, tabs, and other invisible characters that can cause issues with data matching, filtering, and analysis. When processing data from various sources like ERP systems, spreadsheets, or manual entry systems, text fields often contain unintentional whitespace that can prevent accurate process mining analysis.
Unlike manual data cleaning approaches, this enrichment processes every text attribute in both case-level and event-level data in a single operation. The enrichment intelligently handles empty strings by converting them to null values, ensuring your dataset maintains proper data integrity. This automatic cleanup is particularly valuable when preparing data for conformance checking, where exact text matches are critical for identifying process patterns and deviations.
## Common Uses
- Clean imported data from ERP systems where fields contain trailing spaces due to fixed-width database columns
- Standardize user-entered text fields from forms or manual data entry systems where operators accidentally add spaces
- Prepare data for accurate matching and filtering operations by ensuring consistent text formatting
- Remove invisible whitespace characters that can cause duplicate-looking values in dropdown filters
- Clean activity names and resource names for accurate process discovery and conformance analysis
- Normalize product codes, customer IDs, and reference numbers that may have inconsistent spacing
- Prepare text attributes for concatenation or joining operations where extra spaces would create formatting issues
## Settings
This enrichment operates automatically on all text attributes without requiring any configuration. It processes every string column in your dataset, applying trimming logic consistently across case attributes and event attributes.
## Examples
### Example 1: Cleaning ERP System Export Data
**Scenario:** A manufacturing company exports order data from their SAP system where product codes and customer names contain trailing spaces due to fixed-width database fields, causing issues with product categorization and customer analysis.
**Before Enrichment:**
| Case ID | Product_Code | Customer_Name | Order_Status |
|---------|--------------|---------------|--------------|
| ORD-001 | "PRD-1234 " | "Acme Corp " | "APPROVED " |
| ORD-002 | " PRD-5678" | " Beta Inc " | "PENDING" |
| ORD-003 | "PRD-1234" | "Acme Corp" | "APPROVED" |
**After Enrichment:**
| Case ID | Product_Code | Customer_Name | Order_Status |
|---------|--------------|---------------|--------------|
| ORD-001 | "PRD-1234" | "Acme Corp" | "APPROVED" |
| ORD-002 | "PRD-5678" | "Beta Inc" | "PENDING" |
| ORD-003 | "PRD-1234" | "Acme Corp" | "APPROVED" |
**Output:** All text attributes are trimmed, removing leading and trailing spaces. Now products PRD-1234 from orders ORD-001 and ORD-003 are correctly identified as the same product, and customer names are consistently formatted.
**Insights:** After trimming, the company discovered that what appeared to be 150 unique product codes was actually only 95 distinct products. This accurate data enabled proper inventory analysis and revealed that Acme Corp accounted for 40% more orders than initially calculated due to proper name matching.
### Example 2: Standardizing Manual Entry Data in Healthcare
**Scenario:** A hospital's patient admission system has activity names and department fields with inconsistent spacing from manual data entry, preventing accurate process flow analysis and department utilization metrics.
**Event Data Before:**
| Case ID | Activity | Department | Resource |
|---------|----------|------------|----------|
| PAT-101 | " Patient Registration" | "Emergency " | "Nurse Johnson " |
| PAT-101 | "Triage " | " Emergency" | "Dr. Smith" |
| PAT-102 | "Patient Registration" | "Emergency" | " Nurse Johnson" |
**Event Data After:**
| Case ID | Activity | Department | Resource |
|---------|----------|------------|----------|
| PAT-101 | "Patient Registration" | "Emergency" | "Nurse Johnson" |
| PAT-101 | "Triage" | "Emergency" | "Dr. Smith" |
| PAT-102 | "Patient Registration" | "Emergency" | "Nurse Johnson" |
**Output:** Activity names, departments, and resource names are standardized by removing all extra spaces. The process flow now correctly shows a single "Patient Registration" activity instead of appearing as two different activities.
**Insights:** The cleanup revealed the true patient flow through the emergency department, showing that 100% of patients follow the same initial registration process. Resource utilization reports now accurately show Nurse Johnson handles 75% of registrations instead of appearing as two different resources.
### Example 3: Cleaning Financial Transaction Data
**Scenario:** A bank's loan processing system exports transaction types and approval codes with various whitespace issues from different branch systems, making it impossible to accurately track approval patterns and process compliance.
**Case Attributes Before:**
| Loan_ID | Loan_Type | Branch_Code | Approval_Level |
|---------|-----------|-------------|----------------|
| LN-5001 | "Personal Loan " | " NYC-01 " | "Manager " |
| LN-5002 | " Personal Loan" | "NYC-01" | "Manager" |
| LN-5003 | " Business Loan " | " LA-02" | " Director " |
**Case Attributes After:**
| Loan_ID | Loan_Type | Branch_Code | Approval_Level |
|---------|-----------|-------------|----------------|
| LN-5001 | "Personal Loan" | "NYC-01" | "Manager" |
| LN-5002 | "Personal Loan" | "NYC-01" | "Manager" |
| LN-5003 | "Business Loan" | "LA-02" | "Director" |
**Output:** All loan types, branch codes, and approval levels are consistently formatted. Personal Loans from LN-5001 and LN-5002 are now correctly grouped together, and branch codes are standardized for accurate regional analysis.
**Insights:** After cleaning, the bank discovered that Personal Loans represented 65% of their portfolio instead of the reported 43%, as various spacing variations had been counted as different loan types. This enabled proper risk assessment and resource allocation for their dominant product line.
### Example 4: Normalizing Procurement Process Data
**Scenario:** A procurement system combines data from multiple vendor platforms where vendor names, material categories, and purchase order statuses contain inconsistent whitespace, preventing accurate spend analysis and vendor performance tracking.
**Before Enrichment:**
| PO_Number | Vendor_Name | Material_Category | Status |
|-----------|-------------|-------------------|---------|
| PO-8001 | "TechSupply Inc " | " Electronics " | "Delivered " |
| PO-8002 | " TechSupply Inc" | "Electronics" | " Delivered" |
| PO-8003 | "TechSupply Inc" | " Electronics" | "Pending" |
**After Enrichment:**
| PO_Number | Vendor_Name | Material_Category | Status |
|-----------|-------------|-------------------|---------|
| PO-8001 | "TechSupply Inc" | "Electronics" | "Delivered" |
| PO-8002 | "TechSupply Inc" | "Electronics" | "Delivered" |
| PO-8003 | "TechSupply Inc" | "Electronics" | "Pending" |
**Output:** Vendor names and material categories are standardized across all purchase orders. All three orders are now correctly associated with the same vendor and category.
**Insights:** The cleanup revealed that TechSupply Inc was actually the company's largest vendor with $2.3M in annual spend, not the three separate smaller vendors previously reported. This consolidation enabled better vendor negotiations and identified opportunities for volume discounts.
### Example 5: Cleaning Activity Names for Process Discovery
**Scenario:** A logistics company's shipment tracking system has activity names with various spacing issues from different scanning devices and manual entries, making process discovery show fragmented and incorrect process flows.
**Event Log Before:**
| Case_ID | Activity | Location | Timestamp |
|---------|----------|----------|-----------|
| SHIP-901 | "Package Received " | "Warehouse A " | 2024-01-10 08:00 |
| SHIP-901 | " Sorting" | "Warehouse A" | 2024-01-10 09:00 |
| SHIP-902 | "Package Received" | " Warehouse A" | 2024-01-10 08:30 |
| SHIP-902 | "Sorting " | "Warehouse A " | 2024-01-10 09:30 |
**Event Log After:**
| Case_ID | Activity | Location | Timestamp |
|---------|----------|----------|-----------|
| SHIP-901 | "Package Received" | "Warehouse A" | 2024-01-10 08:00 |
| SHIP-901 | "Sorting" | "Warehouse A" | 2024-01-10 09:00 |
| SHIP-902 | "Package Received" | "Warehouse A" | 2024-01-10 08:30 |
| SHIP-902 | "Sorting" | "Warehouse A" | 2024-01-10 09:30 |
**Output:** All activity names and locations are trimmed to remove whitespace variations. The process now shows a clean, linear flow of Package Received followed by Sorting for all shipments.
**Insights:** Process discovery now correctly shows a standard two-step process for all packages instead of eight different activity variations. This revealed that 100% of packages follow the same initial handling process, enabling the company to standardize training and optimize resource allocation at Warehouse A.
## Output
The Trim Text enrichment modifies existing text attributes in place rather than creating new attributes. All string-type columns in your dataset are automatically processed, including both case-level attributes and event-level attributes. The enrichment applies the following transformations:
**Text Processing Rules:**
- Removes all leading whitespace (spaces, tabs, and other invisible characters at the start of text)
- Removes all trailing whitespace (spaces, tabs, and other invisible characters at the end of text)
- Preserves internal spaces within the text (only beginning and end are trimmed)
- Converts empty strings (strings that become empty after trimming) to null values
- Leaves already-trimmed text unchanged for optimal performance
- Skips non-text attributes (numbers, dates, booleans remain untouched)
- Processes hidden columns are not modified to preserve system data
The enrichment works seamlessly with other mindzieStudio features. Trimmed text attributes can be immediately used in filters for accurate matching, in calculators for precise concatenation operations, and in other enrichments that depend on consistent text formatting. Since the enrichment modifies data in place, all existing visualizations, dashboards, and analyses automatically benefit from the cleaned data without requiring any reconfiguration.
For downstream processing, the cleaned text ensures that conformance checking operators correctly identify matching activities, lookup enrichments find accurate matches across datasets, and group-by operations properly aggregate related cases. The null conversion for empty strings prevents issues with database operations and ensures that empty values are handled consistently throughout the platform.
---
*This documentation is part of the mindzie Studio process mining platform.*
---
## Undesired Activity
Section: Enrichments
URL: https://docs.mindziestudio.com/mindzie_studio/enrichments/undesired-activity
Source: /docs-master/mindzieStudio/enrichments/undesired-activity/page.md
# Undesired Activity
## Overview
The Undesired Activity enrichment identifies cases where specific activities occur that should not be present in your process according to your business rules or compliance requirements. This powerful conformance checking tool helps you detect unauthorized actions, policy violations, deprecated procedures, or activities that indicate potential fraud or system misuse.
Unlike other conformance enrichments that look for missing or repeated activities, this enrichment focuses on detecting the presence of activities that should never occur in a compliant process. For instance, manual overrides in an automated approval system, emergency procedures used in normal operations, or deprecated activities that were supposed to be phased out but are still being executed.
## Common Uses
- Detect unauthorized manual interventions in automated processes
- Identify use of deprecated or obsolete activities that should have been retired
- Monitor for policy violations such as bypassing required approval steps
- Flag potential fraud indicators like unusual refund activities or account modifications
- Track emergency procedures being used in non-emergency situations
- Identify test activities accidentally executed in production environments
- Detect workarounds that bypass standard process controls
## Settings
**Rule Group Name:** Enter a descriptive name for this conformance rule group. This name serves as a prefix for all attributes created by this enrichment and appears in conformance reports. Choose a name that clearly indicates what type of undesired behavior you're monitoring, such as "Unauthorized Activities", "Deprecated Procedures", or "Policy Violations".
**Severity:** Select the severity level for cases where undesired activities are detected:
- **Low:** Minor process deviations that should be monitored but don't require immediate action
- **Medium:** Significant conformance issues that require investigation and corrective action
- **High:** Critical violations that may indicate fraud, compliance failures, or serious process breakdowns
**Activity Attribute Values:** Select one or more activities from your event log that should not occur in compliant cases. The enrichment will create a separate boolean attribute for each selected activity, allowing you to track different types of violations independently. Activities are displayed with their frequency statistics to help you identify which undesired activities are most prevalent.
## Examples
### Example 1: Financial Process Compliance
**Scenario:** A financial services company needs to ensure that certain high-risk activities don't occur in their standard payment processing workflow, as these could indicate fraud attempts or policy violations.
**Settings:**
- Rule Group Name: "Prohibited Payment Activities"
- Severity: High
- Activity Attribute Values:
- "Manual Override Payment Limit"
- "Bypass Fraud Check"
- "Emergency Fund Release"
- "Delete Payment Record"
**Output:**
The enrichment creates four new boolean attributes:
- "Prohibited Payment Activities: Manual Override Payment Limit"
- "Prohibited Payment Activities: Bypass Fraud Check"
- "Prohibited Payment Activities: Emergency Fund Release"
- "Prohibited Payment Activities: Delete Payment Record"
Cases where any of these activities occur are marked as TRUE for the corresponding attribute and flagged as high-severity conformance violations.
**Insights:** The company can now quickly identify and investigate cases where critical security controls were bypassed, enabling them to detect potential fraud attempts and ensure compliance with financial regulations.
### Example 2: Healthcare Process Monitoring
**Scenario:** A hospital wants to monitor for deprecated procedures in their patient admission process that were supposed to be eliminated after implementing a new electronic health records system.
**Settings:**
- Rule Group Name: "Deprecated Admission Steps"
- Severity: Medium
- Activity Attribute Values:
- "Paper Form Submission"
- "Manual Insurance Verification"
- "Fax Medical Records"
- "Phone-based Appointment Booking"
**Output:**
Creates boolean attributes for each deprecated activity, marking cases as TRUE when these old procedures are still being used despite the new system implementation.
**Insights:** The hospital can identify departments or staff members still using old procedures, enabling targeted training and ensuring complete adoption of the new electronic systems.
### Example 3: Manufacturing Quality Control
**Scenario:** A manufacturing company needs to ensure that certain emergency procedures are only used in actual emergencies and not as shortcuts in regular production.
**Settings:**
- Rule Group Name: "Emergency Procedures Misuse"
- Severity: Medium
- Activity Attribute Values:
- "Emergency Quality Override"
- "Skip Safety Inspection"
- "Bypass Calibration Check"
- "Emergency Material Release"
**Output:**
The enrichment flags cases where emergency procedures were invoked, allowing the company to verify whether these were legitimate emergencies or inappropriate shortcuts.
**Insights:** By tracking the use of emergency procedures, the company can identify production lines or shifts that may be cutting corners on quality and safety protocols, enabling corrective action before serious issues arise.
### Example 4: IT Service Management
**Scenario:** An IT department wants to detect when deprecated or insecure practices are still being used in their incident resolution process.
**Settings:**
- Rule Group Name: "Insecure IT Practices"
- Severity: High
- Activity Attribute Values:
- "Grant Admin Access Without Approval"
- "Direct Database Modification"
- "Bypass Change Management"
- "Use Shared Admin Account"
**Output:**
Creates conformance attributes that flag cases where insecure or non-compliant IT practices occurred, marking them as high-severity violations.
**Insights:** The IT department can quickly identify and address security vulnerabilities in their processes, ensuring compliance with IT governance policies and reducing the risk of security breaches.
### Example 5: Procurement Compliance
**Scenario:** A procurement department needs to monitor for activities that violate purchasing policies, such as splitting orders to avoid approval thresholds or using non-preferred vendors.
**Settings:**
- Rule Group Name: "Procurement Violations"
- Severity: Medium
- Activity Attribute Values:
- "Split Purchase Order"
- "Use Non-Contracted Vendor"
- "Retroactive Purchase Approval"
- "Skip Competitive Bidding"
**Output:**
The enrichment creates boolean attributes for each violation type, allowing the procurement team to track different types of policy violations separately.
**Insights:** The organization can identify patterns of non-compliance in their procurement process, enabling them to strengthen controls, provide targeted training, and ensure adherence to procurement policies.
## Output
The Undesired Activity enrichment creates multiple case-level attributes in your dataset:
**Group Attribute:** A master boolean attribute named after your Rule Group Name that indicates whether ANY undesired activity occurred in the case. This provides a quick way to filter all non-compliant cases regardless of which specific activity triggered the violation.
**Individual Activity Attributes:** For each selected activity, a separate boolean attribute is created with the naming pattern "[Rule Group Name]: [Activity Name]". These attributes allow you to track specific types of violations independently.
**Attribute Values:**
- TRUE: The undesired activity occurred in this case (conformance violation detected)
- FALSE: The undesired activity did not occur (case is compliant for this activity)
**Conformance Issue Registration:** Each detected violation is registered in the system's conformance issue list with the specified severity level, enabling integration with conformance dashboards and automated alerting systems.
These attributes can be used in filters to isolate non-compliant cases, in calculators to measure violation rates, and in visualizations to show patterns of non-compliance across your process. The enrichment also updates activity statistics to reflect their conformance status, making it easy to identify which undesired activities are most problematic.
---
*This documentation is part of the mindzie Studio process mining platform.*
---
## Upper Case
Section: Enrichments
URL: https://docs.mindziestudio.com/mindzie_studio/enrichments/upper-case
Source: /docs-master/mindzieStudio/enrichments/upper-case/page.md
# Upper Case
## Overview
The Upper Case enrichment is a data standardization operator that converts all text values in selected attributes to uppercase letters throughout your dataset. This transformation ensures consistent text formatting across your process data, enabling reliable case-insensitive matching, filtering, and analysis operations. When working with data from multiple sources where text case varies inconsistently - such as customer names entered differently across systems or product codes with mixed capitalization - this enrichment creates uniform uppercase formatting that eliminates case-related data quality issues.
By standardizing text to uppercase, this enrichment addresses common challenges in process mining where the same entity appears different due to capitalization variations. For example, customer names like "Acme Corp", "ACME CORP", and "acme corp" would be treated as three distinct values without standardization, fragmenting your analysis. The Upper Case enrichment ensures these variations are unified, providing accurate metrics for customer analysis, product categorization, and resource utilization. This standardization is particularly critical when preparing data for conformance checking, where consistent activity names and attributes are essential for pattern recognition.
The enrichment processes string attributes at the case level, transforming every text value while preserving the original data structure. Unlike manual text manipulation that risks errors and inconsistencies, this automated approach ensures every instance of the selected attribute is transformed uniformly across all cases in your dataset.
## Common Uses
- Standardize customer names and company identifiers for accurate customer journey analysis and segmentation
- Normalize product codes and SKUs that may have inconsistent capitalization across different systems
- Prepare text attributes for case-insensitive matching when joining data from multiple sources
- Create consistent activity names for process discovery when source systems use different capitalization conventions
- Standardize location codes, department names, and organizational units for accurate resource analysis
- Format reference numbers and identifiers consistently for reliable filtering and grouping operations
- Prepare text data for integration with external systems that require uppercase formatting
## Settings
**Attribute Name:** Select the text attribute whose values you want to convert to uppercase. The dropdown list shows all available text (string) attributes in your dataset, excluding hidden columns. You must select exactly one attribute to transform. The enrichment will process every value in the selected attribute across all cases, converting lowercase and mixed-case text to uppercase while leaving already uppercase text unchanged. Only attributes with string data type are available for selection.
## Examples
### Example 1: Standardizing Customer Names in Order Processing
**Scenario:** A distribution company's order management system contains customer names with inconsistent capitalization from different data entry points - web orders, phone orders, and EDI transmissions - causing fragmented customer analysis and inaccurate order volume calculations.
**Settings:**
- Attribute Name: Customer_Name
**Before Enrichment:**
| Case ID | Customer_Name | Order_Value | Region |
|---------|--------------|-------------|---------|
| ORD-001 | Acme Corporation | 15000 | North |
| ORD-002 | ACME CORPORATION | 22000 | North |
| ORD-003 | acme corporation | 18500 | North |
| ORD-004 | Beta Industries | 9500 | South |
| ORD-005 | BETA INDUSTRIES | 11000 | South |
**After Enrichment:**
| Case ID | Customer_Name | Order_Value | Region |
|---------|--------------|-------------|---------|
| ORD-001 | ACME CORPORATION | 15000 | North |
| ORD-002 | ACME CORPORATION | 22000 | North |
| ORD-003 | ACME CORPORATION | 18500 | North |
| ORD-004 | BETA INDUSTRIES | 9500 | South |
| ORD-005 | BETA INDUSTRIES | 11000 | South |
**Output:** All values in the Customer_Name attribute are converted to uppercase. The three variations of "Acme Corporation" are now unified as "ACME CORPORATION", and both variations of "Beta Industries" are standardized to "BETA INDUSTRIES".
**Insights:** After standardization, the company discovered that Acme Corporation actually represented 55,500 in total orders (not three separate customers with individual orders), making them the largest account. This accurate view enabled proper account prioritization and revealed that 30% of revenue came from customers whose names had capitalization variations.
### Example 2: Normalizing Product Codes in Manufacturing
**Scenario:** A manufacturing plant's quality control system tracks defects by product code, but codes are entered with different capitalization patterns by operators across three shifts, preventing accurate defect rate analysis by product.
**Settings:**
- Attribute Name: Product_Code
**Before Enrichment:**
| Case ID | Product_Code | Defect_Type | Shift | Severity |
|---------|-------------|-------------|-------|----------|
| QC-001 | prd-A1234 | Surface | Day | Minor |
| QC-002 | PRD-A1234 | Surface | Night | Minor |
| QC-003 | Prd-A1234 | Dimension | Evening | Major |
| QC-004 | prd-b5678 | Assembly | Day | Critical |
| QC-005 | PRD-B5678 | Assembly | Night | Critical |
**After Enrichment:**
| Case ID | Product_Code | Defect_Type | Shift | Severity |
|---------|-------------|-------------|-------|----------|
| QC-001 | PRD-A1234 | Surface | Day | Minor |
| QC-002 | PRD-A1234 | Surface | Night | Minor |
| QC-003 | PRD-A1234 | Dimension | Evening | Major |
| QC-004 | PRD-B5678 | Assembly | Day | Critical |
| QC-005 | PRD-B5678 | Assembly | Night | Critical |
**Output:** All Product_Code values are converted to uppercase. The three variations of product A1234 are unified as "PRD-A1234", and both variations of product B5678 are standardized as "PRD-B5678".
**Insights:** Standardization revealed that product PRD-A1234 had a 60% defect rate across all shifts (3 defects from 5 production runs), triggering an immediate quality investigation. Previously, each capitalization variant appeared to have acceptable defect rates when analyzed separately.
### Example 3: Standardizing Department Codes in Healthcare
**Scenario:** A hospital's patient flow system uses department codes that staff enter with inconsistent capitalization, making it impossible to accurately track patient wait times and department utilization across the facility.
**Settings:**
- Attribute Name: Department_Code
**Before Enrichment:**
| Case ID | Patient_ID | Department_Code | Wait_Time | Priority |
|---------|-----------|----------------|-----------|----------|
| ADM-001 | P1234 | ER-main | 45 | High |
| ADM-002 | P1235 | er-Main | 38 | High |
| ADM-003 | P1236 | ER-MAIN | 52 | Critical |
| ADM-004 | P1237 | icu-west | 15 | Medium |
| ADM-005 | P1238 | ICU-West | 18 | Low |
**After Enrichment:**
| Case ID | Patient_ID | Department_Code | Wait_Time | Priority |
|---------|-----------|----------------|-----------|----------|
| ADM-001 | P1234 | ER-MAIN | 45 | High |
| ADM-002 | P1235 | ER-MAIN | 38 | High |
| ADM-003 | P1236 | ER-MAIN | 52 | Critical |
| ADM-004 | P1237 | ICU-WEST | 15 | Medium |
| ADM-005 | P1238 | ICU-WEST | 18 | Low |
**Output:** All Department_Code values are standardized to uppercase. The three variations of the emergency room code are unified as "ER-MAIN", and ICU west variations become "ICU-WEST".
**Insights:** After standardization, the hospital identified that the ER-MAIN department had an average wait time of 45 minutes across all patients, exceeding the 30-minute target. This accurate departmental view enabled resource reallocation that reduced wait times by 25%.
### Example 4: Unifying Region Codes in Logistics
**Scenario:** A logistics company's shipment tracking system contains region codes with mixed capitalization from different booking channels, preventing accurate regional performance analysis and route optimization.
**Settings:**
- Attribute Name: Region_Code
**Before Enrichment:**
| Case ID | Shipment_ID | Region_Code | Delivery_Days | Service_Type |
|---------|------------|-------------|---------------|--------------|
| SHP-001 | S1234 | na-west | 3 | Express |
| SHP-002 | S1235 | NA-WEST | 2 | Express |
| SHP-003 | S1236 | Na-West | 4 | Standard |
| SHP-004 | S1237 | eu-central | 5 | Standard |
| SHP-005 | S1238 | EU-Central | 6 | Economy |
**After Enrichment:**
| Case ID | Shipment_ID | Region_Code | Delivery_Days | Service_Type |
|---------|------------|-------------|---------------|--------------|
| SHP-001 | S1234 | NA-WEST | 3 | Express |
| SHP-002 | S1235 | NA-WEST | 2 | Express |
| SHP-003 | S1236 | NA-WEST | 4 | Standard |
| SHP-004 | S1237 | EU-CENTRAL | 5 | Standard |
| SHP-005 | S1238 | EU-CENTRAL | 6 | Economy |
**Output:** All Region_Code values are converted to uppercase, unifying the different capitalizations into consistent region identifiers.
**Insights:** Standardization revealed that NA-WEST region averaged 3 days for all deliveries, meeting SLA requirements. Previously scattered data suggested some regions were underperforming due to the fragmented analysis from capitalization variants.
### Example 5: Normalizing Status Codes in Financial Processing
**Scenario:** A bank's loan processing system has status codes that agents enter with varying capitalization, making it difficult to track loan pipeline stages and identify process bottlenecks accurately.
**Settings:**
- Attribute Name: Status_Code
**Before Enrichment:**
| Case ID | Loan_ID | Status_Code | Amount | Days_In_Status |
|---------|---------|------------|--------|----------------|
| LN-001 | L1234 | approved | 50000 | 2 |
| LN-002 | L1235 | APPROVED | 75000 | 3 |
| LN-003 | L1236 | Approved | 45000 | 2 |
| LN-004 | L1237 | pending | 100000 | 5 |
| LN-005 | L1238 | PENDING | 85000 | 7 |
**After Enrichment:**
| Case ID | Loan_ID | Status_Code | Amount | Days_In_Status |
|---------|---------|------------|--------|----------------|
| LN-001 | L1234 | APPROVED | 50000 | 2 |
| LN-002 | L1235 | APPROVED | 75000 | 3 |
| LN-003 | L1236 | APPROVED | 45000 | 2 |
| LN-004 | L1237 | PENDING | 100000 | 5 |
| LN-005 | L1238 | PENDING | 85000 | 7 |
**Output:** All Status_Code values are standardized to uppercase, consolidating status variations into consistent values for accurate pipeline analysis.
**Insights:** After standardization, the bank discovered that 170,000 in loans (not 50,000 as previously thought) were in approved status, requiring immediate funding arrangement. The pending status showed 185,000 in applications averaging 6 days in review, highlighting the need for additional underwriting resources.
## Output
The Upper Case enrichment modifies the selected text attribute in-place, converting all string values to uppercase letters. The transformation affects only the chosen attribute while preserving all other attributes unchanged. The enrichment handles all standard text characters, converting lowercase letters (a-z) to their uppercase equivalents (A-Z) while leaving uppercase letters, numbers, special characters, and symbols unchanged.
The modified attribute retains its original column name and position in your dataset structure. All case-level data relationships are preserved, and the attribute remains available for use in filters, calculators, and other enrichments. Empty strings and null values are handled appropriately - null values remain null, while empty strings remain empty strings.
After applying this enrichment, the standardized uppercase text enables reliable case-insensitive operations throughout mindzie Studio. You can confidently use the transformed attribute in conformance checking, where consistent text matching is critical. The uppercase values work seamlessly with other text-based enrichments like Trim Text or Replace Text, and support accurate grouping in calculators and filters.
## See Also
- **Trim Text** - Remove leading and trailing whitespace from text attributes
- **Text Start** - Extract a specified number of characters from the beginning of text values
- **Text End** - Extract a specified number of characters from the end of text values
- **Replace Text** - Replace specific text patterns within attribute values
- **Limit Text Length** - Truncate text attributes to a maximum character length
- **Categorize Attribute Values** - Group text values into categories based on patterns or rules
---
*This documentation is part of the mindzie Studio process mining platform.*
---
## Wrong Activity Order
Section: Enrichments
URL: https://docs.mindziestudio.com/mindzie_studio/enrichments/wrong-activity-order
Source: /docs-master/mindzieStudio/enrichments/wrong-activity-order/page.md
# Wrong Activity Order
## Overview
The Wrong Activity Order enrichment identifies cases where two specific activities occur in an incorrect sequence, marking them as conformance violations in your process. This powerful conformance checking tool helps organizations ensure that critical process steps follow the prescribed order, detecting when activities that should occur in a particular sequence are executed out of order. By creating conformance attributes and marking affected cases, this enrichment enables you to quantify process compliance, identify training needs, and discover systemic issues that lead to incorrect activity sequencing.
This enrichment goes beyond simple sequence checking by providing flexible severity levels and rule grouping capabilities, allowing you to categorize different types of ordering violations based on their business impact. Whether you're ensuring regulatory compliance, maintaining quality standards, or optimizing process efficiency, the Wrong Activity Order enrichment helps you identify and quantify cases where the expected activity flow is not followed. The enrichment creates both individual rule attributes and group-level attributes, making it easy to analyze conformance at different levels of granularity.
## Common Uses
- Detect when approval activities occur after execution activities in procurement processes
- Identify cases where quality checks happen after product shipment in manufacturing
- Monitor compliance violations where verification steps are skipped or performed out of order
- Track instances where payment is processed before order confirmation in e-commerce
- Identify medical procedures performed before required diagnostic tests in healthcare
- Detect regulatory violations where required reviews occur after document submission
- Monitor training compliance where certification occurs before completion of required modules
## Settings
**Activity 1:** Select the first activity in the expected sequence from the dropdown list of all activities in your dataset. This is the activity that should occur first in the correct process flow. For example, in a purchase order process, this might be "PO Approval" which should happen before "PO Released". The dropdown shows all unique activities found in your event log.
**Activity 2:** Select the second activity that should follow Activity 1 in the correct sequence. This dropdown also contains all activities from your dataset. The enrichment will flag cases where Activity 2 occurs but Activity 1 either doesn't occur at all or occurs after Activity 2. For instance, if Activity 1 is "PO Approval" and Activity 2 is "PO Released", cases where "PO Released" happens before "PO Approval" will be marked as violations.
**Rule Name:** Specify a unique name for this specific conformance rule. This becomes a new boolean case attribute that will be set to true for cases violating this specific ordering rule. Use descriptive names that clearly indicate the violation being detected, such as "Approval After Release" or "QC After Shipment". If left empty, only the Rule Group Name attribute will be created. Each rule name represents a specific ordering violation you want to track separately.
**Rule Group Name:** Define a category name for grouping related conformance rules. This creates another boolean case attribute that will be true for any case violating rules in this group. Default value is "Activity Order Issue". Use this to group related ordering violations together, such as "Approval Violations" for all approval-related sequence issues or "Quality Process Violations" for quality control ordering problems. This allows for both detailed and aggregated conformance analysis.
**Severity:** Choose the severity level for this conformance violation from the dropdown:
- **Low**: Minor deviations with minimal business impact
- **Medium**: Moderate violations requiring attention but not critical
- **High**: Serious violations with significant business or compliance impact (default)
- **Critical**: Severe violations requiring immediate correction
The severity level affects how violations are displayed in process maps and conformance dashboards, helping prioritize remediation efforts.
## Examples
### Example 1: Purchase Order Approval Compliance
**Scenario:** A procurement department needs to ensure that all purchase orders are approved before they are released to vendors, as releasing unapproved orders violates company policy and can lead to unauthorized spending.
**Settings:**
- Activity 1: PO Approved
- Activity 2: PO Released to Vendor
- Rule Name: Unapproved PO Release
- Rule Group Name: Procurement Compliance
- Severity: High
**Output:**
The enrichment creates two new boolean case attributes:
- "Unapproved PO Release": true for cases where PO was released without prior approval
- "Procurement Compliance": true for any procurement-related conformance violation
Sample data shows:
- Case PO-2024-001: Both attributes false (compliant - approved then released)
- Case PO-2024-002: Both attributes true (violation - released without approval)
- Case PO-2024-003: Both attributes true (violation - released before approval)
**Insights:** Analysis reveals that 8% of purchase orders are released without proper approval, primarily occurring during month-end rush periods. This insight leads to implementing automated approval reminders and blocking releases for unapproved orders in the system.
### Example 2: Manufacturing Quality Control
**Scenario:** A manufacturing facility must ensure that quality inspection occurs before products are packaged, as packaging uninspected items can lead to customer complaints and recalls.
**Settings:**
- Activity 1: Quality Inspection Completed
- Activity 2: Product Packaged
- Rule Name: Package Before Inspection
- Rule Group Name: Quality Process Violations
- Severity: Critical
**Output:**
Creates conformance attributes marking violations:
- "Package Before Inspection": Identifies specific QC sequence violations
- "Quality Process Violations": Aggregates all quality-related conformance issues
Production batch results:
- Batch A-500: Compliant (inspected at 09:00, packaged at 10:30)
- Batch A-501: Violation (packaged at 08:45, inspected at 11:00)
- Batch A-502: Violation (packaged without any inspection)
**Insights:** The enrichment reveals that 3% of batches are packaged before inspection, typically during shift changes. This leads to implementing packaging system locks that require inspection confirmation before allowing packaging operations.
### Example 3: Healthcare Treatment Protocol
**Scenario:** A hospital needs to ensure that informed consent is obtained before surgical procedures begin, as performing surgery without consent violates medical ethics and legal requirements.
**Settings:**
- Activity 1: Informed Consent Signed
- Activity 2: Surgery Started
- Rule Name: Surgery Without Consent
- Rule Group Name: Medical Protocol Violations
- Severity: Critical
**Output:**
Generates conformance tracking attributes:
- "Surgery Without Consent": Flags cases with consent sequence violations
- "Medical Protocol Violations": Tracks all medical protocol breaches
Patient case analysis:
- Patient 1001: Compliant (consent at 07:30, surgery at 09:00)
- Patient 1002: Violation (emergency surgery at 14:00, consent obtained post-operation at 16:00)
- Patient 1003: Compliant (consent at previous visit, surgery as scheduled)
**Insights:** While most surgeries follow proper consent protocols, emergency procedures sometimes bypass standard consent processes. This leads to implementing specific emergency consent procedures and documentation requirements.
### Example 4: Financial Services Loan Processing
**Scenario:** A bank must ensure that credit checks are completed before loan approvals are granted, as approving loans without proper credit assessment increases default risk and violates regulatory requirements.
**Settings:**
- Activity 1: Credit Check Completed
- Activity 2: Loan Approved
- Rule Name: Approval Without Credit Check
- Rule Group Name: Lending Compliance
- Severity: High
**Output:**
Creates compliance tracking attributes:
- "Approval Without Credit Check": Identifies loans approved without credit verification
- "Lending Compliance": Aggregates all lending-related compliance issues
Loan application results:
- Loan 2024-0101: Compliant (credit check completed, then approved)
- Loan 2024-0102: Violation (approved before credit check was run)
- Loan 2024-0103: Violation (approved with no credit check activity)
**Insights:** The analysis uncovers that 2% of loans are approved without proper credit checks, primarily for existing customers with assumed good standing. This finding prompts policy updates requiring credit checks for all loans regardless of customer history.
### Example 5: IT Change Management
**Scenario:** An IT department needs to ensure that change approval occurs before implementation in production systems, as unauthorized changes can cause system instability and security vulnerabilities.
**Settings:**
- Activity 1: Change Approved by CAB
- Activity 2: Deployed to Production
- Rule Name: Unauthorized Deployment
- Rule Group Name: Change Management Violations
- Severity: Medium
**Output:**
Produces change management conformance attributes:
- "Unauthorized Deployment": Flags changes deployed without CAB approval
- "Change Management Violations": Groups all change process violations
Change ticket analysis:
- CHG-0001: Compliant (CAB approval Monday, deployment Wednesday)
- CHG-0002: Violation (emergency deployment Saturday, CAB approval Monday)
- CHG-0003: Violation (deployed without any CAB review)
**Insights:** The enrichment reveals that 5% of changes bypass the approval process, mostly during weekend emergency fixes. This leads to establishing an emergency change approval process with expedited CAB review procedures.
## Output
The Wrong Activity Order enrichment creates new boolean case attributes that mark conformance violations in your dataset:
**Individual Rule Attributes:** If a Rule Name is specified, a new boolean case attribute with that name is created. This attribute is set to true for all cases where the specified activity ordering violation occurs (Activity 2 happens without Activity 1 occurring first). The attribute uses a Yes/No display format for easy interpretation in dashboards and reports.
**Rule Group Attributes:** The Rule Group Name creates another boolean case attribute that aggregates violations across multiple related rules. This attribute is true for any case that violates any rule within the group, enabling both detailed and summary conformance analysis.
**Conformance Issue Registration:** The enrichment registers the violation in the system's conformance issue list with the specified severity level. This integration ensures that violations appear in conformance dashboards, process maps with violation highlighting, and conformance reports.
**Edge Information Updates:** The enrichment updates edge information between the two activities, marking the edge as non-conformant with the specified severity. This affects how the process flow is visualized in process maps, with violation edges typically shown in red or with warning indicators.
These attributes can be used in subsequent filters to isolate non-conformant cases, in calculators to compute conformance rates and trends, and in other enrichments that depend on conformance status. The boolean nature of the attributes makes them ideal for creating conformance KPIs, such as calculating the percentage of cases with ordering violations or tracking conformance improvement over time.
## See Also
- **Undesired Activity** - Detect activities that should not occur in your process
- **Allowed Case Start Activities** - Ensure cases begin with approved activities
- **Allowed Case End Activities** - Verify cases end with proper completion activities
- **Repeated Activity** - Identify unwanted activity repetitions
- **Conformance Issue** - Create custom conformance rules with complex logic
---
*This documentation is part of the mindzie Studio process mining platform.*
---
## Duplicate Cases in Log
Section: Enrichments
URL: https://docs.mindziestudio.com/mindzie_studio/enrichments/duplicate-cases-in-log
Source: /docs-master/mindzieStudio/enrichments/duplicate-cases-in-log/page.md
# Duplicate Cases in Log
## Overview
The Duplicate Cases in Log enrichment creates physical copies of existing cases within your event log. This is a specialized administrator-only tool designed for testing purposes, allowing you to quickly expand your dataset by duplicating cases with modified case IDs. Each duplicated case retains all original events and attributes but receives a new unique identifier to distinguish it from the source case.
This enrichment is particularly useful when you need to test how your process mining analysis, filters, or dashboards perform with larger datasets, or when you want to create synthetic data for training and demonstration purposes.
**Note:** This enrichment is available only to administrators due to its significant impact on data volume and its intended use for testing and development scenarios rather than production analysis.
## Common Uses
- Expand small test datasets to simulate production-scale data volumes
- Create stress-test scenarios for performance evaluation of dashboards and calculators
- Generate duplicate data for testing filter behavior with larger case counts
- Prepare demonstration datasets with sufficient volume for training purposes
- Test system performance and response times with increased data loads
- Validate that enrichments and calculations handle large datasets correctly
## Settings
**Number of Copies:** Specify how many copies of each case to create. For example, setting this to 5 will result in each original case being duplicated 5 times, effectively multiplying your total case count by 6 (original plus 5 copies). The default value is 1, which doubles your dataset.
## Example
### Dataset Expansion for Performance Testing
**Scenario:** You have a process log with 100 cases and need to test how your dashboard performs with 1,000 cases before deploying to production.
**Settings:**
- Number of Copies: 9
**Before:**
| Case ID | Activity | Timestamp |
|---------|----------|-----------|
| PO-001 | Create Order | 2024-01-15 09:00 |
| PO-001 | Approve Order | 2024-01-15 10:00 |
| PO-002 | Create Order | 2024-01-15 11:00 |
| PO-002 | Approve Order | 2024-01-15 12:00 |
**After (showing copies for PO-001):**
| Case ID | Activity | Timestamp |
|---------|----------|-----------|
| PO-001 | Create Order | 2024-01-15 09:00 |
| PO-001 | Approve Order | 2024-01-15 10:00 |
| PO-001_2 | Create Order | 2024-01-15 09:00 |
| PO-001_2 | Approve Order | 2024-01-15 10:00 |
| PO-001_3 | Create Order | 2024-01-15 09:00 |
| ... | ... | ... |
| PO-001_10 | Create Order | 2024-01-15 09:00 |
| PO-001_10 | Approve Order | 2024-01-15 10:00 |
**Result:** Your 100-case dataset now contains 1,000 cases, allowing you to test performance characteristics at scale.
**Insights:** After duplicating cases, you can identify performance bottlenecks in calculators and identify which visualizations need optimization before deploying with production data volumes.
## How It Works
1. **Case Iteration:** The enrichment iterates through all existing cases in your event log
2. **Case Duplication:** For each original case, it creates the specified number of copies
3. **ID Generation:** Each copy receives a unique case ID by appending "_n" to the original ID (where n is the copy number starting from 2)
4. **Event Copying:** All events from the original case are duplicated to the new case, preserving timestamps and all event attributes
5. **Attribute Preservation:** All case-level attributes (except calculated columns) are copied to the new cases
6. **Log Finalization:** The event log is finalized with the expanded case and event tables
## Output
The enrichment modifies the event log by:
- **New Cases:** Creates (NumberOfCopies * original case count) additional cases
- **Case IDs:** New cases have IDs in the format "OriginalCaseId_n" where n is the copy index (2, 3, 4, etc.)
- **Events:** Each new case contains exact copies of all events from the original case
- **Attributes:** All case and event attributes are preserved on duplicated cases and events
**Important Notes:**
- This enrichment does not create any new attributes
- The original cases remain unchanged
- Calculated columns are not copied (they will be recalculated based on the data)
- Hidden columns are not copied to new events
## Best Practices
- Use this enrichment in development or test environments only
- Be mindful of data volume - duplicating large datasets can significantly increase processing time
- Remove the enrichment or save a separate copy of your notebook after testing
- Consider the impact on calculated metrics that may be affected by duplicate data patterns
---
*This documentation is part of the mindzie Studio process mining platform.*
---
## Add Activity For Missed Case Deadline
Section: Enrichments
URL: https://docs.mindziestudio.com/mindzie_studio/enrichments/add-activity-for-missed-case-deadline
Source: /docs-master/mindzieStudio/enrichments/add-activity-for-missed-case-deadline/page.md
# Add Activity For Missed Case Deadline
## Overview
The Add Activity For Missed Case Deadline enrichment automatically inserts a new activity into cases where a deadline has been missed. This powerful conformance monitoring tool compares a deadline date attribute against an execution activity timestamp to detect deadline violations. When the execution activity occurs after the deadline (or when no execution activity exists and current date exceeds the deadline), the enrichment creates a new event marking the deadline miss.
This enrichment is essential for deadline monitoring and SLA compliance analysis, enabling you to track deadline violations as distinct process events that can be analyzed, filtered, and reported like any other activity in your process.
**Note:** This enrichment is available only to administrators due to its ability to modify the event log by inserting new events.
## Common Uses
- Track missed payment deadlines in accounts payable processes
- Monitor SLA violations in service management workflows
- Identify overdue deliveries in supply chain processes
- Detect missed approval deadlines in procurement
- Flag expired contract renewals or compliance deadlines
- Mark overdue maintenance activities in asset management
- Monitor missed response deadlines in customer service processes
## Settings
**Deadline Attribute:** Select the case attribute containing the deadline date. This should be a date or datetime column representing when an activity should have been completed by. Common examples include "Due Date", "SLA Deadline", "Expected Completion Date", or "Payment Due Date".
**Execution Activity Name:** Specify the activity that represents deadline fulfillment. This is the activity that should occur before the deadline to avoid a violation. For example, "Pay Invoice" for payment deadlines, "Complete Delivery" for shipping deadlines, or "Approve Request" for approval deadlines.
**First or Last:** Choose whether to use the first or last occurrence of the execution activity when cases have multiple executions:
- **First:** Use the earliest occurrence of the execution activity
- **Last:** Use the most recent occurrence of the execution activity (default)
**New Activity:** Define the activity to insert when a deadline is missed. Configure the activity name (e.g., "Deadline Missed", "SLA Violation", "Payment Overdue") and optionally set the expected order position for process map display.
**Use Current Date:** When enabled, cases without an execution activity are evaluated against the current system date. If the current date exceeds the deadline, a missed deadline event is created. This is useful for monitoring ongoing cases that haven't yet completed but have already missed their deadlines.
## Example
### Accounts Payable Deadline Monitoring
**Scenario:** You want to track invoices that were paid after their due date, creating a visible event for late payments.
**Settings:**
- Deadline Attribute: "Due Date"
- Execution Activity Name: "Pay Invoice"
- First or Last: Last
- New Activity: "Due Date Missed"
- Use Current Date: Yes
**Before:**
| Case ID | Activity | Timestamp | Due Date |
|---------|----------|-----------|----------|
| INV-001 | Receive Invoice | 2024-01-10 | 2024-01-25 |
| INV-001 | Approve Invoice | 2024-01-15 | 2024-01-25 |
| INV-001 | Pay Invoice | 2024-01-30 | 2024-01-25 |
**After:**
| Case ID | Activity | Timestamp | Due Date |
|---------|----------|-----------|----------|
| INV-001 | Receive Invoice | 2024-01-10 | 2024-01-25 |
| INV-001 | Approve Invoice | 2024-01-15 | 2024-01-25 |
| INV-001 | **Due Date Missed** | **2024-01-25** | 2024-01-25 |
| INV-001 | Pay Invoice | 2024-01-30 | 2024-01-25 |
**Insights:** The new "Due Date Missed" activity is inserted at the deadline date (January 25), making it visible in process maps and allowing you to filter for late payments, calculate late payment rates, and analyze patterns in deadline violations.
### SLA Compliance Monitoring
**Scenario:** A service desk needs to track tickets that exceeded their resolution SLA.
**Settings:**
- Deadline Attribute: "SLA Resolution Deadline"
- Execution Activity Name: "Resolve Ticket"
- First or Last: First
- New Activity: "SLA Breached"
- Use Current Date: Yes
**Output:**
Tickets resolved after their SLA deadline will have an "SLA Breached" event inserted at the deadline timestamp. Open tickets that have passed their deadline will also receive this event based on the current date comparison.
**Insights:** This enables real-time SLA compliance dashboards showing breached tickets, helps identify patterns in SLA violations by category or team, and provides data for root cause analysis of deadline misses.
### Delivery Deadline Tracking
**Scenario:** A logistics company wants to mark orders with late deliveries.
**Settings:**
- Deadline Attribute: "Promised Delivery Date"
- Execution Activity Name: "Complete Delivery"
- First or Last: Last
- New Activity: "Delivery Late"
- Use Current Date: No
**Output:**
Orders delivered after the promised date will have a "Delivery Late" event created at the promised delivery date timestamp. Cases still in transit are not evaluated (Use Current Date is disabled).
## How It Works
1. **Deadline Evaluation:** For each case, the enrichment retrieves the deadline date from the specified attribute
2. **Execution Check:** Looks for the first or last occurrence of the execution activity in the case
3. **Comparison Logic:**
- If execution activity exists: Compare its timestamp to the deadline
- If no execution activity and Use Current Date enabled: Compare current date to deadline
4. **Violation Detection:** If execution date > deadline date, a deadline miss is identified
5. **Event Insertion:** A new event is created with the specified activity name, timestamped at the deadline date
6. **Log Update:** The event log is regenerated with the new events included
## Output
The enrichment modifies the event log by inserting new events:
- **New Activity:** Events with the specified activity name are added to cases with deadline violations
- **Timestamp:** The new events are timestamped at the deadline date (from the deadline attribute)
- **Expected Order:** If configured, the activity appears in the correct sequence position in process maps
- **Case Association:** New events are properly linked to their parent case
The inserted events can then be used for:
- Filtering cases with deadline violations
- Calculating deadline miss rates and patterns
- Visualizing violations in process maps
- Creating conformance metrics and dashboards
- Triggering alerts for SLA breaches
## See Also
- [Duration Between An Attribute And An Activity](/mindzie_studio/enrichments/duration-between-an-attribute-and-an-activity) - Calculate time differences between dates and activities
- [Deadline Filter](/mindzie_studio/filters/deadline) - Filter cases by deadline violations
- [Conformance Issue](/mindzie_studio/enrichments/conformance-issue) - Create conformance issues for process violations
---
*This documentation is part of the mindzie Studio process mining platform.*
---
## Find Duplicate Invoices
Section: Enrichments
URL: https://docs.mindziestudio.com/mindzie_studio/enrichments/find-duplicate-invoices
Source: /docs-master/mindzieStudio/enrichments/find-duplicate-invoices/page.md
# Find Duplicate Invoices
## Overview
The Find Duplicate Invoices enrichment automatically detects potential duplicate invoices in your accounts payable process by analyzing invoice attributes such as vendor, invoice number, amount, and date. This powerful fraud detection and data quality tool identifies exact matches and near-matches that may indicate duplicate payments, data entry errors, or intentional fraud.
The enrichment uses intelligent matching algorithms including exact vendor-invoice number matching and optional Levenshtein distance comparison to detect similar invoice numbers that might indicate typos or intentional variations. Cases are grouped by their match patterns, with each group containing the match type, group count, and total value for analysis.
**Note:** This enrichment is available only to administrators due to its specialized use in accounts payable audit and fraud detection scenarios.
## Common Uses
- Detect duplicate invoice submissions from vendors
- Identify potential double payment risks
- Find data entry errors where invoice numbers were mistyped
- Discover fraudulent duplicate invoices with slight variations
- Audit accounts payable processes for payment integrity
- Prepare for financial audits by identifying potential duplicates
- Clean up invoice data quality issues
## Settings
**Invoice Number Column Name:** Select the column containing the invoice number. This is the primary identifier used for matching, combined with the vendor name.
**Vendor Column Name:** Select the column containing the vendor or supplier name. Invoices are grouped by vendor before comparing invoice numbers to find duplicates.
**Invoice Amount Column Name:** Select the column containing the invoice amount. This helps identify match types (exact vs. amount changed) and calculates total group value.
**Invoice Date Column Name:** Select the column containing the invoice date. Used to identify match types where the date may have changed between duplicate submissions.
**Due Date Column Name (Optional):** Select the column containing the payment due date, if available. Helps identify patterns where due dates were changed on resubmitted invoices.
**Use Similar Invoice Numbers:** When enabled, the enrichment uses Levenshtein distance calculation to find invoices with similar (but not identical) invoice numbers. This catches typos and intentional variations where invoice numbers differ by 1-2 characters. Invoices with the same vendor and amount but similar invoice numbers are flagged as potential duplicates.
**Filter List:** Optionally apply filters to limit which cases are analyzed. This allows you to focus duplicate detection on specific vendor categories, time periods, or other criteria.
## Example
### Detecting Exact Duplicate Invoices
**Scenario:** An accounts payable department wants to identify invoices submitted multiple times with identical vendor and invoice number.
**Settings:**
- Invoice Number Column Name: "Invoice Number"
- Vendor Column Name: "Vendor Name"
- Invoice Amount Column Name: "Invoice Amount"
- Invoice Date Column Name: "Invoice Date"
- Use Similar Invoice Numbers: No
**Before (Case Attributes):**
| Case ID | Vendor Name | Invoice Number | Invoice Amount | Invoice Date |
|---------|-------------|----------------|----------------|--------------|
| INV-001 | Acme Corp | A12345 | $5,000 | 2024-01-10 |
| INV-002 | Acme Corp | A12345 | $5,000 | 2024-01-10 |
| INV-003 | Acme Corp | A12345 | $5,200 | 2024-01-15 |
| INV-004 | Beta Inc | B9876 | $3,000 | 2024-01-12 |
**After (New Attributes Added):**
| Case ID | Duplicate Group | Group Count | Group Value | Match Type |
|---------|-----------------|-------------|-------------|------------|
| INV-001 | Acme Corp_A12345 | 3 | $15,200 | Exact Match |
| INV-002 | Acme Corp_A12345 | 3 | $15,200 | Exact Match |
| INV-003 | Acme Corp_A12345 | 3 | $15,200 | Amount Changed |
| INV-004 | (none) | (none) | (none) | (none) |
**Insights:** Three invoices from Acme Corp share the same invoice number A12345. Two are exact duplicates (same amount and date), while the third has a different amount - indicating either a correction or fraudulent duplicate.
### Finding Invoices with Similar Numbers
**Scenario:** You suspect some duplicate invoices may have been submitted with slight typos in the invoice number to evade detection.
**Settings:**
- Invoice Number Column Name: "Invoice Number"
- Vendor Column Name: "Vendor Name"
- Invoice Amount Column Name: "Invoice Amount"
- Invoice Date Column Name: "Invoice Date"
- Use Similar Invoice Numbers: Yes
**Example Detection:**
| Case ID | Vendor Name | Invoice Number | Invoice Amount | Match Type |
|---------|-------------|----------------|----------------|------------|
| INV-010 | Acme Corp | INV-2024-001 | $10,000 | Similar Invoice Number |
| INV-011 | Acme Corp | INV-2024-0O1 | $10,000 | Similar Invoice Number |
| INV-012 | Acme Corp | INV-2024-OO1 | $10,000 | Similar Invoice Number |
**Insights:** The enrichment detects that these three invoices have near-identical invoice numbers (the difference being the letter "O" vs digit "0"), same vendor, and same amount. This pattern is highly suspicious and warrants investigation.
## Match Types
The enrichment categorizes duplicate groups by match type:
- **Exact Match:** Vendor, invoice number, amount, and invoice date are all identical
- **Amount Changed:** Same vendor and invoice number, but different invoice amount
- **Invoice Date Changed:** Same vendor and invoice number, but different invoice date
- **Due Date Changed:** Same vendor and invoice number, but different due date
- **Similar Invoice Number:** Same vendor and amount, invoice numbers differ by 1-2 characters
## Output
The enrichment creates multiple case-level attributes:
**Duplicate Group:** A string combining vendor name and invoice number that identifies which duplicate group a case belongs to. Format: "VendorName_InvoiceNumber"
**Group Count:** The number of cases in the duplicate group. Cases with count > 1 are potential duplicates.
**Group Value:** The total invoice value across all cases in the duplicate group. Helps prioritize high-value duplicate groups for investigation.
**Match Type:** Indicates how the duplicates match (Exact Match, Amount Changed, Invoice Date Changed, Due Date Changed, or Similar Invoice Number).
**Investigation Attributes:** Additional columns for tracking investigation status:
- Is Not A Duplicate (Boolean) - Mark false positives
- Is Resolved (Boolean) - Mark investigated cases
- Resolved By (String) - Who resolved the case
- Resolved Time (DateTime) - When it was resolved
- Outcome (String) - Investigation outcome
- Comments (String) - Investigation notes
## Best Practices
- Run on a regular schedule (weekly or monthly) for ongoing monitoring
- Focus initial investigation on high-value duplicate groups (sort by Group Value)
- Review "Amount Changed" matches carefully - may indicate corrected invoices or fraud
- "Similar Invoice Number" matches require more investigation as they may be false positives
- Use the Filter List to exclude vendor categories known to have legitimate duplicate patterns
- Document investigation outcomes in the provided tracking columns
## See Also
- [Find Duplicate Invoices Calculator](/mindzie_studio/calculators/find-duplicate-invoices) - View and analyze duplicate invoice groups
- [Duplicate Cases Filter](/mindzie_studio/filters/duplicate-cases) - Filter to find or exclude duplicate cases
---
*This documentation is part of the mindzie Studio process mining platform.*
---
## Getting Started: Creating Your First Project
Section: How To
URL: https://docs.mindziestudio.com/mindzie_studio/how-to/getting-started-creating-first-project
Source: /docs-master/mindzieStudio/how-to/getting-started-creating-first-project/page.md
# Getting Started: Creating Your First mindzie studio Project
:::overview
## Overview
This quick-start tutorial will guide you through the essential steps of creating your first project in mindzie studio. You'll learn how to set up a new project from scratch, customize it with a thumbnail image, and assign users with appropriate permissions. This foundational knowledge will prepare you to begin building process mining analyses and dashboards.
By the end of this tutorial, you'll have created a fully configured mindzie studio project ready for data upload and analysis.
:::
## What You'll Learn
- How to access the project creation interface
- The difference between empty projects, project gallery templates, and package uploads
- How to name and create a project
- How to add a custom thumbnail for visual identification
- How to assign users to your project and configure their permission levels
:::prerequisites
## Prerequisites
- Access to mindzie studio with appropriate credentials
- Login permissions to create new projects
- (Optional) A thumbnail image file for project customization
- (Optional) User email addresses if you plan to share the project
:::
## Step 1: Access mindzie studio and Navigate to Projects
1. Log into mindzie studio using your credentials
2. Once logged in, click the **Projects** button in the top navigation bar
3. Click **Add New Project** to open the project creation dialog
You'll be presented with three options for creating a new project.

## Step 2: Choose Your Project Creation Method
mindzie studio offers three ways to start a new project:
### Option 1: Create Empty Project
Start with a blank slate and build your project from the ground up. This option gives you complete control over every aspect of your project configuration. **We'll use this option for this tutorial.**
### Option 2: Upload Package
Import a previously saved mindzie project package. This is useful when migrating projects between environments or restoring backed-up projects.
### Option 3: Project Gallery
Choose from pre-configured project templates that include sample analyses, dashboards, and enrichments. Examples include:
- Insurance Claims Process Intelligence
- IT Service Management (ITSM)
- Order to Cash (O2C)
- Procure to Pay (P2P)
For this tutorial, we'll create an empty project to learn the fundamentals.
## Step 3: Create Your Empty Project
1. Click on **Create Empty Project** in the New Project dialog
2. A **Create Project** form will appear

3. In the **Name** field, enter a descriptive name for your project
- Example: "New Customer Onboarding" or "Invoice Processing Analysis"
- Use a name that clearly identifies the business process you'll be analyzing
4. (Optional) In the **Description** field, add details about the project's purpose
- Describe what process you're analyzing
- Note any specific goals or stakeholders
- Include relevant business context
5. Click **Create** to generate your new project
mindzie studio will create the project and automatically navigate you into it, starting at the data upload screen.
## Step 4: Upload a Project Thumbnail (Optional but Recommended)
Adding a custom thumbnail helps you and your team quickly identify projects in the project gallery. This is especially valuable when managing multiple projects.
1. Navigate back to the **Projects** page by clicking **Projects** in the top navigation
2. Locate your newly created project in the project list
3. Click the **three-dot menu** (•••) in the upper right corner of your project card

4. Select **Upload Thumbnail** from the menu
5. In the file selection dialog, browse to your thumbnail image

6. Select your image file (PNG, JPG, or GIF formats are supported)
7. Click **Open** to upload the thumbnail
The thumbnail will be applied to your project card, making it visually distinct in the project gallery.
**Best Practices for Thumbnails:**
- Use images that represent the business process (e.g., a banking icon for financial processes)
- Keep images simple and recognizable at small sizes
- Maintain consistent visual style across your organization's projects
- Use high-contrast images for better visibility
## Step 5: Assign Users to Your Project
If you're building a project for delivery to stakeholders or collaborating with team members, you'll want to assign users and configure their access levels.
1. From the **Projects** page, click the **three-dot menu** (•••) on your project card again
2. Select **Assign Users** from the menu
3. The **Manage Project Users** dialog will appear

4. In the **Users** dropdown, search for and select users to add to the project
- You can add multiple users at once
- Users must already exist in your mindzie studio instance
5. For each user, configure their permission level:
- **Contributor**: Can add content, create analyses, and build dashboards but cannot modify project settings or delete the project
- **Owner**: Full permissions including project configuration, user management, and project deletion
6. Click the checkmark or **Add** button to assign the selected users
7. Repeat for additional users as needed
8. Click **Close** when finished
**Permission Level Guidelines:**
- Assign **Owner** permissions to process analysts and administrators who need full control
- Assign **Contributor** permissions to team members who will build analyses but shouldn't modify core settings
- End users who only view dashboards typically don't need project-level access (they'll access published dashboards directly)
## Step 6: Verify Your Project Setup
After completing the setup steps, return to the Projects page to verify everything is configured correctly.

Your project should now display:
- The custom name you assigned
- Your uploaded thumbnail image
- The creation date
- Status indicators showing it's ready for use
## What's Next?
Congratulations! You've successfully created your first mindzie studio project. Your project is now ready for the next steps:
1. **Upload Data**: Import your process data via CSV upload or connect to data sources using mindzie Data Designer
2. **Configure Data Sources**: Map key columns (Case ID, Activity, Timestamp, Resource) for process mining analysis
3. **Build Dashboards**: Create role-specific dashboards for executives, operations teams, and process analysts
4. **Enrich Your Data**: Use the log enrichment engine to add performance metrics, conformance rules, and calculated attributes
5. **Create Analyses**: Build investigations and analysis notebooks to uncover process insights
## Related Topics
- **Uploading and Configuring Data Sources**: Learn how to import CSV files and map data columns
- **Understanding mindzie's Dual Dataset Architecture**: Explore how mindzie transforms raw data into enriched datasets
- **Planning Your Dashboard Structure for Different User Roles**: Design effective dashboard layouts for various stakeholders
:::key-takeaways
## Key Takeaways
- mindzie studio offers three project creation methods: empty projects, package uploads, and gallery templates
- Custom thumbnails improve project identification and organization
- User permissions (Owner vs. Contributor) control access levels and capabilities
- Projects serve as containers for data, analyses, dashboards, and enrichments
- Proper project setup establishes a foundation for successful process mining initiatives
You're now ready to begin your process mining journey with mindzie studio!
:::
---
## Uploading and Configuring Data Sources
Section: How To
URL: https://docs.mindziestudio.com/mindzie_studio/how-to/uploading-configuring-data-sources
Source: /docs-master/mindzieStudio/how-to/uploading-configuring-data-sources/page.md
# Uploading and Configuring Data Sources
:::overview
## Overview
This guide walks you through the process of uploading CSV data into mindzie Studio and configuring key columns for process mining analysis. Properly mapping your data columns is essential for mindzie to analyze your business processes effectively.
:::
:::prerequisites
## Prerequisites
Before uploading data, ensure you have:
- A CSV file containing your process event log data
- At minimum, the following columns in your data:
- **Case ID**: A unique identifier for each process instance
- **Activity**: The name of each process step or activity
- **Timestamp**: Date and time when each activity occurred
- **Resource** (recommended): The person or system that performed the activity
:::
## Choosing Your Data Import Method
mindzie offers two primary methods for importing data into your projects:
### CSV Upload
Best for:
- One-time data analysis
- Testing and proof-of-concept projects
- Smaller datasets
- Manual data refresh scenarios
### mindzie Data Designer
Best for:
- Continuous monitoring and scheduled updates
- Connecting directly to databases or data warehouses
- Complex ETL transformations
- Production deployments with automated data refresh
This guide focuses on the CSV upload method, which is the quickest way to get started with mindzie Studio.
## Step-by-Step: Uploading a CSV File
### Step 1: Navigate to the Datasets Area
When you first enter your project in mindzie Studio, you'll be taken to the **Datasets** section automatically. If you're not already there:
1. Click on the **Datasets** tab in the top navigation bar
2. You'll see the "Welcome to mindzieStudio" screen with several options

### Step 2: Select Upload CSV
On the Datasets screen, click the **Upload CSV** button in the top-right corner of the interface. This will open a file browser dialog.

### Step 3: Select Your CSV File
1. Navigate to the location of your CSV file on your computer
2. Select the file (e.g., `banking_onboarding_enhanced_event_log.csv`)
3. Click **Open** to begin the upload
The system will display a loading indicator showing the upload progress.

### Step 4: Validate and Configure Data Settings
After the file uploads, mindzie Studio will display a preview of your data and allow you to configure settings:
**Encoding Settings**
- The system will auto-detect the file encoding
- If your data contains special characters, you may need to adjust the encoding setting
**Data Preview**
- Review the preview to ensure your data loaded correctly
- Check that columns appear properly separated
- Verify that timestamps and other values display as expected
Once you've reviewed the settings, click **Next** to proceed to column mapping.
## Configuring Key Columns
The column mapping screen is where you tell mindzie Studio which columns in your CSV correspond to the key process mining fields.

### Understanding the Key Column Icons
mindzie Studio uses visual icons to help you identify and map the key columns:
- **Case ID**: Purple icon - Identifies unique process instances
- **Activity**: Yellow icon - Contains the names of process steps
- **Activity Time**: Orange icon - Timestamp for when each activity occurred
- **Resource**: Blue icon - Person or system performing the activity
### Step 5: Map Your Columns with Drag-and-Drop
mindzie Studio will automatically detect and suggest mappings for common column names. To map or change column assignments:
1. **Automatic Detection**: The system typically auto-detects standard columns like Case ID, Activity, and Timestamp
2. **Drag-and-Drop**: To manually assign a column, drag it from the bottom section to one of the key column boxes at the top
3. **Resource Assignment**: If you have a resource column (recommended), drag it to the Resource field
In the example shown:
- **Case ID** is mapped to the `Case ID` column
- **Activity** is mapped to the `Activity` column
- **Timestamp** is mapped to the `DateTime` column
- **Resource Name** is mapped to the `Resource Name` column
### Step 6: Configure Additional Column Settings
For each column in your dataset, you can:
**Change Column Types**
- Click on any column to modify its type
- Options include: String, Number, Date, Boolean, etc.
**Modify Data Types**
- Adjust how mindzie interprets the data
- Ensure dates are recognized as timestamps
- Confirm numeric values are typed correctly
**Anonymize Sensitive Data**
- Enable anonymization for columns containing sensitive information
- This is useful for compliance with data privacy regulations
- Names, customer IDs, and other PII can be masked
**Optional Columns**
The "Optional" section on the right side of the screen allows you to map additional process mining attributes:
- **Resource Role**: Job title or role of the resource
- **Cost**: Associated costs per activity
- **Channel**: Process channel (e.g., Branch, Mobile, Online)
- **Compliance Flags**: Conformance or compliance indicators
- **Country/Region**: Geographic attributes
### Step 7: Process and Save the Dataset
Once you've completed your column mapping:
1. Review all mappings to ensure accuracy
2. Click **Next** to begin processing
mindzie Studio will now:
- Transform your CSV data into the mindzie event log format
- Validate data quality and structure
- Create the base dataset for analysis

This processing step may take a few moments depending on the size of your dataset. You'll see a "Work in progress! Processing Dataset" dialog during this time.
### Step 8: Confirm Data Import Success
After processing completes, mindzie Studio will display a confirmation dialog showing:
- The dataset name
- Total number of cases (process instances)
- Total number of events (activities)

In the example shown, the dataset contains:
- **10,000 cases** (unique customer onboarding instances)
- **121,000 events** (total activities across all cases)
Click **Save** to finalize the import.
## What Happens After Data Upload
Once you save your dataset, mindzie Studio automatically:
1. **Creates Two Datasets**:
- **Original Dataset**: Your raw event log as uploaded
- **Enriched Dataset**: Enhanced version created by the mindzie pipeline (used for all analysis)
2. **Builds a Data Pipeline**: Prepares your data for enrichment with performance metrics, conformance rules, and other enhancements
3. **Generates Default Analysis**: Creates starter analysis including:
- Process overview
- Long case duration analysis
- Duration between main process steps
- Other foundational insights
These default analyses give you a head start on understanding your process and can be customized or removed as needed.
## Understanding Data Transformation
During the upload and processing phase, mindzie Studio:
- **Standardizes Data Format**: Converts your CSV into mindzie's optimized event log structure
- **Validates Data Quality**: Checks for missing required fields, invalid timestamps, and data inconsistencies
- **Prepares for Enrichment**: Structures the data so it can be enhanced with calculated attributes, performance metrics, and conformance rules
The transformation process ensures your data is ready for powerful process mining analysis and visualization.
## Tips for Successful Data Upload
**Column Naming**
- Use clear, consistent column names in your CSV
- Common names like "CaseID", "Activity", "Timestamp" are auto-detected
- Avoid special characters in column names
**Data Quality**
- Ensure every row has a Case ID, Activity, and Timestamp
- Timestamps should follow a consistent format (ISO 8601 recommended)
- Remove or fix any duplicate headers or malformed rows
**File Size Considerations**
- CSV upload works well for datasets up to several million events
- For very large datasets or continuous monitoring, consider using mindzie Data Designer instead
- Test with a sample of your data first to verify column mappings
**Resource and Optional Columns**
- While only Case ID, Activity, and Timestamp are required, adding Resource information enables deeper analysis
- Additional columns like Cost, Channel, and Region allow for richer segmentation and insights
- You can always add more optional columns later through data enrichment
## Next Steps
After successfully uploading and configuring your data source:
1. **Review the Generated Datasets**: Check both the original and enriched datasets in the Datasets section
2. **Explore Default Analysis**: Navigate to Investigations to see the automatically generated insights
3. **Plan Your Dashboard Structure**: Decide what dashboards and metrics you want to create for your users
4. **Enhance Your Data**: Use the Log Enrichment Engine to add performance metrics, conformance rules, and custom attributes
Your data is now ready to be transformed into actionable process intelligence!
## Related Topics
- **Understanding mindzie's Dual Dataset Architecture**: Learn about original vs. enriched datasets
- **Mastering the Log Enrichment Engine**: Add performance metrics and conformance rules to enhance your data
- **Using mindzie Data Designer**: Connect to live data sources for automated data refresh
- **Creating Your First Analysis**: Build metrics and KPIs from your uploaded data
---
## Understanding Dual Dataset Architecture
Section: How To
URL: https://docs.mindziestudio.com/mindzie_studio/how-to/understanding-dual-dataset-architecture
Source: /docs-master/mindzieStudio/how-to/understanding-dual-dataset-architecture/page.md
# Understanding mindzie's Dual Dataset Architecture
:::overview
## Overview
When you upload data into mindzie Studio, the platform automatically creates two distinct datasets that work together to power your process mining analysis. Understanding the difference between these datasets and when to use each one is fundamental to working effectively with mindzie Studio.
This guide explains the dual dataset architecture, how the mindzie data pipeline transforms your data, and what happens automatically when you import data for the first time.
:::
## The Two Datasets
### Original Dataset
The **Original Dataset** is the raw event log that you initially upload into mindzie Studio. This dataset contains your process data exactly as it was provided, whether uploaded via CSV file or ingested through mindzie Data Designer from source systems.
**Characteristics:**
- Contains the raw data in its original form
- Includes only the columns and attributes you imported (Case ID, Activity, Timestamp, Resource, and any additional attributes)
- Remains unchanged throughout your analysis
- Serves as the foundation for all subsequent data processing
**When to use the Original Dataset:**
- When you need to verify the source data
- For data quality checks and validation
- To understand what was originally provided before any transformations
### Enriched Dataset
The **Enriched Dataset** is automatically created by mindzie Studio after the data pipeline executes. This is the enhanced version of your data that includes all the calculated attributes, performance metrics, conformance flags, and other enrichments added through the log enrichment engine.
**Characteristics:**
- Created automatically when data is imported
- Contains all original attributes plus new calculated attributes
- Updated whenever you run enrichment calculations
- Powers all analysis, investigations, and dashboards
**When to use the Enriched Dataset:**
- For all analysis and investigation work (this is the primary dataset for analysis)
- When creating dashboards and KPIs
- When working with performance metrics, conformance rules, or custom enrichments
- For day-to-day process mining activities

*The Datasets view showing both the Original Dataset and the Enriched Dataset*
## How the Data Pipeline Works
When you upload data to mindzie Studio, here's what happens automatically:
### Step 1: Data Import and Validation
Your CSV file or data from mindzie Data Designer is loaded into mindzie Studio. The system:
- Validates the data format and structure
- Maps key columns (Case ID, Activity, Timestamp, Resource)
- Assigns column types and data types
- Creates the Original Dataset
### Step 2: Automatic Pipeline Execution
Once you click "Save" after uploading your data, mindzie Studio automatically:
- Executes the data pipeline
- Creates the Enriched Dataset
- Adds foundational attributes that enhance your analysis capabilities
### Step 3: Default Analysis Generation
To give you a quick start, mindzie Studio automatically generates helpful default analysis including:
- Process overview
- Long case durations
- Durations between main process steps
- Other key insights
These pre-built analyses help you start exploring your process immediately without having to create everything from scratch.

*Default investigation created automatically upon data import*

*Default analysis showing 10,000 cases and 121,000 events with key process insights*
## Understanding Dataset Size: The Example
In the demonstration, the banking onboarding dataset contains:
- **10,000 cases** - Each case represents one customer onboarding journey
- **121,000 events** - The total number of process steps across all cases
This means that on average, each customer onboarding case involves approximately 12 activities or process steps. This type of information becomes immediately visible once your data is loaded into mindzie Studio.
## The Role of Log Enrichment
The power of the dual dataset architecture becomes clear when you start using the log enrichment engine. This is where the Enriched Dataset truly differentiates itself from the Original Dataset.
### What Log Enrichment Does
Log enrichment allows you to enhance your data with:
**Performance Metrics:**
- Duration calculations between activity pairs
- Case duration from start to finish
- Performance bucketing (fast, normal, slow)
- Custom SLA compliance tracking
**Conformance Rules:**
- Flags for undesired activities
- Missing mandatory steps
- Wrong activity order
- Repeated activities and rework loops
**Custom Attributes:**
- Activity-based costing
- AI predictions
- Custom categorizations
- Mathematical transformations
- Time-based calculations
### How Enrichments Update the Dataset
Each time you create new enrichments and calculate them:
1. The data pipeline executes
2. New attributes are added to the Enriched Dataset
3. These new attributes become available for use in filters and calculators
4. Your analysis becomes more powerful with each enrichment

*Data overview showing both original attributes and enriched attributes with icons indicating system-generated enhancements*
## Automatic Attributes Added by mindzie
Even without any manual enrichments, mindzie Studio automatically adds several useful attributes to your Enriched Dataset, including:
- **Time of Day** - When activities occurred
- **Case Start** - When each case began
- **Case Finish** - When each case ended
- **Case Duration** - Total time from start to finish
- **First Resource** - Who initiated the case
- **Activity Frequency** - How often activities occur
- And many more...
These automatic enrichments give you immediate analytical capabilities without any configuration.
## Choosing the Right Dataset for Analysis
When creating investigations and analysis notebooks in mindzie Studio, you need to select which dataset to analyze.
**Best Practice:**
Always select the **Enriched Dataset** for your investigations and analysis work. This dataset contains all the enhanced attributes and calculated metrics that make your analysis powerful and insightful.
The Original Dataset should primarily be used for:
- Reference and validation purposes
- Data quality audits
- Understanding the source data structure
## The Continuous Enhancement Cycle
The dual dataset architecture supports an iterative workflow:
1. **Upload** - Import your data to create the Original Dataset
2. **Enrich** - Add performance metrics, conformance rules, and custom attributes
3. **Calculate** - Execute the pipeline to update the Enriched Dataset
4. **Analyze** - Create investigations and analysis using the enriched attributes
5. **Repeat** - Add more enrichments as needed to deepen your insights
Each cycle makes your Enriched Dataset more valuable and your analysis more sophisticated.
:::key-takeaways
## Key Takeaways
- **Two datasets are created**: Original (raw data) and Enriched (enhanced data)
- **Automatic creation**: The Enriched Dataset is created automatically when you upload data
- **Use the Enriched Dataset**: This is your primary dataset for all analysis and investigations
- **Pipeline execution**: The data pipeline transforms Original into Enriched
- **Continuous enhancement**: Each enrichment calculation adds new attributes to the Enriched Dataset
- **Default analysis**: mindzie Studio provides helpful starter analysis automatically
- **Iterative process**: You can continue adding enrichments to make your analysis more powerful
:::
:::next-steps
## Next Steps
Now that you understand the dual dataset architecture, you're ready to:
- Explore the log enrichment engine to add performance metrics
- Create conformance rules to identify process compliance issues
- Build custom enrichments for specific business needs
- Create investigations and analysis using the enriched attributes
- Publish insights to dashboards for end users
The dual dataset architecture is the foundation that makes all of mindzie Studio's powerful analytical capabilities possible. By separating the original data from the enhanced data, you maintain data integrity while gaining unlimited flexibility to transform and analyze your processes.
:::
---
## Planning Dashboard Structure for User Roles
Section: How To
URL: https://docs.mindziestudio.com/mindzie_studio/how-to/planning-dashboard-structure-for-user-roles
Source: /docs-master/mindzieStudio/how-to/planning-dashboard-structure-for-user-roles/page.md
# Planning Your Dashboard Structure for Different User Roles
:::overview
## Overview
When building a mindzie Studio project, one of the most important strategic decisions you'll make is how to organize your dashboards for different user personas and business functions. Rather than jumping straight into creating metrics and KPIs, taking time upfront to plan your dashboard structure creates a more intuitive, user-friendly experience and makes your project easier to maintain and expand over time.
This guide presents a best practice approach: **working front-to-back**. This means building your dashboard structure first—creating empty dashboards organized by user role—before populating them with metrics and analysis. This strategic framework ensures your mindzie Studio implementation aligns with how your organization actually works and how different stakeholders need to consume process intelligence.
:::
## Why Plan Dashboard Structure First?
Planning your dashboard structure before creating analysis provides several key benefits:
- **User-centric organization**: Dashboards aligned with specific roles ensure users see only the metrics relevant to their responsibilities
- **Clearer project scope**: Understanding what dashboards you need helps define what analysis and enrichments to create
- **Easier navigation**: A well-structured dashboard hierarchy makes it simple for end users to find the information they need
- **Better maintainability**: Organized structure makes it easier for analysts to understand and update the project later
- **Scalability**: Starting with a solid framework allows you to add new metrics systematically without creating clutter
## The Front-to-Back Approach
The front-to-back methodology works like this:
1. **Plan dashboard structure** - Identify user roles and create empty dashboards
2. **Create investigations** - Build investigation folders that align with dashboard names
3. **Build enrichments** - Add data enrichments needed for your planned metrics
4. **Create analysis** - Build metrics using filters and calculators
5. **Publish to dashboards** - Populate your pre-planned dashboards with completed metrics
This approach contrasts with starting in the data and enrichments, then figuring out where to publish later. By planning the end result first, every step has clear purpose and direction.
## Understanding Dashboard Types in mindzie Studio
### Global Dashboards vs. Local Dashboards
mindzie Studio uses two types of dashboards:
- **Global dashboards**: User-facing dashboards accessible from the main Dashboards menu. These are what end users consume and interact with.
- **Local dashboards**: Analysis-specific dashboards contained within investigation notebooks. These provide detailed views when users drill into metrics.
This guide focuses on planning global dashboards for end users, though the same role-based thinking applies to organizing local dashboards within your analysis notebooks.
## Framework for Role-Based Dashboard Structure
### Common User Roles and Dashboard Types
While every organization is different, most process mining projects benefit from organizing dashboards around these common roles and functions:
#### 1. Setup/Information Dashboard
**Purpose**: Provides project documentation and guidance for all users
**Typical audience**: Everyone—analysts, administrators, and end users
**Content examples**:
- Project overview and objectives
- Key metrics being tracked
- Data sources and refresh schedules
- Dashboard navigation guide
- Contact information for support
**Best practice**: Make this informational only—disable the copilot feature since users won't be performing analysis here.
#### 2. Executive/Process Overview Dashboard
**Purpose**: High-level KPIs and strategic metrics
**Typical audience**: Executives, senior management, process owners
**Content examples**:
- Overall process performance summary
- Key performance indicators (cycle time, volume, cost)
- Trend analysis over time
- High-level conformance and compliance metrics
- Strategic improvement opportunities
#### 3. Operations Dashboard
**Purpose**: Operational metrics for day-to-day process management
**Typical audience**: Operations managers, process managers, team leads
**Content examples**:
- Current workload and case volumes
- Active bottlenecks and delays
- Resource utilization
- Performance against targets
- Operational exceptions requiring attention
#### 4. Compliance and Risk Dashboard
**Purpose**: Conformance, audit, and risk metrics
**Typical audience**: Compliance officers, auditors, risk managers
**Content examples**:
- Conformance rule violations
- Missing approval steps
- Segregation of duties issues
- Audit trail exceptions
- Risk indicators and trends
#### 5. Branch/Department/Regional Dashboard
**Purpose**: Location-specific or department-specific performance
**Typical audience**: Branch managers, department heads, regional managers
**Content examples**:
- Performance metrics filtered by location/department
- Comparative analysis against other branches
- Local variations and exceptions
- Team-specific resource metrics
#### 6. Process Improvement Dashboard
**Purpose**: Detailed analysis for continuous improvement initiatives
**Typical audience**: Process improvement teams, business analysts, Six Sigma practitioners
**Content examples**:
- Root cause analysis
- Variant analysis and process discovery
- Detailed performance breakdowns
- Cost analysis and waste identification
- Improvement opportunity identification
## Step-by-Step: Creating Your Dashboard Structure
### Step 1: Access the Dashboards Section
1. In mindzie Studio, click the **Dashboards** button in the top navigation menu
2. You'll see the empty dashboards area with an **Add New Dashboard** button

### Step 2: Create Your Setup Dashboard
Start by creating an informational dashboard that provides context and guidance:
1. Click **Add New Dashboard**
2. Enter a descriptive name (e.g., "mindzie Studio Setup: Banking New Customer Onboarding")
3. Add a description if desired
4. Set **Copilot** to **Collapsed** since this is informational only
5. Click **Create**

The setup dashboard is your opportunity to provide users with project context, navigation guidance, and documentation right within mindzie Studio.
### Step 3: Create Role-Based Dashboards
Continue creating dashboards for each user role you've identified:
1. Click **Add New Dashboard** for each role
2. Use clear, role-specific naming:
- "Process Overview Dashboard" (for executives)
- "Operations Dashboard"
- "Compliance & Risk Dashboard"
- "Branch / Channel Performance Dashboard"
- "Process Improvement Dashboard"
3. Add brief descriptions explaining the dashboard's purpose
4. Consider setting Copilot to **Collapsed** for simpler end-user experience
5. Click **Create** for each dashboard
**Best practice**: At this stage, you're creating empty containers. Don't worry about populating them yet—that comes later in the workflow.

### Step 4: Add Context to Your Setup Dashboard
Your setup dashboard should provide guidance for all users. Here's how to make it informative:
1. Click into your Setup dashboard
2. Click **Note** to add a note panel
3. Use **markdown formatting** to structure your content:
- Use `#` for headers
- Use `-` for bullet lists
- Use `**text**` for bold emphasis
4. Consider **disabling the title** for a cleaner look
5. Add key information:
- Project objectives
- List of available dashboards and their purposes
- Data information (date ranges, case counts, refresh schedule)
- Key metrics being tracked
- Navigation instructions

### Step 5: Format Your Setup Dashboard Layout
Make your setup dashboard visually appealing:
1. Click **Edit Layout** in the top toolbar
2. Resize the note panel to fill the screen or span the full width
3. Adjust panel positioning for optimal readability
4. Click **Finish** to save the layout

### Step 6: Align Investigation Structure with Dashboards
After creating your dashboard structure, create investigation folders that correspond to each dashboard:
1. Navigate to **Investigations**
2. Create investigations with names matching your dashboards
3. This alignment makes it easy to remember where analysis belongs
For example:
- Investigation: "Process Overview Dashboard" → publishes to → Dashboard: "Process Overview Dashboard"
- Investigation: "Operations Dashboard" → publishes to → Dashboard: "Operations Dashboard"
This naming consistency creates a clear, logical project structure.
## Dashboard Naming Best Practices
### Be Descriptive and Role-Specific
Good dashboard names immediately communicate purpose and audience:
- Good: "Executive Process Overview"
- Better: "Process Overview Dashboard - Executive KPIs"
- Good: "Branch Performance"
- Better: "Branch / Channel Performance Dashboard"
### Maintain Consistent Naming Conventions
Choose a naming pattern and stick to it:
- Option 1: "[Role] Dashboard" (e.g., "Operations Dashboard", "Compliance Dashboard")
- Option 2: "[Function] - [Detail]" (e.g., "Process Overview - Executive Summary")
- Option 3: "[Process] [Role] Dashboard" (e.g., "Customer Onboarding Operations Dashboard")
### Use Names That Scale
Consider how your naming will work as the project grows:
- If you might add multiple processes, include the process name in dashboard titles
- If you might expand to multiple regions, consider including geographic scope
- Leave room in your structure for future additions
## Using the Copilot Feature Strategically
Each dashboard in mindzie Studio includes an optional AI copilot assistant. You can configure this in three states:
- **Expanded**: Copilot panel is visible by default
- **Collapsed**: Copilot is available but minimized (recommended for most end users)
- **Disabled**: Copilot is not available (best for informational-only dashboards)
**Best practice**: For end-user dashboards, set the copilot to **Collapsed**. This keeps the interface clean and simple while still providing AI assistance if users need it. Only use Expanded for power users who will regularly leverage AI insights.
## Working with Note Panels and Markdown
Note panels are valuable for adding context and instructions throughout your dashboards. mindzie Studio supports markdown formatting, allowing you to create well-structured documentation:
### Common Markdown Syntax
```markdown
# Header 1
## Header 2
**Bold text**
*Italic text*
- Bullet point 1
- Bullet point 2
1. Numbered item 1
2. Numbered item 2
[Link text](URL)
```
### Note Panel Best Practices
- **Disable titles** for cleaner, more integrated note panels
- **Use background colors** to visually distinguish informational sections (dark backgrounds with light text can create emphasis)
- **Add hover instructions** to help users understand how to interact with metrics
- **Include drill-down guidance** to explain that users can click panels for more detail

## Example Dashboard Structures by Industry
### Banking Customer Onboarding
1. mindzie Studio Setup - Banking Customer Onboarding (informational)
2. Process Overview Dashboard (executive summary)
3. Operations Dashboard (onboarding managers)
4. Compliance & Risk Dashboard (compliance team)
5. Branch Performance Dashboard (branch managers)
6. Process Improvement Dashboard (analysts)
### Insurance Claims Processing
1. Claims Processing Setup & Guide (informational)
2. Executive Summary Dashboard (leadership)
3. Claims Operations Dashboard (claims managers)
4. Adjuster Performance Dashboard (team leads)
5. Compliance & Audit Dashboard (compliance)
6. Process Analytics Dashboard (improvement team)
### Healthcare Patient Flow
1. Patient Flow Overview & Setup (informational)
2. Executive Quality Metrics (hospital administration)
3. Department Operations Dashboard (department managers)
4. Clinical Compliance Dashboard (quality assurance)
5. ED/Admission Performance Dashboard (emergency/admissions)
6. Process Optimization Dashboard (operational excellence)
## Common Pitfalls to Avoid
### Creating Too Many Dashboards
**Problem**: Every possible metric gets its own dashboard, creating a confusing navigation structure.
**Solution**: Group related metrics on single dashboards organized by role. Most projects need 4-7 global dashboards.
### Creating Too Few Dashboards
**Problem**: Everything goes into one or two massive dashboards that try to serve everyone.
**Solution**: Separate concerns by role and function. Different users have different needs—respect that with targeted dashboards.
### Inconsistent Naming
**Problem**: Dashboard names don't clearly indicate their purpose or audience.
**Solution**: Establish naming conventions upfront and document them in your setup dashboard.
### Not Using a Setup Dashboard
**Problem**: Users don't understand what dashboards exist or how to navigate the project.
**Solution**: Always create an informational setup dashboard as your project's "home page."
### Building Backwards
**Problem**: Creating lots of analysis first, then figuring out where to publish it later, resulting in disorganized dashboards.
**Solution**: Plan your dashboard structure first, then build analysis with clear publication targets.
## Next Steps
Once you've created your dashboard structure, you're ready to move to the next phases of project development:
1. **Create corresponding investigations** - Build investigation folders aligned with your dashboard names
2. **Build log enrichments** - Add performance metrics, conformance rules, and other enrichments to enhance your data
3. **Create analysis** - Build metrics using filters and calculators within your investigations
4. **Publish to dashboards** - Add your completed metrics to the appropriate role-based dashboards
5. **Format and refine** - Use note panels, layouts, and formatting to create polished, user-friendly dashboards
By starting with a well-planned dashboard structure, every subsequent step has clear direction and purpose. Your end users will benefit from intuitive navigation and role-appropriate metrics, while you'll maintain a project that's easy to understand, update, and expand.
## Related Topics
- **Working with Investigations and Analysis Notebooks** - Learn how to create investigation folders and analysis notebooks aligned with your dashboard structure
- **Publishing Metrics from Notebooks to Dashboards** - Understand how to publish completed analysis to your planned dashboards
- **Designing User-Friendly Dashboards with Notes and Formatting** - Advanced techniques for creating professional, polished dashboards
- **Understanding Drill-Down and Continuous Monitoring** - How dashboard structure supports both discovery and ongoing monitoring use cases
---
## Working with Investigations and Notebooks
Section: How To
URL: https://docs.mindziestudio.com/mindzie_studio/how-to/working-with-investigations-and-notebooks
Source: /docs-master/mindzieStudio/how-to/working-with-investigations-and-notebooks/page.md
# Working with Investigations and Analysis Notebooks
:::overview
## Overview
In mindzie Studio, **investigations** serve as organizational folders that contain your analysis work. Each investigation groups related analyses together, making it easy to organize your process mining insights by business function, dashboard, or specific area of focus.
This tutorial explains how to create investigations, understand their folder structure, and build analysis notebooks that will ultimately populate your dashboards with meaningful KPIs and metrics.
:::
## What are Investigations?
Think of investigations as folders within mindzie Studio that help you organize your analytical work. When you create an investigation, you're creating a container that can hold multiple analyses, each focused on a specific metric, insight, or aspect of your process.
**Best Practice**: Align your investigation names with your dashboard names. For example, if you have a "Process Overview" dashboard, create a "Process Overview" investigation. This naming convention makes it simple for users to understand the relationship between investigations and the dashboards they populate.
## Understanding the Investigation Workflow
The typical workflow for working with investigations follows this pattern:
1. **Create dashboard structure** - Set up empty dashboards for your different user roles (executive, operations, compliance, etc.)
2. **Create investigations** - Create investigation folders aligned with each dashboard
3. **Build analyses** - Within each investigation, create analyses for specific metrics and KPIs
4. **Populate dashboards** - Publish your analyses to the appropriate dashboards for end users
This front-to-back approach ensures your entire project structure is organized before you start building complex metrics.
## Creating an Investigation
To create a new investigation:
1. Navigate to the **Investigations** section in the top navigation bar
2. Click **Add New Investigation**
3. In the dialog that appears, provide:
- **Name**: Give your investigation a descriptive name (ideally matching a dashboard name)
- **Description**: Add details about what this investigation focuses on
- **Dataset**: Select which dataset this investigation will analyze
- **Folder**: Optionally organize investigations into folders

### Selecting the Dataset
When creating an investigation, you'll need to select which dataset to analyze. Remember that mindzie Studio maintains two datasets:
- **Original dataset**: Your raw event log data as uploaded
- **Enriched dataset**: The enhanced dataset created by mindzie's data pipeline with performance metrics, conformance rules, and other calculated attributes

For most analyses, you'll want to select the **enriched dataset** because it contains all the performance metrics and calculated attributes that enable powerful analysis.
## Understanding the Investigation Structure
Once created, your investigation appears in the investigations list. If data was recently uploaded, mindzie may have already created a default investigation with pre-built analyses to give you a head start.

You can delete or modify these default investigations to align with your specific dashboard structure. The goal is to create a clean, organized structure that makes sense for your end users.
## Creating Analysis Notebooks
Within each investigation, you can create multiple **analysis notebooks**. Each notebook focuses on a specific metric or insight you want to explore.
### Types of Analysis You Can Create
When you click to create a new analysis, mindzie Studio offers several options:
1. **Notebook Analysis** - A blank notebook where you build custom analyses using filters and calculators
2. **Process Map Analysis** - Pre-configured to display the process flow
3. **Variant DNA Analysis** - Focused on analyzing process variants

### Using Analysis Templates
mindzie Studio provides a gallery of analysis templates that give you a head start on common analyses:
- Case Duration Over Time
- Cases Over Time
- Cases with Few Activities
- Cases with Multiple Activities
- Conformance Issues
- Durations Between Main Process Steps
- Performance by Resource
- Process Map
- Process Overview
- And many more...
These templates are shortcuts that set up common analyses with pre-configured filters and calculators. However, you can also create everything from scratch using a blank notebook.
### Creating a Blank Analysis
To create a blank analysis notebook:
1. Click **Add New** within your investigation
2. Select **Notebook Analysis** (the blank notebook option)
3. Enter a name that describes the metric you're investigating (e.g., "Average Onboarding Duration")
4. Click **Create**

The analysis name should clearly indicate what insight you're looking for. This makes it easier to find analyses later and understand what each notebook contains.
## The Analysis Notebook Interface
Once created, your analysis notebook opens with a comprehensive interface containing multiple tabs and capabilities:

### Notebook Tabs and Features
Each analysis notebook includes:
- **Analysis Tab**: The main workspace where you add filters, calculators, and build your metrics using mindzie's low-code/no-code approach
- **Process Map**: A visual representation of your process flow filtered by your analysis criteria
- **Variant DNA**: Shows the different variants (paths) through your process
- **Data Overview**: Displays all available attributes and their values in your dataset
- **Case Explorer**: Lets you drill into individual cases to see specific process instances
- **Local Dashboard**: A dashboard view specific to this analysis where you can publish blocks
### Building Analysis with Filters and Calculators
Within the Analysis tab, you'll use mindzie's core paradigm: **filters** to isolate specific data segments, and **calculators** to visualize insights. This low-code/no-code approach makes it easy to build sophisticated metrics without writing code.
For example, to analyze average onboarding duration:
- Add filters to focus on specific divisions, departments, or regions
- Add calculator blocks to compute and display average case duration
- Use the enriched attributes created by log enrichment to power your calculations
## Leveraging the AI Co-Pilot
Each analysis notebook includes access to mindzie's **AI co-pilot**, which can assist you with:
- Understanding your data
- Suggesting relevant filters and calculators
- Answering questions about your process
- Providing insights based on your analysis
The co-pilot is context-aware and understands the specific investigation and dataset you're working with.
## Organizing Multiple Analyses
Within a single investigation, you can create as many analysis notebooks as needed. For a "Process Overview" investigation, you might create separate analyses for:
- Average case duration
- Case volume over time
- Cases with conformance issues
- Cost per case
- Resource utilization
Each analysis becomes a building block that can be published to dashboards, creating a comprehensive view for your end users.
## Next Steps
Now that you understand investigations and analysis notebooks, you're ready to:
1. **Enhance your data** - Use the log enrichment engine to add performance metrics, conformance rules, and custom attributes
2. **Build metrics** - Create specific analyses using filters and calculators
3. **Publish to dashboards** - Move your completed analyses to global dashboards for end users
The investigation structure you create now will serve as the foundation for all your process mining insights in mindzie Studio.
:::key-takeaways
## Key Takeaways
- **Investigations are folders** that organize related analyses
- **Align investigation names with dashboards** for clarity and ease of use
- **Select the enriched dataset** for most analyses to access calculated attributes
- **Use templates or start from scratch** depending on your needs
- **Each notebook includes multiple tabs** - analysis, process map, variant DNA, data overview, and case explorer
- **The AI co-pilot** is available to assist throughout your analysis work
- **Build front-to-back** - create structure first, then populate with metrics
:::
---
## Mastering Log Enrichment Engine
Section: How To
URL: https://docs.mindziestudio.com/mindzie_studio/how-to/mastering-log-enrichment-engine
Source: /docs-master/mindzieStudio/how-to/mastering-log-enrichment-engine/page.md
# Mastering the Log Enrichment Engine
:::overview
## Overview
The log enrichment engine is one of the most powerful features in mindzie Studio, transforming your raw process data into an enhanced dataset packed with performance metrics, conformance indicators, AI predictions, and custom attributes. This enriched data becomes the foundation for sophisticated analysis, insightful KPIs, and meaningful dashboards.
This comprehensive guide will teach you how to use the log enrichment engine to unlock the full analytical potential of your process data. You'll learn to calculate performance metrics, apply custom SLAs, track activity durations, and organize enrichments for maximum efficiency.
:::
## Understanding the mindzie Data Pipeline
Before diving into enrichment, it's important to understand how mindzie Studio processes your data:
### The Two-Dataset Architecture
When you upload data to mindzie Studio, the system automatically creates **two datasets**:
1. **Original Dataset**: Your raw event log exactly as imported, preserving the source data
2. **Enriched Dataset**: An enhanced version created by the mindzie pipeline with additional attributes and calculated metrics

The enriched dataset is what you'll use for all analysis, investigations, and dashboard metrics. Every time you add enrichments and execute the pipeline, this dataset is updated with new attributes.
### The Enrichment Stage
The enrichment stage sits between data import and analysis:
1. **Data Import** - Connect to systems using Data Designer or upload CSV files
2. **Log Enrichment** - Enhance data with performance metrics, conformance rules, AI predictions, and custom calculations
3. **Analysis & Dashboards** - Build insights using the enriched dataset
Think of enrichment as preparing your ingredients before cooking. The better your preparation, the more sophisticated dishes you can create.
## Accessing the Log Enrichment Interface
To access log enrichment in your project:
1. Navigate to your project in mindzie Studio
2. Click on the **Datasets** menu in the top navigation
3. Select your enriched dataset to view the enrichment interface

The enrichment interface consists of:
- **Left Sidebar**: Enrichment notebooks that organize your enrichment blocks
- **Action Buttons**: Quick access to wizards and tools
- **Calculate Enrichments**: Executes the data pipeline to apply your enrichments
- **Performance Wizard**: Automated performance metric creation
- **Activity Info Wizard**: Add cost and time information to activities
- **Center Panel**: Overview of your dataset attributes and enrichment blocks
- **Data Explorer**: Browse your data and see applied enrichments
## Using the Performance Wizard
The Performance Wizard is your fastest path to comprehensive performance analytics. It automatically calculates duration metrics between activity pairs and categorizes them into performance buckets.
### What the Performance Wizard Does
The wizard analyzes your process and:
- Identifies key activity pairs in your process flow
- Calculates duration between these activities
- Creates the full case duration metric
- Categorizes durations into **Fast**, **Normal**, and **Slow** performance buckets
- Generates enrichment blocks for all these calculations
### Running the Performance Wizard
**Step 1**: Click the **Performance Wizard** button in the enrichment interface

**Step 2**: The wizard will analyze your process and present a list of activity pairs

You'll see:
- **First Activity**: The starting point of each duration measurement
- **Last Activity**: The ending point of each duration measurement
- **Count**: Number of cases where this pair occurs
- **Duration Statistics**: Fast, Normal, and Slow thresholds with a distribution chart
### Customizing Activity Pairs
The wizard automatically identifies important activity pairs, but you can customize:
**Adding New Activity Pairs**:
1. Click **Add New Pair** in the wizard
2. Select the **First Activity** from the dropdown
3. Select the **Second Activity** from the dropdown
4. Click **Add** to include this pair in your performance calculations
**Example Use Cases**:
- Measure duration for a specific department's activities
- Track time between approval steps
- Calculate cycle time for exception handling processes
### Configuring Performance Thresholds (SLAs)
The wizard provides default performance thresholds, but you can customize them to match your organization's SLAs:
- **Fast Duration**: Cases completing faster than this threshold (green/good performance)
- **Normal Duration**: Cases within acceptable range (yellow/acceptable performance)
- **Slow Duration**: Cases exceeding this threshold (red/concerning performance)
- **Duration Unit**: Choose Days, Hours, or Minutes
To apply custom SLAs:
1. Locate the performance bucket fields in the wizard
2. Update the threshold values to match your organization's standards
3. Ensure the duration unit matches your requirements
This allows you to align mindzie's performance tracking with your existing service level agreements.
### Creating the Performance Enrichments
Once you've configured activity pairs and thresholds:
1. Click **Create** in the Performance Wizard
2. mindzie will generate a new enrichment notebook called "PERFORMANCE"
3. This notebook contains multiple enrichment blocks - one for each activity pair plus categorization logic

You'll see blocks for:
- Case Duration (overall process time)
- Individual activity pair durations
- Performance categorization enrichments
## Understanding Enrichment Blocks and Notebooks
Enrichments in mindzie Studio are organized using a notebook and block structure, similar to the analysis interface.
### Enrichment Notebooks
Notebooks are organizational containers for related enrichments:
- **Purpose**: Group similar enrichments together (e.g., "PERFORMANCE", "CONFORMANCE", "COST")
- **Benefits**: Easy navigation, logical organization, reusability
- **Location**: Listed in the left sidebar of the enrichment interface

Common notebook organization patterns:
- **PERFORMANCE**: All duration and speed metrics
- **CONFORMANCE**: Rule-based compliance checks
- **COST**: Activity-based costing enrichments
- **CLEANUP**: Data cleaning and categorization
- **CUSTOM**: Project-specific calculations
### Enrichment Blocks
Each notebook contains individual enrichment blocks:
- **Block**: A single enrichment calculation or transformation
- **Types**: Performance metrics, conformance rules, calculations, categorizations, AI predictions
- **Execution**: All blocks are calculated when you execute the pipeline

In this view, you can see all the enrichment blocks created by the Performance Wizard, organized by type (duration calculations and category assignments).
### Creating Custom Enrichment Notebooks
To create a new enrichment notebook:
1. Click the **three-dot menu** next to "Enrichments" in the left sidebar
2. Select **Add Notebook**
3. Give your notebook a descriptive name (e.g., "Cost Analysis", "Quality Metrics")
4. Click **Create**
**Best Practice**: Create separate notebooks for different types of enrichments. This makes your project easier to navigate and allows you to copy/paste notebooks between projects.
## Calculating and Applying Enrichments
After creating enrichment blocks, you must execute the data pipeline to apply them to your dataset.
### Executing the Pipeline
1. Click the **Calculate Enrichments** button at the top of the enrichment interface
2. The pipeline will process all enrichment blocks across all notebooks
3. Processing time depends on dataset size (typically seconds to a few minutes)
4. A loading indicator shows pipeline execution progress
**Important**: Enrichments are **not** applied to your data until you calculate them. Always execute the pipeline after making changes.
### What Happens During Pipeline Execution
When you calculate enrichments, mindzie:
1. Takes your original dataset as input
2. Applies all enrichment blocks in sequence
3. Creates new attributes in the enriched dataset
4. Updates any existing calculated attributes
5. Makes the new attributes available for analysis
## Viewing Your Enriched Attributes
After calculating enrichments, you can view the new attributes that have been added to your dataset.
### Accessing the Data Overview
1. Navigate to the **Overview** tab in the enrichment interface
2. Scroll down to view the complete list of attributes
3. Attributes are organized in the left panel

### Understanding Attribute Types
Attributes in your enriched dataset fall into several categories:
**Original Attributes** (from your source data):
- Activity Name
- Activity Time
- Case ID
- Resource
- Custom fields from your data
**mindzie Auto-Generated Attributes** (created automatically):
- Case Start, Case End, Case Duration
- Case Start Activity, Case End Activity
- First Resource, Resource Role
- Time of Day, Case Start Day/Month/Year
- Variant information
**Performance Enrichment Attributes** (from Performance Wizard):
- Individual activity pair durations
- Performance category indicators
- Duration metrics with categorization
Each attribute shows:
- **Name**: The attribute identifier
- **Icon**: Indicates attribute type (text, number, date, calculated)
- **Count**: Number of unique values (for categorical attributes)
### Using Enriched Attributes in Analysis
The real power of enrichment becomes clear when creating analysis:
- **Filters**: Segment data by performance categories, conformance issues, cost buckets
- **Calculators**: Build metrics using enriched duration, cost, and custom attributes
- **Process Maps**: Color activities by performance or conformance
- **Dashboards**: Create KPIs showing fast vs. slow cases, high-cost processes, compliance rates
Every enriched attribute becomes available in the analysis interface, dramatically expanding your analytical capabilities.
:::best-practices
## Best Practices for Log Enrichment
### Organization Strategy
**Use Descriptive Notebook Names**:
- Instead of "Notebook 1", use "Performance Metrics" or "Compliance Rules"
- Names should clearly indicate the enrichments contained within
**Group Related Enrichments**:
- Keep all performance metrics in one notebook
- Separate conformance rules into their own notebook
- Isolate complex calculations for easier troubleshooting
### Performance Considerations
**Start Simple, Then Enhance**:
- Begin with the Performance Wizard to get core metrics
- Add custom enrichments incrementally
- Calculate enrichments after each addition to verify results
**Test with Smaller Datasets**:
- If working with large datasets, test enrichments on a subset first
- Verify calculations produce expected results before applying to full data
### Reusability and Efficiency
**Copy Enrichments Between Projects**:
- Use the copy/paste feature to move enrichment notebooks between projects
- Adapt common enrichments (performance, basic conformance) across similar processes
- Update attribute references to match the new project's data
**Verify Attribute Compatibility**:
- When copying enrichments, ensure the target project has the required attributes
- Update activity names and field references as needed
- Recalculate to confirm everything works correctly
:::
## Common Use Cases
### Tracking Department Performance
**Scenario**: You want to measure how long each department takes to complete their activities.
**Solution**:
1. Use the Performance Wizard
2. Add activity pairs that represent department handoffs
3. Set custom SLAs for each department's expected performance
4. Calculate enrichments
5. Use the performance categories in dashboards to show department performance
### Identifying Process Bottlenecks
**Scenario**: You need to find where cases spend the most time.
**Solution**:
1. Run the Performance Wizard to calculate all activity pair durations
2. Create analysis using the duration attributes
3. Filter for "Slow" categorized cases
4. Build a breakdown calculator showing which activity pairs have the longest durations
5. Publish to a dashboard for ongoing monitoring
### Measuring Against SLAs
**Scenario**: Your organization has specific SLA targets for case completion.
**Solution**:
1. Use the Performance Wizard for case duration
2. Configure the Fast/Normal/Slow thresholds to match your SLAs
3. Calculate enrichments to categorize all cases
4. Create dashboard metrics showing % of cases meeting SLA (Fast + Normal)
5. Use drill-down to investigate cases exceeding SLA (Slow)
:::next-steps
## Next Steps
Now that you've mastered the log enrichment engine, you can:
- **Build Conformance Rules**: Learn to create rule-based conformance checks to identify process deviations (see "Building Conformance Rules for Process Compliance")
- **Implement Activity-Based Costing**: Use the Activity Info Wizard to add cost calculations (see "Advanced: Implementing Activity-Based Costing")
- **Create Analysis**: Leverage your enriched attributes to build powerful analysis with filters and calculators (see "Creating Analysis with Filters and Calculators")
- **Publish Dashboards**: Transform your enriched data into actionable dashboards (see "Publishing Metrics from Notebooks to Dashboards")
:::
:::key-takeaways
## Key Takeaways
- **Two Datasets**: mindzie maintains both original and enriched datasets
- **Performance Wizard**: Fastest way to add comprehensive performance metrics
- **Activity Pairs**: Control exactly which durations are measured
- **Custom SLAs**: Apply your organization's performance thresholds
- **Notebook Organization**: Group related enrichments for better project management
- **Calculate to Apply**: Always execute the pipeline to apply enrichments to data
- **Enriched Attributes**: New attributes become available throughout mindzie Studio
- **Foundation for Analysis**: Enrichment unlocks advanced analytical capabilities
The log enrichment engine transforms basic event logs into rich, analytical datasets. Master this capability, and you'll unlock the full power of process mining with mindzie Studio.
:::
---
## Building Conformance Rules for Compliance
Section: How To
URL: https://docs.mindziestudio.com/mindzie_studio/how-to/building-conformance-rules-for-compliance
Source: /docs-master/mindzieStudio/how-to/building-conformance-rules-for-compliance/page.md
# Building Conformance Rules for Process Compliance
:::overview
## Overview
Conformance checking is a critical component of process mining that helps organizations identify when their actual process execution deviates from expected or desired behavior. mindzie studio uses rule-based conformance to flag process violations, allowing you to monitor compliance, identify exceptions, and enforce process standards across your organization.
This guide walks you through creating and implementing conformance rules in mindzie studio, including how to identify undesired activities, set severity levels, detect missing steps, flag activity order violations, and apply these rules to your enriched dataset.
:::
## What is Rule-Based Conformance?
Rule-based conformance in mindzie studio allows you to define specific conditions that represent either desired or undesired process behavior. Unlike model-based conformance (which compares execution to an idealized process model), rule-based conformance lets you create targeted checks for specific compliance concerns.
With rule-based conformance, you can:
- **Flag undesired activities** that should not occur in a well-executed process
- **Identify mandatory activities** that must appear in every case
- **Detect wrong activity order** when steps occur in an incorrect sequence
- **Flag repeated activities** that indicate rework or inefficiency
- **Set severity levels** to prioritize compliance issues (low, medium, high)
These conformance rules become enrichments that are added to your dataset, creating new attributes you can use for analysis, filtering, and dashboard metrics.
:::prerequisites
## Prerequisites
Before creating conformance rules, you should have:
- A mindzie studio project with data already uploaded
- Familiarity with the log enrichment engine
- Understanding of your process activities and expected workflow
- Knowledge of which process behaviors represent compliance violations
:::
## Accessing the Conformance Enrichment Tools
Conformance rules are created within the log enrichment section of mindzie studio.
### Step 1: Navigate to Log Enrichment
1. Open your project in mindzie studio
2. Click on **Enrichments** in the main navigation
3. You'll see existing enrichment notebooks on the left sidebar
### Step 2: Create or Use a Conformance Notebook
For organization purposes, it's helpful to group conformance rules together:
1. Create a new enrichment notebook called "Conformance" (or use an existing one)
2. This notebook will contain all your conformance rule blocks
3. Click **Add New** to begin adding conformance enrichments

The enrichment library shows various types of enrichments you can add. Look for conformance-related options.
## Creating Undesired Activity Rules
Undesired activities are process steps that indicate problems, exceptions, or deviations from the ideal workflow. Common examples include exception handling, reprocessing, rework loops, or manual interventions.
### Step 1: Select Undesired Activity Enrichment
1. Click **Add New** in your conformance notebook
2. Browse or search for **Undesired Activity** in the enrichment library
3. Select it to open the configuration dialog
### Step 2: Configure the Rule

In the configuration dialog, you'll need to specify:
**Title**: Give your rule a descriptive name (e.g., "Handle Exceptions", "Reprocess Application")
**Description** (optional): Add context about why this activity is undesired
**Rule Group Name**: This categorizes the rule (default is "Activity performed")
**Severity**: Choose the severity level for this violation:
- **Low**: Minor issues that should be monitored but are not critical
- **Medium**: Notable violations that require attention
- **High**: Critical compliance issues that demand immediate action
**Activity Attribute Values**: Select which activities from your process should be flagged as undesired. The dialog shows all available activities from your dataset with case counts and percentages.
### Step 3: Select Undesired Activities
From the list of activities, select the ones that represent undesired behavior. For example:
- Handle Exceptions / Missing Documentation
- Reprocess Application
- Manual Override
- Exception Handling
- Rework Required
You can select multiple activities if they all represent the same type of conformance issue.
### Step 4: Set Severity Level
Choose an appropriate severity level based on the business impact:
- **High**: Activities that represent serious compliance violations (e.g., skipped approval steps, regulatory violations)
- **Medium**: Activities that indicate inefficiency or quality issues (e.g., exception handling, reprocessing)
- **Low**: Activities that are undesirable but not critical (e.g., minor rework)
### Step 5: Create the Rule
Click **Create** to add the conformance rule block to your notebook.

You'll now see a new block in your conformance notebook labeled "Handle Exceptions" (or whatever you named it). The block shows the configuration and is ready to be calculated.
## Additional Conformance Rule Types
mindzie studio supports several other types of conformance rules beyond undesired activities:
### Mandatory Activities
Use this rule type to identify cases where required activities are missing.
**Use cases:**
- Ensuring all cases include approval steps
- Verifying required documentation checks occurred
- Confirming compliance activities were completed
**Configuration:**
- Select which activities must appear in every case
- Set severity level for missing mandatory activities
- Cases without these activities will be flagged
### Wrong Activity Order
Detect when activities occur in an incorrect sequence.
**Use cases:**
- Flagging approvals that happen before reviews
- Identifying payments processed before authorization
- Detecting steps that skip required predecessors
**Configuration:**
- Define the expected sequence of activities
- Specify which ordering violations to flag
- Set severity based on compliance impact
### Repeated Activities
Identify cases where activities occur more than once, indicating rework or loops.
**Use cases:**
- Detecting rework and quality issues
- Identifying inefficient process loops
- Flagging repeated approvals or reviews
**Configuration:**
- Select activities that should only occur once
- Set threshold for how many repetitions trigger the flag
- Assign severity level
## Calculating Conformance Enrichments
After creating your conformance rules, you must execute the data pipeline to apply them to your dataset.
### Step 1: Calculate Enrichments
1. Click the **Calculate Enrichments** button at the top of the enrichment section
2. mindzie will execute the data pipeline and apply all conformance rules
3. This process takes your original dataset and creates an enriched dataset with new conformance attributes
### Step 2: Wait for Processing
The calculation time depends on your dataset size. You'll see a loading indicator while the enrichment is being processed.

### Step 3: Verify Enrichment Completion
Once processing completes, your enriched dataset will be updated with new conformance attributes that you can use in analysis and dashboards.
## Viewing Conformance Attributes in Your Dataset
After calculating conformance enrichments, new attributes are added to your enriched dataset.
### Accessing the Data Overview
1. Click on **Datasets** in the main navigation
2. Select your **enriched dataset** (not the original dataset)
3. Click on the **Overview** tab
### Finding Conformance Attributes
Scroll through the attribute list to find your conformance enrichments. They typically appear with special icons indicating they are enriched attributes created by mindzie.
Look for attributes with names matching your conformance rules:
- **Conformance Issue** - A flag indicating whether any conformance violation occurred
- **Compliance Flag** - Specific flags for each rule type
- Individual rule names (e.g., "Handle Exceptions", "Missing Approval")
These attributes can now be used in:
- **Filters** to isolate conformance violations
- **Calculators** to count or analyze violations
- **Dashboards** to display compliance metrics
- **Root cause analysis** to identify factors contributing to violations
## Using Conformance Attributes in Analysis
Once conformance attributes are created, you can leverage them throughout mindzie studio:
### Create Compliance Dashboards
- Add KPIs showing percentage of cases with conformance issues
- Display trend charts showing conformance over time
- Break down violations by severity level
- Show top conformance issues by frequency
### Filter Cases for Investigation
- Use filters to show only cases with high-severity violations
- Isolate cases with specific conformance issues
- Analyze process maps filtered to conformance violations
- Export lists of non-compliant cases for remediation
### Perform Root Cause Analysis
- Investigate what factors correlate with conformance violations
- Identify departments, resources, or case types with higher violation rates
- Understand environmental factors contributing to non-compliance
### Monitor Continuous Compliance
- Set up dashboards for ongoing monitoring
- Track compliance metrics as new data is loaded
- Alert stakeholders when violation rates exceed thresholds
:::best-practices
## Best Practices for Conformance Rules
### Start with High-Impact Rules
Focus first on conformance rules that address the most critical compliance concerns or business risks. You can always add more detailed rules later.
### Use Appropriate Severity Levels
- **High**: Reserve for serious compliance violations, regulatory issues, or high-risk activities
- **Medium**: Use for quality issues, inefficiencies, or process deviations that need attention
- **Low**: Apply to minor issues that should be monitored but aren't urgent
### Organize Rules into Notebooks
Create separate enrichment notebooks for different types of conformance:
- Regulatory compliance rules
- Quality control rules
- Efficiency and performance rules
- Business policy rules
### Document Your Rules
Use the description field to explain why an activity is undesired or why a rule was created. This helps other analysts understand the compliance framework.
### Review and Refine Rules Regularly
As your process evolves, review conformance rules to ensure they remain relevant:
- Remove rules that no longer apply
- Update severity levels based on changing business priorities
- Add new rules as new compliance requirements emerge
### Combine Multiple Rule Types
Use a combination of undesired activities, mandatory activities, and wrong order rules to create comprehensive compliance monitoring.
:::
## Common Use Cases
### Financial Services Compliance
- Flag missing KYC (Know Your Customer) checks
- Detect unauthorized approvals
- Identify missing anti-money laundering reviews
- Track exceptions to standard procedures
### Healthcare Process Compliance
- Ensure required patient consent activities
- Flag missing documentation steps
- Detect out-of-sequence treatment activities
- Monitor compliance with clinical protocols
### Manufacturing Quality Control
- Identify skipped inspection steps
- Flag rework and reprocessing activities
- Detect missing quality checks
- Monitor deviation from standard operating procedures
### Order-to-Cash Processes
- Ensure credit checks occur before fulfillment
- Flag shipments without proper authorization
- Detect missing invoice approvals
- Identify exception handling in payment processing
## Troubleshooting
### Conformance Attributes Not Appearing
If your conformance attributes don't appear after calculation:
- Verify you clicked "Calculate Enrichments" after creating rules
- Check that the calculation completed successfully (no error messages)
- Ensure you're viewing the enriched dataset, not the original dataset
- Refresh the data overview page
### All Cases Flagged as Violations
If every case shows conformance violations:
- Review your rule configuration to ensure the logic is correct
- Check that you selected the right activities
- Verify the rule type matches your intention (e.g., mandatory vs. undesired)
### Rules Not Detecting Expected Violations
If known violations aren't being flagged:
- Confirm activity names match exactly (case-sensitive)
- Check that the rule severity is set appropriately
- Verify the enrichment calculation completed
- Test with a simple rule first to confirm the system is working
:::next-steps
## Next Steps
After creating conformance rules, you can:
- **Create compliance dashboards** displaying conformance metrics for different user roles
- **Build analysis notebooks** that investigate root causes of conformance violations
- **Set up filters** to isolate and examine non-compliant cases
- **Publish KPIs** showing conformance trends over time to executive dashboards
- **Combine with performance metrics** to understand the relationship between compliance and efficiency
:::
## Related Topics
- **Mastering the Log Enrichment Engine** - Learn about other types of enrichments you can create
- **Creating Analysis with Filters and Calculators** - Use conformance attributes in your analysis
- **Publishing Metrics from Notebooks to Dashboards** - Display conformance KPIs to end users
- **Working with Root Cause Analysis** - Investigate factors contributing to conformance violations
---
Conformance rules are powerful tools for ensuring your processes operate within expected parameters. By systematically flagging deviations, you can maintain process quality, ensure regulatory compliance, and drive continuous improvement across your organization.
---
## Creating Analysis with Filters and Calculators
Section: How To
URL: https://docs.mindziestudio.com/mindzie_studio/how-to/creating-analysis-with-filters-and-calculators
Source: /docs-master/mindzieStudio/how-to/creating-analysis-with-filters-and-calculators/page.md
# Creating Analysis with Filters and Calculators
:::overview
## Overview
mindzie studio provides a powerful low-code/no-code approach to building process analysis through a fundamental paradigm: **analysis, filters, and calculators**. This tutorial guides you through creating meaningful metrics and insights using mindzie's extensive library of pre-built filters and calculators, eliminating the need for complex coding or manual calculations.
By combining filters to isolate specific data segments with calculators to visualize insights, you can quickly build sophisticated process metrics that answer critical business questions about performance, efficiency, and compliance.
:::
:::prerequisites
## Prerequisites
Before creating analysis with filters and calculators, you should have:
- An active mindzie studio project with data loaded
- Completed log enrichment to create enhanced attributes (see "Mastering the Log Enrichment Engine")
- Created an investigation and analysis notebook (see "Working with Investigations and Analysis Notebooks")
- Understanding of your dataset's attributes and structure
:::
## Understanding the Analysis-Filter-Calculator Paradigm
mindzie studio organizes analytical work around three core building blocks:
### Analysis (The Workspace)
Analysis notebooks are similar to Jupyter notebooks - they serve as your workbook or worksheet where you discover and create metrics. Each analysis provides a dedicated space for exploring specific aspects of your process.
### Filters (Data Isolation)
Filters allow you to isolate specific data segments for targeted analysis. They answer the question: "What data do I want to work with?" Examples include:
- Filtering by division, department, or region
- Isolating cases from specific time periods
- Selecting cases with particular attributes
- Separating data by process variant or outcome
### Calculators (Visualizations and Metrics)
Calculators are visualizations that answer the question: "What do I want to do with that data?" They transform your filtered data into actionable insights through charts, statistics, process maps, and other visual representations.
### The Power of Combination
The true power lies in combining these blocks. You can stack multiple filters and multiple calculators to create sophisticated analysis that addresses complex business questions without writing a single line of code.
## Creating Your First Analysis: Average Process Duration
This walkthrough demonstrates creating a simple yet powerful metric - the average duration of customer onboarding cases - using the filter and calculator approach.
### Step 1: Access Your Analysis Notebook
1. Navigate to your investigation in the left sidebar
2. Click on the analysis notebook you want to work in
3. Ensure you're viewing the "Notebook" tab in the analysis interface
You'll see the main analysis workspace with buttons across the top for adding different block types.

The toolbar includes:
- **Add Filter** - Add data filtering blocks
- **Add Calculator** - Add visualization and metric blocks
- **Add Alert** - Create automated alerts based on thresholds
- **Paste Block** - Paste previously copied analysis blocks
- **Expand/Collapse** - Control the copilot sidebar visibility
### Step 2: Understanding When to Use Filters
For this first metric, we'll focus on calculators without applying filters. This gives us an overall average across all cases in the dataset.
Filters become essential when you need to:
- Compare performance across different divisions or regions (e.g., US vs. Europe)
- Analyze specific time periods (e.g., Q1 vs. Q2)
- Isolate problematic cases (e.g., only cases that violated compliance rules)
- Segment by any case or event attribute
To browse available filters, click the "Add Filter" button.

mindzie provides an extensive library of pre-built filters organized by category:
- **Recommended** - Common filters based on your data
- **Attribute** - Filter by case or event attribute values
- **Frequency** - Filter by activity occurrence counts
- **Time** - Filter by time periods and date ranges
- **Duration** - Filter by process or activity duration
- **Order** - Filter by activity sequence
- **Activity** - Filter by specific activities
- **Logical** - Combine filters with AND/OR logic
Each filter includes a description explaining its purpose, making it easy to find the right tool for your analysis needs.
### Step 3: Adding a Calculator
Click the "Add Calculator" button to open the calculator library.

The calculator library is organized into categories:
- **Recommended** - Calculators suited to your current context
- **Overview** - Summary statistics and KPIs
- **AI** - Machine learning-powered insights
- **Attribute** - Attribute-based analysis and distributions
- **Frequency** - Activity frequency analysis
- **Time** - Time-based trends and patterns
- **Duration** - Duration metrics and distributions
- **Integrity** - Data quality and conformance metrics
- **Advanced** - Specialized calculators for complex analysis
- **Hospital** - Healthcare-specific metrics (if applicable)
### Step 4: Search for the Average Calculator
Use the search box at the top of the calculator library to quickly find what you need.
1. Type "average" in the search box
2. Select "Average Value" from the filtered results

The search functionality saves time when working with mindzie's extensive library of 40+ calculators. You can search by calculator name, category, or function.
### Step 5: Configure the Calculator Attribute
After selecting the Average Value calculator, you need to specify which attribute to calculate the average for.
1. Click on the "Attribute Name" dropdown in the calculator configuration
2. Search for "duration" in the attribute list
3. Select "Case Duration"

**Why Case Duration is Available:**
The Case Duration attribute exists because you previously ran the data through the mindzie Log Enrichment Engine. The Performance Wizard or other enrichment blocks calculated this attribute by analyzing the timestamp differences between case start and completion events.
This highlights the critical relationship between log enrichment and analysis: enrichments create the attributes that power your calculators.
### Step 6: View the Result
Once you select the Case Duration attribute and add the calculator, mindzie immediately calculates and displays the result.

The result block shows:
- **Calculator type** - "Average Value" header
- **Attribute name** - "Case Duration" (the attribute being averaged)
- **Calculated metric** - "22.69 Days" (the average duration across all cases)
- **Action buttons** - Options to add to dashboard, configure, or remove
This metric now represents a key performance indicator (KPI) for your process: on average, customer onboarding takes 22.69 days from start to finish.
## Building More Complex Analysis
### Combining Multiple Filters
To create segmented analysis, you can add multiple filters to the same analysis block:
1. Click "Add Filter" to add your first filter (e.g., filter by Division = "North America")
2. Click "Add Filter" again to add additional filters (e.g., filter by Year = "2024")
3. Add your calculator (e.g., Average Value on Case Duration)
The filters work together (typically with AND logic) to narrow your data to exactly the segment you want to analyze.
### Adding Multiple Calculators
You can add multiple calculators to the same filtered dataset to view different perspectives:
1. Add filters to define your data segment
2. Add multiple calculators (e.g., Average Value, Distribution chart, Trend over time)
3. Each calculator operates on the same filtered data, providing complementary insights
### Creating Comparative Analysis
To compare performance across segments:
1. Create separate analysis blocks for each segment
2. Use filters to isolate each segment (e.g., one block for US region, another for Europe)
3. Use the same calculator configuration in each block
4. Compare the results side-by-side or publish them to the same dashboard
## Advanced Calculator Configuration
Many calculators offer additional configuration options beyond attribute selection:
- **Aggregation methods** - Choose between average, median, sum, min, max
- **Grouping** - Group results by another attribute (e.g., show average duration by department)
- **Time bucketing** - Show trends over days, weeks, months, or years
- **Visual styling** - Customize colors, labels, and display formats
- **Thresholds** - Set performance targets or warning levels
Explore each calculator's configuration panel by clicking the three-dot menu on the calculator block.
## Leveraging Enriched Attributes
The power of filters and calculators depends heavily on having meaningful attributes to analyze. Common enriched attributes that enable powerful analysis include:
**Performance Attributes** (from Performance Wizard):
- Case Duration
- Activity Duration
- Time Between Activities
- Performance Buckets (Fast, Normal, Slow)
**Conformance Attributes** (from Conformance Rules):
- Conformance Status (Compliant/Non-Compliant)
- Rule Violation Counts
- Severity Levels
**Cost Attributes** (from Activity Info Wizard):
- Case Total Cost
- Activity Costs
- Resource Costs
**AI Predictions** (from AI enrichments):
- Predicted Completion Time
- Risk Scores
- Recommended Actions
Without enrichment, you're limited to analyzing only the original data attributes (Case ID, Activity Name, Timestamp, Resource). Enrichment unlocks the full analytical potential of mindzie studio.
:::best-practices
## Best Practices
### Start Simple, Then Refine
Begin with basic metrics like overall averages or counts before adding complex filters. This helps you:
- Understand the baseline performance
- Verify your data is loading correctly
- Build confidence with the interface before tackling complex scenarios
### Use Descriptive Analysis Names
When creating analysis notebooks, use clear names that describe what you're investigating:
- "Average Onboarding Duration" (clear)
- "Analysis 1" (unclear)
### Organize Filters Logically
When using multiple filters, organize them in a logical order:
1. Time-based filters first (year, quarter, month)
2. Structural filters second (division, department, region)
3. Outcome-based filters last (conformance status, performance bucket)
### Reuse Successful Patterns
Once you create an effective analysis, you can:
- Copy the entire analysis block and modify the filters
- Copy it to other investigations in the same project
- Copy it to other projects (see "Reusing Analysis: Copying and Adapting Notebooks")
### Document Your Analysis
Use the notes feature in analysis notebooks to document:
- What question the analysis answers
- What filters and calculators you're using and why
- Any assumptions or data limitations
- How to interpret the results
:::
## Common Use Cases
### Performance Benchmarking
**Goal:** Compare average process duration across regions
1. Create one analysis block per region
2. Add a "Cases with Attribute" filter for each region (e.g., Region = "North America")
3. Add the Average Value calculator with Case Duration attribute
4. Publish all metrics to the same dashboard for side-by-side comparison
### Trend Analysis
**Goal:** Track how performance changes over time
1. Add a Time Period filter to select your date range
2. Add a Trend calculator configured to show Case Duration over time
3. Set the time bucket to Month or Quarter
4. Look for seasonal patterns or improvement trends
### Root Cause Investigation
**Goal:** Understand why some cases take longer than others
1. Add a Performance Bucket filter to isolate "Slow" cases
2. Add multiple calculators to explore different dimensions:
- Variant DNA to see which process paths are slow
- Attribute Distribution to see which departments have slow cases
- Root Cause Analysis to identify statistically significant factors
### Conformance Monitoring
**Goal:** Measure compliance rule violations
1. Add a Conformance Status filter to select "Non-Compliant" cases
2. Add calculators to quantify the problem:
- Count of non-compliant cases
- Percentage of total cases
- Breakdown by violation type
- Trend over time
## Troubleshooting
### Calculator Shows "No Data"
**Causes:**
- Filters are too restrictive and exclude all cases
- Selected attribute doesn't exist in your dataset
- Data hasn't finished loading
**Solutions:**
- Remove filters one at a time to identify which is too restrictive
- Verify the attribute exists in Data Overview tab
- Check that enrichments have been calculated successfully
### Attribute Not in Dropdown List
**Causes:**
- Enrichment hasn't been calculated yet
- Enrichment failed due to configuration error
- Using original dataset instead of enriched dataset
**Solutions:**
- Navigate to Log Enrichment and calculate the enrichment
- Check enrichment configuration for errors
- Verify your investigation is using the enriched dataset
### Calculator Result Seems Wrong
**Causes:**
- Filters not configured as intended
- Wrong attribute selected
- Data quality issues in source data
**Solutions:**
- Review filter configuration carefully
- Verify attribute selection matches your intention
- Check Data Overview to manually inspect attribute values
- Use Case Explorer to examine individual cases
:::next-steps
## Next Steps
Now that you understand how to create analysis with filters and calculators, you can:
- **Publish your metrics** - Learn how to add analysis blocks to dashboards for end users (see "Publishing Metrics from Notebooks to Dashboards")
- **Create enrichments** - Build more powerful analysis by creating custom attributes (see "Mastering the Log Enrichment Engine")
- **Explore advanced calculators** - Try AI-powered calculators like Root Cause Analysis and Predictions
- **Build dashboards** - Combine multiple metrics into comprehensive dashboards for different user roles (see "Planning Your Dashboard Structure for Different User Roles")
:::
## Summary
The analysis-filter-calculator paradigm is the foundation of all work in mindzie studio. By mastering these building blocks, you can:
- Create sophisticated metrics without coding
- Answer complex business questions through visual analysis
- Rapidly iterate and refine your investigations
- Build reusable analysis patterns that can be adapted across projects
Remember: filters define "what data" you're analyzing, and calculators define "what you want to know" about that data. The combination of these two simple concepts enables unlimited analytical possibilities.
---
## Publishing Metrics from Notebooks to Dashboards
Section: How To
URL: https://docs.mindziestudio.com/mindzie_studio/how-to/publishing-metrics-from-notebooks-to-dashboards
Source: /docs-master/mindzieStudio/how-to/publishing-metrics-from-notebooks-to-dashboards/page.md
# Publishing Metrics from Notebooks to Dashboards
:::overview
## Overview
Once you've created analysis metrics and KPIs in mindzie studio notebooks, the next step is to make them accessible to your end users by publishing them to dashboards. mindzie studio provides a flexible publishing system that allows you to control both where metrics appear and how users interact with them. This guide explains the difference between local and global dashboards, and walks through the complete process of publishing metrics for user consumption.
:::
## Understanding Dashboard Types
mindzie studio uses two types of dashboards, each serving a different purpose:
### Local Dashboards (Analyst View)
Local dashboards are built at the notebook level and are designed primarily for analysts who are creating and refining analysis. These dashboards:
- Display within the notebook interface alongside other analysis tabs
- Serve as a staging area for metrics before publishing to global dashboards
- Allow analysts to organize related metrics together
- Can be configured as the default view when users drill into a metric
### Global Dashboards (End User View)
Global dashboards are role-based, user-facing dashboards that business users access to monitor process performance. These dashboards:
- Are accessible from the main dashboards section of mindzie studio
- Are organized by user role or business function (e.g., Executive Overview, Operations, Compliance)
- Display published metrics from multiple analysis notebooks
- Support drill-down capabilities that allow users to investigate metrics in detail
:::prerequisites
## Prerequisites
Before publishing metrics to dashboards, ensure you have:
- Created at least one analysis notebook with completed metrics (filters and calculators)
- Defined your global dashboard structure (dashboards should already exist)
- Identified which metrics should be published to which role-based dashboards
:::
## Publishing a Metric to Dashboards
### Step 1: Add a Title and Description to Your Metric
Before publishing, it's important to add clear titles and descriptions to your metrics so users understand what they represent.
1. In your analysis notebook, locate the metric you want to publish
2. Click the **three-dot menu** (options menu) on the metric panel
3. The metric configuration dialog will appear with fields for:
- **Title**: Enter a descriptive name for the metric (e.g., "Average Value", "Average Onboarding Duration")
- **Description**: Add an explanation of what the metric shows or why it's important

4. Click **Create** to save the configuration
### Step 2: Publish to Local Dashboard
Publishing to the local dashboard makes the metric appear on the notebook's dashboard tab, which is useful for organizing multiple related metrics.
1. From the same **three-dot menu** on the metric panel
2. Select the option to add the metric to a dashboard
3. You'll see a preview showing how the metric will appear (e.g., "23 days")

The metric is now visible on the **Dashboard** tab within your notebook. This local dashboard tab can display multiple metrics and serves as an analyst workspace.
### Step 3: Publish to Global Dashboard
To make the metric available to end users, you need to publish it to one or more global dashboards.
1. Click the **three-dot menu** on the metric panel again
2. Select the option to publish or add to a global dashboard
3. A **Select A Dashboard** dialog will appear showing all available global dashboards

4. Browse through your dashboards (e.g., Branch/Channel Performance Dashboard, Compliance & Risk Dashboard, Operations Dashboard, Process Overview Dashboard)
5. Click on the dashboard where you want this metric to appear
6. Click **Add Panel** to confirm
The metric is now published to the selected global dashboard and will be visible to users who have access to that dashboard.

## Configuring Drill-Down Behavior
One of the powerful features of mindzie studio dashboards is the ability for users to drill into metrics to see the underlying analysis. You can control what users see when they click on a dashboard metric.
### Using the Pin Feature
The pin feature allows you to set which notebook tab users land on when they drill into a metric from a global dashboard.
1. Open your analysis notebook
2. Navigate to the tab you want users to see by default (options include):
- Dashboard (local analyst view with multiple metrics)
- Process Map
- Variant DNA
- Data Overview
- Case Explorer
3. Click the **pin icon** on that tab to set it as the default drill-down view
When users click on the metric from a global dashboard, they'll be taken directly to the pinned tab in the underlying notebook. For most use cases, pinning the local **Dashboard** view provides users with a comprehensive set of related metrics and context.
## Adding User Guidance with Note Panels
To help users understand what they're looking at and how to use the metrics, you can add note panels directly to dashboards.
### Creating a Note Panel
1. In your dashboard view, click the **Note** button in the toolbar
2. The **Dashboard Note Panel** dialog will appear

3. Configure the note panel:
- **Title**: Enter a title for the note (optional)
- **Note**: Add your instructional text, explanations, or tips
- **Disable Title**: Check this option to hide the title for a cleaner look
- **Background Color**: Choose a background color scheme
- **Title Color**: Set the title text color
- **Text Color**: Set the body text color
4. Click **Create** to add the note panel to your dashboard
### Best Practices for Note Panels
- Use notes to explain what the dashboard shows and who it's designed for
- Add tips on how to interpret metrics or how to drill down for more detail
- Include context about data refresh schedules or data sources
- Consider using notes to provide instructions for less technical users
## Working with Multiple Dashboards
As you build out your mindzie studio project, you'll likely create multiple notebooks and publish metrics to various global dashboards. The interface makes it easy to manage metrics across dashboards.

### Publishing the Same Metric to Multiple Dashboards
You can publish a single metric to multiple global dashboards if it's relevant to different user roles:
1. Use the three-dot menu on the metric
2. Select each dashboard where the metric should appear
3. The metric will be displayed on all selected dashboards
### Using the Edit Layout Feature
To arrange how metrics appear on dashboards:
1. Click the **Edit Layout** button in the dashboard toolbar
2. Drag and drop panels to rearrange them
3. Resize panels as needed to emphasize important metrics
4. Click **Save** when you're satisfied with the layout
## Understanding Continuous Monitoring
An important concept in mindzie studio is that dashboards are designed not only for initial process discovery but also for **continuous monitoring**. This has important implications for how you publish metrics:
### Automatic Metric Recalculation
Once you've published metrics to dashboards and set up your complete structure:
- If data is refreshed on a schedule (via connection to source systems), all metrics automatically recalculate
- If you manually upload a new CSV file or data export, all metrics will update to reflect the new data
- Users can monitor trends over time as the data refreshes
- No need to manually update calculations or republish metrics
This means the effort you put into building and publishing metrics pays off continuously as new data flows through the system.
## Complete Publishing Workflow Summary
Here's the complete workflow for taking analysis from creation to user consumption:
1. **Create your analysis** in a notebook using filters and calculators
2. **Add titles and descriptions** to make metrics self-explanatory
3. **Publish to local dashboard** to organize metrics within the notebook
4. **Publish to global dashboards** to make metrics available to end users
5. **Configure drill-down behavior** by pinning the appropriate tab
6. **Add note panels** to provide user guidance and context
7. **Arrange dashboard layout** using Edit Layout for optimal presentation
8. **Test the user experience** by clicking on metrics to verify drill-down behavior
## Tips for Effective Dashboard Publishing
- **Plan your dashboard structure first**: Create empty global dashboards organized by role before you start publishing metrics
- **Be selective**: Only publish metrics that are relevant to the specific dashboard's audience
- **Use descriptive titles**: Metric titles should be immediately understandable without additional context
- **Add context with descriptions**: Use the description field to explain calculation methods or business significance
- **Leverage note panels**: Don't assume users know how to use the dashboards—provide instructions
- **Think about drill-down**: Consider what additional information users might want when they click a metric
- **Test the user perspective**: View dashboards as different user roles to ensure the right metrics are visible
- **Organize local dashboards**: Group related metrics together on local dashboards to provide comprehensive views
## Next Steps
Now that you've learned how to publish metrics to dashboards, you can:
- Learn about [Creating Analysis with Filters and Calculators](../08-creating-analysis-with-filters-and-calculators/) to build more sophisticated metrics
- Explore [Designing User-Friendly Dashboards with Notes and Formatting](../12-designing-user-friendly-dashboards/) for advanced dashboard customization
- Understand [Drill-Down and Continuous Monitoring](../13-understanding-drill-down-and-continuous-monitoring/) to maximize the value of your dashboards
## Related Topics
- [Planning Your Dashboard Structure for Different User Roles](../04-planning-your-dashboard-structure/)
- [Working with Investigations and Analysis Notebooks](../05-working-with-investigations-and-analysis-notebooks/)
- [Mastering the Log Enrichment Engine](../06-mastering-the-log-enrichment-engine/)
---
## Advanced: Implementing Activity Based Costing
Section: How To
URL: https://docs.mindziestudio.com/mindzie_studio/how-to/advanced-implementing-activity-based-costing
Source: /docs-master/mindzieStudio/how-to/advanced-implementing-activity-based-costing/page.md
# Advanced: Implementing Activity-Based Costing
:::overview
## Overview
Activity-based costing (ABC) is a powerful approach to calculating the true cost of processing cases in your organization. Unlike simple average cost estimates that assume every case takes the same amount of time and resources, activity-based costing accounts for the actual work performed in each case, including loops, rework, corrections, and process variations.
mindzie Studio provides the Activity Info Wizard and enrichment tools to implement activity-based costing, giving you accurate, detailed cost analysis for your processes. This advanced tutorial will guide you through setting up activity-based costing to calculate the true cost of each case in your process.
:::
## Why Activity-Based Costing?
Traditional cost estimation often relies on simple averages. For example, you might estimate that processing an invoice takes 30 minutes on average, so you calculate a flat cost per case based on that assumption. However, this approach has significant limitations:
- **Ignores process variations**: Some cases follow the happy path while others encounter exceptions and rework
- **Overlooks loops and repetition**: Cases that require reprocessing or corrections cost more but aren't captured in averages
- **Misses resource differences**: Work performed by different roles (managers vs. analysts) has different costs
- **Hides true complexity**: The real cost of exception handling and compliance issues remains invisible
Activity-based costing solves these problems by calculating costs at the activity level. mindzie Studio tracks every activity that occurs in each case, applies appropriate costs based on the work performed and who performed it, then aggregates those costs to show the true cost per case.
:::prerequisites
## Prerequisites
Before implementing activity-based costing, you should have:
- A mindzie Studio project with data already uploaded
- Basic understanding of log enrichment (see "Mastering the Log Enrichment Engine")
- Knowledge of your organization's cost structure (hourly rates for different roles, activity time estimates)
- Familiarity with your process activities and typical durations
:::
## Step 1: Navigate to Log Enrichment
Activity-based costing is implemented through the log enrichment engine, which enhances your data with calculated cost attributes.
1. In your mindzie Studio project, navigate to the **Log Enrichment** section
2. The enrichment area shows notebooks on the left side and the data overview on the right
3. You may already have enrichment notebooks for Performance Wizard or conformance rules

The enrichment interface allows you to add calculated attributes to your dataset. These enrichments run through the mindzie pipeline to create an enhanced dataset with all your cost information.
## Step 2: Launch the Activity Info Wizard
The Activity Info Wizard is a specialized tool for assigning cost and time information to each activity in your process.
1. In the left sidebar of Log Enrichment, click on **Activity Info Wizard** (shown in purple)
2. The Activity Info Wizard dialog will open, displaying all activities from your process
3. Each activity is listed with fields for configuration

The wizard shows all activities in your process, making it easy to configure cost and time estimates for each one systematically.
## Step 3: Configure Activity Costs and Time
For each activity, you can specify:
- **Display Name**: A user-friendly name for the activity (optional)
- **Color**: Visual identification for process maps and charts (optional)
- **Estimated Cost**: The cost associated with performing this activity
- **Estimated Time**: How long the activity typically takes (in minutes, hours, or days)
- **Conformance Issue Severity**: Whether this activity represents a conformance issue (optional)
- **Description**: Additional context about the activity (optional)
### Entering Cost Information
For each activity in your process:
1. Click on the activity in the list
2. In the **Estimated Cost** field, enter the cost for that activity
3. In the **Estimated Time** field, enter the typical duration and select the unit (Minutes, Hours, or Days)
**Cost Calculation Tips:**
- Base costs on resource hourly rates (e.g., if a manager earns $60/hour and an activity takes 30 minutes, cost = $30)
- For activities performed by different resources, use an average or weighted cost
- Consider overhead costs if applicable to your organization's accounting practices
- Be consistent with your cost units across all activities
### Example Costing Scenario
For a banking customer onboarding process:
- **Validate Applicant Information**: $15 (analyst, 15 minutes at $60/hour)
- **Perform KYC Check**: $30 (analyst, 30 minutes at $60/hour)
- **Review by Compliance Officer**: $50 (manager, 30 minutes at $100/hour)
- **Approve Application**: $40 (manager, 20 minutes at $120/hour)
- **Handle Exceptions**: $75 (manager + analyst, 45 minutes rework)
4. After configuring all activities, click **Save** to close the wizard
The Activity Info Wizard creates enrichment blocks that assign these cost and time estimates to each activity occurrence in your dataset.
## Step 4: Review Activity Cost Configuration
After saving the Activity Info Wizard configuration, you can view the results in the data overview.

The overview now shows all activities with their assigned attributes. You can export this list or review it to ensure your cost assignments are correct.
## Step 5: Create a Cost Enrichment Notebook
To keep your enrichments organized, create a dedicated notebook for cost-related enrichments.
1. In the Log Enrichment section, click the **three dots menu** (···) in the notebooks area
2. Select **Add New Notebook**
3. Name the notebook "Cost" or "Cost Calculations"
4. Click **Create**
This organizational step keeps cost enrichments separate from performance metrics or conformance rules, making your project easier to maintain.
## Step 6: Add a Summarize Enrichment
The Activity Info Wizard assigns costs to individual activities, but you need to aggregate those costs at the case level to answer questions like "What is the total cost of this case?"
The **Summarize** enrichment creates case-level attributes by aggregating activity-level data.
1. In your Cost notebook, click **Add New** to add a new enrichment block
2. The enrichment library will open

3. Search for or locate the **Summarize** enrichment (typically under the "Recommended" tab)
4. Click on **Summarize** to add it to your notebook
### Configure the Summarize Enrichment
The Summarize enrichment needs to know:
- **What attribute to summarize**: The estimated cost field from the Activity Info Wizard
- **What to name the result**: The new case-level attribute name
- **How to aggregate**: Sum, average, min, max, etc. (typically sum for costs)
Configuration steps:
1. **New Attribute Name**: Enter "Case Cost" (this will be the name of your new case-level cost attribute)
2. **Attribute to Summarize**: Select "Estimated Cost" (the activity-level cost from the Activity Info Wizard)
3. **Aggregation Method**: Choose "Sum" to total all activity costs within each case
4. Click **Create** or **Save**

The Summarize enrichment block now appears in your Cost notebook. This block will calculate the total cost for each case by summing the estimated costs of all activities that occurred in that case.
## Step 7: Calculate Enrichments
After configuring your cost enrichments, you need to execute the data pipeline to apply them to your dataset.
1. Click the **Calculate Enrichments** button (typically in the top-right area of the enrichment screen)
2. mindzie Studio will execute the data pipeline, processing your enrichments
3. Wait for the calculation to complete (this may take a few seconds to a few minutes depending on dataset size)
4. The enriched dataset will refresh with the new cost attributes
The calculation process:
- Applies the estimated cost from the Activity Info Wizard to each activity occurrence
- Aggregates those activity costs to case level using your Summarize enrichment
- Creates a new "Case Cost" attribute available for analysis
## Step 8: Verify Cost Attributes in Data Overview
After enrichment calculation completes, verify that your cost attributes were created successfully.
1. In the enrichment overview, scroll through the attribute list
2. Look for attributes added by the Activity Info Wizard (activity-level costs)
3. Locate your "Case Cost" attribute (case-level total cost)
4. Click on the attribute to see its values and distribution
You should now see cost attributes available throughout mindzie Studio for use in analysis, calculators, and dashboards.
## Step 9: Use Cost Data in Analysis
With activity-based costing implemented, you can now create powerful cost-related analysis and metrics.
### Creating Average Cost per Case
1. Navigate to **Investigations** in mindzie Studio
2. Create or open an analysis notebook (e.g., "Average Onboarding Cost")
3. Add a **Calculator** block
4. Search for "Average" calculator
5. Configure it to calculate the average of your "Case Cost" attribute
6. The calculator will display the average cost per case across your process
### Additional Cost Analysis Options
With activity-based costing in place, you can:
- **Compare costs by segment**: Use filters to compare costs across regions, departments, or customer types
- **Identify high-cost cases**: Filter cases where Case Cost exceeds a threshold
- **Analyze cost trends**: Use trend calculators to see how costs change over time
- **Break down costs by activity**: Use breakdown calculators to see which activities contribute most to overall cost
- **Correlate cost with conformance**: Analyze whether cases with conformance issues cost more
- **Monitor cost KPIs**: Publish cost metrics to dashboards for ongoing monitoring
## Understanding How Activity-Based Costing Works
The power of activity-based costing comes from its accuracy and detail:
### Accounting for Process Variations
Consider two customer onboarding cases:
**Case A (Happy Path)**:
1. Validate Applicant Information ($15)
2. Perform KYC Check ($30)
3. Conduct Risk Assessment ($25)
4. Approve Application ($40)
**Total Cost: $110**
**Case B (Exception Path)**:
1. Validate Applicant Information ($15)
2. Perform KYC Check ($30)
3. Handle Exceptions / Missing Documentation ($75)
4. Reprocess Application ($50)
5. Review by Compliance Officer ($50)
6. Conduct Risk Assessment ($25)
7. Approve Application ($40)
**Total Cost: $285**
With activity-based costing, mindzie Studio accurately calculates that Case B costs $285 (2.6x more expensive) while a simple average would miss this significant difference.
### Capturing Rework and Loops
If an activity is performed multiple times in a case (rework, loops), the cost is counted each time. For example, if "Handle Exceptions" occurs three times in a case, that activity's cost is multiplied by three in the case total.
This gives you true visibility into the cost of quality issues and process inefficiencies.
:::best-practices
## Best Practices for Activity-Based Costing
### Keep Cost Data Updated
- Review and update activity costs periodically as labor rates and processes change
- Document your cost assumptions for future reference
- Consider creating different cost scenarios (optimistic, realistic, pessimistic)
### Validate Your Results
- Compare activity-based costs to known benchmarks or historical averages
- Spot-check high-cost cases to ensure the calculations make sense
- Review activity costs with process owners to ensure accuracy
### Organize Your Enrichments
- Use dedicated notebooks for cost enrichments (as shown in Step 5)
- Add descriptions to enrichment blocks explaining the calculations
- Keep related enrichments together for easier maintenance
### Combine with Other Metrics
Activity-based costing is most powerful when combined with other analysis:
- **Cost + Duration**: Understand cost per unit time
- **Cost + Conformance**: Quantify the financial impact of process violations
- **Cost + Variants**: Identify which process paths are most expensive
- **Cost + Root Cause Analysis**: Determine what drives high costs
:::
## Troubleshooting
### "Case Cost attribute is not appearing"
- Ensure you clicked "Calculate Enrichments" after creating the Summarize block
- Wait for the pipeline calculation to complete (check for loading indicators)
- Refresh the data overview or navigate away and back
### "Costs seem incorrect or too high/low"
- Review Activity Info Wizard entries for data entry errors
- Check that time units (minutes vs. hours) are set correctly
- Verify the Summarize enrichment is using "Sum" aggregation
- Ensure estimated costs match your organization's accounting standards
### "Some cases show zero cost"
- Check if those cases contain activities that weren't assigned costs in the Activity Info Wizard
- Verify that all activities in your process have cost estimates
- Review the Activity Info Wizard to fill in any missing activity costs
:::next-steps
## Next Steps
After implementing activity-based costing, consider:
- **Publishing cost metrics to dashboards**: Share average cost, cost trends, and cost breakdowns with stakeholders
- **Creating cost-based alerts**: Set up monitoring for cases that exceed cost thresholds
- **Analyzing cost drivers**: Use root cause analysis to identify factors that drive high costs
- **Comparing cost scenarios**: Test process improvements by modeling their impact on costs
- **Integrating with financial systems**: Export cost data for integration with accounting and ERP systems
:::
## Related Topics
- **Mastering the Log Enrichment Engine**: Understanding the enrichment workflow and capabilities
- **Creating Analysis with Filters and Calculators**: Building cost-related metrics and visualizations
- **Publishing Metrics from Notebooks to Dashboards**: Sharing cost KPIs with end users
- **Working with Root Cause Analysis**: Identifying factors that contribute to high costs
---
Activity-based costing transforms cost analysis from rough estimates to precise, actionable insights. By leveraging mindzie Studio's Activity Info Wizard and enrichment capabilities, you gain true visibility into process costs, enabling data-driven decisions about process improvements and resource allocation.
---
## Reusing Analysis: Copying and Adapting Notebooks
Section: How To
URL: https://docs.mindziestudio.com/mindzie_studio/how-to/reusing-analysis-copying-and-adapting-notebooks
Source: /docs-master/mindzieStudio/how-to/reusing-analysis-copying-and-adapting-notebooks/page.md
# Reusing Analysis: Copying and Adapting Notebooks
:::overview
## Overview
One of the most powerful time-saving features in mindzie Studio is the ability to copy and reuse analysis notebooks and enrichments across projects or within the same project. Rather than building every analysis from scratch, you can leverage work you've already done by copying existing notebooks and adapting them to new use cases. This guide shows you how to efficiently copy analysis components, work with multiple projects simultaneously, and adapt copied content to match your current dataset.
:::
## Why Copy and Reuse Analysis?
When working with process mining analysis, you'll often find that similar metrics and calculations are needed across different projects or within different investigations in the same project. For example:
- **Common performance metrics** like average case duration or cost calculations are relevant across many processes
- **Standard conformance rules** can be applied to multiple projects with minor adjustments
- **Similar enrichment patterns** (activity-based costing, performance buckets, etc.) are used repeatedly
- **Dashboard templates** can be reused and customized for different business units or processes
By copying and adapting existing work, you can:
- Save significant time in building new analyses
- Maintain consistency across projects
- Leverage proven analysis patterns
- Focus on customization rather than creation from scratch
:::prerequisites
## Prerequisites
Before copying analysis between projects:
- You should have **at least two projects** (or two investigations within one project) - one source and one destination
- The source project should contain the **analysis or enrichment notebooks** you want to copy
- Your **destination dataset** should have compatible attributes (or you'll need to update the copied analysis to match your data)
- You should have **appropriate permissions** to both projects
:::
## Working with Multiple Project Tabs
To efficiently copy analysis between projects, you'll often work with multiple browser tabs open simultaneously.
### Opening Multiple Projects
1. **Navigate to your first project** in mindzie Studio
2. **Right-click the second project** and select "Open in new tab" (or use Ctrl+Click / Cmd+Click)
3. **Arrange your tabs** so you can easily switch between source and destination projects
4. This allows you to **copy from one project and paste into another** seamlessly
**Tip:** You can also copy within the same project by having the source notebook open in one view and the destination investigation ready in another.
## Copying Enrichment Notebooks
Enrichments are often good candidates for reuse because many enrichment patterns (performance calculations, conformance rules, costing models) apply across different processes.
### When to Copy Enrichments
Copy enrichments when you want to:
- Apply the same **performance calculation logic** to multiple projects
- Use **standard conformance rules** across similar processes
- Implement **consistent activity-based costing** models
- Cascade **common enrichment patterns** throughout your organization
### How to Copy an Enrichment Notebook
1. **Navigate to Log Enrichment** in your source project
2. **Locate the enrichment notebook** you want to copy (e.g., Performance Wizard, Conformance, Cost)
3. **Click the three-dot menu** next to the notebook name
4. **Select "Copy"** from the menu
5. **Switch to your destination project** (or investigation)
6. **Navigate to Log Enrichment** in the destination
7. **Click the three-dot menu** in the Enrichments area
8. **Select "Paste"** to insert the copied enrichment notebook

9. **Calculate enrichments** to execute the data pipeline and apply the new enrichment to your dataset
### Important Considerations for Copied Enrichments
When you paste an enrichment notebook:
- **Verify attribute compatibility:** Ensure the enrichment references attributes that exist in your destination dataset
- **Update activity names:** If the enrichment references specific activities (e.g., conformance rules), update them to match your new process
- **Recalculate the pipeline:** Always execute "Calculate Enrichments" after pasting to apply the changes
- **Check enrichment parameters:** Review SLA thresholds, cost values, or other parameters to ensure they're appropriate for the new context
## Copying Analysis Notebooks
Analysis notebooks contain your filters, calculators, and visualizations. Copying these can save substantial time when building similar analyses across different investigations.
### When to Copy Analysis Notebooks
Copy analysis notebooks when:
- You need **similar metrics** in different investigations (e.g., average duration for different departments)
- You're building **role-based dashboards** with similar KPI structures
- You want to **replicate a complex analysis pattern** without rebuilding all the filters and calculators
- You're **migrating proven analyses** from a pilot project to production projects
### How to Copy an Analysis Notebook
1. **Navigate to Investigations** in your source project
2. **Open the investigation** containing the analysis you want to copy
3. **Locate the analysis notebook** in the analyses list
4. **Click the three-dot menu** next to the analysis name
5. **Select "Copy"**
6. **Switch to your destination investigation** (same project or different project)
7. **Click the three-dot menu** in the Analyses panel
8. **Select "Paste"** to insert the copied analysis

The pasted analysis will appear in your investigation with all its filters, calculators, and dashboard configurations intact.

## Adapting Copied Notebooks to Your Data
Once you've pasted an analysis notebook, you'll typically need to adapt it to match your new context. Here's a systematic approach to updating copied content.
### Step 1: Update the Notebook Title
The copied notebook will retain its original name, which may reference the previous project or use case.
1. **Select the pasted analysis** from your investigations
2. **Update the title** to reflect the new context
- Example: "Claim Processing Cost" becomes "Customer Onboarding Cost"
3. **Update any descriptions** to match the new analysis purpose
### Step 2: Review and Update Filters
Copied analyses often contain filters that were specific to the source project's needs. Review each filter to determine if it's still relevant.

**Common filter updates needed:**
- **Activity-based filters:** Update activity names to match your current process
- Example: Change "Reopened Claim" filter to activities relevant to your process
- **Time-based filters:** Remove or update date ranges that were specific to the source analysis
- Example: Remove "Cases started in 2004" filter if not relevant
- **Attribute filters:** Verify that filtered attributes exist in your new dataset
**To remove an irrelevant filter:**
1. **Click the three-dot menu** on the filter block
2. **Select "Remove"** to delete the filter

**To update a filter:**
1. **Click "Edit"** on the filter block
2. **Update the attribute selection** to match your data
3. **Adjust filter criteria** as needed
4. **Save the updated filter**
### Step 3: Update Calculator Attributes
Calculators in the copied analysis may reference attributes that don't exist in your destination dataset, or you may want to calculate using different attributes.
**To update a calculator:**
1. **Click "Edit"** on the calculator block
2. **Review the attribute selection** (e.g., which duration or cost attribute is being used)
3. **Update to the appropriate attribute** from your enriched dataset
4. **Verify the calculation produces expected results**
5. **Update titles and labels** to reflect the new calculation
**Example:** A calculator using "Claim Processing Cost" might need to be updated to use "Case Cost" in your new project.
### Step 4: Adapt Root Cause Analysis Configurations
If your copied notebook includes root cause analysis blocks, these often need significant updates since they're tightly coupled to the source analysis context.

**To update root cause analysis:**
1. **Edit the root cause analysis block**
2. **Review the outcome metric** - ensure it references an attribute in your current dataset
3. **Update or remove case selection filters** that reference old activities or attributes
4. **Adjust the auto-select settings** or manually choose attributes for analysis
5. **Recalculate** to see results based on your new configuration
**Example:** A root cause analysis filtering for "cases where Settlement happened more than once" might be changed to analyze "cases with conformance issues" in your new context.
### Step 5: Update Dashboard Panels
If the copied analysis included dashboard panels:
1. **Review panel titles and notes** on both local and global dashboards
2. **Update descriptive text** to match the new analysis
3. **Remove dashboard panels** that are no longer relevant
4. **Re-publish to appropriate dashboards** if needed
### Step 6: Verify Results
After adapting all components:
1. **Review each calculator output** to ensure it's producing sensible results
2. **Check filter summaries** to verify they're selecting the expected cases
3. **Test drill-down behavior** if publishing to dashboards
4. **Validate against known data** to confirm calculations are correct
:::best-practices
## Best Practices for Copying and Adapting
### When to Reuse vs. Create from Scratch
**Copy and adapt when:**
- The analysis structure is similar and only details need changing
- You have proven, tested analysis patterns to replicate
- You need to save time and maintain consistency
- The source and destination datasets have similar structure
**Create from scratch when:**
- The analysis requirements are fundamentally different
- Your dataset structure is significantly different from the source
- You're exploring a new type of analysis or metric
- Adaptation would require changing most components anyway
### Cascading Common Enrichments
For organizations using mindzie Studio across multiple projects:
1. **Create a "template" project** with standard enrichments
2. **Copy proven enrichment patterns** to new projects as needed
3. **Maintain consistency** in how performance, conformance, and costing are calculated
4. **Document your standard enrichments** so team members know what's available to copy
### Managing Copied Content
- **Use clear naming conventions** to distinguish copied analyses during adaptation
- **Clean up as you go** - remove irrelevant filters and calculators immediately
- **Test incrementally** - verify each adapted component before moving to the next
- **Document customizations** using note blocks if the copied analysis has been significantly modified
### Common Pitfalls to Avoid
**Attribute mismatches:** Always verify that attributes referenced in copied content exist in your destination dataset. Missing attributes will cause calculators and filters to fail.
**Outdated filters:** Don't forget to remove filters that were specific to the source project's timeframe, business units, or special cases.
**Unchanged titles:** Update all titles, descriptions, and labels to reflect the new context. Leaving old names creates confusion.
**Skipping recalculation:** For enrichments, always calculate the pipeline after pasting. The enrichment won't be applied to your data until you execute the pipeline.
**Over-copying:** Just because you can copy everything doesn't mean you should. Only copy components that are genuinely useful in the new context.
:::
## Example Workflow: Copying a Cost Analysis
Let's walk through a complete example of copying a cost analysis from an insurance claims project to a banking onboarding project.
### Source Analysis (Insurance Project)
- **Analysis name:** "Claim Processing Cost"
- **Filters:**
- Cases where "Reopened Claim" activity occurred
- Cases started in 2004
- **Calculators:**
- Average cost per claim
- Cost breakdown by activity
- Root cause analysis for high-cost claims with repeated settlements
### Adaptation Steps
1. **Copy the "Claim Processing Cost" analysis** from the insurance project
2. **Paste into the banking project's** "Process Overview Dashboard" investigation
3. **Rename to:** "Customer Onboarding Cost"
4. **Remove the "Reopened Claim" filter** (not relevant to onboarding)
5. **Remove the "Cases started in 2004" filter** (not relevant)
6. **Update the average cost calculator** to use "Case Cost" attribute from the banking dataset
7. **Keep the cost breakdown calculator** (works with standard activity cost attributes)
8. **Update root cause analysis:**
- Change filter from "Settlement happened more than once" to "Cases with conformance issues"
- Update outcome metric to reference banking-specific cost attribute
- Enable auto-select for attributes
9. **Update all titles and notes** to reference "onboarding" instead of "claim processing"
10. **Verify the analysis** produces expected results
11. **Publish to dashboard** and configure drill-down behavior
## Working with Copied Enrichments Across Projects
When copying enrichments between projects, you may need to ensure your datasets have compatible structure:
### Performance Enrichments
- Verify that **activity names** in performance pairs exist in your destination data
- Update **SLA thresholds** to match business requirements for the new process
- Check that **duration calculations** are appropriate for your process timeline
### Conformance Enrichments
- Update **undesired activity** lists to match your new process
- Modify **mandatory activity** rules based on the new process requirements
- Adjust **severity levels** to reflect business criticality in the new context
### Cost Enrichments
- Update **activity cost values** using the Activity Info Wizard for your new process
- Verify **resource types and costs** match your organization's structure
- Ensure **summarization logic** aligns with how costs should be aggregated
## Summary
Copying and adapting analysis notebooks and enrichments in mindzie Studio is a powerful technique for:
- **Saving time** by reusing proven analysis patterns
- **Maintaining consistency** across projects and investigations
- **Accelerating project delivery** by starting from tested templates
- **Sharing best practices** across your organization
**Key takeaways:**
- Use the **three-dot menu** to copy and paste notebooks between projects
- Work with **multiple tabs open** for efficient cross-project copying
- Always **adapt copied content** by updating titles, filters, and attributes
- **Verify results** after adaptation to ensure calculations are correct
- **Calculate enrichments** after pasting to apply changes to your dataset
- Know **when to copy vs. create from scratch** based on similarity and complexity
By mastering the copy-paste-adapt workflow, you'll significantly increase your productivity in mindzie Studio and build a library of reusable analysis components that benefit your entire organization.
---
## Designing User-Friendly Dashboards with Notes and Formatting
Section: How To
URL: https://docs.mindziestudio.com/mindzie_studio/how-to/designing-user-friendly-dashboards-with-notes-and-formatting
Source: /docs-master/mindzieStudio/how-to/designing-user-friendly-dashboards-with-notes-and-formatting/page.md
# Designing User-Friendly Dashboards with Notes and Formatting
:::overview
## Overview
Creating effective dashboards in mindzie Studio goes beyond simply displaying metrics. Professional, user-friendly dashboards combine visual appeal with functional information delivery, helping end users understand not just what the metrics show, but how to interact with them and what actions to take.
This guide covers best practices for designing dashboards that balance aesthetics with usability, using markdown formatting, note panels, color schemes, and thoughtful layout design to create intuitive user experiences.
:::
## Why Dashboard Design Matters
Well-designed dashboards serve multiple purposes:
- **Guide users** through complex data with clear instructions
- **Provide context** for metrics and KPIs
- **Enhance usability** by explaining drill-down capabilities and interactions
- **Maintain visual appeal** while delivering dense information
- **Support different user roles** with targeted guidance and explanations
- **Enable self-service analytics** by empowering users to explore data independently
## Using Note Panels for Dashboard Instructions
Note panels are one of the most powerful tools for creating user-friendly dashboards. They allow you to add contextual information, instructions, and explanations directly within your dashboard layout.
### Creating a Note Panel
When building or editing a dashboard layout, you can add note panels to provide information to users:
1. Click **Edit Layout** on your dashboard
2. Click **Note** to add a new note panel
3. Configure the note panel properties

### Note Panel Configuration Options
The Dashboard Note Panel dialog provides several customization options:
- **Title**: Add a descriptive title for the note panel
- **Note**: Enter your content using markdown formatting
- **Disable Title**: Check this option to hide the title and display only the note content (useful for full-width informational banners)
- **Background Color**: Choose a background color to make the note stand out
- **Title Color**: Customize the title text color
- **Text Color**: Set the color for the main note text
### Common Use Cases for Note Panels
**Dashboard Instructions**
Add a prominent note panel at the top of dashboards to explain how users should interact with the metrics:
```markdown
## Process Overview Dashboard
** Hover over any of the KPIs to see the link icon, then click the icon to drill into that KPI
```
**Process Context**
Provide background information about the process being analyzed, helping users understand the business objectives and what they should be monitoring.
**Guidance for Analysts**
If you're a process analyst building multiple investigations and KPIs, use note panels to document what you've done, why specific metrics were chosen, and any important considerations for future updates.
## Leveraging Markdown for Text Formatting
mindzie Studio supports markdown language in note panels, enabling rich text formatting to enhance readability and visual hierarchy.
### Markdown Formatting Capabilities
**Headers**
Use markdown headers to create visual hierarchy:
```markdown
# Main Title (H1)
## Section Header (H2)
### Subsection (H3)
```
**Emphasis**
Add emphasis to important information:
```markdown
*italic text*
**bold text**
*** bold and italic***
```
**Lists**
Create organized lists for instructions or process steps:
```markdown
- Bullet point item
- Another bullet point
- Nested item
1. Numbered item
2. Another numbered item
```
**Links and More**
Include hyperlinks, code blocks, and other markdown elements to create comprehensive dashboard documentation.
## Working with Color Schemes
Color plays a critical role in dashboard design, helping to create visual hierarchy, draw attention to important information, and maintain consistency with your organization's branding.
### Creating Dark Theme Note Panels
For high-impact informational panels:
1. Set **Background Color** to a dark shade (such as dark blue or teal)
2. Set **Text Color** to light or white for contrast
3. Check **Disable Title** to create a seamless banner effect
4. Maximize the panel across the screen width

This creates a professional header that clearly separates instructional content from analytical metrics.
### Light Theme Panels
For less prominent notes or embedded guidance:
- Use lighter background colors
- Maintain dark text for readability
- Keep titles enabled to provide clear section labels
### Color Consistency
Maintain visual consistency across your dashboard set:
- Use the same color scheme for similar types of information across all dashboards
- Apply consistent styling for instructions versus contextual notes
- Consider your end users' preferences and accessibility needs
## Using Edit Layout to Arrange Dashboard Elements
The Edit Layout feature provides a flexible grid system for organizing dashboard components.

### Layout Best Practices
**Full-Screen Information Panels**
For instructional note panels, maximize them across the full width of the dashboard. This creates clear separation between guidance and metrics.
**Side-by-Side Metrics**
Arrange related KPIs side-by-side to enable easy comparison. You can place multiple metrics in a single row to maximize screen real estate.
**Logical Flow**
Organize your dashboard from top to bottom:
1. Instructional header or context panel
2. Primary KPIs and high-level metrics
3. Detailed breakdowns and supporting analysis
4. Additional context or guidance as needed
**Responsive Sizing**
Consider how your dashboard will appear on different screen sizes. mindzie Studio's grid system helps maintain readability across devices.
## Adding Hover Instructions and Drill-In Guidance
One of mindzie Studio's most powerful features is the ability to drill down from dashboard metrics into the underlying analysis notebooks. However, users may not discover this capability without clear guidance.
### Explaining Drill-Down Functionality
Use note panels to explicitly tell users how to drill down:
```markdown
** Hover over any of the KPIs to see the link icon, then click the icon to drill into that KPI
```
This simple instruction helps users understand that dashboards are not static displays, but interactive tools for exploration.
### What Users See When They Drill Down
When users click the link icon on a dashboard metric, they access the full analysis notebook containing:
- The **Dashboard** tab showing the specific metric
- **Process Map** visualizations
- **Variant DNA** analysis
- **Data Overview** with detailed statistics
- **Case Explorer** for individual case examination
- **AI Co-pilot** for guided analysis

### Guiding Users Through the Notebook
You can also add note calculators within analysis notebooks themselves to explain:
- What the analysis is measuring
- Why it matters to the business
- How to interpret the results
- What actions to take based on the findings
## Balancing Visual Appeal with Information Density
Effective dashboard design requires finding the right balance between aesthetics and information delivery.
### Avoiding Information Overload
**Start with Key Metrics**
Don't try to display everything on a single dashboard. Focus on the most important KPIs for each user role or business function.
**Use Progressive Disclosure**
Present high-level summaries on dashboards, with drill-down capabilities providing access to detailed analysis.
**White Space Matters**
Don't crowd every inch of the dashboard. Strategic use of white space improves readability and reduces cognitive load.
### Creating Visual Interest
**Vary Panel Sizes**
Not all metrics need the same amount of space. Size panels according to the complexity and importance of the information.
**Use Color Strategically**
Apply color to draw attention to key information, but avoid creating a "rainbow effect" with too many competing colors.
**Consistent Styling**
Apply consistent formatting, fonts, and colors to create a polished, professional appearance.
## Dashboard Structure for Different User Roles
When creating dashboard sets for an organization, consider designing role-specific views with appropriate formatting and guidance.
### Executive Dashboards
- Minimal text, maximum visual impact
- High-level KPIs prominently displayed
- Brief context notes explaining business objectives
- Clean, uncluttered layouts
### Operations Dashboards
- Detailed metrics with breakdowns
- Instructions for common operational tasks
- Links to related dashboards for different process areas
- Time-based trending information
### Process Improvement Dashboards
- Extensive use of note panels to document analysis approach
- Detailed drill-down guidance
- Context about process baselines and improvement targets
- Instructions for interpreting root cause analysis
### Compliance Dashboards
- Clear explanations of conformance rules
- Instructions for investigating violations
- Context about regulatory requirements
- Guidance on remediation steps
## Step-by-Step: Creating a Formatted Dashboard
Let's walk through creating a professional dashboard with formatted notes and metrics.
### Step 1: Create the Dashboard Structure
1. Navigate to **Dashboards** in mindzie Studio
2. Click **Add New Dashboard**
3. Enter a descriptive name (e.g., "Process Overview Dashboard")
4. Optionally add a description
5. Click **Create**

### Step 2: Add Metrics to the Dashboard
Before focusing on formatting, publish your key metrics from analysis notebooks to the dashboard:
1. Open your analysis notebook
2. Click the three-dot menu on a calculator
3. Select **Publish to Dashboard**
4. Choose your target dashboard
### Step 3: Add an Instructional Note Panel
1. Click **Edit Layout** on your dashboard
2. Click **Note** to add a note panel
3. Configure the note:
- **Disable Title**: Check this box
- **Background Color**: Select a dark color (e.g., dark teal)
- **Text Color**: Select white or light color
- **Note**: Enter your markdown content:
```markdown
## Process Overview Dashboard
** Hover over any of the KPIs to see the link icon, then click the icon to drill into that KPI
```
4. Click **Create**
### Step 4: Arrange the Layout
1. Drag the note panel to the top of the dashboard
2. Maximize it across the full width
3. Arrange your metrics below, placing related KPIs side-by-side
4. Adjust panel sizes to create visual balance
### Step 5: Review and Refine
1. Exit edit mode to see the dashboard as users will see it
2. Test the drill-down functionality
3. Review the visual hierarchy and readability
4. Make adjustments as needed
## Tips and Best Practices
### For Dashboard Designers
- **Work front-to-back**: Plan your dashboard structure before populating it with metrics
- **Document as you build**: Use note panels to capture decisions and rationale while they're fresh
- **Test with real users**: Get feedback from actual dashboard consumers before finalizing
- **Iterate based on usage**: Monitor which dashboards and metrics get used most, and refine accordingly
### For Note Panel Content
- **Be concise**: Users skim dashboards; keep instructions brief and actionable
- **Use active voice**: "Click the icon to drill in" rather than "The icon can be clicked for drilling in"
- **Provide examples**: When explaining complex interactions, give specific examples
- **Update regularly**: Keep dashboard instructions current as features and workflows evolve
### For Visual Design
- **Maintain consistency**: Use the same formatting patterns across all dashboards in a project
- **Consider accessibility**: Ensure sufficient color contrast for users with visual impairments
- **Prioritize readability**: If a design choice makes text harder to read, simplify
- **Less is more**: When in doubt, remove visual elements rather than adding them
### For User Guidance
- **Assume no prior knowledge**: Many dashboard users may be new to process mining
- **Explain the "why"**: Help users understand why metrics matter, not just what they show
- **Enable self-service**: Provide enough guidance that users can explore independently
- **Link to resources**: Reference additional documentation or help resources when appropriate
## Common Pitfalls to Avoid
**Too Much Text**
While note panels are valuable, avoid creating "wall of text" dashboards. Keep notes focused and concise.
**Inconsistent Formatting**
Switching between different color schemes and styles across dashboards creates a disjointed user experience.
**Missing Instructions**
Don't assume users will discover drill-down capabilities on their own. Explicitly explain how to interact with the dashboard.
**Overcrowded Layouts**
Trying to fit too many metrics on a single dashboard reduces the impact of each individual KPI.
**Ignoring Mobile Users**
If users access dashboards on tablets or smaller screens, ensure your layouts remain readable.
**Static Design Thinking**
Remember that mindzie dashboards support drill-down and interaction. Design with these capabilities in mind.
## Advanced Techniques
### Markdown Templates
Create reusable markdown templates for common dashboard types:
**Executive Dashboard Template**
```markdown
## [Process Name] Executive Overview
Key metrics for [process objective]. Updated [frequency].
** Hover over metrics to drill into detailed analysis
```
**Operational Dashboard Template**
```markdown
## [Process Name] Operations Dashboard
Monitor daily performance and identify issues requiring attention.
**How to use this dashboard:**
- Review KPIs for current performance
- Click any metric to see detailed breakdowns
- Use filters to focus on specific regions/departments
```
### Color Palette Consistency
Define a standard color palette for your organization:
- **Primary instruction panels**: Dark teal background, white text
- **Warning notes**: Amber background, dark text
- **Success indicators**: Green accent colors
- **Neutral information**: Light gray background, dark text
Document this palette and apply it consistently across all projects.
### Progressive Dashboard Sets
Design dashboard sets that guide users from high-level to detailed views:
1. **Setup/Information Dashboard**: Explains the project and how to navigate
2. **Executive Dashboard**: High-level KPIs with minimal detail
3. **Operational Dashboards**: Department or function-specific metrics
4. **Analytical Dashboards**: Detailed breakdowns for process improvement teams
Each dashboard includes appropriate note panels guiding users to related dashboards.
## Conclusion
Designing user-friendly dashboards in mindzie Studio requires thoughtful attention to both form and function. By leveraging note panels with markdown formatting, applying consistent color schemes, arranging layouts strategically, and providing clear user guidance, you can create dashboards that not only look professional but truly empower users to understand and act on process intelligence.
Remember that dashboard design is iterative. Start with clear structure and basic formatting, gather user feedback, and refine your approach over time. The most effective dashboards are those that evolve based on actual usage patterns and user needs.
## Related Topics
- **Planning Your Dashboard Structure for Different User Roles**: Strategic guidance on organizing dashboards for different personas
- **Publishing Metrics from Notebooks to Dashboards**: How to move analysis into user-facing dashboards
- **Understanding Drill-Down and Continuous Monitoring**: Deep dive into dashboard interactivity
- **Creating Analysis with Filters and Calculators**: Building the metrics that populate your dashboards
---
## Understanding Drill Down and Continuous Monitoring
Section: How To
URL: https://docs.mindziestudio.com/mindzie_studio/how-to/understanding-drill-down-and-continuous-monitoring
Source: /docs-master/mindzieStudio/how-to/understanding-drill-down-and-continuous-monitoring/page.md
# Understanding Drill-Down and Continuous Monitoring
:::overview
## Overview
mindzie studio is designed to serve two critical use cases in process mining: **discovery** and **continuous monitoring**. Discovery involves the initial investigation and analysis of your processes to understand how they work, identify bottlenecks, and uncover improvement opportunities. Continuous monitoring enables ongoing tracking of process performance over time, allowing you to spot trends, detect issues early, and measure the impact of improvements.
This document explains how mindzie studio's drill-down capabilities and automatic recalculation features support both use cases, enabling users to move seamlessly from high-level dashboards into detailed analysis and maintain up-to-date insights as data refreshes.
:::
## Discovery vs. Continuous Monitoring
### Discovery: Initial Process Investigation
During the discovery phase, analysts create investigations, build analysis notebooks, and publish key metrics to dashboards. This is the exploratory phase where you:
- Upload historical process data
- Create enrichments to enhance the data with performance metrics, conformance rules, and cost calculations
- Build analysis using filters and calculators to understand process behavior
- Publish findings to dashboards for stakeholder review
The goal is to understand the current state of your processes and identify opportunities for improvement.
### Continuous Monitoring: Ongoing Performance Tracking
Once your mindzie studio project is configured and dashboards are published, the system transitions into continuous monitoring mode. In this phase:
- Data is refreshed on a regular schedule (daily, weekly, monthly) or manually updated
- All metrics, KPIs, and analysis automatically recalculate based on the new data
- Users monitor trends over time to track process performance
- Changes in process behavior are detected and investigated
The same dashboards and analysis notebooks created during discovery continue to provide value by automatically staying current with the latest data.
## How Drill-Down Enables Self-Service Analysis
One of the most powerful features of mindzie studio is the ability for dashboard users to drill down from high-level KPIs into the detailed analysis that drives them. This enables self-service investigation without requiring analyst intervention.
### The Drill-Down Workflow
1. **Dashboard View**: Users start at a global dashboard displaying key metrics and KPIs.

2. **Hovering to Access Drill-Down**: When users hover over a metric panel, a link icon appears, indicating that they can click to drill into the underlying analysis.
3. **Opening the Analysis Notebook**: Clicking the link icon opens the full analysis notebook that drives that particular metric, providing access to:
- **Notebook tab**: The analysis workspace with all filters and calculators
- **Dashboard tab**: The local dashboard view showing all related metrics from this analysis
- **Process Map tab**: A visual representation of the process flow
- **Variant DNA tab**: Detailed breakdown of process variants and their characteristics
- **Data Overview tab**: Statistical information about the underlying data
- **Case Explorer tab**: Ability to examine individual cases in detail

4. **Exploring Multiple Views**: Users can switch between different tabs to explore the data from various perspectives. For example, they might view the Variant DNA to understand which process paths are most common:

### Controlling the Drill-Down Experience with Pinned Tabs
As an analyst configuring mindzie studio, you can control which tab users see by default when they drill into a metric. This is accomplished using the **pin** feature:
- Navigate to the analysis notebook
- Select the tab you want users to see first (typically the Dashboard tab for a clean summary view)
- Click the pin icon to set this as the default view
- When users drill down from the global dashboard, they'll automatically land on the pinned tab
This ensures users get the most relevant view immediately without needing to navigate through multiple tabs.
## Automatic Recalculation for Continuous Monitoring
A critical feature for continuous monitoring is mindzie studio's ability to automatically recalculate all metrics when data is refreshed. This happens seamlessly in the background without requiring manual intervention.
### How Data Refresh Works
**Scheduled Updates**: When mindzie studio is connected to source systems via mindzie Data Designer, data can be automatically refreshed on a schedule (e.g., nightly, weekly). The system:
- Pulls updated data from source systems
- Runs the data through the enrichment pipeline
- Recalculates all metrics, KPIs, and analysis
- Updates all dashboards with the latest information
**Manual Updates**: For scenarios where data is uploaded via CSV files, you can manually refresh the data:
- Upload a new CSV file with updated data
- mindzie processes the new data through the same enrichment pipeline
- All existing analysis and dashboards automatically recalculate
### What Gets Recalculated
When data refreshes, mindzie studio recalculates:
- **Log enrichments**: Performance metrics, conformance rules, cost calculations, and AI predictions
- **Analysis notebooks**: All filters and calculators update to reflect the new data
- **Local dashboards**: Metrics within notebooks refresh
- **Global dashboards**: All published KPIs update with current values
- **Process maps and variant DNA**: Visual representations reflect the latest process behavior
This ensures that users always see current information without needing to rebuild analysis or dashboards.
### Monitoring Trends Over Time
With automatic recalculation, users can monitor how process metrics change over time:
- Compare current performance to historical baselines
- Identify trends (improving, declining, or stable)
- Detect anomalies or sudden changes in process behavior
- Measure the impact of process improvement initiatives
For example, if you implemented a process change to reduce customer onboarding time, your dashboards will automatically show whether average duration is decreasing as new data arrives.
## Providing User Guidance on Dashboards
To maximize the value of drill-down capabilities, it's helpful to provide instructions directly on dashboards. This guides users on how to interact with the system and encourages exploration.
### Adding Instructional Notes
You can add note panels to dashboards that explain how to use drill-down:

In this example, the dashboard includes a note that reads: "Hover over any of the KPIs to see the link icon, then click the icon to drill into that KPI."
Best practices for instructional notes:
- Use markdown formatting to create clear, readable text
- Place instructions prominently at the top of dashboards
- Explain what users can do (hover, click, explore)
- Set the background color to make notes stand out visually
- Keep instructions concise and action-oriented
## Use Cases for Drill-Down and Continuous Monitoring
### Executive Monitoring
Executives can view high-level dashboards showing key process metrics (average duration, cost per case, conformance violations). When they notice an unusual value or trend, they can drill down to:
- Understand which process variants are causing issues
- See the distribution of cases across different categories
- Identify specific cases that need attention
### Operations Management
Operations managers use continuous monitoring to:
- Track daily or weekly process performance
- Spot emerging bottlenecks before they become critical
- Monitor SLA compliance in real-time
- Investigate root causes when metrics deteriorate
### Process Improvement Teams
Process improvement teams leverage drill-down to:
- Analyze the impact of process changes over time
- Compare performance before and after interventions
- Identify which departments or branches show different patterns
- Build business cases for additional improvements
### Compliance and Risk Teams
Compliance teams benefit from:
- Automated monitoring of conformance violations
- Trend analysis showing whether compliance is improving
- Ability to drill into specific violations to understand patterns
- Regular reporting without manual data extraction
## Best Practices
### For Discovery Phase
1. **Build comprehensive analysis**: Create detailed notebooks that cover multiple perspectives (performance, conformance, cost, variants)
2. **Publish strategic metrics**: Choose KPIs that will remain relevant for ongoing monitoring
3. **Set appropriate pinned tabs**: Configure default views that provide the most value to end users
4. **Add contextual notes**: Include descriptions and instructions to guide future users
### For Continuous Monitoring Phase
1. **Establish refresh schedules**: Determine the appropriate frequency for data updates based on business needs
2. **Communicate refresh timing**: Let users know when data was last updated and when the next refresh will occur
3. **Monitor for data quality**: Ensure that incoming data remains consistent and complete
4. **Review and refine**: Periodically assess whether published metrics still align with business priorities
### For Enabling Self-Service
1. **Train users on drill-down**: Educate dashboard users on how to access underlying analysis
2. **Provide clear navigation cues**: Use notes and labels to guide users through the interface
3. **Balance detail and simplicity**: Publish high-level metrics but make detailed analysis available on demand
4. **Document analysis logic**: Include notes in notebooks explaining what filters and calculators do
## Summary
mindzie studio's drill-down and automatic recalculation capabilities make it a powerful platform for both process discovery and continuous monitoring. By publishing metrics from detailed analysis notebooks to global dashboards, you create an environment where:
- Executives and managers see high-level KPIs at a glance
- Users can drill into underlying analysis whenever they need more detail
- All metrics automatically update as new data arrives
- The same infrastructure supports both initial investigation and ongoing monitoring
This dual-purpose design maximizes the return on investment for your process mining implementation, enabling you to move seamlessly from understanding your processes to continuously improving them.
## Related Topics
- **Publishing Metrics from Notebooks to Dashboards**: Learn how to publish analysis blocks to local and global dashboards
- **Designing User-Friendly Dashboards with Notes and Formatting**: Techniques for creating professional, intuitive dashboards
- **Working with Investigations and Analysis Notebooks**: Understanding the structure of investigations and notebooks
- **Uploading and Configuring Data Sources**: How to refresh data manually or via mindzie Data Designer
---
## End to End Project Build: Complete Workflow
Section: How To
URL: https://docs.mindziestudio.com/mindzie_studio/how-to/end-to-end-project-build-complete-workflow
Source: /docs-master/mindzieStudio/how-to/end-to-end-project-build-complete-workflow/page.md
# End-to-End Project Build: Complete Workflow Summary
:::overview
## Overview
This comprehensive reference guide provides a complete roadmap for building a mindzie studio project from start to finish. Whether you're implementing process mining for customer onboarding, invoice processing, or any other business process, this workflow summary serves as your checklist and guide for creating production-ready process intelligence solutions.
mindzie studio enables organizations to transform raw process data into actionable insights through an eight-phase approach: project setup, data configuration, dashboard planning, log enrichment, analysis creation, metric building, dashboard publishing, and user experience optimization.
:::
## Complete Workflow at a Glance
The end-to-end workflow follows these eight distinct phases:
1. **Project Setup and User Configuration** - Create the project framework and assign team members
2. **Data Upload and Column Mapping** - Import process data and configure key fields
3. **Dashboard Structure Planning** - Design the dashboard hierarchy for different user roles
4. **Log Enrichment** - Enhance data with performance, conformance, and costing metrics
5. **Creating Investigations and Analysis Notebooks** - Build analytical workspaces
6. **Building Metrics with Filters and Calculators** - Create KPIs using low-code/no-code tools
7. **Publishing to Dashboards** - Deploy metrics to local and global dashboards
8. **Formatting and User Experience Optimization** - Polish dashboards for end-user consumption
Each phase builds upon the previous one, creating a comprehensive process intelligence solution that supports both discovery and continuous monitoring use cases.
---
## Phase 1: Project Setup and User Configuration
### Objectives
- Create a new mindzie studio project
- Configure project identification and branding
- Assign users with appropriate permissions
### Step-by-Step Workflow
**1. Create the Project**
Log into mindzie studio and navigate to the Projects section. Click "Add New Project" to begin.

You'll be presented with three options:
- **Create Empty Project** - Start from scratch (recommended for custom implementations)
- **Project Gallery** - Use pre-built templates
- **Upload Existing Package** - Import a previously exported project
For most implementations, select "Create Empty Project" and provide a descriptive project name that reflects the business process being analyzed.
**2. Upload Project Thumbnail**
After creating the project, enhance its visual identification by uploading a custom thumbnail image. This is especially valuable when delivering projects to customers or managing multiple projects.

Click the three-dot menu on the project tile and select "Upload Thumbnail" to add a branded image that helps users quickly identify the project.
**3. Assign Users and Configure Permissions**

Click the three-dot menu again and select "Assign Users" to add team members to the project. mindzie studio supports two permission levels:
- **Contributor** - Can add analysis and create content but has limited administrative capabilities
- **Owner** - Full access to all project features including configuration, user management, and deletion
For collaborative project development, assign team members as Owners to enable full participation in the build process.
### Best Practices
- Use clear, descriptive project names that indicate the business process and department
- Upload branded thumbnails for customer-facing projects
- Assign appropriate permissions based on user roles and responsibilities
- Consider creating separate projects for development and production environments
### Common Pitfalls to Avoid
- Vague project names that don't clearly identify the process being analyzed
- Forgetting to assign key team members at the start of the project
- Assigning overly restrictive permissions that limit collaboration
---
## Phase 2: Data Upload and Column Mapping
### Objectives
- Import process event log data into mindzie studio
- Map columns to required process mining fields
- Validate data quality and format
### Step-by-Step Workflow
**1. Choose Data Import Method**

mindzie studio supports two primary data import methods:
- **CSV Upload** - Direct upload of comma-separated values files (ideal for one-time imports or small datasets)
- **mindzie Data Designer** - Connect to databases, data warehouses, and enterprise systems for automated data pipelines (recommended for production deployments)
For initial project setup or proof-of-concept work, CSV upload provides the fastest path to analysis.
**2. Upload and Validate Data**
Select your CSV file and upload it to mindzie studio. The system will analyze the file structure, detect encoding settings, and prepare the data for import. Review the preview to ensure data is being read correctly.
**3. Map Key Columns**

Use drag-and-drop to assign your data columns to mindzie's required fields:
- **Case ID** - Unique identifier for each process instance (e.g., customer ID, order number, claim number)
- **Activity** - The process step or event name (e.g., "Submit Application", "Approve Request")
- **Timestamp** - Date and time when the activity occurred
- **Resource** (Optional but Recommended) - Person, system, or department that performed the activity
mindzie studio automatically detects these fields when possible, but you can manually adjust assignments as needed.
**4. Configure Additional Settings**
For each column, you can:
- Change column types and data types
- Anonymize sensitive data for security compliance
- Adjust date/time formats
- Configure custom attributes
**5. Import and Transform**

Click "Next" to import the data. mindzie studio will transform your raw CSV into a structured event log, creating both an original dataset and an enriched dataset for analysis. Upon completion, you'll see summary statistics including the number of cases and events imported.
### Understanding mindzie's Dual Dataset Architecture
After import, mindzie studio automatically creates two datasets:
- **Original Dataset** - The raw event log exactly as imported, preserved without modifications
- **Enriched Dataset** - An enhanced version created by the mindzie pipeline, containing calculated attributes, performance metrics, and additional insights
All analysis and dashboards should use the enriched dataset, as it contains the enhanced attributes created through log enrichment.
**Default Analysis**
mindzie studio automatically generates several starter analyses including:
- Process overview with key statistics
- Long case duration analysis
- Duration between main process steps
- Other foundational insights
These provide a quick-start foundation for exploring your process data.
### Best Practices
- Ensure timestamps include both date and time components for accurate duration calculations
- Use consistent activity naming conventions in your source data
- Include resource information to enable workload and performance analysis by person/department
- Validate that Case IDs uniquely identify individual process instances
- Review the automatically generated analyses to understand your process quickly
### Common Pitfalls to Avoid
- Importing data with inconsistent date formats that cause parsing errors
- Using Case IDs that don't uniquely identify process instances (e.g., using dates instead of unique identifiers)
- Missing timestamp information that prevents temporal analysis
- Forgetting to anonymize personally identifiable information when required
---
## Phase 3: Dashboard Structure Planning
### Objectives
- Design a dashboard hierarchy aligned with user roles and business needs
- Create informational setup documentation
- Establish the framework for metric organization
### The Front-to-Back Approach
mindzie studio projects benefit from a "front-to-back" development methodology: build the dashboard structure first, then work backward to create the analysis and metrics that populate them. This ensures your end-user experience is well-planned before diving into detailed analysis.
### Step-by-Step Workflow
**1. Create Setup Dashboard**

Begin by creating an informational dashboard that documents the project setup, objectives, and structure. Navigate to Dashboards and click "Add New Dashboard".
**2. Add Documentation Using Markdown**

Add a Note panel to your setup dashboard and use markdown language to format documentation:
- Use `#` for headers
- Use `-` or `*` for bullet lists
- Use `**text**` for bold emphasis
- Disable the panel title for cleaner presentation
- Configure background and text colors for visual appeal
Document key information such as:
- Project purpose and scope
- Data sources and date ranges
- Key metrics and definitions
- Dashboard descriptions and intended audiences
- Contact information for project owners
**3. Create Role-Based Dashboard Structure**

Design dashboards for different user personas and business functions. Common dashboard types include:
- **Executive/Process Overview** - High-level KPIs and summary metrics for leadership
- **Operations Dashboard** - Detailed operational metrics for process managers and team leads
- **Compliance & Risk** - Regulatory compliance tracking and process conformance metrics
- **Branch/Department Manager** - Location-specific or department-specific performance views
- **Process Improvement** - Detailed analytical views for process optimization teams
**4. Configure Copilot Settings**
For each dashboard, decide whether to show or collapse the AI copilot feature:
- **Collapsed** - Cleaner interface for executive dashboards and simple views
- **Expanded** - Enhanced functionality for analytical users who will leverage AI assistance
### Best Practices
- Align dashboard names with investigation folder names for consistency
- Create dashboards with end users in mind - consider their role, expertise level, and information needs
- Use the setup dashboard to document project structure and guide new users
- Start with 4-6 key dashboards rather than creating dozens of specialized views
- Plan for drill-down navigation from summary to detail
- Consider creating separate dashboards for different time periods or organizational segments
### Common Pitfalls to Avoid
- Creating too many dashboards that overwhelm users with choices
- Building dashboards without considering the target audience's needs and skill level
- Inconsistent naming conventions between dashboards and investigations
- Forgetting to create informational/setup documentation
- Building highly technical dashboards for business users or overly simplified views for analysts
---
## Phase 4: Log Enrichment (Performance, Conformance, Costing)
### Objectives
- Enhance raw event log data with calculated attributes
- Create performance metrics with SLA-based categorization
- Implement conformance rules for process compliance
- Calculate activity-based costs
### Understanding Log Enrichment
The log enrichment engine is mindzie studio's data enhancement layer. It takes your original event log and creates an enriched dataset containing:
- Performance metrics and duration calculations
- Conformance flags and rule violations
- AI-driven predictions and classifications
- Custom business logic and calculations
- Activity-based costing information

This enriched dataset becomes the foundation for all analysis, enabling sophisticated metrics that go far beyond what exists in the raw data.
### Step-by-Step Workflow
**Performance Enrichment**
**1. Access the Log Enrichment Engine**
Navigate to Log Enrichment in the main navigation. You'll see a notebook-style interface for organizing enrichment blocks.
**2. Launch the Performance Wizard**

The Performance Wizard automatically analyzes your process and identifies key activity pairs to measure:
- Full case duration (start to finish)
- Duration between significant process steps
- Time in specific process phases
**3. Configure Performance Buckets**
For each duration metric, the wizard creates three performance categories:
- **Fast** - Best-case performance (green zone)
- **Normal** - Acceptable performance (yellow zone)
- **Slow** - Poor performance requiring attention (red zone)
You can customize the thresholds for each bucket. If your organization has internal SLAs (Service Level Agreements), apply them here to align performance categorization with business standards.
**4. Add Custom Activity Pairs**
While the wizard automatically identifies common pairs, you can add specific combinations relevant to your process:
- Department-to-department handoffs
- Approval cycle durations
- Customer-facing interaction times
- Any sequence of activities you need to measure
**5. Calculate Performance Enrichments**

Click "Create" to generate the enrichment blocks. Then click "Calculate Enrichments" to execute the data pipeline and add these new attributes to your enriched dataset.
**6. Verify Enriched Attributes**

Navigate to the Data Overview to see all newly created attributes. You'll find:
- Original attributes from your uploaded data
- Standard mindzie-generated attributes (case start, case finish, time of day, etc.)
- Performance duration metrics with categorization
- All enrichments available for use in analysis and calculations
**Conformance Enrichment**
**1. Access Conformance Rules**
Create a new enrichment notebook or use an existing one. Click "Add New" and select conformance rule types from the library.
**2. Configure Undesired Activity Rules**

Identify activities that should not occur in ideal process execution:
- Exception handling steps
- Reprocessing activities
- Manual interventions
- Workarounds
Select each undesired activity from your activity list and assign a severity level:
- **Low** - Minor deviation, informational only
- **Medium** - Significant issue requiring attention
- **High** - Critical violation demanding immediate action
**3. Configure Additional Conformance Rules**

Beyond undesired activities, configure:
- **Mandatory Activities** - Steps that must occur in every case
- **Wrong Activity Order** - Activities happening in incorrect sequence
- **Repeated Activities** - Rework loops and duplicate steps that indicate process inefficiency
- **Missing Approval Steps** - Required authorizations that were bypassed
**4. Calculate Conformance Enrichments**
Execute the pipeline to add conformance flags to your dataset. Cases will now be tagged with compliance information usable in filters, reports, and root cause analysis.
**Costing Enrichment**
**1. Launch the Activity Info Wizard**

The Activity Info Wizard enables activity-based costing by assigning estimated time and cost to each process step.
**2. Assign Costs to Activities**
For each activity in your process:
- Specify the estimated time required
- Assign cost based on resource type (e.g., manager rate vs. analyst rate)
- Consider fully-loaded costs including overhead
Activity-based costing provides far more accurate process cost calculations than simple averaging because it accounts for:
- Process variations and different paths through the workflow
- Rework loops and repeated steps
- Exception handling that adds cost
**3. Create Cost Summary Enrichments**

Use the Summarize enrichment block to aggregate activity costs at the case level:
- Create a new enrichment notebook for cost calculations
- Add a Summarize block
- Select "Estimated Cost" as the attribute to summarize
- Name the new attribute "Case Cost"
- Calculate enrichments to execute the pipeline
This creates a case-level attribute showing the total cost of processing each instance, accounting for all activities that occurred including rework and exceptions.
### Best Practices
- Use the Performance Wizard as your starting point, then add custom activity pairs as needed
- Align performance buckets with your organization's actual SLAs and performance targets
- Start with 3-5 key conformance rules rather than attempting to capture every possible violation
- Assign appropriate severity levels to conformance violations based on business impact
- For activity-based costing, use realistic estimates from process owners and finance teams
- Organize enrichments into logical notebooks (Performance, Conformance, Costing) for easy maintenance
- Calculate enrichments frequently during development to see results of your configurations
- Document enrichment logic in notebook descriptions for future reference
### Common Pitfalls to Avoid
- Setting unrealistic performance thresholds that categorize most cases as "slow"
- Creating too many conformance rules that flag nearly every case as non-compliant
- Using arbitrary cost estimates without input from finance or process owners
- Forgetting to calculate enrichments after making changes - the pipeline must execute for changes to take effect
- Creating duplicate enrichments that calculate the same metric multiple times
- Not organizing enrichments into logical notebooks, making them difficult to find and maintain
---
## Phase 5: Creating Investigations and Analysis Notebooks
### Objectives
- Organize analytical work into investigation folders
- Create analysis notebooks aligned with dashboard structure
- Understand the notebook components and capabilities
### Understanding Investigations
Investigations are organizational folders that contain related analysis notebooks. Think of them as project folders that group together all the analytical work for a specific dashboard or business question.
### Step-by-Step Workflow
**1. Create Investigation Folder**

Navigate to Investigations and click "Add Investigation". Best practice is to name the investigation to match the dashboard it will populate (e.g., "Process Overview" investigation feeds the "Process Overview" dashboard).
Select the enriched dataset as your data source - this ensures your analysis has access to all the enhanced attributes created through log enrichment.
**2. Create Analysis Notebooks**
Within each investigation, create analysis notebooks for specific metrics or KPIs. Click "Add Analysis" and choose from:
- **Blank Notebook** - Start from scratch with an empty analytical workspace
- **Process Map Notebook** - Pre-configured with process flow visualization
- **Variant DNA Analysis** - Pre-configured for analyzing process variation patterns
**3. Understand Notebook Components**

Each analysis notebook contains multiple tabs:
- **Analysis Tab** - The main workspace for building metrics using filters and calculators
- **Local Dashboard** - A summary view of all metrics published from this notebook
- **Process Map** - Visual representation of process flow and frequencies
- **Variant DNA** - Analysis of different paths through the process
- **Data Overview** - Summary statistics and attribute information
- **Case Explorer** - Detailed case-by-case examination
- **AI Copilot** - Intelligent assistance for analysis creation
**4. Name Analysis with Descriptive Titles**
Create analysis notebooks with names that clearly describe the metric or insight being developed. Examples:
- "Average Onboarding Duration"
- "Cost Per Case Analysis"
- "Compliance Violation Tracking"
- "Branch Performance Comparison"
### Best Practices
- Create one investigation for each major dashboard to maintain clear organization
- Name investigations to match their corresponding dashboards
- Use descriptive analysis names that indicate the metric being calculated
- Select the enriched dataset (not the original dataset) for all investigations
- Create separate analyses for distinct metrics rather than combining multiple unrelated KPIs
- Leverage analysis templates when they match your needs to save time
- Use the AI copilot to assist with complex analysis creation
### Common Pitfalls to Avoid
- Creating analyses without a clear purpose or end goal
- Mixing unrelated metrics in a single analysis notebook
- Using the original dataset instead of the enriched dataset
- Generic analysis names that don't describe what's being measured
- Creating too many investigations that mirror the same structure
- Not deleting default analyses that don't align with your project structure
---
## Phase 6: Building Metrics with Filters and Calculators
### Objectives
- Understand the analysis-filter-calculator paradigm
- Create metrics using mindzie's low-code/no-code interface
- Leverage enriched attributes for powerful calculations
### The Analysis-Filter-Calculator Paradigm
mindzie studio uses a block-based approach to building metrics:
- **Analysis** - The workspace or notebook where you're working (like a worksheet)
- **Filters** - Blocks that isolate specific data segments you want to analyze
- **Calculators** - Visualization blocks that calculate and display metrics
Filters and calculators can be combined in any arrangement to create sophisticated analysis.
### Step-by-Step Workflow
**1. Open an Analysis Notebook**
Navigate to the analysis where you want to create a metric. You'll work primarily in the Analysis tab.
**2. Add Filters (Optional)**

Click "Add Filter" to isolate specific data segments. mindzie studio provides pre-built filter types:
- **Attribute-based filters** - Filter by specific attribute values (division, department, region, etc.)
- **Time-based filters** - Filter by date ranges or time periods
- **Case attribute filters** - Filter based on case-level characteristics
- **Performance filters** - Filter by duration categories (fast, normal, slow)
- **Conformance filters** - Filter by compliance status or rule violations
Filters are optional - if you want to analyze all cases, simply skip filtering and add calculators directly.
**3. Add Calculators**

Click "Add Calculator" to browse mindzie's extensive library of visualization and calculation types:
- **Statistical calculators** - Average, median, sum, count, percentiles
- **Trend calculators** - Show metric changes over time
- **Breakdown calculators** - Group data by attribute values
- **Process map calculators** - Visualize process flows
- **Chart calculators** - Bar charts, line charts, pie charts, histograms
- **Table calculators** - Detailed tabular data views
- **Specialized calculators** - Root cause analysis, variant analysis, resource utilization
**4. Configure Calculator Parameters**

After selecting a calculator type, configure its parameters:
- **Attribute Selection** - Choose which attribute to calculate (e.g., Case Duration, Case Cost)
- **Grouping Options** - How to segment the data
- **Time Granularity** - Daily, weekly, monthly aggregation
- **Visualization Settings** - Colors, labels, display options
Because you've enriched your data in Phase 4, you have access to calculated attributes like:
- Case Duration
- Performance categories
- Conformance flags
- Case Cost
- Activity pair durations
**5. Combine Multiple Filters and Calculators**
Build sophisticated analysis by combining blocks:
- Multiple filters to narrow down to very specific cases
- Multiple calculators to show different views of the same filtered data
- Comparison metrics by duplicating analysis and changing filter parameters
**6. Add Descriptions and Notes**
Document your analysis using:
- **Analysis descriptions** - Explain what this analysis measures and why
- **Note calculators** - Add explanatory text within the analysis
- **Title and subtitle settings** - Clear labeling for each calculator block
### Real-World Example: Average Onboarding Duration
Following the banking onboarding example:
1. Create analysis named "Average Onboarding Duration"
2. Skip filters (analyzing all cases)
3. Add "Average" calculator
4. Select "Case Duration" attribute (created by Performance Wizard)
5. Result: A metric showing the average time to complete customer onboarding
6. Add description explaining methodology
### Best Practices
- Start simple with a single calculator, then add complexity as needed
- Use filters to create multiple views of the same metric (by region, by department, by time period)
- Leverage enriched attributes created in Phase 4 for powerful calculations
- Add note calculators to explain complex analysis within the notebook
- Use descriptive titles for all calculators so their purpose is immediately clear
- Test calculator configurations with different attributes to understand capabilities
- Create comparative analysis by duplicating notebooks and changing filter parameters
### Common Pitfalls to Avoid
- Building overly complex analysis with too many filters that result in no data
- Forgetting that enriched attributes must be calculated before they appear in the attribute list
- Using confusing or generic calculator titles that don't describe what's being shown
- Not adding descriptions or documentation to complex analysis
- Trying to build analysis on the original dataset instead of the enriched dataset
- Creating filters that contradict each other and return zero results
---
## Phase 7: Publishing to Local and Global Dashboards
### Objectives
- Understand local vs. global dashboard concepts
- Publish metrics from notebooks to dashboards
- Configure drill-down behavior and user guidance
### Understanding Dashboard Types
mindzie studio uses a two-tier dashboard architecture:
**Local Dashboards**
- Contained within a single analysis notebook
- Summarizes all metrics created in that notebook
- Used by analysts to organize their work
- Accessed via the "Dashboard" tab within the notebook
**Global Dashboards**
- User-facing dashboards visible from the main Dashboards menu
- Aggregate metrics from multiple analysis notebooks
- Used for end-user consumption and executive reporting
- Support drill-down to underlying analysis
### Step-by-Step Workflow
**1. Publish to Local Dashboard**

After creating a calculator in your analysis, click the three-dot menu and select "Publish to Local Dashboard":
- Provide a panel title
- The metric appears on the notebook's Dashboard tab
- This creates a summary view of all work in the notebook
**2. Publish to Global Dashboard**

To make metrics available to end users:
- Hover over the published panel in the local dashboard
- Click the three-dot menu
- Select "Add to Dashboard"
- Choose the target global dashboard from the list
- The metric now appears in the user-facing dashboard
**3. Configure Drill-Down Behavior**
When users click on a dashboard panel in a global dashboard, mindzie studio opens the underlying analysis notebook. Control which tab users see by default:
- Navigate to the notebook view
- Use the **Pin** icon to select the default tab
- Options include: Analysis, Dashboard, Process Map, Variant DNA, Data Overview, Case Explorer
- Most commonly, pin the "Dashboard" tab for cleaner presentation
**4. Add User Guidance Notes**

Help users understand and interact with dashboard metrics:
- Click the three-dot menu on any dashboard panel
- Select "Add Note"
- Write helpful guidance such as:
- What the metric measures
- How to interpret the values
- Instructions for drilling down
- Context about thresholds or targets
- When the data was last updated
Example note: "This shows the average duration of each case. Click the drill-in icon to see detailed analysis including process maps and case breakdowns."
### Best Practices
- Always publish to local dashboard first to organize your analytical work
- Use consistent panel titles across local and global dashboards
- Pin the most relevant tab for end users when configuring drill-down behavior
- Add contextual notes to complex metrics to guide user interpretation
- Organize global dashboards logically, grouping related metrics together
- Test drill-down navigation from the end-user perspective
- Create separate dashboards for different audiences rather than one dashboard trying to serve everyone
- Use the Edit Layout feature to arrange panels logically on global dashboards
### Common Pitfalls to Avoid
- Publishing metrics to global dashboards without first organizing them in local dashboards
- Not configuring drill-down behavior, leaving users to land on unfamiliar tabs
- Missing or unclear panel titles that don't explain what's being measured
- Overcrowding dashboards with too many metrics that overwhelm users
- Forgetting to add guidance notes for complex or unfamiliar metrics
- Publishing draft or experimental analysis to global dashboards
- Not testing the drill-down experience from the end-user perspective
---
## Phase 8: Formatting and User Experience Optimization
### Objectives
- Create professional, visually appealing dashboards
- Add instructional content for user guidance
- Optimize layout and organization
- Implement color schemes and branding
### Step-by-Step Workflow
**1. Edit Dashboard Layout**

Click "Edit Layout" on any global dashboard to enter layout editing mode:
- Drag and drop panels to rearrange
- Resize panels by dragging edges
- Create multi-column layouts for compact dashboards
- Maximize panels for emphasis on key metrics
- Preview changes before saving
Common layout patterns:
- **Executive Layout** - Large, prominent KPIs with minimal detail
- **Operational Layout** - Dense grid of smaller metrics for monitoring
- **Analytical Layout** - Fewer, larger panels with supporting context
**2. Add Instructional Note Panels**

Use note panels to provide context and guidance:
**Creating Formatted Notes:**
- Add a Note panel to the dashboard
- Click "Disable Title" for cleaner presentation
- Use markdown for formatting:
- `# Header` for large headers
- `## Subheader` for section headers
- `**bold**` for emphasis
- `-` or `*` for bullet lists
- Links using `[text](url)` syntax
**Typical Note Content:**
- Dashboard purpose and audience
- How to use the dashboard
- Instructions for drilling down into metrics
- Definitions of key terms
- Contact information for questions
- Last updated information
**3. Apply Color Schemes**
Make dashboards visually appealing and aligned with branding:
**Background Colors:**
- Dark backgrounds for executive dashboards (professional, high-contrast)
- Light backgrounds for operational dashboards (traditional, data-dense)
**Text Colors:**
- White text on dark backgrounds
- Dark text on light backgrounds
- Ensure sufficient contrast for readability
**Panel Styling:**
- Consistent color schemes across related dashboards
- Use brand colors when appropriate
- Consider accessibility in color choices
**4. Position Instructional Content**
Best practices for note panel placement:
- **Top of dashboard** - Overview information, instructions, navigation guidance
- **Between sections** - Section headers and context for grouped metrics
- **Bottom of dashboard** - Supplementary information, disclaimers, metadata
**5. Configure Panel Titles and Descriptions**
For each metric panel:
- Use clear, business-friendly titles
- Add descriptions via the three-dot menu
- Include hover text that provides additional context
- Explain thresholds, targets, or benchmarks
**6. Test User Experience**
Before finalizing:
- View dashboards as an end user (not in edit mode)
- Test drill-down functionality
- Verify all notes display correctly
- Check responsive behavior on different screen sizes
- Confirm color contrast is readable
- Have a representative end user review and provide feedback
### Advanced Formatting Techniques
**Full-Screen Informational Panels**
- Create note panels that span the full dashboard width
- Use for welcome screens or setup documentation
- Apply dramatic color schemes for impact
**Hover Instructions**
Example note text for panels:
```
Hover over any KPI to see the link icon, then click to drill into detailed analysis.
```
**Section Organization**
Group related metrics together:
- Use note panels as section dividers
- Create visual hierarchy through sizing
- Align related panels for clean appearance
### Best Practices
- Design dashboards with the end user in mind - consider their technical expertise and information needs
- Use markdown formatting consistently across all note panels
- Maintain a cohesive color scheme throughout the entire project
- Provide clear instructions for drilling down into metrics
- Balance visual appeal with information density
- Test dashboards with actual end users before finalizing
- Create a setup/welcome dashboard that orients new users
- Use edit layout mode to create professional, organized dashboard appearances
- Add contact information so users know who to ask for help
### Common Pitfalls to Avoid
- Creating visually cluttered dashboards with too many colors and styles
- Using low-contrast color combinations that are hard to read
- Forgetting to disable note panel titles, creating redundant headers
- Placing instructional content at the bottom where users may not see it
- Inconsistent formatting across dashboards in the same project
- Over-designing to the point where form overshadows function
- Not testing the user experience from a non-editor perspective
- Using technical terminology in user-facing dashboards without explanation
---
## Iterative Refinement and Continuous Improvement
### The Iterative Approach
Building a mindzie studio project is not a linear process - it requires iteration and refinement:
**During Development:**
- Create dashboard structure → Realize you need additional dashboards
- Build enrichments → Discover new attributes would be valuable
- Create initial metrics → Identify gaps in analysis
- Publish dashboards → Receive user feedback requiring adjustments
**After Initial Deployment:**
- Monitor which dashboards and metrics users actually consume
- Gather feedback on clarity and usefulness
- Identify additional analysis needs
- Refine based on real-world usage patterns
### Reusing and Adapting Work

mindzie studio supports efficient reuse through copy-paste functionality:
**Copying Between Projects:**
- Open multiple projects in separate browser tabs
- Copy entire analysis notebooks from one project to another
- Copy enrichment notebooks to cascade common calculations
- Paste into target project and adapt as needed
**Adapting Copied Content:**
When copying analysis from other projects:
1. **Update Titles and Descriptions** - Change to match the new context
2. **Remove Irrelevant Filters** - Delete filters that don't apply to the new dataset
3. **Update Attribute Selections** - Ensure calculators reference attributes that exist in the new data
4. **Verify Enrichments Match** - Confirm that copied enrichments work with your dataset structure
5. **Recalculate** - Execute the pipeline to apply changes
**When to Reuse vs. Create New:**
- **Reuse** - Standard metrics like average duration, cost calculations, common conformance rules
- **Create New** - Process-specific analysis that doesn't translate across projects
### Monitoring and Refresh
mindzie studio supports two operational modes:
**Discovery Mode** - Initial process analysis to understand how things work
- One-time data upload
- Exploratory analysis
- Process redesign insights
**Continuous Monitoring Mode** - Ongoing performance tracking
- Scheduled data updates from mindzie Data Designer
- Manual CSV refreshes with updated data
- Automatic metric recalculation
- Trend analysis over time

When data refreshes:
- All metrics automatically recalculate
- Dashboards update with current values
- Historical trends incorporate new data points
- Users can monitor improvement or degradation
### Best Practices for Iteration
- Accept that initial designs will evolve based on usage and feedback
- Build incrementally rather than trying to perfect everything before deployment
- Gather user feedback early and often
- Document changes and versions for complex projects
- Create a backlog of enhancement ideas as they emerge
- Regularly review which dashboards and metrics are actually being used
- Archive or delete unused content to keep the project organized
- Schedule periodic reviews with stakeholders to assess effectiveness
### Common Pitfalls to Avoid
- Perfectionism that delays deployment and prevents learning from real usage
- Making changes based on feedback from a single user without broader validation
- Not documenting the logic behind complex analysis before making changes
- Copying enrichments between projects without verifying they match the data structure
- Overwhelming users with too many changes too quickly
- Forgetting to test after making iterative changes
- Not maintaining version control or documentation of significant changes
---
## Complete Workflow Checklist
Use this checklist to ensure you've completed all essential phases:
### Phase 1: Project Setup
- [ ] Project created with descriptive name
- [ ] Thumbnail uploaded (if customer-facing)
- [ ] Team members assigned with appropriate permissions
- [ ] Project accessible to all required users
### Phase 2: Data Configuration
- [ ] Data uploaded via CSV or Data Designer
- [ ] Case ID, Activity, Timestamp columns mapped correctly
- [ ] Resource column mapped (if available)
- [ ] Data import completed successfully
- [ ] Original and enriched datasets created
- [ ] Default analyses reviewed
### Phase 3: Dashboard Planning
- [ ] Setup/information dashboard created with documentation
- [ ] Role-based dashboard structure planned
- [ ] Dashboard names align with user roles and needs
- [ ] Copilot settings configured for each dashboard
- [ ] Dashboard hierarchy makes logical sense
### Phase 4: Log Enrichment
- [ ] Performance Wizard executed with appropriate thresholds
- [ ] Custom activity pairs added as needed
- [ ] Conformance rules configured for key violations
- [ ] Activity-based costing implemented (if applicable)
- [ ] Cost summarization created at case level
- [ ] All enrichments calculated and verified in data overview
- [ ] Enrichments organized into logical notebooks
### Phase 5: Investigations and Analysis
- [ ] Investigations created aligned with dashboards
- [ ] Analysis notebooks created for key metrics
- [ ] Enriched dataset selected for all investigations
- [ ] Descriptive names assigned to all analyses
- [ ] Default analyses that don't align removed or reorganized
### Phase 6: Metrics Creation
- [ ] Filters created to segment data appropriately
- [ ] Calculators selected from library and configured
- [ ] Enriched attributes leveraged in calculations
- [ ] Descriptions added to complex analyses
- [ ] Multiple views created using filter combinations
- [ ] Analysis tested and validated
### Phase 7: Publishing
- [ ] Metrics published to local dashboards first
- [ ] Metrics published to appropriate global dashboards
- [ ] Drill-down tabs pinned to optimal views
- [ ] Guidance notes added to complex metrics
- [ ] Publishing tested from end-user perspective
### Phase 8: Formatting and UX
- [ ] Dashboard layouts optimized using edit mode
- [ ] Instructional note panels added
- [ ] Color schemes applied consistently
- [ ] Markdown formatting used effectively
- [ ] User guidance provided for navigation and drill-down
- [ ] End-user testing completed
- [ ] Feedback incorporated
### Deployment Readiness
- [ ] All dashboards reviewed for quality and completeness
- [ ] Setup documentation accurate and helpful
- [ ] User training materials prepared (if needed)
- [ ] Data refresh process established
- [ ] Support contacts and escalation paths documented
- [ ] Success metrics defined for project evaluation
---
## Key Principles for Success
**1. User-Centric Design**
Always build with the end user in mind. Consider their role, technical expertise, and information needs at every phase.
**2. Front-to-Back Methodology**
Plan the dashboard structure before diving into detailed analysis. This ensures a coherent end-user experience.
**3. Leverage Enrichment**
The log enrichment engine is mindzie's superpower. Invest time in Phase 4 to create powerful attributes that enable sophisticated analysis.
**4. Iterative Development**
Don't try to perfect everything before deployment. Build incrementally, gather feedback, and refine.
**5. Documentation and Guidance**
Document your work thoroughly. Future you (and your colleagues) will thank you.
**6. Reuse and Standardize**
Build a library of reusable enrichments, analyses, and dashboard patterns that can be adapted for new projects.
**7. Test from the User Perspective**
Regularly step out of edit mode and experience your project as an end user would.
**8. Balance Complexity and Accessibility**
Create sophisticated analysis for power users while maintaining simple, clear dashboards for executives.
---
## Additional Resources
For detailed guidance on specific phases, refer to these companion documents:
- **Getting Started: Creating Your First mindzie studio Project** - Deep dive into Phase 1
- **Uploading and Configuring Data Sources** - Detailed Phase 2 instructions
- **Planning Your Dashboard Structure for Different User Roles** - Strategic guidance for Phase 3
- **Mastering the Log Enrichment Engine** - Comprehensive Phase 4 tutorial
- **Working with Investigations and Analysis Notebooks** - Phase 5 details
- **Creating Analysis with Filters and Calculators** - Phase 6 step-by-step guide
- **Publishing Metrics from Notebooks to Dashboards** - Phase 7 how-to
- **Designing User-Friendly Dashboards with Notes and Formatting** - Phase 8 best practices
- **Understanding mindzie's Dual Dataset Architecture** - Conceptual foundation
- **Building Conformance Rules for Process Compliance** - Advanced enrichment techniques
- **Advanced: Implementing Activity-Based Costing** - Detailed costing methodology
- **Reusing Analysis: Copying and Adapting Notebooks** - Efficiency techniques
- **Working with Root Cause Analysis** - AI-powered analysis features
- **Understanding Drill-Down and Continuous Monitoring** - Operational concepts
Visit the official mindzie documentation at https://docs.mindziestudio.com/ for additional tutorials, API references, and feature updates.
---
## Conclusion
Building a complete mindzie studio project from data to dashboards follows a structured eight-phase approach that transforms raw event logs into actionable process intelligence. By following this end-to-end workflow summary, you'll create professional, user-focused solutions that support both initial process discovery and ongoing continuous improvement monitoring.
Remember that mindzie studio is highly configurable and supports many different use cases and deployment patterns. Use this workflow as a framework, but adapt it to your specific organizational needs, user requirements, and process characteristics.
The key to success is maintaining focus on your end users throughout all eight phases - build for them, test with them, and refine based on their feedback. With this user-centric approach and the comprehensive workflow outlined in this guide, you'll deliver process intelligence solutions that drive real business value and continuous improvement.
---
## Overview
Section: Process Discovery
URL: https://docs.mindziestudio.com/mindzie_studio/process-discovery/overview
Source: /docs-master/mindzieStudio/process-discovery/overview/page.md
# Process Discovery
Process Discovery
Process Discovery tools help you visualize and understand your business processes
by analyzing event data and revealing the actual process flows.
---
## Process Map
Section: Process Discovery
URL: https://docs.mindziestudio.com/mindzie_studio/process-discovery/process-map
Source: /docs-master/mindzieStudio/process-discovery/process-map/page.md
# Process Map
## Overview
The Process Map is mindzie Studio's core visualization tool that creates interactive flowcharts of your business processes. It transforms raw event log data into clear, visual representations showing how work actually flows through your organization, helping you identify inefficiencies and optimization opportunities.
## Common Uses
- **Process Visualization**: Create clear visual representations of complex business processes
- **Variant Analysis**: Explore different process paths and identify the most common flows
- **Bottleneck Identification**: Spot activities that slow down your process
- **Compliance Monitoring**: Identify deviations from standard process flows
- **Performance Analysis**: Understand timing and frequency patterns across activities
- **Process Improvement**: Use insights to optimize workflows and reduce cycle times
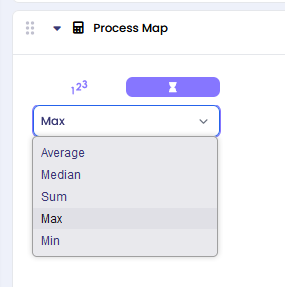
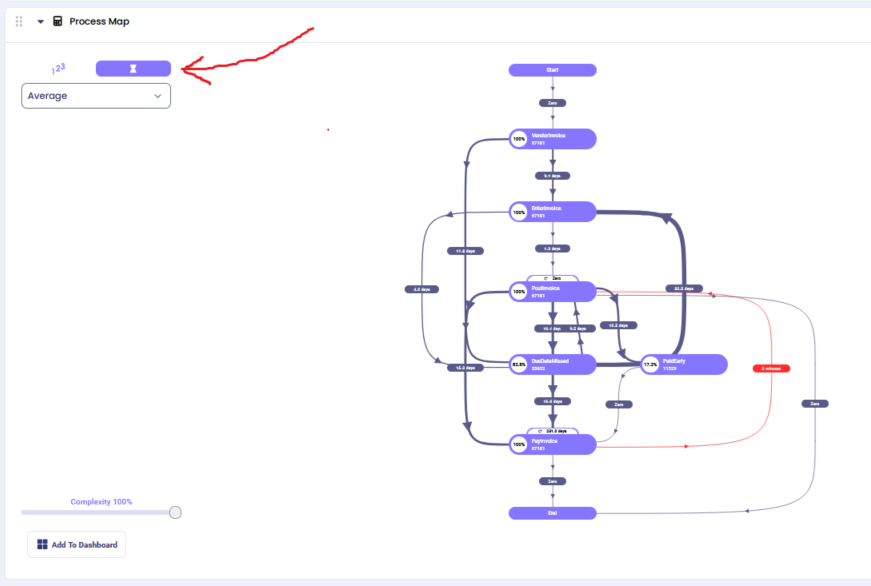
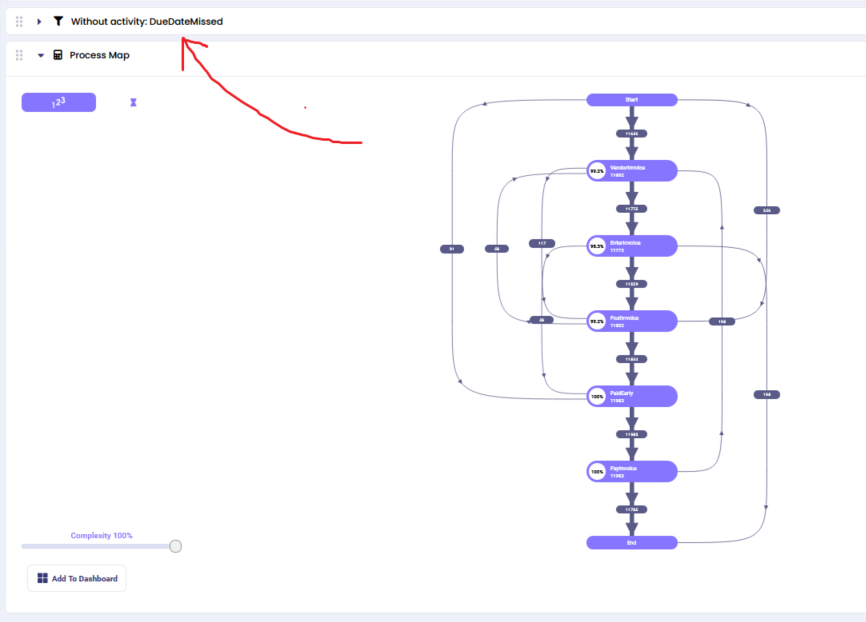
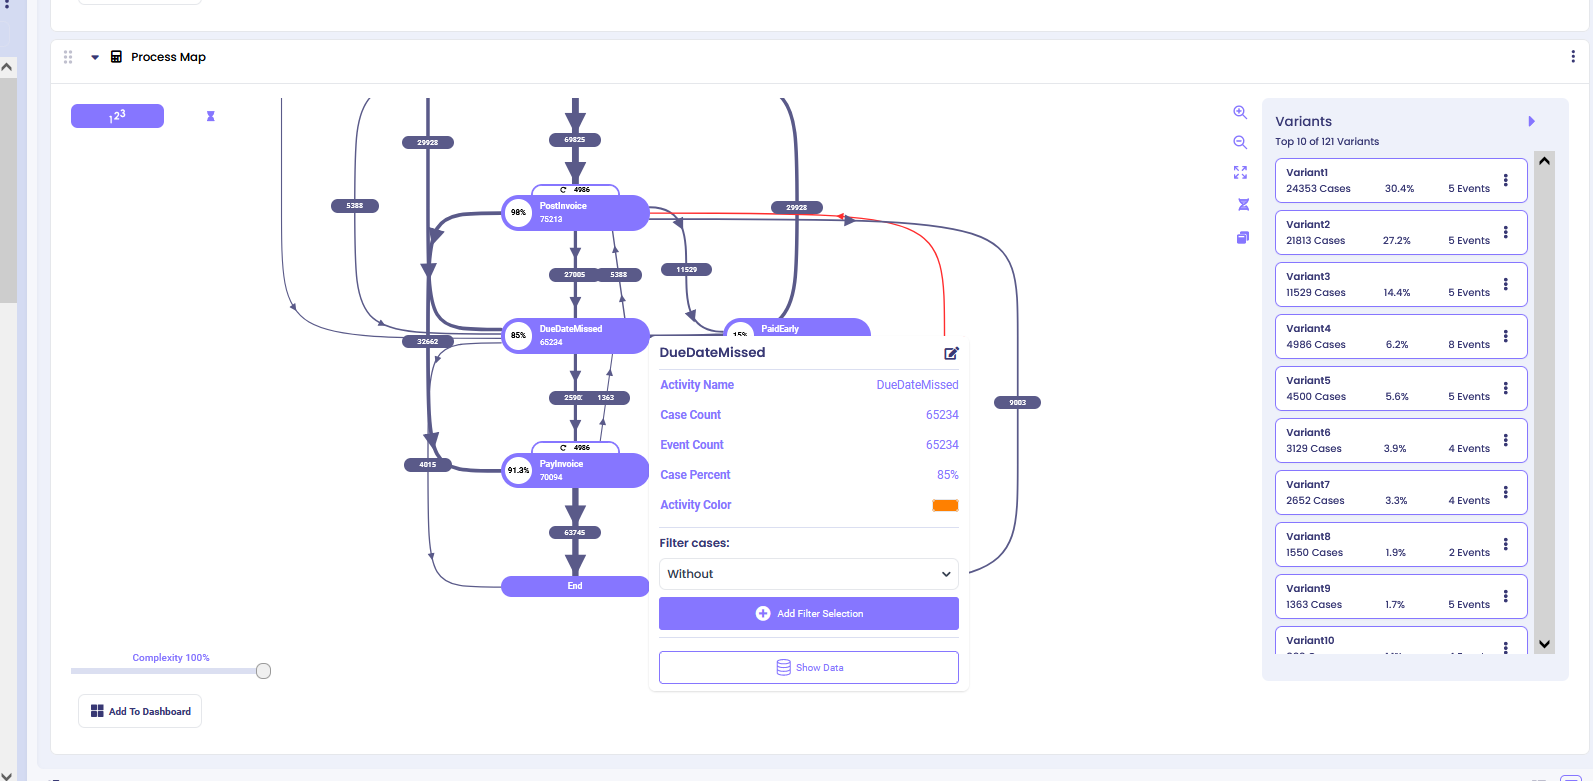
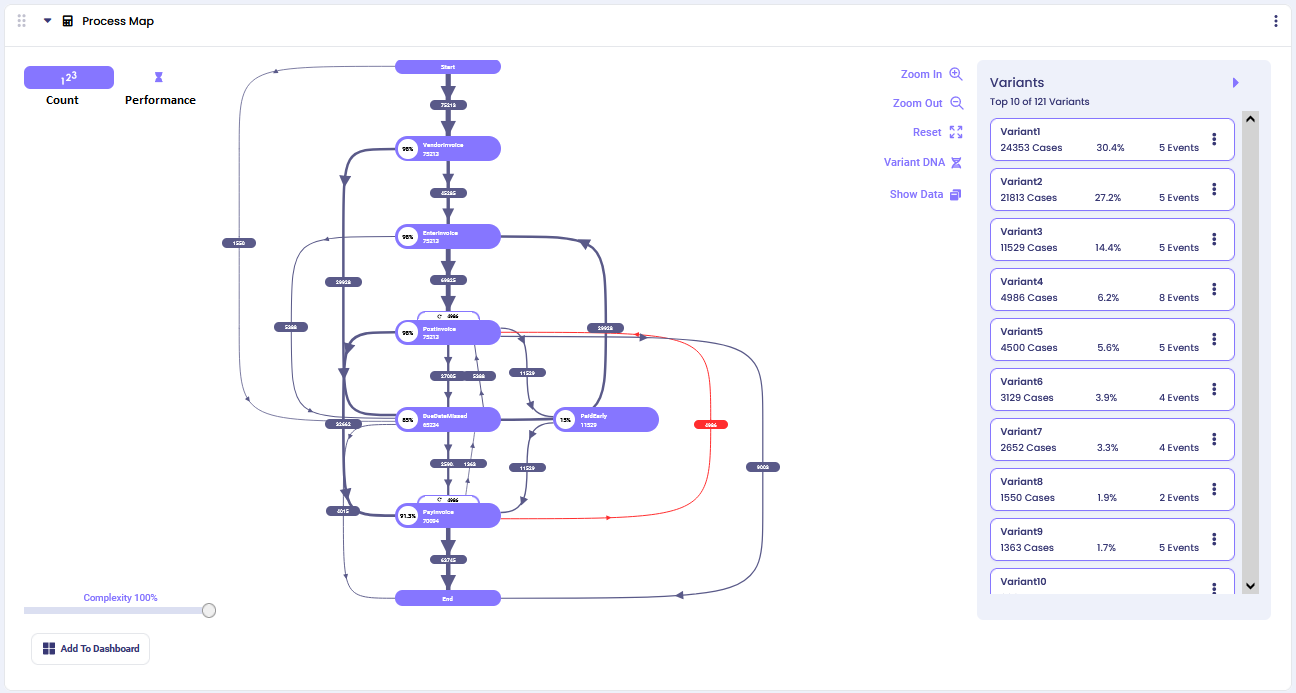
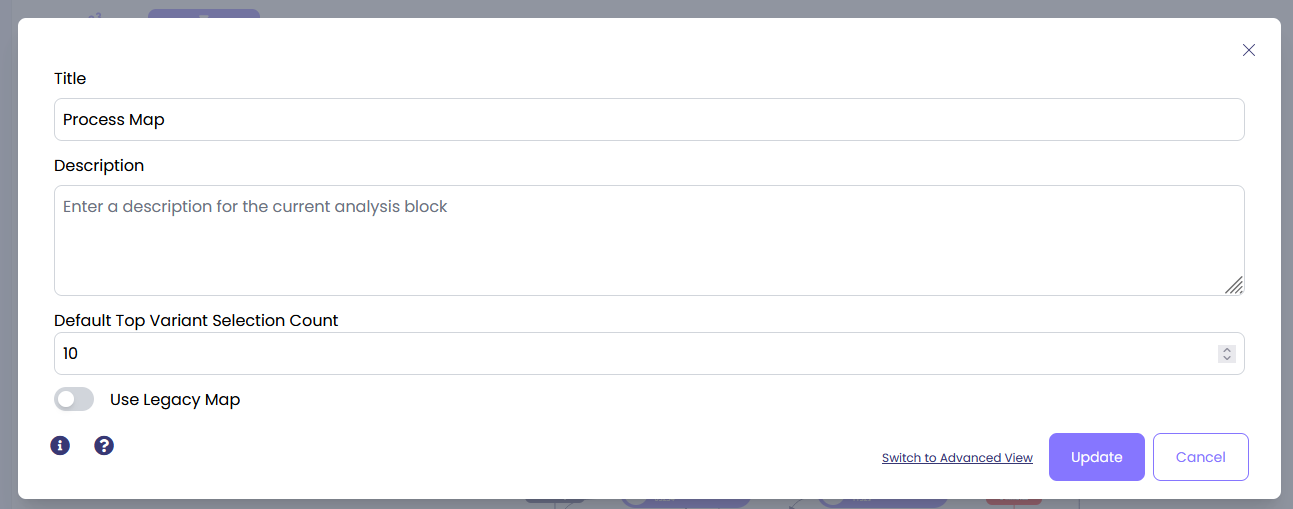
## Settings
By default, the calculator selects top 5 variants from your log and visualizes them. To change this number, click on three dots in the upper right corner of the calculator and click ‘Edit’.
Edit the ‘Default Top Variant Selection Count’ to the preferred number.
### Count View (default)
By default, you will see a process map that shows the flow of the Top 5 variants in your log. Here we adjusted it to Top 10 to provide more comprehensive process insights:
The Count View displays the frequency of each process path, helping you understand which routes through your process are most common.
#### Process Shapes
**Purple Ovals (Activities)**: Represent specific activities in your process
- The percentage shows what portion of all cases performed this activity
- The number shows the total count of cases that performed this activity
**Arrows (Process Flow)**: Show the directional flow from one activity to another
- The number on each arrow represents how many cases took this specific path
- Thicker lines indicate more cases followed this route
- **Red arrows** highlight unusual or non-standard process flows that may indicate exceptions or problems
#### Process Complexity
Use the complexity slider to manage visual clarity when your process map becomes too complex with many paths between activities.
- **Higher complexity percentage**: Shows only the most frequent paths (cleaner view)
- **Lower complexity percentage**: Reveals more infrequent paths between activities (detailed view)
This helps you focus on either the main process flows or dive deep into edge cases and exceptions.
#### Process Details
Click on any activity oval to see detailed information about that specific activity, including:
- Case count and percentage
- Incoming and outgoing flows
- Performance metrics
- Filter options
**Example**: Clicking on 'Due Date Missed' activity shows comprehensive details about this step in your process.
**Interactive Filtering**: From the activity details, you can create focused process maps by applying filters:
- **"without"**: Show process map excluding cases with this activity
- **"starts with"**: Show process map for cases beginning with this activity
- **"ends with"**: Show process map for cases ending with this activity
The selected filter automatically adds a filter block before the Process Map calculator in your analysis chain.
### Performance View
Switch from Count View to Performance View by clicking the performance icon in the top-left corner. This transforms your process map to show timing metrics instead of case frequencies.
**Performance Metrics Available:**
- **Average Duration**: Shows mean time between activities
- **Minimum Duration**: Displays fastest completion times
- **Maximum Duration**: Reveals longest completion times
- **Median Duration**: Shows typical timing performance
**Time Units**: The system automatically selects appropriate time units (minutes, hours, days, weeks) based on your data scale.
**Use Cases for Performance View:**
- Identify timing bottlenecks in your process
- Find activities that consistently take longer than expected
- Compare performance across different process paths
- Monitor SLA compliance for time-sensitive processes
You can switch between different performance metrics using the dropdown menu to gain various timing perspectives on your process flow.

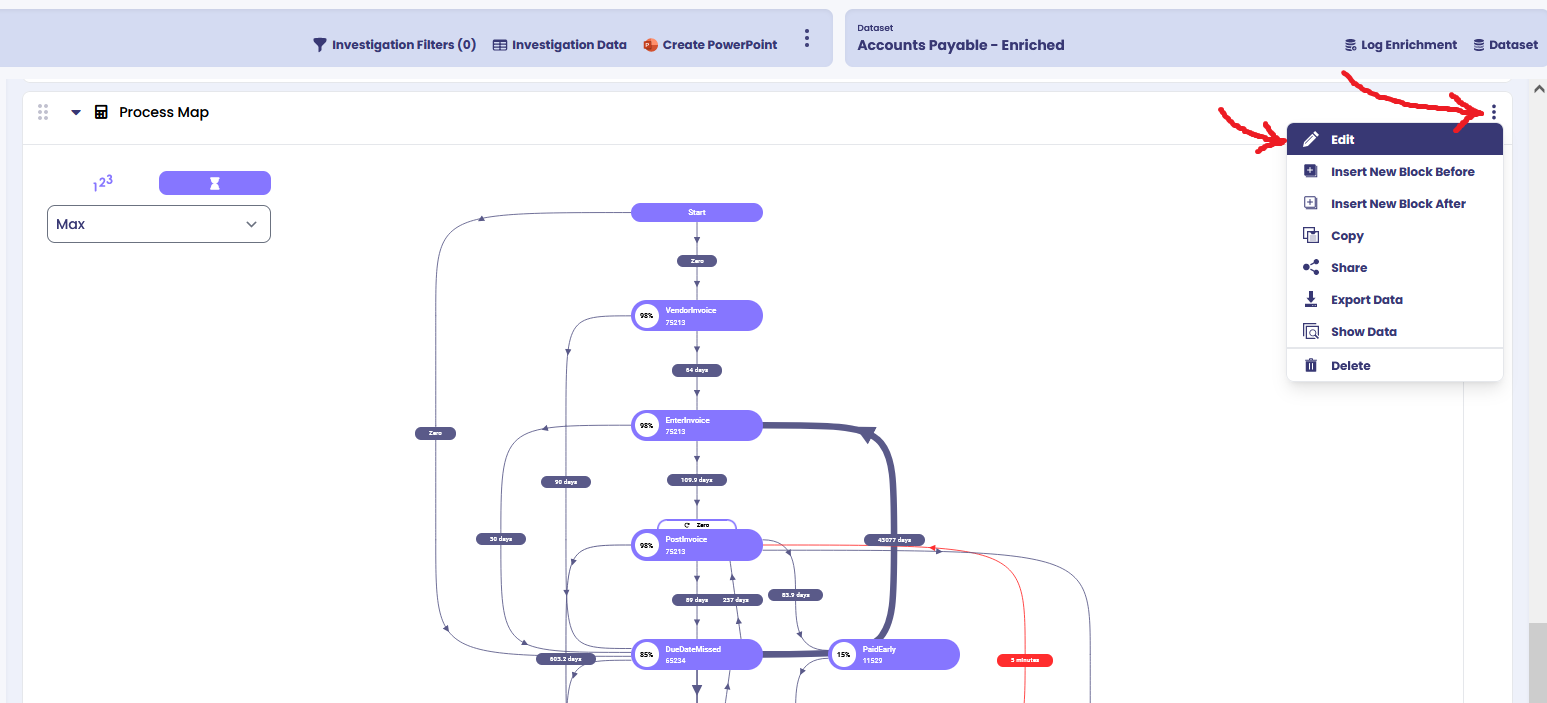
## Still stuck? How can we help?
Name:*Email:*Message:*
---
*This documentation is part of the mindzie Studio process mining platform.*
---
## Case Explorer
Section: Process Discovery
URL: https://docs.mindziestudio.com/mindzie_studio/process-discovery/case-explorer
Source: /docs-master/mindzieStudio/process-discovery/case-explorer/page.md
# Case Explorer
The Case Explorer allows you to view and analyze individual cases in your process, displaying detailed information about activities, resources, and other case attributes. This tool is essential for investigating specific cases, identifying patterns, and monitoring case-level metrics.
## Overview
The Case Explorer displays a list of individual cases with regards to activities, resources, and other attributes. You can specify the attributes you wish to explore and select the default sorting option to organize your view effectively.
## Common Uses
- Get an overview of cases and their attributes
- Explore and investigate issues with specific cases
- Set up email notifications with case data for regular monitoring
## Settings
### Basic Configuration
- **Attributes:** Select the specific attributes that you wish to explore. These can include case IDs, timestamps, resource names, or any custom attributes from your event log.
- **Sort Column:** Select which column you wish to sort by to organize your case data.
- **Sort Direction:** Choose whether to sort in ascending or descending order.
- **Max Rows:** Specify the maximum number of rows to display (default: 10000).
- **Email Settings:** If you wish to receive this report through email, specify the frequency of notifications.
### Column Format Settings
Click 'Set Formats' then 'Add Column Format' to customize how attributes are displayed. You can select the attribute, edit its display name, and choose the display format:
- **Text:** Format text as upper case or lower case.
- **Number:** Format number as a percentage, currency, an absolute value, or specify the number of decimal points to show.
- **Date:** Format date as:
- Short date (6/1/2021)
- Long date (Friday, June 1, 2021)
- Date and time (6/1/2021 1:34pm)
- **Duration:** Format duration as hours, days, months, years, etc., or choose TimeAuto for auto format detection.
- **Boolean:** Format Boolean value as either Yes/No or True/False.
## Examples
### Example 1: Explore Cases by Invoice Details
In this example, we'll explore invoice cases by viewing the invoice ID, total amount value, and due date.
**Step 1:** Configure the Case Explorer settings:

**Step 2:** Specify column formats for better readability:

**Step 3:** View the Case Explorer output:

### Example 2: Explore Cases by Purchase Order Details
Explore cases in regards to the quantity of items purchased, vendor region, and price changes.
**Step 1:** Configure the Case Explorer with purchase order attributes:

**Step 2:** In Set Formats, specify purchase order ID to be formatted as lower-case text and price changes to show 2 decimal points:

**Step 3:** View the Case Explorer output:

**Step 4:** To see details of a specific case, click on any cell to review the case fields, case values, and activity fields:

### Example 3: Explore Cases by Delivery Timeliness
Analyze cases based on their delivery timeliness metrics.
**Step 1:** Configure the Case Explorer with delivery-related attributes:

**Step 2:** View the Case Explorer output:

## Additional Features
### Exporting Data
Click the "Export" button at the top of the Case Explorer output to download your case data for external analysis or reporting.
### Case Detail View
Click on any cell in the Case Explorer table to open a detailed view showing:
- **Case Fields:** All attributes associated with the selected case
- **Case Values:** The specific values for each attribute
- **Activity Fields:** Details about activities that occurred within the case
This detailed view is useful for deep-dive investigations into specific cases or anomalies.
---
*This documentation is part of the mindzieStudio process mining platform.*
---
## Process Variants
Section: Process Discovery
URL: https://docs.mindziestudio.com/mindzie_studio/process-discovery/process-variants
Source: /docs-master/mindzieStudio/process-discovery/process-variants/page.md
# Process Variants
**Advanced Process Mining Analysis - Understanding Your Process Paths**
---
## Overview
**Process variants** are one of the most powerful features in mindzie Studio's process mining toolkit. They reveal the different paths that cases take through your business processes, showing you exactly how work actually gets done in your organization versus how you think it should be done.
> Process variants in mindzie Studio provide unprecedented visibility into how work actually flows through your organization, transforming complex process data into actionable insights.
---
## What Are Process Variants?
In process mining, a **variant** represents a unique sequence of activities that cases follow from start to finish. Each variant shows a different "way of working" through your process. For example, in a purchase-to-pay process, one variant might show the ideal path where everything happens in order, while another variant might reveal cases where invoices arrive before goods are received.

*mindzie Studio showing multiple process variants with their frequencies and activity sequences*
### Key Characteristics of Variants:
#### Unique Activity Sequences
Each variant represents a distinct path through your process, showing the exact order of activities.
#### Frequency Analysis
See how often each variant occurs, helping you identify the most common ways work gets done.
#### Performance Metrics
Understand the duration and efficiency of different process paths.
#### Case-Level Drill-Down
Click on any variant to explore the individual cases that followed that path.
---
## Understanding Variant Analysis in mindzie Studio
### Example: Purchase Order Process Variants
**Variant 1 (20% of cases):**
```
Create Purchase Order -> Vendor Creates Invoice -> Record Goods Receipt -> Record Invoice Receipt -> Clear Invoice
```
**Variant 2 (15% of cases):**
```
Create Purchase Order -> Record Goods Receipt -> Vendor Creates Invoice -> Record Invoice Receipt -> Clear Invoice
```
*Notice how Variant 2 shows goods being received before the vendor creates the invoice - a different but valid process flow.*

*Comparison of process variants showing how the timing of goods receipt and invoice creation can vary*
---
## How to Use Variants for Process Investigation
### Step-by-Step Process Investigation
1. **Identify Patterns**
- Review the variant list to understand the most common paths through your process
- Identify any unexpected or concerning patterns
2. **Analyze Frequencies**
- Look at the percentage and count for each variant
- Understand which paths are most prevalent in your organization
3. **Investigate Anomalies**
- Click on variants that seem unusual or incomplete
- Drill down into specific cases to understand why they occurred
4. **Explore Case Details**
- Use the Case Explorer to examine individual cases within a variant
- Understand the specific circumstances that led to that process path

*Case Explorer allows deep-dive analysis into individual cases within a variant*
---
## Real-World Investigation Examples
### Investigation: Incomplete Process Paths
In our demonstration, we discovered variants that only contained two activities: "Create Purchase Order Item" and "Change Approval for Purchase Order Item" - but then nothing else happened. This raises important questions:
- Why did these purchase orders never progress further?
- Were they cancelled or did they get stuck in the approval process?
- Is this indicating a systemic issue with the approval workflow?
*This type of analysis helps organizations identify process bottlenecks and improvement opportunities.*
### Process Flow: Activity Sequencing Variations
Different variants can reveal legitimate business flexibility or concerning process deviations:
- **Positive variation:** Goods receipt happening before or after invoice creation based on supplier relationships
- **Concerning variation:** Steps being skipped or performed out of required compliance order
- **Efficiency opportunities:** Identifying the fastest variants to standardize best practices

*Complex process variants showing the diversity of paths cases can take through business processes*
---
## Business Benefits of Variant Analysis
### Process Standardization
Identify the most efficient variants and work to standardize processes around proven successful paths.
### Exception Handling
Understand when and why processes deviate from the standard path, enabling better exception management.
### Compliance Monitoring
Ensure that critical regulatory or business requirements are being followed across all process variants.
### Performance Optimization
Compare the performance of different variants to identify and eliminate inefficient process paths.
### Training Insights
Understand where additional training might be needed based on problematic or inefficient variants.
### System Improvements
Identify where system design might be forcing users into suboptimal process paths.
---
## Technical Implementation
### How mindzie Studio Calculates Variants
mindzie Studio analyzes your event log data to identify unique sequences of activities for each case. The system:
- Groups cases by their exact activity sequence
- Calculates frequency and percentage for each unique path
- Provides performance metrics (duration, resource usage) for each variant
- Enables filtering and drilling down into specific cases within variants
### Navigation and Interface
The mindzie Studio variants interface provides intuitive navigation:
- **Variant List:** Shows all variants with their frequency and key metrics
- **Activity Flow:** Visual representation of the sequence for each variant
- **Case Explorer:** Detailed view of individual cases within any variant
- **Filtering Options:** Ability to focus on specific time periods, departments, or other dimensions
---
## Getting Started with Variant Analysis
### Quick Start Guide
1. **Access the Variants View**
- Navigate to the Variants section in mindzie Studio to see your process variants
2. **Review Top Variants**
- Start by examining the most frequent variants to understand your standard processes
3. **Investigate Outliers**
- Look at low-frequency or unusual variants to identify potential issues or opportunities
4. **Drill Down for Details**
- Use the case explorer to understand the context behind interesting or concerning variants
---
## Best Practices
### Regular Monitoring
- Schedule regular variant analysis sessions to monitor process evolution
- Set up alerts for new unusual variants that emerge
### Focus Areas
- Prioritize investigation of variants that represent significant case volumes
- Pay special attention to variants with extreme performance characteristics
### Stakeholder Engagement
- Share variant insights with process owners and stakeholders
- Use variants to facilitate discussions about process improvement opportunities
### Benchmarking
- Compare variant performance across different time periods
- Benchmark variants against industry standards or internal targets
---
## Use Cases Across Industries
### Manufacturing
- Quality control process variations
- Production line efficiency analysis
- Supplier management optimization
### Financial Services
- Loan approval process paths
- Customer onboarding variations
- Compliance process monitoring
### Healthcare
- Patient care pathway analysis
- Treatment protocol variations
- Resource utilization optimization
### Supply Chain
- Order fulfillment variations
- Inventory management processes
- Vendor interaction patterns
---
## Advanced Features
### Filtering and Segmentation
- Filter variants by time periods, organizational units, or custom attributes
- Segment analysis by process dimensions like department, product type, or customer category
### Performance Comparison
- Compare duration, cost, and resource usage across variants
- Identify performance outliers and optimization opportunities
### Conformance Checking
- Compare actual variants against reference process models
- Identify deviations from expected or mandated process flows
### Predictive Analytics
- Use variant patterns to predict likely future process paths
- Identify early warning signals for process problems
---
## Troubleshooting Common Issues
### Too Many Variants
- Use filtering to focus on the most significant variants
- Consider process standardization initiatives
- Look for opportunities to reduce unnecessary process variation
### Missing Expected Variants
- Check data completeness and quality
- Verify that all process steps are being logged
- Review filtering criteria that might be excluding relevant cases
### Inconsistent Variant Definitions
- Ensure consistent activity naming across systems
- Standardize process definitions and terminology
- Implement data governance practices for process logging
---
## Integration with Other mindzie Studio Features
### Process Discovery
- Use variants to understand discovered process models
- Validate process mining results against business knowledge
### Performance Analysis
- Combine variant analysis with performance metrics
- Identify bottlenecks within specific process paths
### Social Network Analysis
- Understand how organizational networks influence process variants
- Identify collaboration patterns within different process paths
### Root Cause Analysis
- Use variants as starting points for deeper investigation
- Connect process variations to external factors and triggers
---
## Conclusion
Process variants in mindzie Studio provide unprecedented visibility into how work actually flows through your organization. By understanding these different paths, you can:
- **Optimize processes** by standardizing around the most efficient variants
- **Ensure compliance** by monitoring adherence to required process steps
- **Train employees** more effectively based on actual process patterns
- **Improve systems** by identifying where design forces suboptimal paths
- **Deliver better business outcomes** through data-driven process improvement
The variant analysis feature transforms complex process data into actionable insights, helping organizations move from wondering "what happened?" to understanding "why it happened" and "how can we improve it?"
> **Ready to explore your process variants?** Start by identifying your most common process paths, then investigate any variants that seem unusual or inefficient. Remember that every variant tells a story about how work gets done in your organization.
---
## Additional Resources
### Documentation Links
- [Case Explorer](/mindzie_studio/process-discovery/case-explorer) - Drill down into individual cases
- [Process Map](/mindzie_studio/process-discovery/process-map) - Visualize process flows
- [Process Variants Filter](/mindzie_studio/filters/process-variants-filter) - Filter data by top variants
### Training Materials
- Interactive variant analysis tutorial
- Video demonstrations of key features
- Hands-on workshop materials
### Support
- Community forums for variant analysis discussions
- Expert consultation services
- Regular webinars on advanced techniques
---
*This documentation is part of the mindzie Studio process mining platform.*
---
## Process Performance Matrix
Section: Process Discovery
URL: https://docs.mindziestudio.com/mindzie_studio/process-discovery/process-performance-matrix
Source: /docs-master/mindzieStudio/process-discovery/process-performance-matrix/page.md
# Process Performance Matrix
## Overview#
The calculator shows the conformance versus performance categories as a matrix.
## Common Uses#
To analyze the frequency and relationship between selected performance and conformance issues.
## Settings#
Conformance Issue Attribute:Select any Boolean case attribute which represents a conformance issue (e.g., whether an activity was repeated or skipped). To set up ‘Conformance Issue’ attribute, refer to ourConformance Enrichment Documents.Performance Attribute:Select the attribute which you wish to be representative of performance, it could be any categorical attribute (for instance, case duration split into categories).
### Example 1#
Let’s analyze the number of conformance issues associated with case duration categories.
The output is a process performance matrix.
Green blocks show the number and percentage of cases with no conformance issues, while red blocks show the number and percentage of cases with conformance issues per each case duration category.


### Example 2#
Let’s analyze the number of conformance issues associated with ‘Post to Pay’ duration categories.
The output is a process performance matrix.

## Still stuck? How can we help?
Name:*Email:*Message:*
---
*This documentation is part of the mindzie Studio process mining platform.*
---
## Conformance Analysis
Section: Process Discovery
URL: https://docs.mindziestudio.com/mindzie_studio/process-discovery/conformance-analysis
Source: /docs-master/mindzieStudio/process-discovery/conformance-analysis/page.md
# Conformance Analysis
## Overview
Conformance Analysis lets you define what your process **should** look like and then automatically check how well your actual cases follow that process. It answers the question: "Are my cases running the way they are supposed to?"
You do this by walking through your process variants, accepting the ones that are correct and rejecting the ones that are not. For rejected variants, you can document **why** they deviate from the expected process -- with optional AI assistance to help write the explanation. mindzie then builds a process model from your accepted variants and scores every other variant against it.
The result is a **documented process** where:
- Good variants define what the process SHOULD look like (the reference model)
- Bad variants explain what can go WRONG and why (the deviation catalog)
- Everything else is automatically classified against the model

## Getting Started
1. Navigate to **Conformance** in the top menu
2. Select a dataset from the dropdown in the top-right corner
3. **Triage your variants** from top to bottom (most frequent first):
- Click the **checkmark** to mark a variant as Good (one click, no friction)
- Click the **X** to mark a variant as Bad -- a note row automatically expands
4. For bad variants, **document the deviation**: type a reason or click the **sparkle button** to have AI generate one
5. Click **Build & Check Conformance** to build a process model and run conformance checking
6. Review the results: each variant gets a fitness score and is classified as either "Fits" or "Fails"
7. Optionally adjust the **Threshold** slider to control how strict the conformance check is
8. Click **Save Model** to persist your conformance model and deviation notes for use in enrichments
## How It Works
### Step 1: Triage Your Variants
The Variants tab shows all process variants in your dataset, sorted by frequency (most common first). Each row represents a unique sequence of activities, with colored activity labels showing the process flow.
Walk through the list from top to bottom. For each variant, click one of three buttons:
- **Good** (checkmark) -- This variant represents a correct process execution. One click, no further input needed.
- **Bad** (X) -- This variant is a known anomaly. When you click X, a note row automatically expands below the variant where you can document why it deviates.
- **Unclassified** (dash) -- Let the system decide based on conformance. This is the default state.
You can also override a variant that was auto-classified by clicking its selection buttons.
### Documenting Deviations
When you mark a variant as Bad, an inline note row appears directly below it. This row contains:
- **A text area** where you can type the reason this variant deviates from the expected process
- **A sparkle button** (if AI is configured for your tenant) that generates a deviation description automatically
The AI examines your accepted good variants and compares them against the rejected variant to identify what is different -- missing activities, extra steps, wrong order, or repeated activities. The generated description is placed in the text area where you can accept it as-is or edit it before saving.
Notes are optional. You can mark a variant as Bad without providing a reason, but documenting deviations creates a valuable catalog of known process issues that can be used for reporting, training, and continuous improvement.
To collapse a note row without removing the note, click the **collapse arrow** on the right side of the note row. Variants with saved notes show a small note icon even when collapsed.
### Step 2: Build the Process Model
When you click **Build & Check Conformance**, mindzie performs two operations:
**Process Discovery** - mindzie analyzes the selected good variants and discovers a structured process model that captures all valid execution paths. The model identifies:
- The sequence of activities
- Decision points where the process can take different paths (XOR gateways)
- Parallel paths where activities can happen simultaneously (AND gateways)
- Optional activities that may be skipped
- Loops where activities repeat
The discovered model is displayed in two formats:
**Process Tree** - A hierarchical view showing the structure of the process with operators (sequence, choice, parallel, loop) and activity nodes.

**BPMN Diagram** - A standard Business Process Model and Notation diagram showing the process flow with start/end events, activity boxes, and gateway diamonds.

You can switch between these views using the **Process Model** dropdown. You can also download the BPMN as an XML file using the **Download BPMN** button.
### Step 3: Check Conformance
After the model is built, mindzie converts it into a Petri net (a mathematical model of the process) and uses **token replay** to check each variant against the model.
Token replay works by simulating the execution of each case through the Petri net:
1. A token is placed at the start of the process
2. For each activity in the case, the system tries to move the token through the corresponding transition in the model
3. If the transition can fire normally, the case is conforming at that step
4. If the transition cannot fire (the activity is out of order or unexpected), a conformance violation is recorded
5. After all activities, the system checks whether the token reached the end of the process
This simulation produces four key measurements:
| Measurement | What It Means |
|-------------|---------------|
| **Consumed tokens** | Total tokens used during replay (activities that executed) |
| **Produced tokens** | Total tokens created during replay (transitions that fired) |
| **Missing tokens** | Tokens that had to be artificially added because the model was not in the right state |
| **Remaining tokens** | Tokens left over after replay that should not be there |
## Fitness Score
The fitness score is a value between 0.0 and 1.0 that quantifies how well a variant conforms to the model:
```
Fitness = 0.5 x (1 - missing/consumed) + 0.5 x (1 - remaining/produced)
```
- **1.0** = Perfect conformance. The variant follows the model exactly.
- **0.8** = Good conformance. Minor deviations from the model.
- **0.5** = Poor conformance. Significant deviations.
- **0.0** = No conformance. The variant does not follow the model at all.
### How Deviations Reduce Fitness
**Missing tokens** occur when the case does something the model does not expect at that point:
- An activity happens out of order
- An activity is skipped and the next activity cannot fire
**Remaining tokens** occur when the case does not complete the expected process:
- The case ends before reaching the final state
- A branch of a parallel process is not completed
**Unmapped activities** occur when the case contains activities that do not exist in the model at all:
- An extra step was performed that is not part of any good variant
- Each unmapped activity reduces the fitness proportionally to the trace length
A variant is considered **fully fit** only when it has zero missing tokens, zero remaining tokens, and zero unmapped activities.
## Threshold
The **Threshold** slider (0.0 to 1.0) controls how strict the conformance check is:
- At **1.0** (strictest): Only variants that perfectly match the model are classified as "Fits"
- At **0.95** (recommended): Variants with very minor deviations still pass
- At **0.8**: Variants with moderate deviations pass
- At **0.5**: Only variants with major deviations fail
### Effect on Classification
After conformance checking, the system classifies each variant:
| Filter | Color | Meaning |
|--------|-------|---------|
| **In Model** | Blue | Variants you explicitly selected as good |
| **Fits** | Green | Unselected variants that meet the fitness threshold |
| **Fails** | Red | Unselected variants that do not meet the fitness threshold |
| **Unclassified** | Gray | Variants that have not been checked yet |
Use the filter checkboxes at the top to show or hide each category.
### Can Non-Selected Variants Pass at Threshold 1.0?
Yes. If an unselected variant follows a path that is perfectly valid in the process model (every activity exists, every transition fires correctly, and the final state is reached), it will receive a fitness score of 1.0 and be classified as "Fits". This is intentional -- the model represents all valid paths, not just the exact variants you selected.
For example, if you select two variants with different branches (A then B, or A then C), the model creates a choice gateway. Any other variant that follows one of those branches exactly will also score 1.0.
## Auto-Classification of New Variants
When you save a conformance model and it is applied as an enrichment, new cases that arrive later are automatically classified:
- Cases whose variant matches a previously selected good variant are classified as **Good**
- Cases whose variant matches a previously selected bad variant are classified as **Anomaly**
- Cases with new, unseen variants are **auto-classified** by running token replay against the saved model
- If the fitness score meets the threshold: classified as **Good** (source: AutoConformance)
- If the fitness score is below the threshold: classified as **Anomaly** (source: AutoConformance)
This means your conformance rules continue to work as new data flows in, without needing to manually re-classify every new variant.
## Saving and Using the Model
### Save Model
Click **Save Model** to persist the conformance model. This saves:
- Your variant selections (good/bad/overridden)
- Your deviation notes for bad variants
- The discovered process model (BPMN and Petri net)
- The fitness threshold setting
The saved model is stored as an enrichment operator on the dataset, meaning it runs automatically when the dataset is refreshed.
### Enrichment Output
When the conformance model runs as an enrichment, it adds five columns to your case data:
| Column | Type | Values |
|--------|------|--------|
| **Is Variant Anomaly** | Boolean | Yes / No |
| **Variant Classification** | Text | "Good" or "Anomaly" |
| **Variant Fitness Score** | Percentage | 0% to 100% |
| **Classification Source** | Text | "Explicit", "UserOverride", or "AutoConformance" |
| **Deviation Reason** | Text | Description of why the variant deviates (from your notes) |
The **Deviation Reason** column is populated from the notes you wrote (or AI generated) when marking variants as Bad. For variants that were explicitly rejected with a documented reason, the exact note text appears in this column. For auto-classified anomalies, this column is empty unless you later add a note.
These columns can be used in filters, calculators, and dashboards to analyze conformance across your process. The Deviation Reason column is particularly useful for building dashboards that show the most common types of process deviations.
### Download BPMN
Click **Download BPMN** to export the process model as a standard BPMN 2.0 XML file. This file can be opened in any BPMN-compatible tool for further analysis or documentation.
## Workflow Example
Here is a typical workflow for setting up conformance analysis:
1. **Load your dataset** and navigate to the Conformance page
2. **Start from the top of the variant list** -- variants are sorted by frequency, so the most important paths appear first
3. **Triage each variant**:
- For correct process paths: click the checkmark (one click, done)
- For known anomalies: click X, then document why using the note row
- For variants you are unsure about: leave unclassified and let the model decide
4. **Use AI to help document deviations** -- click the sparkle button to generate a description comparing the rejected variant against your accepted good variants
5. Click **Build & Check Conformance** to generate the model and classify all remaining variants
6. **Switch to the Process Model tab** to review the discovered BPMN diagram
7. **Adjust the threshold** if needed based on your tolerance for deviations
8. **Review the results**: use filters to focus on failing variants and understand why they deviate
9. Click **Save Model** to save the conformance model, deviation notes, and enable automatic classification on future data refreshes
10. **Build dashboards** using the enrichment columns (including Deviation Reason) to track conformance metrics over time
## AI-Assisted Deviation Descriptions
When AI is configured for your tenant, the sparkle button appears next to the note text area for bad variants. Clicking it sends the following context to the AI:
- All variants you have marked as Good (the expected process paths)
- The specific variant you marked as Bad (the deviation)
The AI compares them and produces a 1-2 sentence explanation identifying:
- **Extra activities** -- steps that do not appear in any good variant
- **Missing activities** -- steps in good variants that are absent
- **Wrong order** -- steps that appear in a different sequence
- **Repeated activities** -- steps that occur more than expected
The AI suggestion is placed in the text area. You can accept it as-is, edit it to be more specific, or replace it entirely with your own text. AI is fully optional -- if it is not configured for your tenant, the sparkle button does not appear, and you can always type notes manually.
## Tips
- **Start with a few good variants**: Selecting too many variants creates an overly permissive model. Start with 1-3 variants that represent the core happy path.
- **Work top-to-bottom**: Variants are sorted by frequency. Classifying the most common paths first gives you the best coverage with the least effort.
- **Document deviations as you go**: Writing a note when you mark a variant as Bad takes seconds but creates lasting documentation. Use AI to speed this up.
- **Use the Process Tree view** to understand the structure of the discovered model, especially decision points and optional activities.
- **Set the threshold to 0.95 initially**: A threshold of 1.0 is very strict and may flag variants with trivial differences. Start at 0.95 and adjust based on your results.
- **Check the Classification Source column**: This tells you whether a classification was from your explicit selection, an override, or auto-classification. Use it to audit how new variants are being handled.
- **Use the Deviation Reason column in dashboards**: Build reports showing the most common deviation reasons to prioritize process improvement efforts.
- **Combine with other enrichments**: Use the "Is Variant Anomaly" column as input for other analysis, such as root cause analysis on anomalous cases or trend analysis of conformance over time.
---
## Full Screen Process Map
Section: Process Discovery
URL: https://docs.mindziestudio.com/mindzie_studio/process-discovery/full-screen-process-map
Source: /docs-master/mindzieStudio/process-discovery/full-screen-process-map/page.md
# Full screen Process Map
## Overview#
Full screen process map.
## Common Uses#
It helps to explore large process maps on a full screen.Used for easier visualization of large complex processes with many activities.

## Example#
Click the arrows icon on the process map view to enlarge your process map to full screen:
## Still stuck? How can we help?
Name:*Email:*Message:*
---
*This documentation is part of the mindzie Studio process mining platform.*
---
## Export Process Map and Dashboard
Section: Process Discovery
URL: https://docs.mindziestudio.com/mindzie_studio/process-discovery/export-image-process-map-and-dashboard
Source: /docs-master/mindzieStudio/process-discovery/export-image-process-map-and-dashboard/page.md
# Export Image (Process Map and Dashboard)
## Overview#
Export image button generates an image of the process map or dashboard metric which can be copied or saved. By default, the image is saved with a transparent background, you can uncheck the ‘Transparent background’ checkbox and select a desired background color.
## Common Uses#
Exporting the process map for adding to presentationsUses metrics and KPI’s in management reports
### Export Process Map Image#
Click the camera icon on the process map view.
### Export Dashboard Image#
Click the export image button to save a high resolution image of the dashboard.
### Export Individual Dashboard Metric#
Hover over the desired metric with your mouse, click the camera icon.
## Example
To export a process map image:
1. Navigate to your process map view
2. Click the camera icon in the toolbar
3. Choose whether to use transparent background
4. Select background color if needed
5. Save or copy the generated image


---
*This documentation is part of the mindzie Studio process mining platform.*
---
## Analysis Architecture
Section: Architecture
URL: https://docs.mindziestudio.com/mindzie_studio/architecture/analysis-architecture
Source: /docs-master/mindzieStudio/architecture/analysis-architecture/page.md
# Analysis Architecture
The analysis architecture shows how mindzieStudio transforms your raw process data into actionable insights through a layered approach. Understanding this architecture helps you design effective analysis workflows and make the most of the platform's capabilities.

## Overview
The analysis architecture follows a data transformation pipeline that moves from raw event logs through enrichment and analysis to visual dashboards. At each stage, you have powerful tools to refine, analyze, and present your process data.
---
## Dataset
Your **Dataset** is the starting point for all analysis. A dataset contains your raw event log data - the digital footprint of your business process.
Every dataset includes:
- **Case ID**: A unique identifier for each process instance (e.g., order number, ticket ID)
- **Activity**: The name of each step in your process (e.g., "Create Order", "Approve Request")
- **Timestamp**: When each activity occurred
- **Additional Attributes**: Any other data columns relevant to your process (e.g., user, department, value)
Datasets can be uploaded directly as CSV, Excel, or Parquet files, or imported through mindzie Data Designer from your source systems.
---
## Enrichment
**Enrichments** transform and enhance your raw data. Think of enrichment as a preparation stage where you clean, calculate, and add business context to your data before analysis.
Enrichments can:
- Clean and normalize your data
- Calculate new attributes (e.g., case duration, activity counts)
- Apply business rules and categorizations
- Add conformance flags (e.g., "process followed expected order")
- Remove unwanted events or cases
Multiple enrichments can be chained together, with the output of one enrichment serving as the input to the next. This allows you to build sophisticated data preparation pipelines.
---
## Enriched Dataset
An **Enriched Dataset** is the output of an enrichment process. It contains all your original data plus any new attributes, calculations, or transformations you defined.
Enriched datasets are stored separately from your original data, so you can always return to the source. You can create multiple enriched datasets from the same source, each optimized for different analysis needs.
---
## Investigation
An **Investigation** is your analysis workspace where you explore a dataset in depth. Each investigation is linked to either a raw or enriched dataset.
Investigations include:
- **Investigation Filters**: Global filters that apply to all analysis within the investigation, allowing you to focus on specific scenarios (e.g., "only completed cases" or "only cases from Q4")
- **Analysis Notebooks**: Multiple notebooks can exist within a single investigation, each answering different questions about your process
Think of an investigation as a project folder that organizes all your analysis work for a particular dataset.
---
## Analysis Notebooks
**Analysis Notebooks** are ordered collections of analysis blocks. Each notebook represents a logical sequence of analysis steps that together answer specific questions about your process.
For example, a notebook might:
1. Filter to a specific case type
2. Calculate key metrics
3. Identify outliers
4. Generate visualizations
You can create multiple notebooks within an investigation, each focusing on different aspects of your process.
---
## Blocks: Filter, Calculator, and Alert
**Blocks** are the building blocks of analysis. There are three types of blocks that work together:
### Filters
Filters select which cases or events to include in your analysis. They help you focus on the specific subset of data relevant to your question. Examples include:
- Cases that started in a specific time period
- Cases where a particular activity occurred
- Cases with duration above a threshold
### Calculators
Calculators compute metrics, generate visualizations, and produce statistics. They turn your filtered data into insights. Examples include:
- Process maps showing activity flow
- Case duration histograms
- Trend analysis over time
- Root cause analysis
### Alerts
Alerts monitor your process data and notify you when conditions are met. They enable continuous monitoring of your processes. Examples include:
- Alert when case volume exceeds threshold
- Alert when average duration increases significantly
- Alert when conformance rate drops
The typical flow in an analysis notebook is: **Filter** (select data) -> **Calculator** (compute insights) -> **Alert** (monitor conditions).
---
## Dashboards
**Dashboards** present your analysis results to stakeholders. A dashboard pulls visualizations from multiple analysis blocks across different notebooks into a single, unified view.
Dashboards feature:
- Grid-based layout for flexible arrangement
- Multiple panels showing different metrics
- Real-time data when connected to refreshed datasets
- Shareable views for collaboration
You can create multiple dashboards from the same investigation, each tailored to different audiences (e.g., executive summary vs. operational detail).
---
## Apps
**Apps** are external applications that consume your analysis results for operational use. They extend the reach of your process insights beyond the mindzieStudio interface.
Apps enable:
- Embedding dashboards in other systems
- Operational tools built on process insights
- Integration with business applications
---
## Summary
The analysis architecture provides a structured approach to process intelligence:
1. **Load** your data into a Dataset
2. **Prepare** it through Enrichments to create Enriched Datasets
3. **Analyze** within Investigations using Notebooks and Blocks
4. **Present** results through Dashboards and Apps
Each layer builds on the previous, allowing you to progressively refine your understanding of your business processes.
---
## Data Architecture
Section: Architecture
URL: https://docs.mindziestudio.com/mindzie_studio/architecture/data-architecture
Source: /docs-master/mindzieStudio/architecture/data-architecture/page.md
# Data Architecture
The data architecture shows how process data flows into mindzieStudio, gets transformed through enrichment, and can be exported or used to trigger automated actions. Understanding these data pathways helps you design effective data integration strategies.

## Overview
mindzieStudio supports multiple data input methods, a centralized API layer, and various output options. This flexible architecture allows you to integrate process mining into your existing data ecosystem.
---
## Data Input Sources
There are several ways to bring process data into mindzieStudio:
### Manual Upload
The simplest approach is to upload files directly through the mindzieStudio interface. Supported formats include:
- **CSV files**: Standard comma-separated values
- **Excel files**: .xlsx spreadsheets
- **Parquet files**: Columnar storage format for large datasets
- **ZIP archives**: Compressed packages containing multiple files
Manual upload is ideal for ad-hoc analysis, proof-of-concept projects, or when data is already exported from source systems.
### mindzie Data Designer
**mindzie Data Designer** is a visual tool that connects directly to your source databases and systems. It allows you to:
- Define data schemas visually
- Map source columns to event log format
- Schedule automated data refreshes
- Transform data during extraction
Data Designer supports connections to major databases including SQL Server, Oracle, PostgreSQL, MySQL, SAP HANA, and many others.
### 3rd Party ETL Tools
If your organization already has ETL (Extract, Transform, Load) infrastructure, you can integrate with mindzieStudio through standard data pipelines. This approach leverages your existing data engineering capabilities and governance processes.
### Developer Data Upload
For programmatic access, the mindzieStudio API allows developers to:
- Upload datasets via HTTP endpoints
- Automate data refresh from custom applications
- Integrate with CI/CD pipelines
- Build custom data connectors
This is ideal for organizations building automated data pipelines or integrating process mining into larger systems.
### Mulesoft Integration
Enterprise organizations using Mulesoft for integration can connect mindzieStudio as an API endpoint in their integration flows. This enables process data to flow as part of your broader enterprise integration strategy.
---
## API
The **API** serves as the central gateway for all data movement in mindzieStudio. All data - whether uploaded manually or via automation - flows through the API layer.
The API provides:
- **Authentication**: Secure access through bearer tokens
- **Validation**: Data format and schema validation
- **Routing**: Directing data to the appropriate processing components
- **Access Control**: Tenant and project-level permissions
The API is available in Enterprise Server and SaaS editions of mindzieStudio.
---
## Dataset
Once data enters mindzieStudio, it is stored as a **Dataset**. Datasets are:
- **Compressed**: Efficient binary storage format
- **Validated**: Checked for required columns and data types
- **Versioned**: Previous uploads can be retained for comparison
Every dataset must include the three core event log columns:
- Case ID (identifier for each process instance)
- Activity (name of each step)
- Timestamp (when each step occurred)
Additional attribute columns can include any business-relevant data.
---
## Enrichment with Python
The enrichment layer transforms raw datasets into analysis-ready data. Enrichments can include:
- Built-in transformation operators
- Custom Python scripts for advanced logic
- Business rule calculations
- Data quality corrections
**Python Integration** allows you to:
- Write custom transformation logic
- Leverage Python data science libraries
- Create reusable transformation scripts
- Handle complex data manipulation scenarios
Enrichments run in the background and cache their results for fast access during analysis.
---
## Investigation and Analysis
The **Investigation** layer is where analysis happens. Within investigations, you:
- Apply investigation filters to focus on specific data subsets
- Create analysis notebooks with ordered blocks
- Generate insights through calculators
- Build visualizations
Analysis results are cached and can be refreshed when source data updates.
---
## Output and Integration
mindzieStudio provides multiple ways to export data and integrate with external systems:
### Actions
**Actions** are automated workflows that execute based on schedules or triggers. Actions can:
- Run Python scripts for custom processing
- Call external HTTP APIs
- Export data to external systems
- Chain multiple steps together
- Handle errors with fallback actions
Actions enable operational integration, where process insights trigger real-world responses.
### API Export
External systems can query mindzieStudio via API to:
- Retrieve analysis results programmatically
- Pull dashboard data into other applications
- Integrate process metrics into reporting systems
- Power operational dashboards in external tools
### CSV Export
For simple data export, you can download analysis results as CSV files. This is useful for:
- Sharing data with stakeholders who don't have mindzieStudio access
- Loading data into spreadsheet tools
- Creating backup copies of analysis results
---
## Data Flow Summary
The complete data flow through mindzieStudio:
1. **Input**: Data enters via Manual Upload, Data Designer, ETL tools, API, or Mulesoft
2. **Gateway**: The API validates, authenticates, and routes the data
3. **Storage**: Data is stored as compressed Datasets
4. **Transformation**: Enrichments (with optional Python) prepare the data
5. **Analysis**: Investigations and notebooks generate insights
6. **Output**: Results flow to Actions, API consumers, or CSV exports
This architecture supports both interactive analysis and automated operational workflows, making mindzieStudio suitable for both ad-hoc exploration and production process monitoring.
---
## Installation Guide
Section: On-Premise Server
URL: https://docs.mindziestudio.com/mindzie_studio/on-premise-server/installation-guide
Source: /docs-master/mindzieStudio/on-premise-server/installation-guide/page.md
# mindzieStudio On-Premise Installation Guide
## Overview
mindzieStudio's AI-Driven Process Mining and Automation platform offers a comprehensive and in-depth understanding of an organization's workflows within your organization, providing unparalleled visibility into processes, identifying bottlenecks, inefficiencies, and areas for optimization. By leveraging process mining tools, users can gain real-time insights, enabling them to streamline operations, improve compliance, and enhance overall efficiency. mindzieStudio empowers organizations to make data-driven decisions, optimize processes for maximum productivity, reduce operational costs, accelerate process execution, and ensure a seamless, standardized workflow across their enterprise.
### Key Benefits
- **Improve Process Times** - Optimize workflows for faster execution
- **Reduce Waste** - Identify and eliminate inefficiencies
- **Monitor and Ensure Compliance** - Maintain regulatory standards
---
## Installation Type
This guide covers both online and offline installations. Choose based on your environment:
| Installation Type | When to Use |
|-------------------|-------------|
| **Online** | Server has internet connectivity |
| **Offline** | Server has no internet access (air-gapped) |
For offline installations, all required files must be downloaded on a machine with internet access and transferred to the target server.
---
## Pre-Installation Checklist
Complete all items below BEFORE your scheduled installation. Print this page and check off each item.
### SSL Certificate
- [ ] SSL certificate obtained from IT/Security department
- [ ] Certificate file(s) ready for import into IIS
- [ ] Certificate matches the planned domain name
### DNS Configuration
- [ ] DNS entry created (e.g., `mindzie.[yourcompany].com`)
- [ ] DNS record points to the VM's IP address
- [ ] DNS propagation verified (can resolve the hostname)
### SQL Server (Choose One)
**Option A: Use Existing SQL Server**
- [ ] SQL Server instance identified and accessible from the VM
- [ ] Database administrator available who can:
- [ ] Create a new database called "mindzie"
- [ ] Create appropriate login with db_owner permissions (see Authentication Mode below)
- [ ] Provide connection credentials
- [ ] Authentication mode determined (see next section)
**Option B: Install SQL Server Express on the VM**
- [ ] SQL Server Express installer available (download if online, or transfer if offline)
- [ ] IT person available to install SQL Server Express
- [ ] Understood: SQL Express is free but lacks enterprise features (backup, mirroring)
- [ ] See [Install SQL Server Express](/mindzie_studio/on-premise-server/install-sql-server-express) guide
### SQL Server Authentication Mode
Choose one of the following authentication modes:
| Mode | Requirements | Best For |
|------|--------------|----------|
| **Mixed Mode** (SQL Server + Windows Auth) | SQL login with username/password | Simpler setup, services run as default account |
| **Windows Authentication Only** | Windows service account with SQL permissions | Environments requiring Windows-only auth |
**For Mixed Mode:**
- [ ] SQL Server has Mixed Mode authentication enabled
- [ ] SQL login credentials will be created (username/password)
**For Windows Authentication Only:**
- [ ] Windows service account identified or will be created
- [ ] Service account will have db_owner access to mindzie database
- [ ] Permission to configure Windows services to run under this account
### Virtual Machine
- [ ] Windows Server 2019 or later provisioned
- [ ] Meets minimum specs: 4+ cores, 8GB+ RAM, 100GB+ storage (see [Technical Requirements](/mindzie_studio/on-premise-server/technical-requirements))
- [ ] Administrator with full access available for:
- [ ] Installing software
- [ ] Configuring IIS
- [ ] Managing Windows services
- [ ] Internet connectivity available (for online installation only)
### Additional Items
- [ ] mindzieStudio license key received from mindzie
- [ ] Scheduled downtime window communicated to users (if applicable)
**Offline Installation Only**
If your server has no internet access, you will need to download files during Steps 3 and 4 below on a machine with internet, then transfer them to the target server (via USB drive, network share, etc.).
---
## Installation Steps
### Step 1: SQL Server Configuration
**Requirements:**
1. Permission to create databases on your SQL server
2. SQL Server Management Studio (recommended)
**Setup Process:**
1. Launch SQL Server Management Studio
2. Create the mindzie database with the **correct collation**
**IMPORTANT: Database Collation Requirement**
The mindzie database **must** be created with the collation `SQL_Latin1_General_CP1_CI_AS`. This collation is required for correct string comparisons throughout the application.
**Download the database creation script:**
Download create-mindzie-database.sql
**To use the script:**
1. Open SQL Server Management Studio
2. Connect to your SQL Server instance
3. Open the downloaded script file
4. Execute the script (F5)
The script will:
- Verify the database doesn't already exist
- Create the mindzie database with the correct collation
- Display confirmation of the collation setting
**Then choose based on your authentication mode:**
#### If Using Mixed Mode (SQL Server Authentication)
3. Ensure SQL Server has Mixed Mode authentication enabled
4. Create a SQL login called "mindzie"
5. Grant the "mindzie" login db_owner access to the "mindzie" database
#### If Using Windows Authentication Only
3. Identify or create a Windows service account (e.g., `DOMAIN\mindzieService`)
4. In SQL Server, create a login for this Windows account
5. Grant the Windows login db_owner access to the "mindzie" database
6. Note: You will configure the mindzie services to run under this account in Step 4
### Step 2: Internet Information Services (IIS)
**Configuration:**
1. Make sure the server has IIS enabled prior to installing .NET
2. If you already installed .NET then please repair the .NET install
3. Add "WebSocket Protocol" under Web Server -> Application Development

**Note:** Ensure IIS is properly configured before proceeding to the next step.
### Step 2a: Remove WebDAV
WebDAV must be removed from the server. This feature intercepts HTTP requests (PUT, DELETE, MOVE) before they reach mindzieStudio, causing API failures.
Open **PowerShell as Administrator** and run:
```powershell
Remove-WindowsFeature Web-DAV-Publishing
```
A server restart may be required. See [Disable WebDAV](/mindzie_studio/on-premise-server/disable-webdav) for full details.
### Step 3: .NET Runtime Installation
**Online Installation**
Download and install ASP.NET Core 8 Runtime Hosting Bundle:
Download ASP.NET Core 8 Runtime Hosting Bundle
Run the installer and follow the wizard to complete installation.
**Offline Installation**
Download the hosting bundle on a machine with internet access, then transfer to the server:
Download ASP.NET Core 8 Runtime Hosting Bundle
On the server:
1. Locate `dotnet-hosting-8.0.6-win.exe`
2. Run the installer as Administrator
3. Follow the installation wizard
4. Restart IIS after installation completes
### Step 4: Install mindzieStudio
**Online Installation**
Download mindzieStudio Enterprise Edition:
Download mindzieStudio Setup
Run the Installation:
- Execute `mindzieStudioSetup.exe`
- Accept the License Agreement
- Leave all screens as the defaults
**Offline Installation**
Download the following files on a machine with internet access, then transfer all three to the server:
1. Download mindzieStudio Setup2. Download mindzieStudio Update Package
On the server:
- Place all three files in the same directory
- Execute `mindzieStudioSetup.exe`
- Accept the License Agreement
- Leave all screens as the defaults
#### License Configuration (All Installations)
1. After installation, run the `EnterpriseConfiguration` app
2. Paste your license into the text box and click "Activate New License"
#### Database Configuration
1. Click the "Database Settings" button
2. Click "Change SQL Server"
3. Configure based on your authentication mode:
**If Using Mixed Mode (SQL Server Authentication):**
- Ensure the correct SQL Server name is entered
- Set Authentication to "SQL Server Authentication"
- Enter the SQL username and password
- Click "Update Database"
**If Using Windows Authentication Only:**
- Ensure the correct SQL Server name is entered
- Set Authentication to "Windows Authentication"
- Click "Update Database"
- **Important:** You must also configure the mindzie services to run under the Windows service account:
1. Open Windows Services (services.msc)
2. Locate the mindzie services
3. Right-click each service -> Properties -> Log On tab
4. Select "This account" and enter the service account credentials
5. Restart the services
### Step 4a: Install Python (Optional)
If you plan to use Python enrichments or Python Script actions, install Python now.
**When is Python Required?**
Python is only required if you want to use:
- **Python Enrichment** - Custom data transformations using Python scripts
- **Python Script Action** - Automated integrations, webhooks, database exports, notifications
If you do not plan to use these features, skip this step.
See [Install Python](/mindzie_studio/on-premise-server/install-python) for detailed installation instructions.
### Step 5: Configure SSL in IIS
**SSL Configuration:**
1. Configure SSL Certificate in Internet Information Services (IIS)
2. Add https binding using the SSL certificate from step 1
3. This should not be localhost for production installations
**Recommended DNS:**
- `mindziestudio.[companyname].com`
**Important Notes:**
- SSL configuration is required for production environments
- Ensure proper certificate management for security
---
## Updates
**Online Servers (Auto-Update)**
Servers with internet connectivity can use automatic updates. See [Auto Update](/mindzie_studio/on-premise-server/auto-update) for configuration details.
**Offline Servers (Manual Update)**
When updates are available for offline servers, download the latest files and run the setup again.
**Required Downloads for Update:**
1. Download mindzieStudio Setup2. Download mindzieStudio Update Package
**Update Process:**
1. Download all three files above on a machine with internet access
2. Transfer the files to the server
3. Place all three files in the same directory on the server
4. Run `mindzieStudioSetup.exe` - the setup will handle everything automatically
---
## Additional Configuration
### Upgrades
When upgrading your Enterprise server, note that you will need to re-add your certificate to the website in IIS.
### Licensing Updates
If you have upgraded your license, you will need to take the following steps for it to take effect:
1. Run the Enterprise Configuration tool and click refresh license
2. Restart the mindzie website in IIS
### LLM AI Integration
To utilize an on-premise LLM for mindzie's AI copilot and other features, please contact support@mindzie.com for details.
---
## Support
Need help with your installation? Contact us:
**Email:** support@mindzie.com
Our support team is here to help with any installation or configuration questions.
---
*For technical specifications and requirements, see the [Technical Requirements](/mindzie_studio/on-premise-server/technical-requirements) page.*
---
## Install SQL Server Express
Section: On-Premise Server
URL: https://docs.mindziestudio.com/mindzie_studio/on-premise-server/install-sql-server-express
Source: /docs-master/mindzieStudio/on-premise-server/install-sql-server-express/page.md
# Install SQL Server Express
This guide explains how to install SQL Server Express for use with the mindzie Studio Enterprise Server. SQL Server Express is a free edition of Microsoft SQL Server that provides all the database functionality needed for the mindzie on-premise server.
## Prerequisites
- Windows Server or Windows 10/11
- Administrator access to the machine
- Internet connection to download SQL Server Express
- At least 6 GB of free disk space
## Step 1: Download SQL Server Express
1. Navigate to the [Microsoft SQL Server Downloads page](https://www.microsoft.com/en-us/sql-server/sql-server-downloads)
2. Locate **SQL Server Express** in the download options
3. Click **Download now** to download the installer

## Step 2: Select Custom Installation
When the installer launches, you will see three installation options:
- **Basic** - Quick install with default settings
- **Custom** - Full control over installation options
- **Download Media** - Download files for later installation
**Important:** Select **Custom** installation. This allows you to configure the instance name and authentication mode required for mindzie Studio.

The installer will download the required files. This may take several minutes depending on your internet connection.
## Step 3: Start New Installation
Once the download completes, the SQL Server Installation Center opens.
1. Click **Installation** in the left panel
2. Select **New SQL Server standalone installation or add features to an existing installation**

## Step 4: Accept License Terms
1. Review the license terms
2. Check the box **I accept the license terms and Privacy Statement**
3. Click **Next**

The installer will perform prerequisite checks. You may see a warning about Windows Firewall - this is not a problem for local installations since mindzie Studio will connect to the database locally.
## Step 5: Skip Azure Extension
The Azure Extension for SQL Server is not required for mindzie Studio.
1. **Uncheck** the Azure Extension for SQL Server option
2. Click **Next**

## Step 6: Select Features
For mindzie Studio, you only need the Database Engine Services.
1. Under **Instance Features**, check **Database Engine Services**
2. You can leave other options unchecked
3. Click **Next**

## Step 7: Configure Instance Name
Configure the SQL Server instance name:
1. Select **Named instance**
2. Enter **SQLEXPRESS** as the instance name
3. The Instance ID will automatically populate
4. Click **Next**

**Note:** If you already have an instance named SQLEXPRESS, you can either:
- Use the existing instance
- Choose a different name (e.g., SQLEXPRESS2)
## Step 8: Server Configuration
Leave the Server Configuration settings at their defaults:
1. Review the service accounts (default values are acceptable)
2. Ensure SQL Server Database Engine is set to **Automatic** startup
3. Click **Next**

## Step 9: Configure Authentication
This is the most important step for mindzie Studio connectivity.
1. Select **Mixed Mode (SQL Server authentication and Windows authentication)**
2. Enter a strong password for the **sa** (system administrator) account
3. Confirm the password
4. Click **Next**
**Important:** Remember this password - you will need it when configuring the mindzie Studio server connection.
## Step 10: Complete Installation
1. Review the installation summary
2. Click **Install** to begin the installation
3. Wait for the installation to complete
4. Click **Close** when finished
## Verify Installation
After installation completes:
1. Open **SQL Server Management Studio** (SSMS) or use **sqlcmd**
2. Connect using:
- Server name: `localhost\SQLEXPRESS` (or your custom instance name)
- Authentication: SQL Server Authentication
- Login: `sa`
- Password: The password you configured
## Configure mindzie Studio Connection
When configuring the mindzie Studio Enterprise Server, use these connection details:
| Setting | Value |
|---------|-------|
| Server | `localhost\SQLEXPRESS` |
| Authentication | SQL Server Authentication |
| Username | `sa` |
| Password | Your configured password |
| Database | (mindzie will create this) |
## Version Compatibility
This installation process works with:
- SQL Server 2019 Express
- SQL Server 2022 Express
- SQL Server 2025 Express
All versions provide the features required by mindzie Studio.
## Troubleshooting
### Cannot connect to SQL Server
- Verify the SQL Server service is running (check Windows Services)
- Confirm you are using the correct instance name
- Ensure Mixed Mode authentication is enabled
### Forgot sa password
- You will need to reinstall SQL Server Express or use Windows Authentication to reset the password
### Windows Firewall warning during installation
- This warning can be ignored for local installations
- If accessing SQL Server from other machines, configure appropriate firewall rules
## Support
For assistance with SQL Server Express installation for mindzie Studio, contact mindzie support.
---
## Technical Requirements
Section: On-Premise Server
URL: https://docs.mindziestudio.com/mindzie_studio/on-premise-server/technical-requirements
Source: /docs-master/mindzieStudio/on-premise-server/technical-requirements/page.md
# Technical Requirements
## Server Specifications
### Minimum Requirements
#### Operating System
- Windows Server 2016 or later
- Windows 10/11 (for development/testing only)
#### Hardware Requirements
- **CPU:** 4 cores minimum, 8+ cores recommended
- **RAM:** 8 GB minimum, 16 GB+ recommended
- **Storage:** 100 GB available disk space minimum
- **Network:** Stable internet connection for downloads and updates
### Recommended Production Specifications
#### Hardware
- **CPU:** 8+ cores (Intel Xeon or AMD EPYC)
- **RAM:** 32 GB or more
- **Storage:** 500 GB+ SSD storage
- **Network:** Dedicated network connection with adequate bandwidth
#### Performance Considerations
- SSD storage recommended for optimal database performance
- Additional RAM improves processing of large datasets
- Multiple CPU cores enhance concurrent user support
## Software Requirements
### Database Requirements
- **SQL Server 2016 or later** (SQL Server 2019+ recommended)
- Mixed Mode Authentication enabled
- Database creation permissions required
- SQL Server Management Studio (SSMS) for configuration
### Web Server Requirements
- **Internet Information Services (IIS) 10.0+**
- ASP.NET Core 8 Runtime Hosting Bundle
- WebSocket Protocol support enabled
- **WebDAV Publishing must be removed** - see [Disable WebDAV](/mindzie_studio/on-premise-server/disable-webdav)
- SSL certificate for production deployments
### .NET Framework
- **ASP.NET Core 8 Runtime**
- Hosting Bundle required for IIS integration
- Download from Microsoft's official .NET download page
### Python (Optional)
- **Python 3.11 or later** (required for Python enrichments and Python Script actions)
- pip package manager
- Required packages: pandas, numpy, requests
- See [Install Python](/mindzie_studio/on-premise-server/install-python) guide for detailed installation instructions
## Network and Security Requirements
### Firewall Configuration
- **HTTP Port 80** (for initial setup and redirection)
- **HTTPS Port 443** (for secure production access)
- **SQL Server Port 1433** (default, or custom port as configured)
### SSL Certificate Requirements
- Valid SSL certificate from trusted Certificate Authority
- Wildcard or SAN certificate for multiple subdomains
- Certificate must be installed and configured in IIS
### Domain Configuration
- Dedicated subdomain recommended: `mindziestudio.[company].com`
- DNS A record pointing to server IP address
- Avoid localhost or IP-based access for production
## Browser Compatibility
### Supported Browsers
- **Chrome 90+** (Recommended)
- **Edge 90+**
### Browser Requirements
- JavaScript enabled
- WebSocket support
- Local storage enabled
- Cookies enabled
## Additional Considerations
### Backup Requirements
- Regular database backups recommended
- Configuration backup for rapid disaster recovery
- License key backup and documentation
### Monitoring and Maintenance
- Windows Update management
- SQL Server maintenance plans
- IIS log monitoring
- Application performance monitoring
### Scalability Planning
- Load balancer configuration for high availability
- Database clustering for enterprise deployments
- CDN integration for global performance
## Security Recommendations
### Access Control
- Role-based access control (RBAC) implementation
- Strong password policies
- Multi-factor authentication where possible
### Data Protection
- Encryption at rest for sensitive data
- Secure transmission protocols (HTTPS/TLS)
- Regular security updates and patches
### Compliance Considerations
- GDPR compliance for EU data
- SOX compliance for financial data
- Industry-specific regulatory requirements
## Support and Updates
### Update Management
- Regular application updates through mindzie portal
- SQL Server patch management
- Windows Server update coordination
### Support Requirements
- Administrative access for mindzie support team
- Remote desktop capability for troubleshooting
- Log file access for diagnostic purposes
---
For detailed installation instructions, see the [Installation Guide](../installation-guide) page.
---
## Auto Update
Section: On-Premise Server
URL: https://docs.mindziestudio.com/mindzie_studio/on-premise-server/auto-update
Source: /docs-master/mindzieStudio/on-premise-server/auto-update/page.md
# Auto Update
mindzieStudio includes a built-in auto-update feature that allows server administrators to upgrade the server directly from the application interface without requiring direct server access.
## Overview
When a new version of mindzieStudio is available, server administrators will see a notification in the application menu. This feature enables seamless upgrades without needing IT support to access the server directly.
## Who Can Use Auto Update
The auto-update feature is only visible to users with the **Server Administrator** role. Other roles such as Analysts and Developers will not see the update notification or have access to this feature.
## How Auto Update Works
### Step 1: Check for Update Notification
When logged into mindzieStudio, click on your username in the top-right corner to open the user menu dropdown. If a new update is available, you will see a **New Update Available** option at the bottom of the menu that blinks to draw your attention.

### Step 2: Access the Update Screen
Click on the **New Update Available** menu item to open the update screen. This screen displays:
- **New Version**: The version number available for download
- **Current Version**: The version currently installed on your server
- **View Release Notes**: Link to see what's new in the update
- **Start Upgrade**: Button to begin the upgrade process

### Step 3: Confirm the Upgrade
When you click **Start Upgrade**, you will see a confirmation dialog warning that the server will go offline during the update process.

The dialog displays:
- The estimated downtime (up to 20 minutes)
- The target version number
- **Cancel** button to abort the upgrade
- **Update** button to proceed
### Step 4: Update Process
After confirming, the system will:
1. Take the server offline
2. Download the new version
3. Replace all server-side components (DLLs)
4. Restart the website
5. Bring the server back online
The update process typically takes 5-10 minutes but may take up to 20 minutes depending on your server and network speed.
## Important Considerations
### No Server Access Required
You do not need direct access to the server to perform this update. The entire process happens through the mindzieStudio web interface.
### IT Notification
While IT support is not required to perform the update, it is recommended to:
- Notify your IT team before starting an update
- Have IT support available in case issues occur
- Schedule updates during low-usage periods
### Success Rate
The auto-update feature has a very high success rate (99%+ of cases complete without issues). However, if the update fails or the server goes offline unexpectedly, you may need to use the [Force Update](../force-update) feature which requires direct server access.
## Troubleshooting
### Update Not Appearing
If you do not see the update notification:
- Verify you have the **Server Administrator** role
- Check that your server has internet connectivity
- Contact support if the issue persists
### Update Failed Mid-Process
If the update fails partway through:
1. Wait 10-15 minutes for the server to recover automatically
2. If the server does not come back online, use the [Force Update](../force-update) procedure
3. Contact support@mindzie.com if you need assistance
## Related Documentation
- [Force Update](../force-update) - Manual update procedure requiring server access
- [Installation Guide](../installation-guide) - Initial server setup instructions
- [Technical Requirements](../technical-requirements) - Server specifications
## Support
If you encounter issues with the auto-update feature:
- Email: support@mindzie.com
---
## Force Update
Section: On-Premise Server
URL: https://docs.mindziestudio.com/mindzie_studio/on-premise-server/force-update
Source: /docs-master/mindzieStudio/on-premise-server/force-update/page.md
# Force Update mindzieStudio Server
This guide explains how to force an update of your mindzieStudio server installation when you need to reinstall even if the versions match.
## When to Use Force Update
Use the Force Update option when:
- The normal update process is not working correctly
- You need to reinstall components even if the version appears current
- You want to ensure all files are refreshed regardless of version numbers
- Troubleshooting installation or configuration issues
- The server is not responding correctly after a standard update
## Prerequisites
Before starting the force update process:
- Administrative access to the server
- Network access to download the latest version (or offline installation files)
- Scheduled downtime window (the server will be temporarily offline during the update)
## Force Update Process
### Step 1: Download mindzieStudio Setup
**Offline Installation**
If your server has no internet access, download the following files on a machine with internet access, then transfer all three to the server:
1. Download mindzieStudio Setup2. Download mindzieStudio Update Package
Place all three files in the same directory before running the setup.
### Step 2: Run Setup and Enable Force Update
1. Run `mindzieStudioSetup.exe`
2. The setup will display your current installation details:
- Website Directory
- Service Directory
- Installed Version
- Available Version
3. **Check the "Force update (reinstall even if versions match)" checkbox**
4. Click **Next >** to continue

### Step 3: Wait for File Copy
The setup will download (if online) and copy the files to your server. Wait for this process to complete.

### Step 4: Configuration
The configuration screen allows you to change settings if needed:
- **Website Binding**: Change the IIS binding if required
- **Service Identity**: Change the account used for IIS App Pool and Windows Service
For a force update where you are not changing any configuration, simply click **Next >** to continue.

### Step 5: Complete the Installation
Once the installation completes:
1. Verify that both **IIS Site** and **Windows Service** show as "Running"
2. If you do not need to make configuration changes, **uncheck "Launch Enterprise Configuration"**
3. Click **Finish**

## Verify the Update
After the update completes:
1. Open a web browser and navigate to your mindzieStudio URL
2. Verify the application loads correctly
3. Check the version number in the application to confirm the update
## Troubleshooting
### Server Not Responding After Update
If the server is not accessible after the update:
1. Check that the mindzieStudioService is running:
- Open Services (services.msc)
- Locate "mindzieStudioService"
- Verify it is running, if not, start the service
2. Check the IIS application pool is running:
- Open IIS Manager
- Navigate to Application Pools
- Verify the mindzieStudio pool is started
3. Click **View Log** on the completion screen to review any errors
### Browser Shows Cached Old Version
If the browser shows an old version after successful update:
- Clear your browser cache (Ctrl+Shift+Delete)
- Hard refresh the page (Ctrl+F5)
- Try accessing from a different browser or incognito/private window
## Support
If you encounter issues with the force update process:
- Email: support@mindzie.com
- Include the installation log (click **View Log** on the completion screen)
- Provide your current and target version numbers
---
## Backup Strategy
Section: On-Premise Server
URL: https://docs.mindziestudio.com/mindzie_studio/on-premise-server/backup-strategy
Source: /docs-master/mindzieStudio/on-premise-server/backup-strategy/page.md
# Backup Strategy
A proper backup strategy is essential for protecting your mindzieStudio data and ensuring business continuity. This guide explains the two critical components that need to be backed up and how to configure your backup procedures.
## Overview
mindzieStudio stores data in two separate locations that both require regular backups:
1. **Storage Location** - File-based storage containing encrypted event logs and enriched data
2. **SQL Server Database** - The MINDZIE database containing configuration, metadata, and analysis results
Both components must be backed up to ensure complete data recovery in case of hardware failure, data corruption, or disaster scenarios.
## Configuration Application
The mindzieStudio Configuration application is installed on the server and provides access to important settings including your storage location and database configuration. You can use this application to verify your current settings before implementing your backup strategy.

The Configuration application displays:
- **License** - Your license status, type, and maximum cases allowed
- **Database** - SQL Server connection details, status, and version
- **Storage** - Storage type and file location path
- **mindzie Server** - Email server settings and error log access
## Component 1: Storage Location Backup
### What is Stored
The storage location contains all uploaded event logs and calculated/enriched data in encrypted format. This is the primary data store for all process mining datasets analyzed in mindzieStudio.
### Default Location
The default storage path is:
```
C:\ProgramData\mindzie\mindzieStudioStorage
```
You can verify your actual storage location in the Configuration application under the **Storage** section.
### Backup Recommendations
- **Frequency**: Daily backups recommended, or more frequently based on data change volume
- **Method**: Use any standard Windows backup technology:
- Windows Server Backup
- Third-party backup solutions (Veeam, Acronis, etc.)
- File replication to network storage
- Cloud backup services
- **Retention**: Maintain multiple backup versions based on your organization's data retention policy
### Important Considerations
- Ensure the backup process captures all files in the storage directory
- Consider scheduling backups during off-peak hours to minimize performance impact
- Test restore procedures periodically to verify backup integrity
- If you relocate the storage directory, update your backup configuration accordingly
## Component 2: SQL Server Database Backup
### Database Details
The mindzieStudio database contains:
- User accounts and permissions
- Project configurations and settings
- Dashboard definitions
- Analysis metadata and results
- Audit logs and system configuration
### Database Information
- **Server**: As configured during installation (e.g., localhost or dedicated SQL Server)
- **Database Name**: MINDZIE
You can verify your database connection details in the Configuration application under the **Database** section.
### Backup Recommendations
- **Frequency**: Daily full backups with transaction log backups throughout the day
- **Method**: Use standard SQL Server backup procedures:
- SQL Server Management Studio (SSMS)
- SQL Server Agent scheduled jobs
- Maintenance plans
- Third-party SQL backup tools
- Log shipping for high availability
### SQL Server Backup Options
Your organization may already have SQL Server backup procedures in place. Common approaches include:
1. **Full Database Backups** - Complete backup of the entire database
2. **Differential Backups** - Backup of changes since the last full backup
3. **Transaction Log Backups** - Backup of transaction logs for point-in-time recovery
4. **Log Shipping** - Automated backup and restore to a secondary server
### Example Backup Script
```sql
-- Full database backup
BACKUP DATABASE [MINDZIE]
TO DISK = 'D:\Backups\MINDZIE_Full.bak'
WITH FORMAT, COMPRESSION, STATS = 10;
-- Transaction log backup
BACKUP LOG [MINDZIE]
TO DISK = 'D:\Backups\MINDZIE_Log.trn'
WITH FORMAT, COMPRESSION, STATS = 10;
```
## Recovery Planning
### Testing Your Backups
Regularly test your backup and restore procedures to ensure:
- Backup files are complete and not corrupted
- Restore procedures are documented and understood
- Recovery time meets your organization's requirements
- All data can be successfully recovered
### Disaster Recovery Checklist
1. Document your current storage location and database server details
2. Maintain off-site copies of critical backups
3. Document the restore procedure for both storage files and database
4. Test recovery procedures at least quarterly
5. Keep a copy of the mindzieStudio installer for server rebuilds
## Best Practices
1. **Coordinate Backups** - Schedule storage and database backups to run at similar times to ensure data consistency
2. **Monitor Backup Jobs** - Set up alerts for backup failures
3. **Secure Backup Files** - Encrypt backup files and restrict access
4. **Document Everything** - Maintain written procedures for backup and restore operations
5. **Offsite Storage** - Keep copies of backups in a separate physical location or cloud storage
## Support
If you need assistance configuring your backup strategy or have questions about data recovery:
- Email: support@mindzie.com
- Contact your IT department for organization-specific backup policies
- Refer to Microsoft SQL Server documentation for advanced database backup configurations
---
## Disable WebDAV
Section: On-Premise Server
URL: https://docs.mindziestudio.com/mindzie_studio/on-premise-server/disable-webdav
Source: /docs-master/mindzieStudio/on-premise-server/disable-webdav/page.md
# Disable WebDAV
## Why WebDAV Must Be Removed
WebDAV is a Windows Server feature that intercepts HTTP requests (PUT, DELETE, MOVE) before they reach mindzieStudio's API endpoints. When WebDAV is enabled, API requests fail or behave unexpectedly because WebDAV handles them instead of passing them through to the application.
**WebDAV must be removed from any server running mindzieStudio.** This is not a configuration change - the feature must be fully uninstalled.
---
## Check If WebDAV Is Installed
Open **PowerShell as Administrator** and run:
```powershell
Get-WindowsFeature Web-DAV-Publishing
```
If the **Install State** shows `Installed`, it must be removed.
---
## Remove WebDAV
Run the following command in **PowerShell as Administrator**:
```powershell
Remove-WindowsFeature Web-DAV-Publishing
```
A server restart may be required after removal.
---
## FTP Server (Recommended Removal)
FTP Server is a separate Windows feature that is not required by mindzieStudio. While it does not cause the same issues as WebDAV, we recommend removing it if it is installed:
```powershell
Remove-WindowsFeature Web-Ftp-Server
```
---
## Verification
After removing WebDAV and restarting the server, verify the feature is no longer installed:
```powershell
Get-WindowsFeature Web-DAV-Publishing
```
The **Install State** should show `Available` (not `Installed`).
---
## Support
If you need assistance, contact us at **support@mindzie.com**.
---
## Scheduled Restart
Section: On-Premise Server
URL: https://docs.mindziestudio.com/mindzie_studio/on-premise-server/scheduled-restart
Source: /docs-master/mindzieStudio/on-premise-server/scheduled-restart/page.md
# Scheduled Restart
## Why Schedule a Nightly Restart
Long-running application pools can accumulate memory, hold stale database connections, and retain cached state that may slow the server down over time. Restarting the mindzieStudio application pool once a day during off-hours clears these issues and ensures the server starts each business day in a clean, predictable state.
We recommend configuring IIS to **recycle the mindzieStudio application pool every night at a time when no users are active** (typically between 02:00 and 05:00 local time). Because IIS handles this automatically, no scripts or scheduled tasks are required.
Recycling is graceful:
- Active requests are allowed to finish on the old worker process.
- A new worker process starts to handle new requests.
- There is no visible downtime for users who connect after the recycle completes.
---
## Configure the Recycle Time in IIS
Follow these steps on the server hosting mindzieStudio.
### Step 1: Open IIS Manager
1. Press **Windows Key + R**, type `inetmgr`, and press **Enter**.
2. In the **Connections** pane on the left, expand the server node and select **Application Pools**.
### Step 2: Open Advanced Settings for the mindziestudio Pool
1. In the **Application Pools** list, locate and select **mindziestudio**.
2. In the **Actions** pane on the right, click **Advanced Settings...**.
### Step 3: Configure Specific Recycle Times
1. In the **Advanced Settings** dialog, scroll down to the **Recycling** section.
2. Find the **Specific Times** property and click the **...** button next to `TimeSpan[] Array`.
3. In the **TimeSpan Collection Editor**, click **Add** to create a new entry.
4. Set the **Value** to the time you want the pool to recycle, using 24-hour format:
- `04:00:00` = 4:00 AM
- `02:30:00` = 2:30 AM
- `23:00:00` = 11:00 PM
5. Click **OK** to close the TimeSpan Collection Editor.
6. Click **OK** to close the Advanced Settings dialog.

The screenshot above shows the mindziestudio application pool configured to recycle at **04:00:00** (4:00 AM) each day.
---
## Recommended Settings
| Setting | Recommended Value | Notes |
|---------|-------------------|-------|
| Specific Times | `04:00:00` | Choose a time when no users are active |
| Regular Time Interval | `0` | Disable fixed-interval recycling to avoid mid-day restarts |
| Disable Overlapped Recycle | `False` | Allow graceful handoff between worker processes |
Setting **Regular Time Interval** to `0` ensures the pool only recycles at the specific time you configured, rather than every 29 hours (the IIS default).
---
## Support
If you need assistance configuring scheduled restarts, contact us at **support@mindzie.com**.
---
## Overview
Section: mindzie Desktop 26
URL: https://docs.mindziestudio.com/mindzie_studio/desktop/overview
Source: /docs-master/mindzieStudio/desktop/overview/page.md
## Overview
mindzie Desktop is a completely standalone version of mindzieStudio that runs entirely on your local machine. It requires only Windows 10 or later - no database, no server infrastructure, and no additional software dependencies.
### Full Feature Compatibility
mindzie Desktop includes all the features available in the Enterprise and SaaS versions of mindzieStudio. Projects you create in Desktop are fully compatible and can be moved to an Enterprise or SaaS installation at any time.
### Single-User System
Desktop is designed for individual use on a single machine. There is no user login or password - the application is ready to use as soon as you launch it. This makes it ideal for personal process analysis work without the overhead of user management.
### Getting Started
See the [Installation Guide](/mindzie_studio/desktop/installation-guide) to download and install mindzie Desktop.

---
## Installation Guide
Section: mindzie Desktop 26
URL: https://docs.mindziestudio.com/mindzie_studio/desktop/installation-guide
Source: /docs-master/mindzieStudio/desktop/installation-guide/page.md
## Installation Guide
### Requirements
- Windows 10 or later
### No Administrator Rights Required
mindzie Desktop uses a per-user installation, which means you do not need administrator privileges to install or run the application. Any user on the machine can install mindzie Desktop to their own profile without IT assistance.
---
## Installation
### Download
Download the installer:
Download mindzieDesktopSetup.exe
### Installation Steps
1. Run `mindzieDesktopSetup.exe`
2. Accept the License Agreement
3. Follow the installation wizard to complete
### License Key
You will need a license key to activate mindzie Desktop. Contact the mindzie support department to obtain your license key.
---
## Updates
**Automatic Updates**
mindzie Desktop checks for updates automatically when connected to the internet. When an update is available, you will be prompted to install it.
**Manual Updates (Offline)**
If your computer does not have internet access or you need to update manually, download the following files on a machine with internet access, then transfer them:
1. Download mindzieStudio Desktop Update Package
**Update Process:**
1. Download both files above
2. Place both files in the same directory as the setup executable
3. Run `mindzieDesktopSetup.exe` - the setup will detect the update files and apply them
---
## Support
Need help with your installation? Contact us:
**Email:** support@mindzie.com
---
## Desktop Features
Section: mindzie Desktop 26
URL: https://docs.mindziestudio.com/mindzie_studio/desktop/features
Source: /docs-master/mindzieStudio/desktop/features/page.md
## Desktop Features
The mindzieStudioDesktop menu provides access to features specific to the Desktop version.

### License
Manage your Desktop license from this dialog. Enter your license key and click **Activate New License** to activate. For computers without internet access, use the **Activate Offline** option.
Once activated, the dialog shows your license status, validity date, and the maximum number of cases allowed in your event logs.
Use **Refresh License** to update your license information after renewal.

### Application Information
View details about your Desktop installation including:
- **Version** - The current application version
- **Vault Name** - The storage vault identifier
- **Application Path** - Where the application is installed
- **Database** - Location of the local database file
The **Log Files** section shows the location of application and web server logs. Use the **Open Folder** buttons to access these locations directly for troubleshooting.
Click **Report Information** to generate a diagnostic report for support.

### Check for Updates
Check if a newer version of mindzie Desktop is available for download.
### Uninstall
Remove mindzie Desktop from your computer. This opens the standard Windows uninstall process.
---
## Sending Logs
Section: mindzie Desktop 26
URL: https://docs.mindziestudio.com/mindzie_studio/desktop/sending-logs
Source: /docs-master/mindzieStudio/desktop/sending-logs/page.md
## Sending Logs to mindzie
If you experience any issues or errors with mindzie Desktop, you can send your web server logs to the mindzie support team for troubleshooting. Follow these steps to locate and send the log files.
### Step 1: Open the Desktop Menu
Click the **menu icon** in the top left corner of the application.

### Step 2: Open Application Information
Click **Application Information** from the menu.

### Step 3: Open the Web Server Logs Folder
In the Application Information dialog, find the **Web Server Logs** section at the bottom. Click the **Open Folder** button next to it.
This opens the folder where mindzie Desktop stores its web server log files.

### Step 4: Send the Latest Log File
In the folder that opens, locate the most recent **.txt** file. The log files are named with the date in the format `weblog-YYYYMMDD.txt` (for example, `weblog-20260324.txt`).
Send the latest .txt file to **support@mindzie.com** along with a description of the issue you are experiencing.
### Tips
- The folder also contains **.json** files with the same date-based naming. You typically only need to send the **.txt** files unless mindzie support requests the JSON files as well.
- If the issue occurred on a specific date, send the log file matching that date.
- Include details about what you were doing when the error occurred to help the support team diagnose the issue faster.
---
## Active Directory
Section: Tenant Settings
URL: https://docs.mindziestudio.com/mindzie_studio/tenant-settings/active-directory
Source: /docs-master/mindzieStudio/tenant-settings/active-directory/page.md
# Active Directory Integration
## Overview
Azure Active Directory (Azure AD) enables organizations to use their existing Microsoft identity infrastructure to authenticate users in mindzie Studio. This eliminates the need for separate passwords and allows centralized user management through your organization's Azure portal.
## What is Azure Active Directory?
Azure AD is Microsoft's cloud-based identity and access management service. Organizations use it to manage user accounts, control application access, and enforce security policies across their enterprise applications.
## Integration with mindzie Studio
mindzie Studio Enterprise Server supports Azure AD authentication through OAuth 2.0. Once configured, users log in with their organizational Microsoft accounts instead of maintaining separate mindzie Studio credentials.
## Available Documentation
This section contains step-by-step guides for implementing Azure AD authentication:
### [Azure AD App Registration](azure-ad-app-registration/page.md)
Register your mindzie Studio application in the Azure portal to obtain the required configuration values (Tenant ID, Application ID, and Client Secret).
### [Setup Guide](setup-guide/page.md)
Configure mindzie Studio to use Azure AD authentication by entering your app registration details into the Authentication Configuration screen.
## Requirements
- mindzie Studio Enterprise Server edition
- Azure Active Directory tenant
- Administrative access to Azure portal
- Administrative access to mindzie Studio
## Getting Started
1. First, complete the [Azure AD App Registration](azure-ad-app-registration/page.md) in your Azure portal
2. Then follow the [Setup Guide](setup-guide/page.md) to configure mindzie Studio
3. Test the configuration with a user account
Once configured, users can immediately start using their Microsoft accounts to access mindzie Studio.
---
## Overview
Section: Administration
URL: https://docs.mindziestudio.com/mindzie_studio/administration/overview
Source: /docs-master/mindzieStudio/administration/overview/page.md
# Administration
## Overview
The Administration section provides comprehensive guidance for managing mindzie Studio at the organizational level. This includes tenant configuration, user management, service accounts, and system-wide settings.
## Who Should Use This Section
This documentation is intended for:
- **IT Administrators** - Managing technical configurations and integrations
- **Tenant Administrators** - Configuring tenant-specific settings and users
- **System Administrators** - Overseeing multi-tenant deployments
## Administrative Functions
### [Tenant Management](tenant-management/page.md)
Configure and manage tenants including:
- Creating new tenants
- Configuring tenant settings
- Setting up authentication methods
- Managing tenant-level permissions
### [User Management](user-management/page.md)
Administer users and their access including:
- Managing user accounts and roles
- Configuring service accounts for cross-tenant access
- Setting user permissions and access controls
- Monitoring user activity and access
## Quick Links
### Essential Tasks
- [Create a New Tenant](tenant-management/create-tenant/page.md)
- [Promote User to Service Account](user-management/service-accounts/promote-user-to-service-account/page.md)
- [Configure Authentication](tenant-management/authentication-setup/page.md)
- [Understanding User Roles](user-management/user-roles/page.md)
### Service Account Management
- [What Are Service Accounts?](user-management/service-accounts/what-are-service-accounts/page.md)
- [Managing Service Accounts](user-management/service-accounts/manage-service-accounts/page.md)
## Security Considerations
Administrative functions require appropriate role assignments:
- **Server Administrator** role (shown as `TenantAdmin` in the role dropdown) for cross-tenant and server-wide operations
- **Administrator** role for tenant-level operations
- **IT Admin** role for technical configurations and integrations
Always follow your organization's security policies when performing administrative tasks.
## Getting Started
1. **Verify Your Role** - Ensure you have the appropriate administrative permissions
2. **Review Security Policies** - Understand your organization's requirements
3. **Plan Changes** - Document and plan administrative changes before implementation
4. **Test in Non-Production** - When possible, test changes in a non-production environment first
## Additional Resources
- [Active Directory Integration](../tenant-settings/active-directory/page.md)
- [On-Premise Server Administration](../on-premise-server/page.md)
- [Security Best Practices](#) *(Coming Soon)*
---
## Tenant Management
Section: Administration
URL: https://docs.mindziestudio.com/mindzie_studio/administration/tenant-management
Source: /docs-master/mindzieStudio/administration/tenant-management/page.md
# Tenant Management
## Overview
Tenant management enables organizations to create and configure separate, isolated environments within mindzie Studio. Each tenant represents an independent organizational unit with its own users, data, and configurations.
## What is a Tenant?
A tenant is a dedicated instance within mindzie Studio that provides:
- **Data Isolation** - Complete separation of data between tenants
- **User Management** - Independent user accounts and permissions
- **Custom Configuration** - Tenant-specific settings and preferences
- **Security Boundaries** - Isolated security contexts
## Tenant Management Tasks
### [Create a New Tenant](create-tenant/page.md)
Step-by-step guide for creating new organizational tenants.
### [Tenant Configuration](tenant-configuration/page.md)
Configure tenant-specific settings including:
- Display name and branding
- Default permissions
- Data retention policies
- Integration settings
### [Authentication Setup](authentication-setup/page.md)
Configure how users authenticate to your tenant:
- Standard identity authentication
- Azure Active Directory integration
- Multi-factor authentication settings
## Multi-Tenant Scenarios
### Enterprise Deployments
Large organizations often use multiple tenants for:
- **Department Separation** - Different business units
- **Geographic Regions** - Compliance with local regulations
- **Development/Production** - Separate environments for testing
### Service Provider Model
Managed service providers use tenants for:
- **Client Isolation** - Each customer gets their own tenant
- **Service Accounts** - Cross-tenant access for support staff
- **Centralized Management** - Oversight across multiple clients
## Tenant Administration Requirements
### Required Roles
- **Server Administrator** (shown as `TenantAdmin` in the role dropdown) - Can create new tenants, manage all tenants, and access the Server Administration menu
- **Administrator** - Can manage users, projects, and content within a single tenant; cannot create tenants
- **IT Admin** - Can configure technical settings, integrations, and global API keys
### Key Responsibilities
1. **Initial Setup** - Configure tenant during creation
2. **User Onboarding** - Add and configure initial users
3. **Security Configuration** - Set authentication and access policies
4. **Ongoing Maintenance** - Monitor usage and adjust settings
## Best Practices
### Tenant Naming
- Use clear, descriptive names
- Include organizational unit or purpose
- Avoid special characters that might cause issues
- Consider a naming convention for consistency
### Security Configuration
- Enable appropriate authentication methods
- Configure session timeouts
- Set password policies (if using identity authentication)
- Review and audit permissions regularly
### Data Management
- Plan data retention policies upfront
- Configure backup strategies
- Document data ownership and access
- Implement appropriate compliance measures
## Common Scenarios
### Single Tenant Setup
Most organizations start with a single tenant:
1. Create primary tenant during initial setup
2. Configure authentication method
3. Add users and assign roles
4. Begin using mindzie Studio
### Multi-Tenant Setup
Larger organizations may require multiple tenants:
1. Plan tenant structure based on organizational needs
2. Create tenants for each unit/region/purpose
3. Configure service accounts for cross-tenant access
4. Implement governance policies
## Troubleshooting
### Common Issues
- **Cannot Create Tenant** - Verify you have the Server Administrator role (shown as `TenantAdmin` in the role dropdown)
- **Authentication Not Working** - Check authentication configuration
- **Users Cannot Access** - Verify user permissions and tenant assignment
- **Data Not Visible** - Confirm correct tenant selection
## Related Topics
- [User Management](../user-management/page.md)
- [Service Accounts](../user-management/service-accounts/page.md)
- [Active Directory Integration](../../tenant-settings/active-directory/page.md)
## Next Steps
1. [Create Your First Tenant](create-tenant/page.md)
2. [Configure Authentication](authentication-setup/page.md)
3. [Add Users to Tenant](../user-management/page.md)
---
## User Management
Section: Administration
URL: https://docs.mindziestudio.com/mindzie_studio/administration/user-management
Source: /docs-master/mindzieStudio/administration/user-management/page.md
# User Management
## Overview
User management in mindzie Studio enables administrators to control who can access the system, what they can do, and how they authenticate. This section covers user creation, role assignment, permissions, and the special service account feature for cross-tenant access.
## User Management Functions
### Core User Operations
- **Create Users** - Add new users to your tenant
- **Assign Roles** - Grant appropriate permissions through role assignment
- **Manage Permissions** - Control access to specific features and data
- **Deactivate Users** - Remove access while preserving audit history
### Advanced Features
- **[Service Accounts](/mindzie_studio/administration/service-accounts)** - Enable cross-tenant access for consultants and support staff
- **[User Roles](/mindzie_studio/administration/user-management/user-roles)** - Understand the different roles and their capabilities
- **[User Permissions](/mindzie_studio/administration/user-management/user-permissions)** - Fine-grained permission management
## User Types in mindzie Studio
### Regular Users
Standard users who access a single tenant:
- Authenticate directly to their assigned tenant
- Have permissions only within their tenant
- Cannot access other tenants without separate accounts
### Service Accounts
Special users designed for multi-tenant access:
- Authenticate at a designated "home tenant"
- Can access multiple tenants with appropriate permissions
- Limited to Server Administrator (`TenantAdmin`) and Administrator roles
- [Learn more about Service Accounts](/mindzie_studio/administration/service-accounts)
## User Roles
mindzie Studio uses role-based access control with five primary roles. They appear here from broadest to narrowest scope. See [User Roles](/mindzie_studio/administration/user-management/user-roles) for the full description of each.
> The role with the highest level of access is shown in the role dropdown and API responses as `TenantAdmin`. This page refers to it as **Server Administrator** to match what it actually does (it owns the **Server Administration** menu and can manage every tenant). When assigning the role through the UI or API, select `TenantAdmin`.
### Server Administrator
- Full access across all tenants
- Can create, modify, and delete tenants
- Owns the Server Administration menu (Manage Tenants, Manage Users, Server Memory, Backups, executions)
- Can be promoted to service account
- Shown in the role dropdown as `TenantAdmin`
### Administrator
- Full administrative authority within a tenant
- Can manage users, reset passwords, and assign roles
- Manages analysis templates and tenant settings
- Cannot open the Server Administration menu or create new tenants
- Can be promoted to service account
### IT Admin
- Technical configuration access
- Manages integrations, connections, and global API keys
- Limited authoring access — does not build dashboards or analyses
- Cannot become service account
### Analyst
- Access to analysis tools and reports
- Can create and share dashboards, investigations, and notebooks
- Limited administrative access
- Cannot become service account
### Developer
- Access to development tools and APIs
- Can create custom integrations
- Limited administrative access
- Cannot become service account
## Managing Users
### Adding New Users
1. Navigate to **Administration** -> **Users**
2. Click **Add User**
3. Enter user details:
- Name
- Email address
- Initial role
4. Configure authentication method
5. Send invitation email
### Editing Existing Users
1. Navigate to **Administration** -> **Users**
2. Find the user in the list
3. Click **Edit**
4. Modify user properties:
- Role assignment
- Permissions
- Service account status (if eligible)
5. Save changes
### Bulk Operations
For managing multiple users:
- **Bulk Import** - Upload CSV with user details
- **Bulk Role Assignment** - Change roles for multiple users
- **Bulk Service Account Promotion** - Convert eligible users to service accounts
## Service Account Management
Service accounts are a powerful feature for organizations that need cross-tenant access:
### When to Use Service Accounts
- **Consultants** working with multiple client tenants
- **Support Staff** providing assistance across tenants
- **Integration Accounts** for automated cross-tenant processes
### Creating Service Accounts
1. User must have Server Administrator (`TenantAdmin`) or Administrator role
2. Navigate to user management
3. Select eligible user
4. Enable service account status
5. Assign home tenant
6. [Detailed Guide](/mindzie_studio/administration/service-accounts/promote-user-to-service-account)
## Security Best Practices
### Account Security
- Enforce strong password policies
- Enable multi-factor authentication
- Regular access reviews
- Prompt deactivation of unused accounts
### Service Account Security
- Limit service accounts to essential users only
- Regular audit of cross-tenant access
- Monitor service account activity
- Document business justification
### Permission Management
- Follow principle of least privilege
- Regular permission audits
- Document special permissions
- Use roles rather than individual permissions
## Common Tasks
### Resetting User Passwords
1. Navigate to user management
2. Select the user
3. Click **Reset Password**
4. User receives password reset email
### Changing User Roles
1. Find user in user list
2. Click **Edit**
3. Select new role from dropdown
4. Confirm change
5. User permissions update immediately
### Deactivating Users
1. Locate user account
2. Click **Deactivate**
3. Confirm deactivation
4. User access removed immediately
5. Audit history preserved
## Troubleshooting
### User Cannot Log In
- Verify account is active
- Check authentication configuration
- Confirm correct tenant URL
- Reset password if needed
### Missing Permissions
- Verify role assignment
- Check tenant-specific permissions
- Review recent changes
- Confirm user is in correct tenant
### Service Account Issues
- Verify home tenant assignment
- Check cross-tenant permissions
- Confirm eligible role (Server Administrator / `TenantAdmin`, or Administrator)
- Review authentication flow
## Related Documentation
- [Service Accounts Overview](/mindzie_studio/administration/service-accounts)
- [User Roles Guide](/mindzie_studio/administration/user-management/user-roles)
- [Permission Management](/mindzie_studio/administration/user-management/user-permissions)
- [Tenant Management](/mindzie_studio/administration/tenant-management)
---
## Email Settings
Section: Administration
URL: https://docs.mindziestudio.com/mindzie_studio/administration/email_settings
Source: /docs-master/mindzieStudio/administration/email_settings/page.md
# Email Settings
Configure email services for your organization to enable system notifications, alerts, and automated communications. mindzieStudio supports three email configuration options to meet different organizational requirements.
## Accessing Email Settings
1. Navigate to **Administration > Tenant Settings**
2. Select **Email** from the settings menu

## Email Service Options
mindzieStudio offers three email service types:
| Option | Description | Configuration Required |
|--------|-------------|----------------------|
| **mindzieEmail** | Use mindzie's managed email service | None |
| **SMTP** | Use your own SMTP server | Server details required |
| **OFF** | Disable all email functionality | None |
## Option 1: mindzieEmail (Default)
The default setting uses mindzie's managed email service. This is the simplest option as no configuration is required.

**How it works:**
- All emails are routed through mindzie's servers
- No setup or configuration required
- Email content is not stored on mindzie servers
**Note:** While mindzie does not store email content, emails do route through mindzie's servers. If your organization has strict data routing requirements, consider using your own SMTP server instead.
## Option 2: SMTP Server
For organizations that require emails to be sent through their own infrastructure, mindzieStudio supports custom SMTP server configuration.
### Step-by-Step Setup
**1. Change the Email Service Type**
By default, the email service type is set to "mindzieEmail". Change this to **SMTP** using the dropdown selector.

**2. Configure SMTP Server Details**
After selecting SMTP, you will need to provide the following information from your IT administrator:

### SMTP Configuration Fields
| Field | Description | Example |
|-------|-------------|---------|
| **SMTP Server Address** | The hostname or IP address of your SMTP server | `smtp.company.com` |
| **Port** | The port number for SMTP connections | `587` (TLS) or `465` (SSL) |
| **Security** | Connection security type | None, TLS, or SSL |
| **Username** | Authentication username (must be a full email address) | `notifications@company.com` |
| **Password** | Authentication password or app password | (your password) |
**Important - Username Requirement:**
In the current version of mindzieStudio, the **Username** field must be a valid email address, and this email address will also be used as the "From" address for all outgoing emails. This means the account you authenticate with will also appear as the sender of all system notifications.
For example, if you configure `notifications@company.com` as the Username, all emails sent by mindzieStudio will show `notifications@company.com` as the sender.
**Authentication Options:**
- If your SMTP server requires authentication, enter the username and password
- If no authentication is required, you can disable the authentication option
### Security Options
| Security Type | Description | Typical Port |
|--------------|-------------|--------------|
| **None** | No encryption (not recommended for production) | 25 |
| **TLS** | Transport Layer Security with STARTTLS (recommended) | 587 |
| **SSL** | Implicit SSL/TLS connection | 465 |
### Common SMTP Ports
| Port | Security | Description |
|------|----------|-------------|
| 25 | None | Standard SMTP (often blocked by ISPs) |
| 587 | TLS | Submission port with STARTTLS (recommended) |
| 465 | SSL | SMTPS (implicit SSL) |
**3. Save Your Configuration**
After entering all the required information, click **Save** to apply your settings.
**4. Test the Connection**
After saving, use the **Test Connection** feature to verify your configuration:
1. Click **Test Connection**
2. Enter an email address to send a test message to
3. Confirm the test email is received in the inbox
This verifies that mindzieStudio can successfully connect to your SMTP server and send emails.
### SMTP Test Script
Before configuring SMTP settings in mindzieStudio, you can test your SMTP configuration using a standalone PowerShell script. This allows you to verify that your server settings, credentials, and network connectivity are correct before entering them into mindzieStudio.
Download test_smtp.ps1
**How to use the test script:**
1. Download the `test_smtp.ps1` file using the link above
2. Open the file in a text editor (Notepad, VS Code, etc.)
3. Fill in your SMTP settings at the top of the file:
- `$SmtpServer` - Your SMTP server address
- `$SmtpPort` - The port number (typically 587 for TLS)
- `$UseTLS` - Set to `$true` for TLS encryption
- `$FromEmail` - The sender email address (must match Username)
- `$Username` - Your authentication username (must match FromEmail)
- `$ToEmail` - An email address to send the test message to
4. Save the file
5. Open PowerShell and navigate to the folder containing the script
6. Run the script: `.\test_smtp.ps1`
7. If prompted, enter your SMTP password
8. Check if the test email arrives in the recipient's inbox
**Important:** The script will warn you if the Username and FromEmail values do not match. In mindzieStudio, these values must be the same for SMTP to work correctly.
**Example output on success:**
```
mindzie Studio - SMTP Test Script
==================================
SMTP Settings:
Server: smtp.office365.com
Port: 587
TLS: True
From: notifications@company.com
To: admin@company.com
Sending test email...
SUCCESS: Test email sent successfully!
You can now configure these settings in mindzie Studio:
Administration -> Email Settings
```
If the test email is received, you can confidently enter the same settings into mindzieStudio.
## Option 3: Email Disabled (OFF)
You can disable email functionality entirely if your organization does not require email notifications.

**Warning:** Disabling email will affect the following features:
- Two-factor authentication (2FA) via email will not be available
- System notifications will not be sent
- Alert emails will not be delivered
- Password reset emails will not work
Only disable email if you are certain these features are not needed for your deployment.
## Best Practices
1. **Use TLS or SSL** when configuring SMTP to ensure email content is encrypted in transit
2. **Test your configuration** by sending a test email after making changes
3. **Use a dedicated email account** for mindzieStudio notifications rather than a personal account
4. **Keep credentials secure** and rotate passwords periodically
5. **Use app passwords** when available instead of regular account passwords for enhanced security
## Troubleshooting
### Emails not being delivered
1. Verify the SMTP server address and port are correct
2. Check that the username and password are valid
3. Ensure the security setting matches your server's requirements
4. Check if your firewall allows outbound connections on the SMTP port
5. Verify your email provider has SMTP authentication enabled
### Authentication failures
1. Verify the username format (most servers require the full email address)
2. Check if your email provider requires an app-specific password
3. Ensure the account has permission to send emails via SMTP
4. Verify SMTP authentication is enabled at both the server and account level
---
## Configuration Examples
The following examples demonstrate SMTP configuration for common email providers. These are provided as general guidance only.
**Important:** Email server configuration varies between organizations based on security policies, software versions, and administrative settings. The steps shown below may not exactly match your organization's environment. Always consult your IT administrator before making changes to email authentication settings, as these changes can have security implications for your organization.
mindzie does not provide support for configuring third-party email services. These examples are intended to illustrate the type of information needed and the general process involved.
---
### Example: Microsoft Exchange 365
This example shows a typical configuration for Microsoft Exchange 365 / Office 365.
#### SMTP Settings for Microsoft 365
| Setting | Value |
|---------|-------|
| **SMTP Server** | `smtp.office365.com` |
| **Port** | `587` |
| **Security** | TLS |
| **Authentication** | Yes (Required) |
| **Username** | Your full email address (e.g., `yourname@company.com`) |
| **Password** | User password or App Password |
#### Enabling SMTP Authentication
Microsoft disables SMTP authentication by default. Your IT administrator may need to enable it at both the server and account level.
**Server-Level Configuration (Exchange Admin Center):**
1. Go to [https://admin.exchange.microsoft.com/](https://admin.exchange.microsoft.com/)
2. Click **Settings** from the left menu
3. Click **Mail Flow**
4. Ensure "Turn off SMTP AUTH protocol for your organization" is **unchecked**

**Account-Level Configuration:**
1. Go to [https://admin.cloud.microsoft/](https://admin.cloud.microsoft/)
2. Click on the account name to be used for sending emails
3. Click **Manage email apps**
4. Ensure "Authenticated SMTP" is **checked**

**Note:** If the SMTP option is not visible, it may be disabled at the server level. Contact your IT administrator.
#### Using App Passwords
If your organization uses Multi-Factor Authentication (MFA), you may need to create an App Password instead of using your regular password.
**Note:** App Passwords are only available when Security Defaults are disabled and Multi-Factor Authentication is enabled. If you cannot see the App Passwords option, contact your IT administrator.
**Creating an App Password:**
1. Go to [https://mysignins.microsoft.com/](https://mysignins.microsoft.com/)
2. Click **Security Info** on the left side

3. Click **Add sign-in method**
4. Select **App Password**

5. Use this generated password in the mindzieStudio email settings
**Security Note:** Changing security defaults or enabling legacy authentication can affect your organization's security posture. Always consult with your IT security team before making these changes.
---
### Example: Gmail SMTP
This example shows a typical configuration for Gmail / Google Workspace.
#### SMTP Settings for Gmail
| Setting | Value |
|---------|-------|
| **SMTP Server** | `smtp.gmail.com` |
| **Port** | `587` |
| **Security** | TLS |
| **Authentication** | Yes (Required) |
| **Username** | Your full Gmail address (e.g., `yourname@gmail.com`) |
| **Password** | App Password (recommended) |
#### Creating an App Password for Gmail
Google recommends using App Passwords for applications that need to access your Google account.
1. Go to [https://myaccount.google.com/apppasswords](https://myaccount.google.com/apppasswords)
2. Sign in to your Google account if prompted
3. Enter a name for the app (e.g., "mindzieStudio")
4. Click **Create**

5. Google will generate a 16-character password
6. Copy this password and use it in the mindzieStudio email settings (not your regular Google password)
**Note:** You must have 2-Step Verification enabled on your Google account to use App Passwords. If you do not see the App Passwords option, enable 2-Step Verification first in your Google account security settings.
---
## Support
For assistance with mindzieStudio email configuration, contact mindzie support. For questions about your organization's email server settings, SMTP authentication, or app passwords, please consult your IT administrator.
---
## Overview
Section: Dataset Configuration Wizard
URL: https://docs.mindziestudio.com/mindzie_studio/dataset-configuration-wizard/overview
Source: /docs-master/mindzieStudio/dataset-configuration-wizard/overview/page.md
# Dataset Configuration Wizard
## Why Use the Dataset Configuration Wizard?
The Dataset Configuration Wizard is what turns a basic event log into an analysis-ready dataset that gives accurate, business-meaningful answers. Without it, mindzieStudio still works - but the metrics it produces are generic and often misleading. Five minutes spent in the wizard typically pays back across every dashboard, calculator, and investigation you build for the rest of the dataset's life.
By stepping through the wizard you get:
- **Accurate cycle times** - cases without a defined "complete" state look infinitely long; the wizard fixes that
- **Working-time durations** - durations that exclude evenings, weekends, and holidays so they reflect real effort, not wall-clock time
- **Cost and ROI metrics** - dollar figures behind every case so you can prioritize improvement work
- **Industry benchmarks** - your numbers compared against published benchmarks for your process type
- **Conformance and compliance reporting** - measurement of how well execution follows the designed process
- **Cleaner visualizations** - process maps that aren't cluttered with system noise or naming variations
- **AI-powered defaults** - mindzie AI fills in most of the configuration for you, so you mostly review rather than write
The cost of skipping configuration is hidden but real: dashboards that drift, durations that overstate the problem, variant maps too noisy to read, and no way to tell "open" from "closed." The wizard exists so you don't pay that tax.

## Where the Wizard Appears
The Configuration Wizard is **Step 6 (Config)** of the Dataset Upload flow, after your data has been uploaded, detected, mapped, processed, and summarized. By the time you arrive, mindzieStudio already has a working event log - this wizard is where you give it the extra context that makes process mining accurate for your business.
## AI-Powered Configuration
When you arrive at the wizard, you will see a banner at the top of the Welcome screen:
> **AI-Powered Configuration** - mindzie AI has analyzed your event log and pre-configured several features based on your data. Review and adjust the suggestions below, or accept the defaults to get started quickly.
mindzie AI looks at your activity names, attribute names, distributions, and patterns to make smart starting choices. Anything mindzie AI has set for you is marked with an **AI Configured** badge. You can accept the suggestions, tweak them, or override them entirely.
## What These Features Do
The Welcome screen shows a card for every available feature so you can see at a glance what is configured, what is optional, and what mindzie AI has already filled in. You can click any card to jump straight to that feature, or use the left sidebar to move between them.
| Feature | Purpose |
|---------|---------|
| **Process Information** | Identify the process type (P2P, O2C, etc.) for industry benchmarks |
| **Activity Costs** | Assign cost estimates to activities for ROI and savings analysis |
| **Case Completion** | Define what makes a case "complete" for accurate cycle times |
| **Activity Cleanup** | Remove noise, merge similar activities, and standardize naming |
| **Working Calendar** | Set business hours so durations use working time, not wall clock time |
| **Expected Order** | Define the ideal activity sequence for deviation and conformance checks |
| **Performance Targets** | Set duration targets for activities to flag bottlenecks |
| **Freeze Time** | Lock the analysis to a specific point in time for consistent results |
| **BPMN Conformance** | Compare actual flow to a BPMN model |
Every feature is **optional** - you can configure as many or as few as you like, and you can always come back later to adjust them.
## How the Sidebar Works
The left sidebar tracks your progress through the wizard:
- A **green check** next to a feature means it is configured
- An **AI badge** means mindzie AI pre-configured it
- A **plain dot** means it has not been configured yet
- The currently open feature is highlighted
At the bottom of the sidebar you'll see a counter such as **"1 of 9 configured"** so you know how far through the optional features you are.
## Skipping the Wizard
You don't have to configure every feature. You have several options to move on:
- **Configure only what you need** and click **Finish** at any time
- **Accept all the AI suggestions** as-is and click **Finish**
- **Click Skip** (if shown) to bypass configuration entirely
- **Click Cancel** to abandon the upload
Anything you don't configure here can still be configured later from the dataset's settings.
## What's in This Section
Each feature in the wizard has its own dedicated page in this section. Use the left menu to jump to any feature:
- [Process Information](/mindzie_studio/dataset-configuration-wizard/process-information)
- [Activity Costs](/mindzie_studio/dataset-configuration-wizard/activity-costs)
- [Case Completion](/mindzie_studio/dataset-configuration-wizard/case-completion)
- [Activity Cleanup](/mindzie_studio/dataset-configuration-wizard/activity-cleanup)
- [Working Calendar](/mindzie_studio/dataset-configuration-wizard/working-calendar)
- [Expected Order](/mindzie_studio/dataset-configuration-wizard/expected-order)
- [Performance](/mindzie_studio/dataset-configuration-wizard/performance)
- [Freeze Time](/mindzie_studio/dataset-configuration-wizard/freeze-time)
- [BPMN Conformance](/mindzie_studio/dataset-configuration-wizard/bpmn-conformance)
## Tips
- **Trust the AI suggestions as a starting point** - they are usually close to correct
- **Configure Working Calendar early** - many other metrics depend on it
- **Define Case Completion** - without it, cycle times are not as meaningful
- **You don't have to do everything in one sitting** - features can be edited later
---
*This documentation is part of the mindzieStudio process mining platform.*
---
## Process Information
Section: Dataset Configuration Wizard
URL: https://docs.mindziestudio.com/mindzie_studio/dataset-configuration-wizard/process-information
Source: /docs-master/mindzieStudio/dataset-configuration-wizard/process-information/page.md
# Process Information
## Why Use Process Information?
Process Information is how you tell mindzieStudio what kind of business process this dataset represents. A 30-second investment here unlocks features across the entire platform - and skipping it leaves a generic, context-free dataset that is harder for everyone to use.
By configuring Process Information you gain:
- **Industry benchmarks** - calculators and dashboards can compare your numbers (cycle time, cost, conformance) to published benchmarks for your process type
- **Better AI suggestions in every other tab** - costs, expected order, and performance targets all use the process type and industry to make smarter recommendations
- **Meaningful labels throughout the application** - dashboards, dataset listings, and reports show your process by its real business name, not the source filename
- **Faster onboarding for teammates** - other users in your tenant can immediately tell what the dataset is about
- **Stronger searchability** - process type and industry tags make the dataset easier to find later
It is the single highest-value field-fill in the wizard: small effort, broad payoff.

## What This Tab Does
In this tab you provide:
- **Process Type** - The kind of business process this dataset represents (Purchase-to-Pay, Order-to-Cash, Claims Processing, KYC, etc.)
- **Industry** - The industry your organization operates in (Financial Services, Manufacturing, Healthcare, etc.)
- **Process Display Name** - A human-friendly name shown throughout mindzieStudio
- **Description** - A short narrative description of what this process does
This information turns a generic event log into something specific to your business.
## AI Pre-fill
mindzie AI inspects your activity names and event patterns to pre-fill this form for you. The purple **"AI has pre-filled this form"** banner explains what AI detected. For example:
> The activities present in the event log, such as 'Perform KYC Check', 'Validate Applicant Information', and 'Open Account in Core Banking System', indicate that this process is related to customer onboarding in the financial services sector.
Each AI-suggested field is labeled with **(AI suggested)** or **(AI detected)** so you can tell which values came from AI and adjust them if needed.
## The Fields
### Process Type
A short label describing the kind of process. Examples include:
- `Purchase-to-Pay`
- `Order-to-Cash`
- `Claims Processing`
- `Customer Onboarding`
- `Service Request Management`
You can either pick from common process types or type your own.
### Industry
The industry your organization operates in. mindzie AI uses this to apply industry-specific benchmarks (for example, average invoice cycle times in Financial Services).
### Process Display Name
The user-facing name for this process. It appears in dashboards, dataset listings, and reports. Pick something clear and descriptive - e.g. `Customer Account Onboarding Process`.
### Description
A short narrative description of the process. This helps other users in your tenant understand what the dataset is about. The AI suggestion is usually a great starting point.
## Advanced Settings
The **Advanced Settings** section (collapsed by default) lets you fine-tune additional process metadata. Open it only if you need to override the defaults.
## Disabling This Feature
If you don't want to set process information, click **Disable** in the top-right of the configuration card. The dataset will be created without process metadata, and you can add it later from the dataset settings.
## Tips
- **Trust the AI suggestion** if your activity names are descriptive
- **Use plain English** for the display name - it's user-facing
- **Don't worry about getting it perfect** - it's easy to edit later
---
*This documentation is part of the mindzieStudio process mining platform.*
---
## Activity Costs
Section: Dataset Configuration Wizard
URL: https://docs.mindziestudio.com/mindzie_studio/dataset-configuration-wizard/activity-costs
Source: /docs-master/mindzieStudio/dataset-configuration-wizard/activity-costs/page.md
# Activity Costs
## Why Use Activity Costs?
Activity Costs turns an event log of "what happened" into a financial picture of "what it cost." Once costs are configured, every metric in mindzieStudio gains a dollar dimension - and the conversation shifts from "this case took a long time" to "this case cost the business $1,200." That shift is what makes process mining actionable for executives, finance teams, and anyone deciding where to invest improvement effort.
Configure Activity Costs to gain:
- **Cost per case** and **total process cost** for every dashboard
- **ROI analysis** for automation candidates - see exactly how much you save by automating an activity
- **Cost-weighted bottleneck detection** - so you focus on the activities that cost the most, not just the slowest
- **Variant cost comparison** - rank execution paths by cost, not just frequency
- **Cost outliers** - find the cases that quietly drain the budget
- **Industry benchmarking** - compare your activity costs to published industry norms
Without costs, improvement decisions are made on time alone - which often picks the wrong priorities. Adding costs reframes every chart in business terms.

## What This Tab Does
In this tab you provide, for each activity:
- **Cost ($)** - The estimated cost to perform that activity once
- **Estimated Time (min)** - How long the activity typically takes
These two values together let mindzieStudio reason about both money and effort. They power calculators like Days of Sales Outstanding, the Automation Calculator, the Case Outcome by Category calculator, and many others.
## AI Cost Analysis
When you open this tab, mindzie AI shows a brief explanation of how it derived the suggested values. For example:
> The identified process type is Loan Processing, and the cost estimates are based on industry benchmarks from the MBA. Adjustments were made based on activity frequency and complexity.
The AI uses three inputs to suggest costs:
- The **process type** identified in the Process Information tab
- **Industry benchmarks** from public sources for that process type
- **Activity frequency and complexity** within your event log
The result is a starting estimate that is realistic for your industry but specific to your dataset. You can override every value if your business has better numbers.
## The Activity Table
The main part of this tab is a table with one row per activity. Each row has:
| Column | What It Means |
|--------|---------------|
| **Activity** | The activity name as it appears in the event log |
| **Cost ($)** | Estimated cost per occurrence in dollars |
| **Est. Time (min)** | Estimated time in minutes |
You can edit any cell directly. Tab through to fill in values quickly, or paste from a spreadsheet for bulk updates.
## Cost Analysis Preview
At the bottom of the tab, mindzieStudio shows a live preview as you change values:
- **Average Cost** - Mean cost per event across all activities
- **Average Time** - Mean estimated time per event
- **Activities Configured** - How many of the activities have values (e.g. `13 of 13`)
You can also see a running **Total** in the top-right of the table.
## Disabling This Feature
If cost analysis is not relevant for your dataset, click **Disable** in the top-right. mindzieStudio will skip this feature and your dataset will work normally - just without cost-based metrics.
## Tips
- **Use the AI suggestions as a starting point** - they are based on industry benchmarks
- **Fill values for the most expensive activities first** - they dominate the totals
- **Don't worry about precision** - even rough estimates are valuable for relative comparisons
- **Update over time** - revisit the costs as your team builds better data
---
*This documentation is part of the mindzieStudio process mining platform.*
---
## Case Completion
Section: Dataset Configuration Wizard
URL: https://docs.mindziestudio.com/mindzie_studio/dataset-configuration-wizard/case-completion
Source: /docs-master/mindzieStudio/dataset-configuration-wizard/case-completion/page.md
# Case Completion
## Why Use Case Completion?
Case Completion is the highest-leverage configuration in the wizard. It tells mindzieStudio which activities mark the end of a case - and that single decision determines whether your cycle time, SLA, and case-status numbers are trustworthy or misleading. If you only configure one optional feature, this is the one to pick.
Configure Case Completion to gain:
- **Accurate cycle times** - duration measured from start to actual completion, not from start to "now"
- **Open vs. closed reporting** - know exactly how many cases are still in flight versus done
- **Working SLA dashboards** - on-time vs. late metrics that only count completed cases
- **Trustworthy bottleneck analysis** - long open cases stop being mistaken for slow processes
- **Meaningful Case Closed and Case Duration calculators**
- **Realistic forecasting** - use closed-case durations to predict how long open cases will take
Without case completion, every long-running case looks broken - because mindzieStudio treats it as still in progress and keeps the duration counter running. Case Completion separates "stuck" from "still open and on track."

## What This Tab Does
A case is "complete" when it reaches a terminal activity that means the work is done. For example, in an onboarding process, the case is complete when the activity `Close Case` happens. mindzieStudio uses your selected completion activities to:
- Distinguish between **open** and **closed** cases
- Calculate accurate **cycle times** (only for closed cases)
- Track **SLA compliance** for completed work
- Drive **case status** dashboards
- Power calculators like **Case Closed**, **Case Duration**, and **Days of Sales Outstanding**
## AI Analysis
When you open this tab, mindzie AI examines your event log and suggests completion activities. A purple banner explains the analysis. For example:
> The only activity that indicates a case has reached a terminal state is 'Close Case', which appears at the end of nearly all cases (99.6%). No other activities are identified as completion indicators.
mindzie AI looks at:
- **Activity names** that suggest finality (`Close`, `Complete`, `Finalize`, `Resolve`, `Archive`, etc.)
- **Position in the case** - activities that frequently appear at the end
- **Frequency at the end** - how often a given activity is the last activity in its case
A green **AI Analysis Complete** confirmation tells you how many activities mindzie AI suggested.
## The Completion Activities List
The main panel shows every activity in your event log along with how often each one appears as the last activity in its case. For each row you see:
- The **activity name**
- An **AI badge** (e.g. `AI 80%`) on AI-suggested activities, with a confidence score
- The **end count** - how many cases end with this activity (e.g. `10,000`)
- The **end percentage** - what fraction of cases end with this activity (e.g. `99.6%`)
You select the activities that mark completion by checking the box next to each one. Multiple selections are allowed - many processes have several "happy path" terminal activities.
### Quick Selection Helpers
In the top-right of the list you have three quick selectors:
- **All** - Select every activity (rarely useful)
- **None** - Clear all selections
- **AI Suggested** - Select only the AI-suggested activities
## Examples
Here are some common patterns:
- **Order-to-Cash**: `Order Delivered`, `Invoice Paid`
- **Procure-to-Pay**: `Payment Issued`, `Invoice Closed`
- **Customer Onboarding**: `Account Activated`, `Close Case`
- **IT Service Management**: `Ticket Resolved`, `Ticket Closed`
- **Insurance Claims**: `Claim Paid`, `Claim Denied`, `Claim Closed`
## Disabling This Feature
If completion activities don't make sense for your data (for example, if every case is open-ended), click **Disable** in the top-right. mindzieStudio will treat every case as still in progress, and cycle time metrics will be unavailable.
## Tips
- **Trust the AI suggestion when confidence is high** (>80%)
- **Add multiple completion activities** if your process has several "happy path" endings
- **Don't include activities that are sometimes terminal** - only those that always mean completion
- **Re-check after major data changes** - new activities may need to be added
---
*This documentation is part of the mindzieStudio process mining platform.*
---
## Activity Cleanup
Section: Dataset Configuration Wizard
URL: https://docs.mindziestudio.com/mindzie_studio/dataset-configuration-wizard/activity-cleanup
Source: /docs-master/mindzieStudio/dataset-configuration-wizard/activity-cleanup/page.md
# Activity Cleanup
## Why Use Activity Cleanup?
Activity Cleanup is what makes the difference between a process map you can actually read and a "spaghetti map" that nobody trusts. Real-world event logs are full of system noise, naming inconsistencies, and near-duplicates - and every one of those issues compounds across the rest of your analysis. A few minutes of cleanup pays back every time someone opens a process map, runs a variant analysis, or builds a conformance report.
Configure Activity Cleanup to gain:
- **Readable process maps** - fewer junk nodes, clearer flow, less visual clutter
- **Meaningful variant analysis** - similar paths collapse into the same variant instead of fragmenting into hundreds
- **Trustworthy conformance scores** - the model lines up with real activities instead of being defeated by typos
- **Stable performance metrics** - counts and durations are not split across naming variants
- **Better AI suggestions everywhere else** - cleaner activity names lead to better suggestions in every other tab
- **Less analyst confusion** - one canonical name for each business action, instead of three near-duplicates
Without cleanup, the noise stays in every chart you build forever - so this is one of the few configuration choices that gets harder to fix the longer you wait.

## What This Tab Does
Activity cleanup gives you two complementary tools:
1. **Remove Activities** - Drop activities that are noise (system pings, notifications, audit log entries, etc.) before any analysis runs.
2. **Rename Activities** - Standardize naming so similar activities collapse into one (e.g., merging `Approve` and `Approved` into a single canonical name).
Both operations happen during dataset creation, so the cleaned-up version is what mindzieStudio analyzes from then on.
## AI Analysis
When you open this tab, mindzie AI analyzes your activity names to suggest cleanups. You will see two purple banners:
### AI Analysis: Remove Activities
mindzie AI scans for activities whose names look like noise:
> Analyzed activity names for patterns indicating system-generated tasks or automation, focusing on high-frequency activities and those with names like 'Send', 'Log', 'Notification', 'System', 'Auto'. No activities met the criteria for removal.
If mindzie AI finds nothing to remove, the banner says so. If it does find candidates, they are flagged for your review.
### AI Analysis: Rename Activities
mindzie AI also looks for naming inconsistencies:
> Compared all activity names for variations, typos, and similar actions. No inconsistencies or candidates for renaming were found.
Activities that appear to be the same action with slightly different names (`Approve` vs `Approved`, `Send Email` vs `Send Notification`, etc.) are suggested for merging.
## Remove Activities
The Remove Activities panel lists every activity in your event log with a checkbox next to each one.
To remove an activity:
1. Find the activity in the list (use scroll or search)
2. Check the box to mark it for removal
3. Continue selecting more if needed
In the top-right, you have **All / None** quick selectors. The bottom of the panel shows a count: `0 of 13 activities selected for removal`.
### What Gets Removed
When you select activities for removal, every event with that activity name is dropped from the dataset. This means:
- The activity will not appear on process maps
- The activity will not appear in variant analysis
- Cases that previously contained only the removed activity may shrink to zero events (and effectively disappear)
### Common Removal Candidates
- System notifications (`Send Email`, `Log Event`, `Audit Trail`)
- Internal pings (`Heartbeat`, `Status Check`)
- Auto-generated noise (`Auto Save`, `Background Sync`)
- Unrelated activities that leaked in from upstream systems
## Rename Activities
The Rename Activities panel lets you standardize naming. You start by clicking **+ Add rename**, then specify:
- The **original name** (the activity as it appears in the data)
- The **new name** (the canonical version you want)
You can add as many renames as you need. Renames apply during dataset creation, so the canonical names are what shows up in every chart and calculator.
### Common Rename Patterns
- Past vs. present tense: `Approve` and `Approved` -> `Approve`
- Casing differences: `submit invoice` and `Submit Invoice` -> `Submit Invoice`
- Vendor-specific labels: `SAP Approve` and `Manual Approve` -> `Approve`
- Localization: `Approuver` and `Approve` -> `Approve` (if you want a single language)
## Disabling This Feature
If you don't need any cleanup, click **Disable** in the top-right. The dataset will be created with all activities exactly as they appear in the source data.
## Tips
- **Start with AI suggestions** - mindzie AI is good at flagging obvious noise
- **Be conservative when removing** - it's easier to add back than to discover hidden patterns later
- **Standardize names before deep analysis** - it pays off across every calculator
- **Document your renames** - so future analysts understand what was canonicalized
---
*This documentation is part of the mindzieStudio process mining platform.*
---
## Working Calendar
Section: Dataset Configuration Wizard
URL: https://docs.mindziestudio.com/mindzie_studio/dataset-configuration-wizard/working-calendar
Source: /docs-master/mindzieStudio/dataset-configuration-wizard/working-calendar/page.md
# Working Calendar
## Why Use a Working Calendar?
Without a working calendar, every duration metric in mindzieStudio is wall-clock time - including evenings, weekends, and holidays when nobody is working. This makes office processes look much slower than they really are and unfairly penalizes any case that happens to span a weekend. A working calendar is the single biggest accuracy improvement you can make to a duration-heavy analysis.
Configure a Working Calendar to gain:
- **Accurate cycle times** - measure work-in-process, not idle nights and weekends
- **Fair case comparisons** - cases starting Friday don't look slower than identical cases starting Monday
- **Realistic SLA tracking** - a 24-hour SLA uses 24 working hours, not 24 wall-clock hours
- **Meaningful bottleneck detection** - bottlenecks reflect actual queue time, not after-hours gaps
- **Trustworthy team performance metrics** - apples-to-apples comparisons across teams in different time zones
- **Stakeholder-aligned numbers** - the durations match what the business already believes
A real example: an invoice that arrives Friday at 5pm and is processed Monday at 9am has a 64-hour wall-clock duration but only 0 working hours. With a working calendar, the metric reflects what actually happened.

## What This Tab Does
A working calendar lets you exclude evenings, nights, weekends, and holidays from duration calculations. Once configured, every duration metric in mindzieStudio respects the calendar:
- Case duration
- Activity-to-activity duration
- SLA tracking
- Bottleneck detection
- Performance targets
The calendar applies to the entire dataset and is used everywhere a duration is computed.
## Enabling the Calendar
At the top of the tab, toggle **Enable Working Calendar** on. Until you enable it, all durations use plain wall-clock time.
## Calendar Type
Pick one of three preset calendars (or customize your own):
### Standard (9-5)
Monday to Friday, 9:00 AM - 5:00 PM. The default for office-based work in most industries.
### Extended Hours
Monday to Friday, 8:00 AM - 6:00 PM. Suits teams that start earlier and work later.
### 24/7 Operations
All days, all hours. Effectively turns the calendar off but lets you keep it enabled (useful for processes that run nonstop, such as high-volume customer support or manufacturing).
You can also click any of the cards and customize the hours to match your business.
## Templates
If your tenant has multiple datasets that share working hours, you can save your calendar as a template:
- **Load Template** - Pick a saved calendar and load it into this dataset
- **Save as Template** - Save the current calendar so other datasets can use it
Templates make it easy to apply consistent working hours across your tenant without re-entering values.
## Weekly Schedule
Below the preset cards, the **Weekly Schedule** lets you fine-tune each day individually:
- A check box to **enable or disable** each day
- A **start time** dropdown (e.g. `9:00 AM`)
- An **end time** dropdown (e.g. `5:00 PM`)
- A computed **total hours** label (e.g. `(8 hours)`)
- A **Customize** link to adjust beyond the simple start/end model
You can use this to set different hours per day, half-day Fridays, or anything else your business does.
## Holidays
If the schedule editor exposes a holiday section (depending on your version), you can also add specific days to exclude - public holidays, company-closed days, planned shutdowns, etc.
## Tips
- **Configure the working calendar early** - it affects almost every other metric
- **Match your business reality** - don't oversimplify; use the customize option if needed
- **Use 24/7 for continuous processes** - manufacturing, customer support, payment networks
- **Save a template** if your tenant has multiple datasets with the same hours
---
*This documentation is part of the mindzieStudio process mining platform.*
---
## Expected Order
Section: Dataset Configuration Wizard
URL: https://docs.mindziestudio.com/mindzie_studio/dataset-configuration-wizard/expected-order
Source: /docs-master/mindzieStudio/dataset-configuration-wizard/expected-order/page.md
# Expected Order
## Why Use Expected Order?
Expected Order is what lets mindzieStudio answer the question every business actually wants answered: "How often does this process run the way it's supposed to?" By defining the ideal sequence of activities once, you unlock a whole class of conformance, deviation, and rework analysis that simply isn't possible without it.
Configure Expected Order to gain:
- **Deviation detection** - find cases where activities happened in the wrong order
- **Rework and loop-back analysis** - identify activities being repeated when they shouldn't be
- **Compliance reporting** - measure how often the process actually follows the playbook
- **Conformance scores per case and per variant** - rank execution paths by how well they match the design
- **Targeted improvement priorities** - focus on the deviations that hurt the most cases
- **Audit-ready evidence** - documented adherence numbers for regulators and reviewers
This is one of the highest-value optional features for any business that has a defined "standard process" it wants to enforce or improve. Without it, conformance analysis falls back to descriptive ("here's what happens") instead of prescriptive ("here's where reality breaks the rules").

## What This Tab Does
You provide the order in which activities are *supposed* to happen in a perfect-path execution of your process. mindzieStudio then compares actual cases to that ideal order to identify:
- **Deviations** - activities that happened in the wrong order
- **Skips** - activities that should have happened but didn't
- **Rework and loop-backs** - activities that occurred multiple times when they shouldn't have
- **Insertions** - unexpected activities that shouldn't be in the path
- **Conformance issues** - any pattern that doesn't match the ideal flow
Expected Order powers calculators and enrichments such as Wrong Activity Order, Conformance Issue, and the broader conformance analysis tools.
## Enabling Expected Order
Toggle **Enable Expected Order** on at the top of the tab. The Activity Sequence editor appears once it is enabled.
## Activity Sequence
The Activity Sequence panel lists all the activities found in your event log, numbered in the suggested order. For example:
1. Receive Application
2. Validate Applicant Information
3. Handle Exceptions / Missing Documentation
4. Perform KYC (Know Your Customer) Check
5. Reprocess Application
6. Perform AML (Anti-Money Laundering) Screening
7. Conduct Risk Assessment
8. ...
You can:
- **Drag rows** to rearrange them
- **Reset to Original** (in the top-right) to go back to the AI suggestion
- **Skip activities** that should not be part of the expected order
## AI Suggestions
When you open the tab, mindzie AI proposes an order based on:
- The most common sequence across cases
- Activity names that suggest natural ordering (e.g. `Receive` before `Validate` before `Approve`)
- The known patterns of the identified process type
Use the suggestion as a starting point and tweak as needed.
## Disabling This Feature
If conformance is not relevant for your dataset, click **Disable** in the top-right. The dataset will be created without an expected order, and conformance-based metrics will not be available.
## Examples
### Procure-to-Pay
1. Create Purchase Requisition
2. Approve Requisition
3. Create Purchase Order
4. Receive Goods
5. Receive Invoice
6. Match Invoice
7. Approve Invoice
8. Pay Invoice
### Customer Onboarding
1. Receive Application
2. Validate Applicant Information
3. Perform KYC Check
4. Conduct Risk Assessment
5. Approve Application
6. Open Account in Core Banking System
7. Close Case
### IT Service Management
1. Open Ticket
2. Categorize Ticket
3. Assign Owner
4. Investigate
5. Resolve Ticket
6. Close Ticket
## Tips
- **Use the AI suggestion as a starting point** - it usually nails the broad order
- **Be realistic, not aspirational** - the order should reflect how the process should run, not how you wish it ran
- **Skip activities that aren't always present** - they will be treated as optional
- **Re-check the order periodically** - business processes change
---
*This documentation is part of the mindzieStudio process mining platform.*
---
## Performance
Section: Dataset Configuration Wizard
URL: https://docs.mindziestudio.com/mindzie_studio/dataset-configuration-wizard/performance
Source: /docs-master/mindzieStudio/dataset-configuration-wizard/performance/page.md
# Performance
## Why Use Performance Targets?
Performance Targets are how you turn a process map into a management tool. By defining target durations for the activity-to-activity transitions that matter most, you let mindzieStudio automatically flag bottlenecks, slow handoffs, and SLA violations - and benchmark your numbers against industry medians. Without targets, "slow" is subjective; with targets, "slow" is a number you can act on.
Configure Performance Targets to gain:
- **Automatic bottleneck detection** - mindzieStudio flags activity pairs whose duration exceeds your target
- **SLA dashboards** - on-time vs. late reporting on the handoffs that matter
- **Industry benchmark comparisons** - your average vs. median and best-in-class for your process type
- **Improvement prioritization** - focus on the pairs with the biggest gap between actual and target
- **What-If simulations** - estimate the impact of speeding up a specific handoff
- **Stakeholder-aligned metrics** - the targets reflect business expectations, not arbitrary statistics
This is where process mining starts driving operational decisions, not just descriptive insights.

## What This Tab Does
In the Performance tab you define **activity pairs** with target durations. For each pair you specify:
- The **source activity** and which event to use (first or last occurrence in the case)
- The **target activity** and which event to use
- A **target duration** (with min/max values)
- A descriptive **attribute name** for the resulting metric
- An **AI rationale** explaining why this pair matters
mindzieStudio then computes the duration between the two activities for every case, compares it to the target, and flags cases that exceed the threshold.
## AI Activity Pair Analysis
When you open the tab, mindzie AI analyzes your activity flow and proposes activity pairs based on industry benchmarks. A purple panel explains the source. For example:
> **Industry benchmarks from:** General Business Process Performance Guidelines (KYC)
>
> The identified pairs are based on the flow of activities in the KYC process, matched with general performance benchmarks that emphasize timely transitions and compliance.
Each suggestion comes with:
- A **best-in-class** benchmark (e.g. `30 minutes`)
- An **industry median** range (e.g. `1-2 hours`)
- An **average duration** observed in your event log (e.g. `4h 10m`)
- A short **AI rationale** explaining the business importance of the pair
## Activity-to-Activity Duration
The main panel shows one card per activity pair. Each card has:
- A **source activity dropdown** - the activity that starts the timer
- A **source selection** (`First` / `Last` / etc.) - which occurrence of the source to use
- A **target activity dropdown** - the activity that stops the timer
- A **target selection** (`First` / `Last` / etc.) - which occurrence of the target to use
- An **attribute name** field - the name used for the resulting metric
- A **multiple activities (min/max)** option - for advanced cases where the source or target is a set of activities
- The **AI benchmark panel** showing industry median, best-in-class, and your actual average
You can:
- **Edit any field** to override AI suggestions
- **Suggest with AI** (top-right) to ask mindzie AI for additional pairs
- **Add Pair** (top-right) to manually create a new activity pair
- **Remove a pair** by clicking the X icon
## Configuring a Pair
To set up an activity pair manually:
1. Choose the **source activity** (e.g. `Receive Application`)
2. Choose **First** or **Last** for the source
3. Choose the **target activity** (e.g. `Validate Applicant Information`)
4. Choose **First** or **Last** for the target
5. Give the metric a clear **attribute name** (e.g. `ReceiveToValidateDuration`)
6. Save the pair
Once saved, mindzieStudio will compute the duration for every case and make it available as an event/case attribute that you can use in calculators, filters, and dashboards.
## Disabling This Feature
If you don't need performance tracking, click **Disable** in the top-right. The dataset will be created without performance targets, and bottleneck detection won't be available.
## Tips
- **Trust the AI's suggested pairs** - they are based on the industry benchmarks for your process type
- **Pick handoffs that matter to the business** - the most valuable pairs are the ones with clear ownership and SLAs
- **Use descriptive attribute names** - they show up everywhere in mindzieStudio
- **Add pairs over time** - you don't need them all at once
---
*This documentation is part of the mindzieStudio process mining platform.*
---
## Freeze Time
Section: Dataset Configuration Wizard
URL: https://docs.mindziestudio.com/mindzie_studio/dataset-configuration-wizard/freeze-time
Source: /docs-master/mindzieStudio/dataset-configuration-wizard/freeze-time/page.md
# Freeze Time
## Why Use Freeze Time?
Freeze Time is the simple answer to a frustrating question: "Why does my dashboard show different numbers today than yesterday?" By default, every open case keeps aging in real time, so the same report shows different durations every time someone opens it. Freeze Time locks the analysis to a specific point in time so the numbers stop drifting.
Enable Freeze Time to gain:
- **Reproducible reports** - rerunning yesterday's analysis tomorrow gives the same numbers
- **Stable presentations** - dashboards don't change mid-meeting
- **Apples-to-apples historical comparisons** - lock the "as of" date so different time periods compare cleanly
- **Audit-ready snapshots** - reports tied to a documented as-of date
- **Consistent numbers across team members** - everyone sees the same metrics regardless of when they open the dashboard
- **Predictable monthly reporting** - freeze to end-of-month so the report stays valid for the rest of the month
Without Freeze Time, every duration involving an open case is a moving target. With it, your numbers stand still.

## What This Tab Does
By default, mindzieStudio uses the actual **now** when computing how long an open case has been running. This means the same dashboard can show different numbers depending on when it is opened. Freeze Time replaces "now" with a fixed date, so:
- Open case durations are computed as if today were the frozen date
- Reports are reproducible
- Historical comparisons line up against a consistent point in time
- Numbers stop drifting between team members who open the dashboard at different moments
## Enabling Freeze Time
Toggle **Enable Freeze Time** on. The Freeze Date editor becomes active once it is enabled.
## Freeze Date
The **Select Date** field is where you set the frozen point in time. You can:
- **Type a date** directly (e.g. `2022-04-25`)
- **Use the calendar icon** to pick a date from a date picker
- Click **Today** (top-right) to set the freeze date to today
- Click **End of Last Month** (top-right) to set it to the last day of the previous month - the most common choice for monthly reporting
A live **Preview** below the field tells you exactly what the frozen calculation will assume:
> Preview: All analysis will calculate durations as if the current time is 4/25/2022
## Common Use Cases
The bottom panel lists typical reasons to enable Freeze Time:
- **Monthly reporting** - freeze to end of reporting period
- **Historical analysis** - compare how the data looked at a past date
- **Testing** - ensure consistent results across multiple runs
- **Presentations** - lock the data so numbers don't change during a meeting
## What Stays the Same
Freeze Time only affects calculations that depend on "now" - typically the duration of open (incomplete) cases. It does not:
- Filter out events that occurred after the frozen date (use a Time Period filter for that)
- Change the actual data in the event log
- Affect closed cases (their duration is fixed by the start and end events)
If you want to *also* exclude post-freeze events from the analysis, combine Freeze Time with a Time Period filter.
## Disabling This Feature
If you want durations to always reflect real-time, click **Disable** or simply leave the toggle off. The dataset will use the actual current time whenever it computes open-case durations.
## Tips
- **Use End of Last Month for monthly reporting** - it's the most common reporting cadence
- **Pick a single freeze date for a presentation** - so numbers don't shift mid-meeting
- **Combine with a Time Period filter** - to also exclude events that occurred after the freeze date
- **Document the frozen date** - so consumers of the dashboard know what point in time they are looking at
---
*This documentation is part of the mindzieStudio process mining platform.*
---
## BPMN Conformance
Section: Dataset Configuration Wizard
URL: https://docs.mindziestudio.com/mindzie_studio/dataset-configuration-wizard/bpmn-conformance
Source: /docs-master/mindzieStudio/dataset-configuration-wizard/bpmn-conformance/page.md
# BPMN Conformance
## Why Use BPMN Conformance?
BPMN Conformance is what lets you put a hard number on the question "Are we actually following our designed process?" By comparing the actual event log to a BPMN 2.0 model, mindzieStudio produces a fitness score for every case - and aggregate compliance metrics for the whole dataset. This is one of the most valuable features for compliance, audit, and continuous improvement teams.
Configure BPMN Conformance to gain:
- **Quantified compliance** - a fitness score from 0.0 to 1.0 for every case
- **Audit-ready evidence** - documented measurement of process adherence for regulators and reviewers
- **Conforming vs. non-conforming reporting** - see exactly which cases follow the model and which don't
- **Specific deviation patterns** - identify the most common ways reality deviates from the design
- **Model validation** - quickly see if your designed process matches what people actually do
- **Continuous monitoring** - track conformance over time as the process changes
- **Improvement targeting** - focus on the deviation patterns that affect the most cases
Unlike simple Expected Order checks, BPMN Conformance correctly handles parallel gateways, exclusive choices, and other complex BPMN constructs - so it works for sophisticated processes that simple sequence checking cannot.

## What This Tab Does
Once a BPMN model is uploaded, mindzieStudio replays every case against the model and classifies each one. You can then see:
- **Cases that follow the expected process flow** - perfect conformance
- **Cases with deviations or missing steps** - partial conformance
- **Cases with activities in the wrong order** - non-conformance
The replay uses **Petri net token replay**, a standard process-mining technique that correctly handles parallel gateways, exclusive choices, and other BPMN constructs. The output is a fitness score per case - and aggregate conformance metrics for the whole dataset.
## Uploading a BPMN File
The main panel is a drop zone:
> **Upload BPMN File** - Upload a BPMN 2.0 model to check conformance against your process data.
>
> Supported formats: `.bpmn`, `.xml`
You can either:
- **Drag and drop** a BPMN file onto the panel
- **Click the panel** to open a file picker
The model needs to be a valid BPMN 2.0 file. Most BPMN editors (Camunda Modeler, Signavio, Visio with BPMN, bpmn.io, etc.) export this format directly.
## How the Replay Works
For each case in your event log, mindzieStudio:
1. Converts the BPMN model into a Petri net
2. Walks through the case event-by-event
3. Plays each event as a "token" through the net
4. Counts how many tokens are produced, consumed, missing, or remaining
5. Computes a **fitness score** between 0 and 1 (1 = perfect conformance)
The fitness score is exposed as a case attribute, so you can filter, group, and chart by it just like any other attribute.
## Activity Mapping
The activity names in your BPMN model must match the activity names in your event log. mindzieStudio matches by exact name. If your model uses different names than your data:
- Use [Activity Cleanup](/mindzie_studio/dataset-configuration-wizard/activity-cleanup) to rename activities in the event log to match the model, or
- Edit the BPMN model so its labels match the event log
## Disabling This Feature
If you don't have a BPMN model or don't need conformance checking, simply skip this tab. The configuration is fully optional.
## Related Topics
- [BPMN Conformance enrichment](/mindzie_studio/enrichments/bpmn-conformance)
- [BPMN calculator](/mindzie_studio/calculators/bpmn)
- [Conformance Analysis](/mindzie_studio/process-discovery/conformance-analysis)
- [Activity Cleanup](/mindzie_studio/dataset-configuration-wizard/activity-cleanup) - for renaming activities to match the model
## Tips
- **Use a BPMN 2.0 model** - older formats may not import cleanly
- **Match activity names exactly** - the replay is name-based
- **Start with a high-level model** - detailed sub-processes can come later
- **Iterate** - fix the model or the cleanup rules until fitness scores look reasonable
- **Save the model in version control** - so you can track changes alongside the data
---
*This documentation is part of the mindzieStudio process mining platform.*
---
## Data Selector
Section: Data Management
URL: https://docs.mindziestudio.com/mindzie_studio/data-management/data-selector
Source: /docs-master/mindzieStudio/data-management/data-selector/page.md
# Data Selector
## Overview
The Data Selector calculator is a data post-processing tool that selects specific columns from another calculator's output and optionally sorts and limits the results. This calculator is essential for creating focused data views by choosing relevant columns, ordering the data, and displaying only the top N rows.
Unlike most calculators that analyze process data directly, Data Selector works with the output tables from other calculators, making it ideal for refining analysis results for dashboards, reports, and exports.
## Common Uses
- Prepare specific data subsets for email delivery or export to stakeholders
- Create simplified dashboard views showing only key metrics from complex analysis
- Select and sort top N results from large analysis outputs (e.g., top 10 slowest cases)
- Focus reports on relevant columns by removing unnecessary detail
- Transform comprehensive analysis results into executive-friendly summaries
- Create data pipelines by chaining multiple calculators and selecting specific outputs at each stage
## Settings
**Source Calculator:** Select the calculator block whose output you want to work with. This calculator must have already been executed in the current notebook.
**Source Table:** Choose which table to use if the source calculator produces multiple result tables. Most calculators produce a single table (index 0), but some calculators return multiple tables with different types of information.
**Columns to Include:** Select which columns from the source table should appear in the output. You can select multiple columns, and they will appear in the order you specify. Column names must match exactly as they appear in the source calculator output.
**Sort Column:** Optionally choose a column to sort the results by. If you don't specify a sort column, the data will maintain the same order as the source calculator output.
**Sort Direction:** When sorting is enabled, choose whether to sort in:
- **Ascending order:** Lowest to highest (A-Z, 0-9, oldest to newest)
- **Descending order:** Highest to lowest (Z-A, 9-0, newest to oldest)
**Maximum Rows:** Specify the maximum number of rows to include in the output. Set to 0 or leave blank for no limit. When combined with sorting, this allows you to select "top N" results (e.g., top 20 slowest cases when sorted by duration descending).
## Examples
### Example 1: Top 10 Slowest Purchase Orders for Executive Report
**Scenario:** Your Case Duration calculator has analyzed 2,500 purchase orders, but you want to create an executive dashboard showing only the 10 slowest cases for immediate attention.
**Settings:**
- Source Calculator: "Purchase Order Duration Analysis"
- Source Table: 0 (primary results table)
- Columns to Include: ["Case ID", "Supplier Name", "Duration", "Total Value"]
- Sort Column: Duration
- Sort Direction: Descending
- Maximum Rows: 10
**Output:**
The calculator displays a focused table with exactly 4 columns and 10 rows:
| Case ID | Supplier Name | Duration | Total Value |
|---------|--------------|----------|-------------|
| PO-2024-8821 | Acme Manufacturing | 47.3 days | $125,400 |
| PO-2024-9156 | Global Supplies Inc | 42.8 days | $89,200 |
| PO-2024-7633 | TechParts Ltd | 38.5 days | $156,800 |
| ... | ... | ... | ... |
**Insights:** By selecting only the essential columns and limiting to 10 rows, you've created an actionable dashboard that highlights problematic cases without overwhelming executives with 2,500 rows of data. The sorting by duration ensures the most urgent cases appear first. The inclusion of Total Value shows the financial impact of these delays.
### Example 2: Weekly Activity Summary for Email Distribution
**Scenario:** You run a weekly activity frequency analysis that generates detailed statistics for 45 different activities. You want to email the process owner just the top 15 most frequent activities with simplified metrics.
**Settings:**
- Source Calculator: "Weekly Activity Frequency Report"
- Source Table: 0
- Columns to Include: ["Activity Name", "Event Count", "Percentage of Total Events"]
- Sort Column: Event Count
- Sort Direction: Descending
- Maximum Rows: 15
**Output:**
A clean, focused table perfect for email:
| Activity Name | Event Count | Percentage of Total Events |
|--------------|-------------|---------------------------|
| Create Purchase Requisition | 1,847 | 18.2% |
| Manager Approval | 1,823 | 17.9% |
| Vendor Selection | 1,792 | 17.6% |
| ... | ... | ... |
**Insights:** This simplified view removes columns like "First Occurrence" and "Last Occurrence" that clutter the email, while keeping the essential metrics that show which activities dominate the process. The recipient immediately sees that the top 3 activities account for over half of all process events.
### Example 3: Customer Analysis Dashboard Simplification
**Scenario:** Your Breakdown by Categories calculator analyzed customers across 12 different metrics, but your dashboard widget only has space to show 5 columns for the top 20 customers.
**Settings:**
- Source Calculator: "Customer Performance Analysis"
- Source Table: 0
- Columns to Include: ["Customer Name", "Case Count", "Average Duration", "Total Revenue", "On-Time Percentage"]
- Sort Column: Total Revenue
- Sort Direction: Descending
- Maximum Rows: 20
**Output:**
Dashboard-ready table with focused metrics:
| Customer Name | Case Count | Average Duration | Total Revenue | On-Time Percentage |
|--------------|-----------|------------------|---------------|-------------------|
| MegaCorp Industries | 487 | 8.2 days | $4,850,000 | 92% |
| TechStart Solutions | 356 | 7.5 days | $3,240,000 | 95% |
| Global Systems Inc | 298 | 9.1 days | $2,870,000 | 88% |
| ... | ... | ... | ... | ... |
**Insights:** You've transformed a comprehensive 12-column analysis into a dashboard-friendly 5-column view showing exactly what stakeholders need to know: which customers generate the most revenue, how many orders they place, how long processing takes, and their delivery performance. Sorting by revenue ensures the most important customers are visible at a glance.
### Example 4: Variant Analysis - Top Variants by Frequency
**Scenario:** Your variant analysis identified 284 unique process variants. You want to focus your improvement efforts on the top 25 most common variants, which typically represent 80% of your case volume.
**Settings:**
- Source Calculator: "Process Variant Analysis"
- Source Table: 0
- Columns to Include: ["Variant ID", "Frequency", "Cumulative Percentage", "Average Duration", "Contains Rework"]
- Sort Column: Frequency
- Sort Direction: Descending
- Maximum Rows: 25
**Output:**
| Variant ID | Frequency | Cumulative Percentage | Average Duration | Contains Rework |
|-----------|-----------|---------------------|-----------------|----------------|
| VAR-001 | 1,245 | 24.8% | 6.2 days | No |
| VAR-002 | 876 | 42.2% | 8.5 days | Yes |
| VAR-003 | 623 | 54.6% | 5.8 days | No |
| ... | ... | ... | ... | ... |
**Insights:** The top 25 variants represent the core of your process, and the cumulative percentage column shows that focusing on these variants covers the majority of cases. The "Contains Rework" column immediately flags which common variants include inefficient rework steps, helping prioritize improvement opportunities.
### Example 5: Date Range Analysis for Trending
**Scenario:** Your rate-over-time calculator generated daily statistics for 90 days, but you want to display just the key metrics in chronological order without any row limits for a complete trend analysis.
**Settings:**
- Source Calculator: "90-Day Completion Rate Analysis"
- Source Table: 0
- Columns to Include: ["Date", "Cases Completed", "Completion Rate"]
- Sort Column: Date
- Sort Direction: Ascending
- Maximum Rows: 0 (no limit)
**Output:**
All 90 rows displayed in chronological order:
| Date | Cases Completed | Completion Rate |
|------|----------------|----------------|
| 2024-10-01 | 23 | 87.4% |
| 2024-10-02 | 28 | 91.2% |
| 2024-10-03 | 31 | 89.7% |
| ... | ... | ... |
**Insights:** By sorting by date ascending and not limiting rows, you maintain the complete time series for charting or export. You've simplified the output by removing statistical columns (like "Standard Deviation" and "Min/Max") that aren't needed for basic trend visualization, making the data cleaner for graphing tools.
### Example 6: Multi-Table Source Selection
**Scenario:** Your conformance checker returns two tables: table 0 contains summary statistics, and table 1 contains detailed violation listings. You want to create a report from the detailed violations table.
**Settings:**
- Source Calculator: "Standard Process Conformance Check"
- Source Table: 1 (detail table, not summary)
- Columns to Include: ["Case ID", "Violation Type", "Activity Name", "Timestamp"]
- Sort Column: Violation Type
- Sort Direction: Ascending
- Maximum Rows: 100
**Output:**
| Case ID | Violation Type | Activity Name | Timestamp |
|---------|----------------|---------------|-----------|
| CS-1234 | Missing Required Step | Invoice Approval | 2024-11-15 14:22 |
| CS-5678 | Missing Required Step | Purchase Approval | 2024-11-16 09:15 |
| CS-9012 | Out of Sequence | Goods Receipt | 2024-11-16 11:45 |
| ... | ... | ... | ... |
**Insights:** By selecting table 1 instead of the default table 0, you access the detailed violation data rather than just summary counts. Sorting by violation type groups similar problems together, making it easier to identify patterns. The 100-row limit ensures the report remains manageable while covering the most important violations.
## Output
The Data Selector calculator displays a table with the exact columns you specified, in the order you selected them. The table structure is dynamic and depends on your column selections.
### Output Characteristics
**Column Structure:** Only the columns you selected from "Columns to Include" appear in the output. Column names, data types, and formatting are preserved from the source calculator.
**Row Count:** Determined by the Maximum Rows setting:
- If Maximum Rows = 0 or blank: All rows from the source table
- If Maximum Rows > 0: Up to that many rows (may be fewer if source has fewer rows)
**Row Order:** Determined by sorting settings:
- If no sort column specified: Maintains the same order as the source calculator
- If sort column specified: Rows are ordered according to the sort column and direction
### Interactive Features
**Click on rows:** In many cases, clicking on a row will drill down to show the underlying cases or details, just as you could in the source calculator.
**Export capabilities:** The refined output can be exported to Excel or CSV files, making it ideal for sharing with stakeholders who don't have access to the mindzie platform.
**Email integration:** This calculator's output is commonly used with automated email delivery to send focused data subsets to process owners and executives on a scheduled basis.
**Dashboard widgets:** The simplified, focused output is perfect for embedding in dashboard widgets where space is limited.
### Usage Tips
- Always ensure the source calculator has executed successfully before running Data Selector
- Use the preview feature in the calculator configuration to see available columns from your source
- Column names are case-sensitive - they must match exactly as they appear in the source
- When combining sorting with row limits, sorting is applied first, then the row limit (enabling "top N" selections)
- If the source calculator has no results or an error, Data Selector will produce an empty table
- Multiple Data Selector calculators can be used in sequence to progressively refine data
### Common Patterns
**Dashboard Pattern:** Complex calculator -> Data Selector (select key columns, top N rows) -> Dashboard widget
**Email Pattern:** Analysis calculator -> Data Selector (focus on actionable data) -> Automated email delivery
**Export Pattern:** Comprehensive analysis -> Data Selector (simplify for external stakeholders) -> Excel export
**Pipeline Pattern:** Calculator A -> Data Selector 1 (refine) -> Calculator B (further analysis) -> Data Selector 2 (final output)
The Data Selector is particularly valuable when you need to present analysis results to stakeholders who need focused, actionable information rather than comprehensive analytical detail. It bridges the gap between detailed process mining analysis and clear, decision-ready reporting.
---
*This documentation is part of the mindzie Studio process mining platform.*
---
## Dataset Information
Section: Data Management
URL: https://docs.mindziestudio.com/mindzie_studio/data-management/dataset-information
Source: /docs-master/mindzieStudio/data-management/dataset-information/page.md
# Dataset Information
## Overview
The calculator provides a summary of the process data.
## Common Uses
To see an overview of the data set you are working with
## Settings
There are no settings for the calculator, except for the title and description.
## Output
After clicking 'Create', you will see an output like this:
- **Start Dataset Time**: The timestamp of the first activity in the data set
- **End Dataset Time**: The timestamp of the last activity in the data set
- **Dataset Timespan**: The duration between the start and end timestamps
- **Min Case Time**: The minimum time taken by a case in the data set
- **Max Case Time**: The maximum time taken by a case in the data set
- **Average Case Time**: The average time taken by a case in the process
- **Median Case Time**: The median time taken by a case in the process
- **Total Case Count**: The total number of cases in the data set
- **Average activities per case**: The average number of activities per case in the data set
- **Activities**: The total number of distinct activities that occur in the data set
- **Case Columns**: The total number of distinct case-specific columns (attributes) in the data set
- **Edge Count**: The total number of edges (i.e., connections between activities) in the data set
---
*This documentation is part of the mindzie Studio process mining platform.*
---
## Load Dataset
Section: Data Management
URL: https://docs.mindziestudio.com/mindzie_studio/data-management/load-dataset
Source: /docs-master/mindzieStudio/data-management/load-dataset/page.md
# Load Dataset
## Overview
Load Dataset allows you to import your process data into mindzie Studio for analysis. You can load data from CSV files, databases, or other supported formats.
## Common Uses
- Import event logs from CSV files
- Load process data from business systems
- Connect to databases for real-time analysis
- Import sample datasets for learning and testing
## Settings
To load a dataset:
1. Click "Load Dataset" from the Data Management menu
2. Choose your data source (CSV file, database, etc.)
3. Configure column mappings for Case ID, Activity, Timestamp
4. Set any data transformation options
5. Click "Load" to import your data
## Data Requirements
Your dataset must include these minimum columns:
- **Case ID**: Unique identifier for each process instance
- **Activity**: Name of the activity performed
- **Timestamp**: When the activity occurred
Optional columns can include:
- Resource (who performed the activity)
- Additional case or activity attributes
## Example
Loading an invoice process CSV file:
1. Select your CSV file containing invoice data
2. Map "InvoiceID" to Case ID
3. Map "ActivityName" to Activity
4. Map "DateTime" to Timestamp
5. Load the data to begin analysis
---
*This documentation is part of the mindzie Studio process mining platform.*
---
## Sample Datasets
Section: Data Management
URL: https://docs.mindziestudio.com/mindzie_studio/data-management/sample-datasets
Source: /docs-master/mindzieStudio/data-management/sample-datasets/page.md
# Sample Datasets
Download sample event log datasets to explore mindzie Studio's process mining capabilities. Each dataset represents a real-world business process and is ready to import into mindzie Studio.
## Available Datasets
| Dataset | Process Type | Events | Size |
|---------|-------------|--------|------|
| [SAP Segregation of Duties](/mindzie_studio/data-management/sample-datasets/segregation-of-duties) | Compliance / Authorization | 3,281 | 684 KB |
| [SAP Cycle Time Analysis](/mindzie_studio/data-management/sample-datasets/cycle-time-analysis) | Workflow Approvals | 6,227 | 1.4 MB |
| [Procure-to-Pay](/mindzie_studio/data-management/sample-datasets/procure-to-pay) | Procurement | 11,440 | 6.2 MB |
| [Banking Onboarding](/mindzie_studio/data-management/sample-datasets/banking-onboarding) | Customer Onboarding | 113,074 | 19 MB |
| [Order-to-Cash](/mindzie_studio/data-management/sample-datasets/order-to-cash) | Order Fulfillment | 88,924 | 54 MB |
| [Auto Insurance Warranty Claims](/mindzie_studio/data-management/sample-datasets/auto-insurance-warranty-claims) | Insurance Claims | 685,702 | 214 MB |
---
### SAP Segregation of Duties Analysis
A compliance-focused dataset containing 1,950 SAP user accounts with role assignments and detected Segregation of Duties conflicts. Use this dataset to explore how mindzie Studio can identify users holding conflicting permissions across financial processes.
[View details and download](/mindzie_studio/data-management/sample-datasets/segregation-of-duties)
---
### SAP Cycle Time Analysis (Workflow Approvals)
A workflow performance dataset containing 2,000 SAP approval items (purchase orders, purchase requisitions, and invoices) with detailed lifecycle events. Use this dataset to explore approval bottlenecks, deadline breaches, and cycle time patterns.
[View details and download](/mindzie_studio/data-management/sample-datasets/cycle-time-analysis)
---
### Procure-to-Pay Process
Procurement process from requisition to vendor payment with 1,000 enriched cases. Includes pre-calculated metrics and duration categories for immediate analysis. A great starting dataset if you are new to process mining.
[View details and download](/mindzie_studio/data-management/sample-datasets/procure-to-pay)
---
### Banking Onboarding Process
Customer onboarding for banking services including incomplete and requested scenarios. Contains pattern-rich event data with various case variants, SLA tracking, and compliance flags.
[View details and download](/mindzie_studio/data-management/sample-datasets/banking-onboarding)
---
### Order-to-Cash Process
End-to-end order fulfillment and payment collection process covering sales order creation through delivery, invoicing, and payment. Includes credit, delivery, and billing block indicators.
[View details and download](/mindzie_studio/data-management/sample-datasets/order-to-cash)
---
### Auto Insurance Warranty Claims
Insurance claims processing for automotive warranties with fraud detection indicators. The largest dataset available, covering thousands of warranty claims across multiple dealers and regions.
[View details and download](/mindzie_studio/data-management/sample-datasets/auto-insurance-warranty-claims)
---
## How to Import a Sample Dataset
1. Download the `.csv` file from the dataset page
2. In mindzie Studio, go to **Data Management** > **Load Dataset**
3. Select the downloaded `.csv` file
4. Map the columns (Case ID, Activity Name, Timestamp) and import
5. Explore using process maps, filters, calculators, and enrichments
---
## Synthetic Data Generation
Section: Data Management
URL: https://docs.mindziestudio.com/mindzie_studio/data-management/synthetic-data-generation
Source: /docs-master/mindzieStudio/data-management/synthetic-data-generation/page.md
# Generate Synthetic Data
The **Generate Synthetic Data** feature creates entirely new, fabricated datasets that preserve the statistical properties of your original data without containing any actual values from your source. This is useful for:
- **Demos** - Create realistic-looking data to showcase your process mining capabilities
- **Testing** - Generate test datasets with known properties
- **Sharing** - Share data patterns externally without exposing sensitive information
- **Training** - Create training datasets for machine learning models
> **Important:** This is NOT anonymization. Synthetic data is completely fabricated - no original data values exist in the output. The synthetic dataset is safe to share externally.
## How to Access
1. Navigate to the **Datasets** page
2. Click the **three-dot menu** on any dataset
3. Select **Generate Synthetic Data**
## Configuration Options

### Dataset Name
The name for your synthetic dataset. By default, this is set to your source dataset name with " - Synthetic" appended.
### Number of Cases
Specify how many cases to generate in the synthetic dataset:
- **Minimum:** 100 cases
- **Maximum:** 100,000 cases
- **Recommended:** 1,000 - 10,000 cases for demo purposes
Larger datasets take longer to generate and result in bigger file downloads.
### Preserve Activity Names
When enabled (recommended), the synthetic dataset keeps your original activity names like "Submit Order", "Review Application", etc. This produces useful process maps that reflect your actual process flow.
When disabled, activity names are replaced with generic labels like "Activity_1", "Activity_2", etc. Use this option if even your activity names contain sensitive information.
## What Gets Generated
The synthetic data generator analyzes your source dataset and creates new data with:
| Element | How It's Generated |
|---------|-------------------|
| **Case IDs** | New sequential IDs: `Case_1`, `Case_2`, etc. |
| **Activity Names** | Preserved from source (or anonymized if option disabled) |
| **Timestamps** | Realistic dates with similar duration patterns between activities |
| **Text Attributes** | Replaced with generic values like `Customer_1`, `Region_2`, etc. while preserving the distribution (if 60% of cases were "High Priority", approximately 60% of synthetic cases will have `Priority_1`) |
| **Numeric Attributes** | Generated with similar statistical properties (mean, spread, min/max range) |
| **Process Flow** | Activity sequences sampled from your actual process variants |
### What's NOT Included
**Calculated columns** are excluded from the synthetic output since they would be recalculated when you import the data into mindzieStudio.
## Output
When you click **Generate**, mindzieStudio will:
1. Analyze your source data to extract statistical patterns
2. Generate the specified number of synthetic cases
3. Automatically download the result as a CSV file
The download filename matches your Dataset Name with a `.csv` extension.
## Example
**Source data:**
```
CaseId,Activity,Timestamp,Customer,Amount
C001,Submit,2024-01-01 09:00,Acme Corp,1500.00
C001,Review,2024-01-01 11:00,Acme Corp,1500.00
C002,Submit,2024-01-02 10:00,Beta Inc,2300.00
```
**Synthetic output (with Preserve Activity Names enabled):**
```
CaseId,Activity,Timestamp,Customer,Amount
Case_1,Submit,2020-03-15 14:23,Customer_1,1842.37
Case_1,Review,2020-03-15 16:45,Customer_1,1842.37
Case_2,Submit,2020-07-22 09:12,Customer_2,1523.89
```
Notice:
- Activity names are preserved
- Customer names are replaced with generic `Customer_1`, `Customer_2`
- Amounts are similar in range but fabricated
- Timestamps are realistic but entirely new
## Use Cases
### Creating Demo Datasets
Generate synthetic data from your production process to create safe demo datasets that showcase real process patterns without exposing actual business data.
### Sharing with External Consultants
When working with external process mining consultants or vendors, share synthetic datasets that preserve your process characteristics without revealing sensitive information.
### Performance Testing
Generate large synthetic datasets (50,000+ cases) to test how your notebooks and dashboards perform with bigger data volumes.
### Training and Education
Create synthetic datasets for training new team members on process mining concepts using realistic but safe data.
---
## Update Dataset from CSV
Section: Data Management
URL: https://docs.mindziestudio.com/mindzie_studio/data-management/update-dataset-from-csv
Source: /docs-master/mindzieStudio/data-management/update-dataset-from-csv/page.md
# Update Dataset from CSV
## Still stuck? How can we help?
Name:*Email:*Message:*
---
*This documentation is part of the mindzie Studio process mining platform.*


---
## Getting Started: Creating First Project
Section: Demo
URL: https://docs.mindziestudio.com/mindzie_studio/demo/getting-started-creating-first-project
Source: /docs-master/mindzieStudio/demo/getting-started-creating-first-project/page.md
# Getting Started: Creating Your First mindzie studio Project
:::overview
## Overview
This quick-start tutorial will guide you through the essential steps of creating your first project in mindzie studio. You'll learn how to set up a new project from scratch, customize it with a thumbnail image, and assign users with appropriate permissions. This foundational knowledge will prepare you to begin building process mining analyses and dashboards.
By the end of this tutorial, you'll have created a fully configured mindzie studio project ready for data upload and analysis.
:::
## What You'll Learn
- How to access the project creation interface
- The difference between empty projects, project gallery templates, and package uploads
- How to name and create a project
- How to add a custom thumbnail for visual identification
- How to assign users to your project and configure their permission levels
:::prerequisites
## Prerequisites
- Access to mindzie studio with appropriate credentials
- Login permissions to create new projects
- (Optional) A thumbnail image file for project customization
- (Optional) User email addresses if you plan to share the project
:::
## Step 1: Access mindzie studio and Navigate to Projects
1. Log into mindzie studio using your credentials
2. Once logged in, click the **Projects** button in the top navigation bar
3. Click **Add New Project** to open the project creation dialog
You'll be presented with three options for creating a new project.

## Step 2: Choose Your Project Creation Method
mindzie studio offers three ways to start a new project:
### Option 1: Create Empty Project
Start with a blank slate and build your project from the ground up. This option gives you complete control over every aspect of your project configuration. **We'll use this option for this tutorial.**
### Option 2: Upload Package
Import a previously saved mindzie project package. This is useful when migrating projects between environments or restoring backed-up projects.
### Option 3: Project Gallery
Choose from pre-configured project templates that include sample analyses, dashboards, and enrichments. Examples include:
- Insurance Claims Process Intelligence
- IT Service Management (ITSM)
- Order to Cash (O2C)
- Procure to Pay (P2P)
For this tutorial, we'll create an empty project to learn the fundamentals.
## Step 3: Create Your Empty Project
1. Click on **Create Empty Project** in the New Project dialog
2. A **Create Project** form will appear

3. In the **Name** field, enter a descriptive name for your project
- Example: "New Customer Onboarding" or "Invoice Processing Analysis"
- Use a name that clearly identifies the business process you'll be analyzing
4. (Optional) In the **Description** field, add details about the project's purpose
- Describe what process you're analyzing
- Note any specific goals or stakeholders
- Include relevant business context
5. Click **Create** to generate your new project
mindzie studio will create the project and automatically navigate you into it, starting at the data upload screen.
## Step 4: Upload a Project Thumbnail (Optional but Recommended)
Adding a custom thumbnail helps you and your team quickly identify projects in the project gallery. This is especially valuable when managing multiple projects.
1. Navigate back to the **Projects** page by clicking **Projects** in the top navigation
2. Locate your newly created project in the project list
3. Click the **three-dot menu** (•••) in the upper right corner of your project card

4. Select **Upload Thumbnail** from the menu
5. In the file selection dialog, browse to your thumbnail image

6. Select your image file (PNG, JPG, or GIF formats are supported)
7. Click **Open** to upload the thumbnail
The thumbnail will be applied to your project card, making it visually distinct in the project gallery.
:::best-practices
### Best Practices for Thumbnails:
- Use images that represent the business process (e.g., a banking icon for financial processes)
- Keep images simple and recognizable at small sizes
- Maintain consistent visual style across your organization's projects
- Use high-contrast images for better visibility
:::
## Step 5: Assign Users to Your Project
If you're building a project for delivery to stakeholders or collaborating with team members, you'll want to assign users and configure their access levels.
1. From the **Projects** page, click the **three-dot menu** (•••) on your project card again
2. Select **Assign Users** from the menu
3. The **Manage Project Users** dialog will appear

4. In the **Users** dropdown, search for and select users to add to the project
- You can add multiple users at once
- Users must already exist in your mindzie studio instance
5. For each user, configure their permission level:
- **Contributor**: Can add content, create analyses, and build dashboards but cannot modify project settings or delete the project
- **Owner**: Full permissions including project configuration, user management, and project deletion
6. Click the checkmark or **Add** button to assign the selected users
7. Repeat for additional users as needed
8. Click **Close** when finished
:::best-practices
### Permission Level Guidelines:
- Assign **Owner** permissions to process analysts and administrators who need full control
- Assign **Contributor** permissions to team members who will build analyses but shouldn't modify core settings
- End users who only view dashboards typically don't need project-level access (they'll access published dashboards directly)
:::
## Step 6: Verify Your Project Setup
After completing the setup steps, return to the Projects page to verify everything is configured correctly.

Your project should now display:
- The custom name you assigned
- Your uploaded thumbnail image
- The creation date
- Status indicators showing it's ready for use
:::next-steps
## What's Next?
Congratulations! You've successfully created your first mindzie studio project. Your project is now ready for the next steps:
1. **Upload Data**: Import your process data via CSV upload or connect to data sources using mindzie Data Designer
2. **Configure Data Sources**: Map key columns (Case ID, Activity, Timestamp, Resource) for process mining analysis
3. **Build Dashboards**: Create role-specific dashboards for executives, operations teams, and process analysts
4. **Enrich Your Data**: Use the log enrichment engine to add performance metrics, conformance rules, and calculated attributes
5. **Create Analyses**: Build investigations and analysis notebooks to uncover process insights
:::
## Related Topics
- **Uploading and Configuring Data Sources**: Learn how to import CSV files and map data columns
- **Understanding mindzie's Dual Dataset Architecture**: Explore how mindzie transforms raw data into enriched datasets
- **Planning Your Dashboard Structure for Different User Roles**: Design effective dashboard layouts for various stakeholders
:::key-takeaways
## Key Takeaways
- mindzie studio offers three project creation methods: empty projects, package uploads, and gallery templates
- Custom thumbnails improve project identification and organization
- User permissions (Owner vs. Contributor) control access levels and capabilities
- Projects serve as containers for data, analyses, dashboards, and enrichments
- Proper project setup establishes a foundation for successful process mining initiatives
:::
---
**You're now ready to begin your process mining journey with mindzie studio!**
---
## Platform Overview
Section: Getting Started
URL: https://docs.mindziestudio.com/mindzie_studio/getting-started/platform-overview
Source: /docs-master/mindzieStudio/getting-started/platform-overview/page.md
# mindzie Platform Overview
mindzie is a comprehensive process intelligence platform designed for organizations seeking to understand, analyze, and optimize their business processes. Built specifically for process analytics, mindzie combines powerful data transformation capabilities with intuitive analysis tools to deliver actionable insights.
## Why Organizations Choose mindzie
Organizations select mindzie for five key reasons that differentiate the platform in the process intelligence market:
### 1. Affordability
mindzie's pricing is designed to make process intelligence accessible to organizations of all sizes. The platform offers competitive pricing that allows organizations to deploy process analytics across multiple departments and use cases without prohibitive costs.
### 2. Deployment Flexibility
mindzie is truly deployment agnostic, offering multiple deployment options to meet your organization's specific requirements:
- **Cloud**: Fully managed cloud deployment with automatic updates
- **On-Premise**: Complete installed version for organizations requiring full data control
- **Hybrid**: Flexible architecture where data transformation can run locally while analytics run in the cloud
- **Desktop**: Standalone client for individual analysts and smaller deployments
This flexibility makes mindzie particularly attractive to data-sensitive industries such as banking, insurance, healthcare, government, and telecommunications.
### 3. Continuous Process Monitoring
Beyond one-time analysis, mindzie enables continuous process monitoring with:
- Real-time data synchronization
- Automated alerts and notifications
- SLA monitoring and escalation
- Command center-style operational views
Processes are never static, and mindzie helps organizations track process performance over time to ensure improvements are sustained.
### 4. AI Integration
mindzie incorporates AI throughout the platform with configurable options:
- Built-in AI models trained for process analysis
- Option to bring your own AI model (BYOM)
- Support for local LLM deployments for on-premise installations
- AI copilot assistance for analysis and Python code generation
Organizations can enable or disable AI features based on their comfort level and compliance requirements.
### 5. Purpose-Built for Process Analytics
Unlike general business intelligence tools, mindzie is specifically designed for process analysis. Every filter, calculator, and visualization is built around process mining concepts such as:
- Process variants and conformance
- Bottleneck identification
- Cycle time analysis
- Resource utilization
- Rework detection
## Platform Architecture
The mindzie platform follows a structured data flow from source systems through analysis to actionable insights.

The architecture consists of three main phases:
**Process and Operational Excellence**: Data flows from source systems through AI-powered transformation into mindzieStudio for analysis.
**Results**: Analysis outputs are published as dashboards, KPIs, BPMN diagrams, and operational intelligence reports.
**Actions**: Insights trigger system updates, third-party integrations, alerts, notifications, and BI tool connections.
## Data Integration Options
mindzie supports multiple data integration scenarios to accommodate different organizational requirements and security policies.

### Event Log Upload
The simplest approach - upload CSV or XES event log files directly to the platform for immediate analysis. Ideal for quick analysis projects and proof-of-concept work.
### Source Table Export
Export source tables from your systems (Oracle, SAP, SQL Server, etc.) as files. mindzie Data Designer transforms these tables into event logs. This approach works well when direct system connections are not permitted.
### On-Premise Direct Connection
For organizations with on-premise deployments, mindzie Data Designer connects directly to source systems for automated data extraction and transformation.
### Hybrid Deployment
Organizations can deploy mindzie Data Designer locally while using cloud-based mindzieStudio for analysis. Data Designer creates an encrypted connection to the cloud, keeping sensitive data processing on-premise while leveraging cloud analytics capabilities.
### Cloud-to-Cloud
Connect cloud-based source systems directly to mindzie's cloud platform for fully managed data pipelines.
### Third-Party ETL Integration
Organizations using existing ETL tools can push data directly into mindzie via API. Connectors are available for platforms like MuleSoft.
## mindzieStudio Architecture
mindzieStudio is the analysis environment where process intelligence work happens.

### Data Flow
1. **Dataset**: Raw data arrives from manual upload, mindzie Data Designer, third-party ETL tools, developer upload, or API integration
2. **Enriched Dataset**: The log enrichment engine automatically enhances your data with calculated attributes, timing metrics, conformance flags, and more
3. **Investigations**: Organize your analysis work into logical folders (by process, department, or project)
4. **Analysis**: Create multiple analysis within each investigation using filters and calculators
5. **Actions**: Configure automated responses based on analysis results, including API calls to third-party systems
## Projects
Projects provide organization and portability for your process intelligence work.

Key project capabilities:
- **Organization**: Group related work by business process, department, or customer
- **Sharing**: Share projects with team members and set permissions
- **Templates**: Save project configurations as packages for reuse
- **Portability**: Export project packages and import them into other mindzie environments (useful for on-premise deployments where consultants can build configurations offline)
## Log Enrichment Engine
The log enrichment engine is a powerful feature that transforms your raw event data into analysis-ready datasets.

### Automatic Enrichments
mindzie automatically calculates and adds attributes including:
- **Timing**: Case duration, activity duration, idle times
- **Temporal**: Case start day, month, quarter, year, day of week
- **Resources**: First resource, last resource per case
- **Counts**: Number of activities, activities used
- **Conformance**: Conformance issues, variance indicators
### Custom Enrichments
Beyond automatic enrichments, you can add:
- **Performance Labels**: Automatically categorize cases as fast, normal, or slow based on configurable thresholds
- **Activity Pairings**: Calculate time between specific activity combinations
- **Cost Calculations**: Add activity costs and calculate total process costs
- **Conformance Rules**: Define what should or should not happen in your process
- **Python Extensions**: Write custom Python code for complex calculations with AI copilot assistance
The enrichment engine enables business users to work with simplified concepts (like "show me slow cases") rather than remembering specific numeric thresholds.
## Analysis Interface
mindzie uses a Jupyter notebook-style interface where analysis is built using blocks that flow data from top to bottom.

### Block-Based Analysis
Each analysis consists of blocks that can be:
- **Filters**: Narrow down data by attributes, variants, time periods, or custom criteria
- **Calculators**: Generate visualizations, metrics, and insights
- **Notes**: Document findings and add context
Blocks are chained together - the output of one block becomes the input for the next. This allows for progressive filtering and analysis refinement.
### Key Capabilities
- Drag and drop block reordering
- Duplicate blocks to create comparison analysis
- Save analysis as templates for reuse
- Push metrics to dashboards
- Export visualizations and data
### Analysis Templates
A library of pre-built analysis templates helps you get started quickly:
- Process overview
- Variant analysis
- Bottleneck identification
- Conformance checking
- Resource analysis
- Automation potential assessment
## Dashboards and Apps
Analysis results can be published to dashboards and apps for broader organizational consumption.
### Dashboards
Dashboards aggregate metrics and visualizations from multiple analysis into executive-ready views. Features include:
- Drag and drop layout
- Shareable links
- Drill-through to underlying analysis
- Text annotations and insights
- Export capabilities
### Apps
Apps provide simplified interfaces for specific user groups. They combine dashboards, analysis views, and interactive elements into focused experiences without exposing the full analysis complexity.
## Real-Time Process Flow Monitor
For organizations doing continuous process monitoring, the Real-Time Process Flow Monitor provides command center-style visibility.

### Features
- **Visual Pipeline**: See cases flowing through critical process stages
- **SLA Indicators**: Color-coded status (green/yellow/red) based on configurable thresholds
- **Case Counts**: Real-time counts at each stage
- **Drill-Down**: Click any stage to see individual cases
- **Actions**: Take action directly from the monitor (email, Teams, text messages)
This feature was originally designed for healthcare patient flow monitoring and is now used across industries including insurance claims processing, customer onboarding, and order fulfillment.
## Actions Engine
The Actions Engine automates responses based on process insights.
### Trigger Types
- Metric thresholds (e.g., when average cycle time exceeds X)
- Schedule-based (daily, weekly, monthly reports)
- Event-based (new cases meeting specific criteria)
### Action Types
- Email notifications
- Microsoft Teams messages
- Text messages (SMS)
- Webhook calls to third-party systems
- Report generation and distribution
## BPMN Editor
mindzie includes a full BPMN 2.0 editor for process modeling and documentation.

### Capabilities
- Generate BPMN diagrams automatically from process data
- Edit and annotate generated diagrams
- Create new diagrams from scratch
- Export BPMN 2.0 compatible files
- Integrate with enterprise architecture tools
Some organizations use this feature to automatically refresh process diagrams in their enterprise architecture repositories, ensuring documentation stays current with actual process execution.
## Security and Compliance
mindzie is built for data-sensitive industries with comprehensive security features:
### Data Security
- Multi-tenant architecture with per-tenant encryption keys
- Data anonymization tools for obfuscating sensitive fields
- Role-based access control
- Audit logging
### Compliance
- Annual penetration testing
- Third-party security auditing
- Security documentation and guides available
- Support for air-gapped on-premise deployments
### AI Privacy
AI features can be:
- Disabled entirely for organizations not permitted to use AI
- Configured to use organization-provided AI models
- Pointed to local LLM servers for fully on-premise AI
## Getting Started
Now that you understand the mindzie platform, here are recommended next steps:
1. **[User Login](../user-login)**: Learn how to access your mindzie environment
2. **[Projects](../../application-guide/projects)**: Understand how to organize your work
3. **[Data Overview](../../application-guide/data-overview)**: Learn about working with datasets
4. **[Log Enrichment](../../enrichments)**: Explore data enrichment capabilities
5. **[Filters](../../filters)**: Master data filtering techniques
6. **[Calculators](../../calculators)**: Discover visualization and analysis options
## Support
If you have questions about mindzie:
- Email: support@mindzie.com
- Visit: [mindzie.com](https://mindzie.com)
---
## User Login
Section: Getting Started
URL: https://docs.mindziestudio.com/mindzie_studio/getting-started/user-login
Source: /docs-master/mindzieStudio/getting-started/user-login/page.md
# mindzieStudio User Login Manual
**Version:** 1.0
**Date:** September 2025
**Audience:** All mindzieStudio Users
## Introduction
This guide explains how to access mindzieStudio based on your organization's authentication setup. mindzieStudio supports two authentication methods:
- **Identity Authentication**: Traditional email and password login
- **Microsoft Authentication**: Sign in using your organization's Microsoft/Azure AD account
Your experience depends on how your organization has configured authentication and whether you're accessing the system for the first time or returning with saved login credentials.
## Quick Reference - How Do I Log In?
```
Do you already have a bookmark or direct company link?
├─ YES → Use your company URL: www.mindziestudio.com/company/[your-org]
└─ NO → Go to main site: www.mindziestudio.com
├─ See email/password form? → You use Identity authentication
└─ Need to click "Continue with Microsoft"? → You use Microsoft authentication
Are you already logged in from the last 7 days?
├─ YES → You'll skip the login screen entirely
└─ NO → Follow the appropriate login flow below
```
## Login Scenarios
### Scenario A: Identity Users (Email & Password)
**Who this applies to:** Organizations using mindzieStudio's built-in authentication system
**Where to go:** www.mindziestudio.com

#### Steps:
1. **Navigate** to www.mindziestudio.com
2. **Enter** your email address in the Email field
3. **Enter** your password in the Password field
4. **Click** "Log in" button
5. **Result depends on your access:**
- **Single organization access:** You'll go directly to your dashboard
- **Multiple organization access:** You'll see a tenant selection screen
**Remember Me Option:**
- Check "Remember me" to stay logged in for 7 days
- Your login will be remembered across browser sessions
---
### Scenario B: Microsoft/Azure AD Users (Email Verification)
**Who this applies to:** Organizations using Microsoft/Office 365 authentication
**Where to go:** www.mindziestudio.com
#### Steps:
1. **Navigate** to www.mindziestudio.com
2. **Click** the "Continue with Microsoft" button
3. **Enter your work email address** in the prompt
4. **Check your email** for a login verification message
5. **Click the link** in your email (link expires in 15 minutes)
6. **Complete Microsoft authentication** when redirected to your organization's login
7. **Access your dashboard** after successful authentication
**Important Security Notes:**
- **No email received?** Your email address may not be registered in the system
- **Wrong email entered?** You won't receive any confirmation for security reasons
- **Generic email content:** The email will not reveal your organization name for security
#### Email Example:
```
Subject: mindzieStudio Login Request
If your organization uses mindzieStudio, click below to sign in:
[Click here to sign in]
If you didn't request this or your organization doesn't use mindzieStudio,
you can safely ignore this email.
Link expires in 15 minutes.
```
---
### Scenario C: Service Accounts (Support Staff & Consultants)
**Who this applies to:** mindzie support staff, partner consultants, and users with multi-tenant access
**Authentication Method:** Same as your home organization (Identity or Microsoft)
#### Additional Steps After Authentication:
1. **Complete** normal authentication flow (Scenario A or B above)
2. **Select target organization** from the tenant selection screen
3. **Access** the selected organization's environment
**Key Differences:**
- You authenticate using your home organization's method
- After authentication, you can choose which customer organization to access
- All service account access is logged for security and audit purposes
---
### Scenario D: Company URL Direct Access
**Who this applies to:** Users with bookmarks or direct links to their organization
**Where to go:** www.mindziestudio.com/company/[your-organization-code]
#### Benefits:
- Skip the discovery process
- Go directly to your organization's authentication method
- Fastest login method if you have the direct link
**How to get your company URL:**
- Check your welcome email from when your account was created
- Ask your IT administrator
- Look for previous login emails that may contain the link
- Contact mindzieStudio support if needed
---
## Cookie Persistence & "Remember Me" (7-Day Login)
### When You WON'T See Login Screens
If any of these conditions are true, you'll skip the login process entirely:
- ✓ You checked "Remember me" during your last login
- ✓ It's been less than 7 days since your last login
- ✓ You're using the same browser and haven't cleared cookies
- ✓ You haven't explicitly logged out
**What You'll See Instead:**
- Direct redirect to your dashboard
- No login form displayed
- Immediate access to your workspace
### When You WILL See Login Screens
- ✗ More than 7 days have passed since last login
- ✗ You clicked "Logout"
- ✗ You cleared your browser cookies/data
- ✗ You're using a different browser or device
- ✗ You're using private/incognito browsing mode
### Managing Your Login Sessions
**To stay logged in longer:**
- Always check "Remember me" when logging in
- Don't clear browser cookies
- Use the same browser regularly
**To force a fresh login:**
- Click "Logout" from within mindzieStudio
- Clear your browser cookies
- Use private/incognito browsing
---
## Multi-Tenant Selection
### When This Applies
You'll see a tenant selection screen if:
- ✓ You have access to multiple organizations
- ✓ You're a service account user
- ✓ You're a consultant working with multiple clients
### How It Works
1. **Complete authentication** using either Identity or Microsoft login
2. **See organization list** showing all organizations you can access
3. **Click** on the organization you want to work with
4. **Access** that organization's environment
**For Service Accounts:**
- Your most recently accessed organization may be pre-selected
- You can switch between organizations without re-authenticating
- All access is logged for security compliance
---
## Troubleshooting Common Issues
### "I clicked 'Continue with Microsoft' but didn't receive an email"
**Possible Causes:**
- Your email address is not registered in the mindzieStudio system
- Your organization doesn't use Microsoft authentication
- Email went to spam/junk folder
**Solutions:**
- Check your spam/junk folder
- Verify you entered your work email correctly
- Contact your IT administrator to confirm your account exists
- Try using a company URL if you have one
### "The login link in my email expired"
**What happened:** Email login links expire after 15 minutes for security
**Solution:**
- Go back to www.mindziestudio.com
- Click "Continue with Microsoft" again
- Enter your email to receive a new link
### "I'm seeing the wrong organization or tenant"
**For Multi-Tenant Users:**
- Use the tenant selection screen to choose the correct organization
- Contact your administrator if you don't see an expected organization
**For Single-Tenant Users:**
- Contact your IT administrator - your access may need to be updated
### "I can't find my company URL"
**Where to look:**
- Check your original welcome email
- Look for previous login confirmation emails
- Ask your IT department for the correct URL
- Contact mindzieStudio support with your organization name
### "My password doesn't work"
**For Identity Users:**
- Click "Forgot your password?" on the login screen
- Check that you're using the main site (www.mindziestudio.com)
- Verify your email address is correct
**For Microsoft Users:**
- Password resets are handled by your organization's IT department
- Contact your IT administrator for password assistance
- Try using "Continue with Microsoft" instead of the password field
### "I keep getting logged out"
**Common Causes:**
- You didn't check "Remember me" during login
- Your browser is clearing cookies automatically
- Your organization has short session timeouts configured
**Solutions:**
- Always check "Remember me" when logging in
- Check your browser cookie settings
- Contact your IT administrator about session timeout policies
---
## Security Best Practices
### For All Users
- ✓ Always log out on shared computers
- ✓ Don't share your login credentials
- ✓ Report suspicious login emails to your IT department
- ✓ Use strong passwords (Identity users)
- ✓ Keep your browser updated
### For Microsoft Authentication Users
- ✓ Only click login links from emails you requested
- ✓ Verify the link goes to your organization's Microsoft login
- ✓ Be cautious of phishing emails mimicking mindzieStudio
### For Service Account Users
- ✓ Always log out completely when done
- ✓ Be aware that your access is logged and monitored
- ✓ Only access customer organizations you're authorized for
---
## Getting Help
### First Try
1. **Check this guide** for your specific scenario
2. **Try the troubleshooting section** above
3. **Ask a colleague** who successfully uses mindzieStudio
### Need More Help?
**For login and access issues:**
Contact your **IT administrator** first
They can verify your account status and authentication method
**For mindzieStudio support:**
Email: **support@mindzie.com**
Include: Your email address and organization name
⚠️ **DO NOT include your password in support emails**
**For urgent issues:**
Contact your IT department's helpdesk
They may be able to reset your access immediately
---
## Appendix: Visual Guide
### Login Screen Elements
Based on the screenshot provided:
1. **mindzie Logo** - Top left, confirms you're on the correct site
2. **Email Field** - Enter your work email address here
3. **Password Field** - For Identity users only
4. **Remember me checkbox** - Check for 7-day login persistence
5. **Log in button** - For Identity authentication
6. **Forgot your password?** - For Identity users who need password reset
7. **Continue with Microsoft button** - For Microsoft/Azure AD authentication
### What the Screen Tells You
- **See password field + "Continue with Microsoft"?** → Multi-tenant system, choose your method
- **See only password field?** → Identity-only system
- **See only "Continue with Microsoft"?** → Microsoft-only system
- **See dashboard immediately?** → You're already logged in (cookies active)
---
*Last Updated: September 2025*
*Document Version: 1.0*
---
## Overview
Section: Visualization
URL: https://docs.mindziestudio.com/mindzie_studio/visualization/overview
Source: /docs-master/mindzieStudio/visualization/overview/page.md
# Visualization
## Overview
The Visualization section provides comprehensive guidance for creating and customizing visual representations of your process mining data in mindzieStudio. Transform complex process data into clear, actionable insights through powerful visualization tools.
## Who Should Use This Section
This documentation is intended for:
- **Business Analysts** - Creating visual reports and dashboards
- **Process Mining Specialists** - Analyzing process flows and bottlenecks
- **Data Analysts** - Building custom visualizations for stakeholder communication
## Visualization Capabilities
mindzieStudio offers a rich set of visualization tools to help you understand and communicate process insights effectively.
## Getting Started
1. **Understand Your Data** - Know what process metrics you want to visualize
2. **Choose the Right Visualization** - Select the most effective visual representation for your insights
3. **Customize for Your Audience** - Tailor visualizations to your stakeholders' needs
4. **Iterate and Refine** - Continuously improve your visualizations based on feedback
## Best Practices
- Start with simple visualizations before adding complexity
- Use consistent color schemes and layouts across related visualizations
- Focus on the insights you want to communicate, not just the data
- Test visualizations with your target audience to ensure clarity
- Document your visualization choices and configurations
## Additional Resources
- [Process Discovery Overview](../process-discovery/overview/page.md)
- [Data Management](../data-management/overview/page.md)
---
## Overview
Section: Actions
URL: https://docs.mindziestudio.com/mindzie_studio/actions/overview
Source: /docs-master/mindzieStudio/actions/overview/page.md
# Actions
Actions in mindzieStudio allow you to automate tasks based on your process mining data. You can schedule reports to be sent automatically, run data imports, execute Python scripts, and more.
## Overview
Actions are automated workflows that run on a schedule or on-demand. Each action consists of four components:
1. **General** - Name and description for the action
2. **Data** - The analysis data the action will use
3. **Action Steps** - What the action will do (send reports, run scripts, etc.)
4. **Triggers** - When the action will run (schedule)
## Creating an Action
To create a new action, click **Add New Action** in the top right corner of the Actions screen.
### Step 1: General
The General step is where you define the basic information for your action.

**Name** (Required): Enter a descriptive name for your action, such as "Executive Weekly Report" or "Daily Data Import".
**Description** (Optional): Add additional details about what this action does and why it exists.
### Step 2: Data
The Data step allows you to select which analysis data the action will use. Click the **+** button to open the analysis selection dialog.

You can select analyses from any investigation in your project. The available analyses include:
- Activities and Activity Steps
- Bottlenecks and Delays
- Case Duration metrics
- Process Variants
- Resources and Staff information
- And many more
After selecting your analyses, they appear in a list showing the Analysis Name, Investigation Name, and who created them.

**Note**: Most action steps require analysis data, but not all. Some action steps like Error & Warning Report work at the project level.
### Step 3: Action Steps
Action Steps define what the action will do. Click the **+** button to add an action step.

Available action step types:
| Action Step | Description | Category |
|-------------|-------------|----------|
| **AI Automatic Report** | Generate AI-powered reports using your analysis data | Email |
| **Error & Warning Report Email** | Send reports of errors and warnings from executed notebooks | Email |
| **Grid Email** | Send data tables from your analyses via email | Email |
| **Python Script** | Execute custom Python code with access to your data | Code |
| **Run Data Designer Project** | Run a mindzieDataDesigner project to import data | Misc |
Each action step type has its own configuration options. See the individual documentation pages for detailed information:
- [AI Automatic Report](../ai-automatic-report)
- [Error & Warning Report](../error-warning-report)
- [Grid Email](../grid-email)
- [Python Script](../python-script)
- [Data Designer Project](../data-designer-project)
### Step 4: Triggers
Triggers define when the action will run. You can set up scheduled execution using the Daily Scheduler.

**Start Date**: The date when the action schedule begins.
**Time of Day**: The time (in your local timezone) when the action will run.
**Days of the Week**: Select which days the action should run. For example, select only Monday to run a weekly report every Monday morning.
Common scheduling patterns:
- **Weekly reports**: Run on Monday at 7:00 AM
- **Daily imports**: Run every day at 6:00 AM before business hours
- **Monthly summaries**: Run on the first Monday of each month
## Managing Actions
After creating an action, it appears in the Actions list.

The Actions list shows:
| Column | Description |
|--------|-------------|
| **Name** | The action name |
| **Steps** | Number of action steps configured |
| **Triggers** | Number of triggers configured |
| **Last Run Time** | When the action last executed |
| **Last Run Result** | Success or failure status |
| **Next Run Time** | When the action will run next |
| **Created Date** | When the action was created |
| **Created By** | Who created the action |
| **Active** | Whether the action is enabled |
### Action Controls
Each action row has several control buttons:
- **Run** (play icon): Execute the action immediately for testing
- **History** (clock icon): View the execution history and results
- **Edit** (pencil icon): Modify the action configuration
- **Menu** (three dots): Additional options including Disable and Delete
### Running an Action Manually
Click the **Run** button to execute an action immediately. This is useful for:
- Testing a new action before scheduling it
- Running an action outside its normal schedule
- Verifying changes to an action work correctly
### Viewing Action History
Click the **History** button to see when the action has run and whether each execution succeeded or failed. This helps you:
- Monitor action reliability
- Troubleshoot failed executions
- Verify scheduled actions are running as expected
### Disabling an Action
Use the three-dot menu to temporarily disable an action. A disabled action:
- Remains in your action list
- Retains all configuration
- Does not run on schedule
- Can be re-enabled at any time
This is useful when you need to pause an action without deleting it.
## Best Practices
1. **Use descriptive names**: Name actions clearly so you can identify them later (e.g., "Weekly Executive Report - Monday 7am")
2. **Test before scheduling**: Always use the Run button to test new actions before relying on scheduled execution
3. **Monitor execution**: Check the Actions list periodically to ensure your actions are running successfully
4. **Schedule strategically**: Run data imports before report generation, and schedule reports to arrive when stakeholders need them
5. **Use Error & Warning reports**: Set up an Error & Warning Report for project owners to catch issues early
## Support
If you encounter issues with Actions:
- Email: support@mindzie.com
- Check the action history for error details
- Verify your analysis data is still valid and accessible
---
## AI Automatic Report
Section: Actions
URL: https://docs.mindziestudio.com/mindzie_studio/actions/ai-automatic-report
Source: /docs-master/mindzieStudio/actions/ai-automatic-report/page.md
# AI Automatic Report
The AI Automatic Report action step uses artificial intelligence to generate comprehensive reports from your process mining data. The AI analyzes your selected analyses and creates a well-structured report with summaries, insights, and recommendations.
## Overview
When you configure an AI Automatic Report, the system:
1. Collects data from all your selected analyses
2. Sends this data to an AI language model
3. Generates a formatted HTML report based on your instructions
4. Emails the report to your specified recipients
This is ideal for executive summaries, regular status updates, and stakeholder communications where you need professional-quality reports without manual writing.
## When to Use AI Automatic Report
Use AI Automatic Report when you need:
- Weekly or monthly executive summaries
- Automated status reports for stakeholders
- Regular process performance updates
- Reports in multiple languages
- Professional narrative explanations of your data
## Configuration
To add an AI Automatic Report to your action, click the **+** button in the Action Steps section and select **AI Automatic Report**.

### Basic Settings
**Subject** (Required): The email subject line. This appears in recipients' inboxes and should clearly identify the report.
Example: "Weekly Executive Process Report - Banking Operations"
**Body** (Optional): Additional text to include in the email body before the report. Most users leave this empty as the AI-generated report contains all necessary content.
**Users**: Select the email addresses that will receive this report. You can add multiple recipients.
**Language**: Select the language for the generated report. The AI will write the entire report in your selected language, making it easy to distribute reports to international teams.
### AI Model Settings
**Model**: Choose which AI model to use for report generation.
- **Use default model**: Uses the AI model configured in your tenant settings
- **Specific model**: Select a particular model if you have multiple configured (e.g., GPT-5.1, Claude, etc.)
Different models may produce different writing styles and levels of detail.
### Display Options
**Hide Analysis Details**: When unchecked (default), each analysis becomes a section in the report with:
- A summary of what the analysis shows
- Detailed explanation of the findings
- Visual representation if applicable
When checked, the report focuses only on high-level insights without individual analysis breakdowns.
**Hide Table of Contents**: When unchecked (default), the report includes a table of contents for easy navigation. Check this option for shorter reports where navigation is unnecessary.
### Instructions
The Instructions field is where you tell the AI what kind of report you want. This is essentially your prompt to the language model.
Write clear, specific instructions about:
- The report's purpose and audience
- What insights you want highlighted
- The tone and style (formal, conversational, technical)
- Any specific questions you want answered
**Example instruction:**
```
Give me a report for the executives with the most relevant improvements to increase process performance. Focus on actionable recommendations and quantify the potential impact where possible.
```
### Sections
Sections allow you to add specific topics or questions to your report. Each section becomes a dedicated part of the generated report.

To add a section:
1. Click **Add New Section**
2. Enter a **Title** (this becomes the section heading)
3. Enter **Instructions** for what this section should contain
**Example section:**
| Field | Value |
|-------|-------|
| Title | Rework |
| Instructions | Explain rework in this process and tell me what I can do about it |
You can add multiple sections to create a structured report covering all the topics you need.
## Report Output
The AI generates an HTML email report that includes:
1. **Executive Summary**: High-level overview based on your main instructions
2. **Table of Contents**: Navigation links (unless hidden)
3. **Analysis Sections**: Each selected analysis with AI-generated summaries
4. **Custom Sections**: Your additional sections with specific insights
5. **Recommendations**: Actionable suggestions based on the data
The report is formatted professionally with:
- Clear headings and structure
- Data visualizations where applicable
- Color-coded highlights for important findings
- Mobile-friendly responsive design
## Best Practices
1. **Be specific in instructions**: Vague instructions produce generic reports. Tell the AI exactly what you need.
2. **Match analysis to purpose**: Select analyses that contain data relevant to your report topic. Including unrelated analyses adds noise.
3. **Use sections strategically**: Add sections for topics that might not emerge naturally from the data, like specific KPIs or compliance requirements.
4. **Consider your audience**: Adjust language complexity and detail level based on whether recipients are executives, analysts, or operators.
5. **Test with manual runs**: Before scheduling, use the Run button to generate a test report and verify it meets your needs.
6. **Schedule appropriately**: Send reports when recipients will read them - Monday morning for weekly summaries, first of the month for monthly reviews.
## Example Configurations
### Executive Weekly Summary
| Setting | Value |
|---------|-------|
| Subject | Weekly Process Performance - [Date] |
| Language | English |
| Model | Default |
| Hide Analysis Details | Unchecked |
| Hide Table of Contents | Unchecked |
| Instructions | Create an executive summary focusing on key performance indicators, trends compared to last week, and top 3 recommendations for improvement. Keep language concise and business-focused. |
### Operations Team Report
| Setting | Value |
|---------|-------|
| Subject | Daily Operations Report |
| Language | English |
| Model | Default |
| Hide Analysis Details | Unchecked |
| Hide Table of Contents | Checked |
| Instructions | Provide a detailed operations report highlighting bottlenecks, delays, and any anomalies detected in yesterday's process execution. Include specific case IDs where issues occurred. |
### Multi-Language Report
| Setting | Value |
|---------|-------|
| Subject | Rapport hebdomadaire |
| Language | French |
| Model | Default |
| Instructions | (Write in English - AI translates) Summarize this week's process performance for the Paris office. Focus on compliance metrics and customer-facing process times. |
## Troubleshooting
### Report is too generic
- Add more specific instructions
- Include sections with targeted questions
- Select more relevant analyses with detailed data
### Report is missing expected content
- Verify the selected analyses contain the data you expect
- Check that analyses have been run recently and contain current data
- Add explicit sections for topics you need covered
### Report takes too long to generate
- Reduce the number of selected analyses
- Use a faster AI model
- Simplify instructions to reduce processing
### Recipients not receiving reports
- Verify email addresses are correct
- Check spam/junk folders
- Confirm the action is enabled and scheduled correctly
- Review action history for any execution errors
## Related Documentation
- [Actions Overview](../overview)
- [Error & Warning Report](../error-warning-report)
- [Grid Email](../grid-email)
## Support
If you encounter issues with AI Automatic Reports:
- Email: support@mindzie.com
- Check action history for detailed error messages
- Verify your AI model configuration in tenant settings
---
## AI Insights Report (Alpha)
Section: Actions
URL: https://docs.mindziestudio.com/mindzie_studio/actions/ai-insights-report
Source: /docs-master/mindzieStudio/actions/ai-insights-report/page.md
# AI Insights Report (Alpha)
The AI Insights Report action step generates a comprehensive process analysis with multiple sections covering metrics, bottlenecks, variants, trends, and recommendations. Results are cached in an "Insights" folder in your project for reuse.
> **Alpha Feature**: This feature is currently in alpha testing and is only available
> to tenants with PreRelease enabled. Functionality may change before general release.
## Overview
When you configure an AI Insights Report, the system:
1. Analyzes your enriched dataset
2. Generates 12 comprehensive analysis sections using AI
3. Caches results for fast retrieval on subsequent runs
4. Optionally sends the report via email to selected users
The AI Insights Report serves as a foundation for other AI reports (Process Analyst, GRC, SOP Framework), which can be included as optional attachments.
## When to Use AI Insights Report
Use AI Insights Report when you need:
- A comprehensive analysis of your process data
- Automated identification of bottlenecks and inefficiencies
- Variant analysis and conformance insights
- Root cause analysis for process issues
- Trend identification over time
- A starting point for deeper analysis with other AI reports
## Report Sections
The AI Insights Report generates the following analysis sections:
| Section | Description |
|---------|-------------|
| Event Log Quality | Data quality assessment including completeness and consistency |
| Basic Statistics | Case counts, event counts, timeframes, and activity summaries |
| Process Model | Discovered process flow and activity relationships |
| Bottleneck Analysis | Identification of delays and processing bottlenecks |
| Case Duration | Duration statistics and distribution analysis |
| Variant Analysis | Process path variations and their frequencies |
| Root Cause Analysis | AI-identified factors contributing to issues |
| Resource Analysis | Workload distribution and resource utilization |
| Rework Analysis | Repeated activities and rework patterns |
| Conformance | Deviations from expected process behavior |
| Time Trends | Temporal patterns and seasonality |
| Recommendations | AI-generated improvement suggestions |
## Configuration
To add an AI Insights Report to your action, click the **+** button in the Action Steps section and select **AI Insights Report**.
### Dataset Selection
**Dataset to Analyze** (Required): Select the enriched dataset you want to analyze. Only datasets that have been through the enrichment pipeline are available.
If no datasets appear, you need to:
1. Go to the Data Designer
2. Run the enrichment pipeline on your dataset
3. Return to configure this action step
### Force Regenerate Option
**Force Regenerate**: Controls whether to regenerate analysis sections that already exist.
- **Unchecked** (default): Skips sections that have already been generated. This is faster for subsequent runs when you only need to refresh specific parts.
- **Checked**: Regenerates all 12 sections from scratch, even if cached versions exist.
Use Force Regenerate when:
- Your underlying data has changed significantly
- You want to capture updated metrics
- Previous generation had issues
### Additional AI Reports (Optional)
The AI Insights Report can include additional reports as attachments:
**Process Analyst Report**: Generates an executive-ready improvement report with:
- Top 5 prioritized improvement initiatives
- Quantified business impact (time savings, cost reduction)
- Effort/Impact matrix for decision-making
- Automation opportunities
- Recommended KPIs to track
**GRC Compliance Report**: Generates a Governance, Risk, and Compliance report with:
- Compliance dashboard with heat map by category
- Control-by-control violation analysis
- Risk level assessment
- Exportable case violation list
**SOP Framework Document**: Generates a Standard Operating Procedure Word document (when available).
When you select **SOP Framework Document**, you can optionally specify a **Process Name for SOP**. If left blank, the dataset name is used.
### Email Configuration (Optional)
**Send report to**: Select users who should receive the generated reports via email. Leave empty to skip email delivery.
All selected additional reports are attached to a single email along with the main Insights Report.
## How It Works
1. **Analysis Phase**: The system analyzes your dataset and generates each section using AI
2. **Caching**: Results are saved to an "Insights" folder in your project
3. **Assembly**: Sections are compiled into a formatted report
4. **Distribution**: If email recipients are configured, the report is sent
### Report Output
The report includes:
- Executive summary
- Section-by-section analysis
- Visualizations where applicable
- AI-generated recommendations
### Caching Behavior
Reports are cached at the section level:
- Each of the 12 sections is stored separately
- Unchanged sections load from cache
- Modified data triggers regeneration of affected sections
- Use Force Regenerate to clear all caches
## Best Practices
1. **Prepare your data**: Ensure your dataset has been enriched before running the report
2. **Start with default settings**: Run without Force Regenerate first to see results quickly
3. **Use additional reports strategically**: Only include Process Analyst or GRC reports if you need those specific analyses
4. **Schedule appropriately**: For regular updates, schedule the action to run after data refreshes
5. **Review incrementally**: Check the Insights folder to see individual section outputs
## Example Configuration
### Weekly Process Health Report
| Setting | Value |
|---------|-------|
| Dataset | Production Order Process (Enriched) |
| Force Regenerate | Unchecked |
| Include Process Analyst Report | Checked |
| Include GRC Report | Unchecked |
| Email Recipients | operations-team@company.com |
### Monthly Compliance Review
| Setting | Value |
|---------|-------|
| Dataset | Invoice Processing (Enriched) |
| Force Regenerate | Checked |
| Include Process Analyst Report | Unchecked |
| Include GRC Report | Checked |
| Email Recipients | compliance@company.com, finance-lead@company.com |
## Troubleshooting
### No datasets available
**Solution**: Ensure you have at least one enriched dataset. Go to Data Designer and run the enrichment pipeline.
### Report takes a long time
**Solution**:
- First run generates all 12 sections, which takes longer
- Subsequent runs are faster due to caching
- Very large datasets require more processing time
### Some sections are missing
**Solution**: Check if Force Regenerate is unchecked and the section was previously skipped due to errors. Use Force Regenerate to regenerate all sections.
### Email not received
**Solution**:
- Verify email addresses are correct
- Check spam/junk folders
- Confirm the action completed successfully in action history
- Ensure email is configured for your tenant
## Related Documentation
- [Actions Overview](../overview)
- [AI Process Analyst Report (Alpha)](../ai-process-analyst-report) - Executive improvement recommendations
- [AI GRC Report (Alpha)](../ai-grc-report) - Compliance and risk analysis
- [AI Automatic Report](../ai-automatic-report) - Custom AI-generated reports
## Support
If you encounter issues with AI Insights Report:
- Email: support@mindzie.com
- Include: Dataset name, error messages, and expected vs actual behavior
- Note this is an Alpha feature - feedback helps improve it before general release
---
## AI Process Analyst Report (Alpha)
Section: Actions
URL: https://docs.mindziestudio.com/mindzie_studio/actions/ai-process-analyst-report
Source: /docs-master/mindzieStudio/actions/ai-process-analyst-report/page.md
# AI Process Analyst Report (Alpha)
The AI Process Analyst Report action step generates an executive-ready process improvement report with prioritized initiatives, quantified business impact, and actionable recommendations.
> **Alpha Feature**: This feature is currently in alpha testing and is only available
> to tenants with PreRelease enabled. Functionality may change before general release.
## Overview
When you configure an AI Process Analyst Report, the system:
1. Analyzes your enriched dataset
2. Synthesizes insights from the underlying data
3. Generates prioritized improvement initiatives with ROI estimates
4. Creates an effort/impact matrix for decision-making
5. Emails the report to specified recipients
This report is designed for executive stakeholders and decision-makers who need actionable insights without diving into detailed process mining data.
## When to Use AI Process Analyst Report
Use AI Process Analyst Report when you need:
- Executive summaries for leadership meetings
- Prioritized improvement recommendations
- Business impact quantification (time savings, cost reduction)
- Effort vs. impact analysis for project planning
- Automation opportunity identification
- KPI recommendations for tracking improvements
## Report Content
The AI Process Analyst Report includes:
### Top 5 Improvement Initiatives
Prioritized list of the most impactful improvements, each including:
- Clear description of the improvement opportunity
- Root cause analysis
- Recommended actions
- Expected benefits
### Quantified Business Impact
For each initiative:
- **Time Savings**: Estimated reduction in processing time
- **Cost Reduction**: Potential cost savings
- **Efficiency Gains**: Productivity improvements
- **Quality Impact**: Error reduction potential
### Effort/Impact Matrix
Visual classification of initiatives by:
- **Effort**: Low, Medium, High implementation effort
- **Impact**: Low, Medium, High business impact
- **Priority**: Quick wins, strategic initiatives, fill-ins
### Automation Opportunities
Identification of processes or tasks suitable for:
- Robotic Process Automation (RPA)
- Workflow automation
- Decision automation
- Integration improvements
### Recommended KPIs
Key Performance Indicators to track, including:
- Baseline measurements
- Target values
- Monitoring frequency
- Data sources
## Configuration
To add an AI Process Analyst Report to your action, click the **+** button in the Action Steps section and select **AI Process Analyst Report**.
### Dataset Selection
**Dataset to Analyze** (Required): Select the enriched dataset you want to analyze. Only datasets that have been through the enrichment pipeline are available.
### Report Language
**Report Language**: Select the language for the generated report. The AI writes the entire report in your selected language.
Available languages:
- English (default)
- German
- French
- Spanish
- Portuguese
- Italian
- Dutch
- And others as configured
### Email Configuration
**Send report to** (Optional): Select users who should receive the Process Analyst Report via email. Leave empty to skip email delivery.
**Custom Email Subject** (Optional): Override the default email subject line. If left blank, the system uses "Process Analyst Report - [Dataset Name]".
## How It Works
1. **Data Analysis**: The system examines your enriched dataset
2. **Pattern Recognition**: AI identifies improvement opportunities
3. **Impact Estimation**: Business impact is quantified based on data
4. **Report Generation**: Findings are compiled into an executive report
5. **Delivery**: Report is emailed to specified recipients
### Relationship to AI Insights Report
The Process Analyst Report builds on the same underlying analysis as the AI Insights Report. For best results:
- Run AI Insights Report first to generate cached analysis
- Process Analyst Report uses these cached insights
- This approach ensures consistency across reports
Alternatively, include Process Analyst Report as an additional report within the AI Insights Report action step.
## Best Practices
1. **Target the right audience**: This report is designed for executives and decision-makers, not technical analysts
2. **Schedule strategically**: Run before leadership meetings or planning sessions
3. **Combine with other reports**: Use alongside AI Insights Report for technical stakeholders
4. **Review recommendations critically**: AI estimates are based on data patterns; validate with domain experts
5. **Track suggested KPIs**: Implement recommended metrics to measure improvement progress
6. **Use appropriate language**: Generate reports in your stakeholders' preferred language
## Example Configuration
### Monthly Executive Briefing
| Setting | Value |
|---------|-------|
| Dataset | Customer Service Process (Enriched) |
| Report Language | English |
| Email Recipients | coo@company.com, vp-operations@company.com |
| Custom Email Subject | Monthly Process Improvement Opportunities |
### Regional Operations Report
| Setting | Value |
|---------|-------|
| Dataset | EMEA Order Processing (Enriched) |
| Report Language | German |
| Email Recipients | regional-director@company.de |
| Custom Email Subject | Monatlicher Prozessanalysebericht |
## Interpreting the Report
### Reading the Effort/Impact Matrix
- **Quick Wins** (Low Effort, High Impact): Prioritize these first
- **Strategic Projects** (High Effort, High Impact): Plan for these in roadmap
- **Fill-ins** (Low Effort, Low Impact): Address when resources allow
- **Avoid** (High Effort, Low Impact): Generally not recommended
### Validating Business Impact
The AI estimates impact based on:
- Historical data patterns
- Industry benchmarks
- Process mining metrics
Always validate estimates with:
- Domain experts
- Financial stakeholders
- Operations teams
## Troubleshooting
### No datasets available
**Solution**: Ensure you have at least one enriched dataset. Go to Data Designer and run the enrichment pipeline.
### Report lacks specific recommendations
**Solution**: The report quality depends on data richness. Ensure your dataset includes:
- Sufficient case volume
- Relevant attributes
- Complete activity coverage
### Estimates seem inaccurate
**Solution**: AI estimates are based on data patterns. If estimates don't match reality:
- Review data quality
- Check for missing attributes
- Consider domain-specific factors the AI may not capture
### Email not received
**Solution**:
- Verify email addresses are correct
- Check spam/junk folders
- Confirm the action completed successfully
- Review action history for errors
## Related Documentation
- [Actions Overview](../overview)
- [AI Insights Report (Alpha)](../ai-insights-report) - Comprehensive 12-section analysis
- [AI GRC Report (Alpha)](../ai-grc-report) - Compliance and risk analysis
- [AI Automatic Report](../ai-automatic-report) - Custom AI-generated reports
## Support
If you encounter issues with AI Process Analyst Report:
- Email: support@mindzie.com
- Include: Dataset name, language setting, and specific issues encountered
- Note this is an Alpha feature - your feedback helps improve it
---
## AI GRC Report (Alpha)
Section: Actions
URL: https://docs.mindziestudio.com/mindzie_studio/actions/ai-grc-report
Source: /docs-master/mindzieStudio/actions/ai-grc-report/page.md
# AI GRC Report (Alpha)
The AI GRC Report action step generates a Governance, Risk, and Compliance report by analyzing enrichment columns that act as control definitions. Boolean columns where TRUE indicates a violation are automatically detected and analyzed.
> **Alpha Feature**: This feature is currently in alpha testing and is only available
> to tenants with PreRelease enabled. Functionality may change before general release.
## Overview
When you configure an AI GRC Report, the system:
1. Scans your enriched dataset for control columns (boolean enrichments)
2. Identifies violations where the control value is TRUE
3. Calculates compliance rates by control and category
4. Generates a heat map showing risk levels
5. Optionally exports a detailed case violation list
6. Emails the report to specified recipients
This report is designed for compliance officers, risk managers, and process owners who need visibility into control violations and compliance status.
## When to Use AI GRC Report
Use AI GRC Report when you need:
- Compliance dashboards showing violation rates
- Control-by-control violation analysis
- Risk level assessment across process controls
- Case lists for remediation tracking
- Automated compliance monitoring
- Audit preparation documentation
## How Controls Work
The GRC Report works by analyzing **boolean enrichment columns** in your dataset:
1. **Create Control Enrichments**: Use the Data Designer to add boolean enrichments that flag violations
2. **TRUE = Violation**: When the enrichment value is TRUE, it indicates a control violation
3. **Automatic Detection**: The GRC Report automatically finds all boolean columns and treats them as controls
### Example Control Enrichments
| Control Name | Logic | Violation Condition |
|-------------|-------|---------------------|
| Segregation of Duties | Same person approves and processes | TRUE when violated |
| Approval Missing | No approval activity found | TRUE when missing |
| SLA Breach | Duration exceeds threshold | TRUE when breached |
| Manual Override | Manual intervention detected | TRUE when overridden |
| Missing Documentation | Required document not attached | TRUE when missing |
## Report Content
The AI GRC Report includes:
### Compliance Dashboard
- Overall compliance rate (percentage of cases without violations)
- Compliance rates by control category
- Trend indicators (if historical data available)
### Heat Map by Category
Visual representation showing:
- **Green**: High compliance (90%+)
- **Yellow**: Moderate compliance (70-89%)
- **Red**: Low compliance (<70%)
### Control-by-Control Analysis
For each control:
- Violation count and rate
- Most common violation patterns
- Affected case characteristics
- Recommended remediation actions
### Risk Level Assessment
Classification of controls by risk:
- **Critical**: Controls with high violation rates affecting critical processes
- **High**: Significant violations requiring attention
- **Medium**: Moderate violations to monitor
- **Low**: Minor violations within acceptable thresholds
### Case Violation List (Excel)
When enabled, generates an Excel spreadsheet containing:
- Case ID
- Control violated
- Violation timestamp
- Related attributes
- Recommended action
This list supports remediation tracking and audit documentation.
## Configuration
To add an AI GRC Report to your action, click the **+** button in the Action Steps section and select **AI GRC Report**.
### Dataset Selection
**Dataset to Analyze** (Required): Select the enriched dataset you want to analyze. The dataset must have boolean enrichment columns that represent controls.
If no controls are found, ensure:
1. You have created boolean enrichments in Data Designer
2. The enrichments return TRUE for violations
3. The enrichment pipeline has been run
### Report Language
**Report Language**: Select the language for the generated report. The AI writes the entire report in your selected language.
### Include Case Violation List
**Include Case Violation List (Excel)**: When checked, generates an Excel spreadsheet with all case violations.
Use this option when you need:
- Detailed violation data for remediation
- Audit trail documentation
- Case-by-case investigation support
- Data for external compliance systems
The Excel file is attached to the email alongside the report.
### Email Configuration
**Send report to** (Optional): Select users who should receive the GRC Report via email. Leave empty to skip email delivery.
**Custom Email Subject** (Optional): Override the default email subject line. If left blank, the system uses "GRC Compliance Report - [Dataset Name]".
## Setting Up Controls
### Step 1: Identify Control Points
Review your process and identify where controls should exist:
- Segregation of duties requirements
- Approval requirements
- Time-based SLAs
- Documentation requirements
- Authorization checks
### Step 2: Create Boolean Enrichments
In Data Designer, create enrichments for each control:
**Example: Approval Missing Control**
```
Enrichment Type: Activity Check
Logic: Case does NOT contain activity "Manager Approval"
Output: Boolean (TRUE if activity missing)
```
**Example: SLA Breach Control**
```
Enrichment Type: Case Duration
Logic: Duration > 5 days
Output: Boolean (TRUE if breached)
```
### Step 3: Run Enrichment Pipeline
Execute the enrichment pipeline to apply controls to all cases.
### Step 4: Configure GRC Report
Add the GRC Report action step and select your enriched dataset.
## Best Practices
1. **Name controls clearly**: Use descriptive names like "SOD_Violation_Approve_Process" rather than "Control1"
2. **Organize by category**: Group related controls for better dashboard visualization
3. **Set appropriate thresholds**: Calibrate SLA and threshold-based controls to meaningful values
4. **Schedule regular runs**: Monitor compliance continuously, not just at audit time
5. **Include case lists for remediation**: Enable Excel export when teams need to act on violations
6. **Review with stakeholders**: Validate control definitions with compliance and business teams
## Example Configurations
### Weekly Compliance Monitoring
| Setting | Value |
|---------|-------|
| Dataset | Purchase-to-Pay (Enriched) |
| Report Language | English |
| Include Case List | Unchecked |
| Email Recipients | compliance-team@company.com |
| Custom Email Subject | Weekly P2P Compliance Status |
### Monthly Audit Package
| Setting | Value |
|---------|-------|
| Dataset | Financial Close Process (Enriched) |
| Report Language | English |
| Include Case List | Checked |
| Email Recipients | internal-audit@company.com, cfo@company.com |
| Custom Email Subject | Monthly Financial Controls Report |
### Regional Compliance Review
| Setting | Value |
|---------|-------|
| Dataset | EMEA Order Processing (Enriched) |
| Report Language | German |
| Include Case List | Checked |
| Email Recipients | regional-compliance@company.de |
## Troubleshooting
### No controls found
**Solution**: The GRC Report looks for boolean enrichment columns. Ensure:
- You have created boolean enrichments
- Enrichments output TRUE for violations
- The enrichment pipeline has been run
### All cases show as violations
**Solution**: Check your control logic - ensure TRUE indicates a violation, not compliance.
### Excel file is very large
**Solution**: For datasets with many violations:
- Filter the dataset before running
- Run reports more frequently to catch issues early
- Consider separate reports for different control categories
### Report doesn't reflect recent changes
**Solution**: Ensure:
- The enrichment pipeline has been run after data updates
- The action is using the correct (enriched) dataset
- Any caching has been cleared if needed
### Email not received
**Solution**:
- Verify email addresses are correct
- Check spam/junk folders
- Confirm the action completed successfully
- Check if Excel attachment exceeded email size limits
## Related Documentation
- [Actions Overview](../overview)
- [AI Insights Report (Alpha)](../ai-insights-report) - Comprehensive 12-section analysis
- [AI Process Analyst Report (Alpha)](../ai-process-analyst-report) - Executive improvement recommendations
- [Enrichments Overview](/mindzie_studio/enrichments/overview) - Creating control enrichments
## Support
If you encounter issues with AI GRC Report:
- Email: support@mindzie.com
- Include: Dataset name, control names, and specific compliance questions
- Note this is an Alpha feature - your feedback shapes the final product
---
## Error & Warning Report
Section: Actions
URL: https://docs.mindziestudio.com/mindzie_studio/actions/error-warning-report
Source: /docs-master/mindzieStudio/actions/error-warning-report/page.md
# Error & Warning Report
The Error & Warning Report action step sends automated notifications about issues detected in your project. This helps project owners stay informed about problems without manually checking each analysis.
## Overview
When you configure an Error & Warning Report, the system:
1. Scans all notebooks and analyses in your project
2. Collects any errors or warnings that occurred during execution
3. Generates a summary report of all issues found
4. Emails the report to specified recipients
This is essential for maintaining healthy projects and catching issues before they impact your analysis quality.
## When to Use Error & Warning Report
Use Error & Warning Report when you:
- Own a project and need to monitor its health
- Want early notification of data issues
- Need to track if enrichments or calculators stop working
- Have team members making changes to shared projects
- Want automated quality assurance for your process mining work
## Configuration
To add an Error & Warning Report to your action, click the **+** button in the Action Steps section and select **Error & Warning Report Email**.

### Settings
**Title** (Required): A name for this error report step. This helps you identify the step if you have multiple action steps.
Example: "Error & Warning Report"
**Description** (Optional): Additional notes about what this report monitors or why it exists.
**Users**: Select the email addresses that will receive the error reports. Typically this is the project owner or a team distribution list.
### Report Content Options
**Include Errors**: When checked (default), the report includes all error messages from failed notebooks and analyses.
Errors occur when:
- A notebook fails to execute completely
- An enrichment references a column that no longer exists
- A calculator encounters invalid data
- Database connections fail
**Include Warnings**: When checked (default), the report includes warning messages that indicate potential issues.
Warnings occur when:
- Data quality issues are detected
- Performance thresholds are exceeded
- Deprecated features are used
- Partial failures occur
**Send email if no issues found**: Controls whether you receive a report when everything is working correctly.
- **Checked**: You receive a report every scheduled run, even if there are no issues. This confirms the monitoring is working.
- **Unchecked**: You only receive a report when errors or warnings are found. This reduces email noise but means silence indicates success.
## Common Use Cases
### Project Owner Monitoring
Set up weekly monitoring to catch any issues:
| Setting | Value |
|---------|-------|
| Title | Weekly Project Health Check |
| Users | project-owner@company.com |
| Include Errors | Checked |
| Include Warnings | Checked |
| Send if no issues | Unchecked |
| Schedule | Every Monday at 7:00 AM |
You only receive an email if something needs attention.
### Team Notification
Keep the entire team informed of issues:
| Setting | Value |
|---------|-------|
| Title | Team Error Alerts |
| Users | process-mining-team@company.com |
| Include Errors | Checked |
| Include Warnings | Unchecked |
| Send if no issues | Unchecked |
| Schedule | Daily at 6:00 AM |
The team receives daily alerts about errors, but not warnings (to reduce noise).
### Compliance Monitoring
For projects requiring documentation of system health:
| Setting | Value |
|---------|-------|
| Title | Compliance Health Report |
| Users | compliance@company.com |
| Include Errors | Checked |
| Include Warnings | Checked |
| Send if no issues | Checked |
| Schedule | Daily at 8:00 AM |
A report is sent every day as evidence of monitoring, whether issues exist or not.
## What Triggers Errors and Warnings
### Data Changes
When underlying data changes, existing analyses may break:
- A column is renamed or removed from the data source
- Data types change (text to number, etc.)
- Required data becomes unavailable
- Connection credentials expire
### Configuration Issues
When analysis configuration becomes invalid:
- Enrichments reference deleted columns
- Calculators use incompatible data types
- Filters reference values that no longer exist
- Investigations reference deleted datasets
### Execution Failures
When notebooks fail to run:
- Timeout during long-running calculations
- Memory limitations exceeded
- External service unavailable
- Python script errors
## Best Practices
1. **Set up for every project you own**: If you are responsible for a project, create an Error & Warning Report to stay informed.
2. **Choose recipients carefully**: Send to people who can act on the issues. Avoid sending to stakeholders who cannot fix problems.
3. **Use appropriate scheduling**: Daily monitoring is suitable for active projects. Weekly is often enough for stable projects.
4. **Enable "Send if no issues" initially**: When first setting up, receive reports even when there are no issues to confirm the action is working. Disable later to reduce email volume.
5. **Combine with other actions**: Schedule error reports to run before other reports. This way you catch issues before stakeholders receive potentially incorrect data.
## Responding to Error Reports
When you receive an error report:
1. **Review the error messages**: Understand what failed and why
2. **Check the affected analyses**: Open the mentioned notebooks in mindzieStudio
3. **Investigate root cause**: Was it a data change, configuration issue, or system problem?
4. **Fix the underlying issue**: Update configurations, fix data sources, or correct scripts
5. **Re-run affected analyses**: Manually run notebooks to verify the fix
6. **Monitor subsequent reports**: Ensure the error does not recur
## Troubleshooting
### Not receiving expected reports
- Verify the action is enabled (Active column shows green)
- Check that the schedule is correct
- Confirm email addresses are valid
- Look in spam/junk folders
- Review action history for execution errors
### Receiving too many reports
- Uncheck "Send email if no issues found"
- Consider sending only errors, not warnings
- Reduce schedule frequency if issues are not time-sensitive
- Fix the underlying issues causing repeated errors
### Report content is unclear
- Note the notebook names and error messages
- Open the specific notebooks in mindzieStudio
- Run notebooks manually to see detailed error output
- Check data connections and column mappings
## Related Documentation
- [Actions Overview](../overview)
- [AI Automatic Report](../ai-automatic-report)
- [Grid Email](../grid-email)
## Support
If you encounter issues with Error & Warning Reports:
- Email: support@mindzie.com
- Include the error messages from your report
- Note when the issues started occurring
---
## Grid Email
Section: Actions
URL: https://docs.mindziestudio.com/mindzie_studio/actions/grid-email
Source: /docs-master/mindzieStudio/actions/grid-email/page.md
# Grid Email
The Grid Email action step sends data tables from your analyses directly to recipients via email. This allows stakeholders to receive structured data they can review, analyze, or import into other tools.
## Overview
When you configure a Grid Email, the system:
1. Extracts table data from your selected analyses
2. Formats the data as an email with embedded tables
3. Optionally attaches the data as Excel or CSV files
4. Sends the email to your specified recipients
This is ideal for sharing specific data points, metrics, or detailed breakdowns with teams who need the actual numbers rather than narrative reports.
## When to Use Grid Email
Use Grid Email when you need to:
- Share specific metrics or KPIs with stakeholders
- Provide data for import into other systems (Excel, databases)
- Distribute performance tables to operational teams
- Send bottleneck or delay analysis to process owners
- Automate data distribution that was previously done manually
## Prerequisites
Grid Email requires analysis data to function. Before creating a Grid Email action:
1. Ensure you have selected analysis data in the Data step of the action wizard
2. The selected analyses must contain tables or grids
3. Charts without underlying data tables cannot be sent via Grid Email
## Configuration
To add a Grid Email to your action, click the **+** button in the Action Steps section and select **Grid Email**.

### Basic Settings
**Subject** (Required): The email subject line. Make it descriptive so recipients know what data is included.
Example: "Weekly Bottleneck Analysis - Activity Pairs"
**Users**: Select the email addresses that will receive the data. You can add multiple recipients who will all receive the same email.
### Table Selection
Click **Select Tables** to choose which data tables to include in the email.

The table selection screen shows:
- **Investigation**: The source investigation containing the analysis
- **Analysis**: The specific analysis name
- **Available Tables**: Grids and tables within each analysis
For each analysis, you can select from multiple table types:
- Histogram data
- Statistics tables
- Calculated values over time
- Activity pairs and transitions
- Resource performance metrics
- And more
The preview shows the actual data that will be sent, including:
- Column names
- Row count
- Sample data values
**Column Count** and **Row Count**: Adjust these to control how much data appears in the preview and email.
### Attachment Options
**Attach Excel File**: When checked, the selected tables are also attached as an Excel (.xlsx) file. Recipients can download and work with the data in Excel.
**Attach CSV Files**: When checked, each selected table is attached as a separate CSV file. This is useful for:
- Importing data into databases
- Processing with scripts
- Systems that don't support Excel format
You can enable both options to give recipients multiple format choices.
## Example Configurations
### Weekly Performance Report
| Setting | Value |
|---------|-------|
| Subject | Weekly Activity Performance - [Date] |
| Users | operations-team@company.com |
| Tables | Activity Statistics, Duration by Activity |
| Attach Excel File | Checked |
| Attach CSV Files | Unchecked |
| Schedule | Every Monday at 7:00 AM |
### Daily Bottleneck Alert
| Setting | Value |
|---------|-------|
| Subject | Daily Bottleneck Analysis |
| Users | process-owner@company.com |
| Tables | Bottlenecks and Delays - Pair Performance |
| Attach Excel File | Unchecked |
| Attach CSV Files | Unchecked |
| Schedule | Every day at 6:00 AM |
### Data Export for Integration
| Setting | Value |
|---------|-------|
| Subject | Process Data Export |
| Users | data-team@company.com |
| Tables | All relevant metrics tables |
| Attach Excel File | Unchecked |
| Attach CSV Files | Checked |
| Schedule | Daily at 5:00 AM |
## Available Table Types
Depending on your analysis configuration, you may have access to various table types:
| Table Type | Description |
|------------|-------------|
| **Activity Statistics** | Counts, durations, and metrics for each activity |
| **Pair Performance** | Transition metrics between activity pairs |
| **Histogram** | Distribution data for duration or other metrics |
| **Calculated Values Over Time** | Time-series data showing trends |
| **Case Statistics** | Case-level metrics and aggregations |
| **Resource Performance** | Metrics by resource/staff member |
| **Variant Statistics** | Process variant frequencies and durations |
## Best Practices
1. **Select relevant tables only**: Don't include every available table. Choose the specific data recipients need.
2. **Use clear subjects**: Include the date or period in the subject so recipients can identify reports in their inbox.
3. **Consider file formats**: Use Excel for users who will analyze data manually. Use CSV for automated processing or database imports.
4. **Limit row counts**: Very large tables can make emails difficult to read. Consider filtering data or using attachments for large datasets.
5. **Combine with AI reports**: For stakeholders who need both narrative and data, set up both AI Automatic Report and Grid Email in the same action.
6. **Schedule appropriately**: Send data exports when downstream systems or teams need them.
## Troubleshooting
### No tables available to select
- Verify you have selected analysis data in the Data step
- Ensure the selected analyses contain grids or tables
- Some visualizations (pure charts) don't have table data
### Email not sending
- Check that recipients are valid email addresses
- Verify the action is enabled and scheduled
- Review action history for error messages
### Data is outdated
- Ensure the underlying analyses are being refreshed
- Check that data imports are running before the Grid Email
- Verify the data source connections are working
### Attachments are too large
- Reduce the number of tables selected
- Limit row counts in large tables
- Use CSV instead of Excel for slightly smaller file sizes
- Consider sending separate emails for different data sets
### Recipients can't open attachments
- Verify recipients have appropriate software (Excel for .xlsx)
- Try sending CSV format which opens in more applications
- Check if email security is blocking attachments
## Related Documentation
- [Actions Overview](../overview)
- [AI Automatic Report](../ai-automatic-report)
- [Error & Warning Report](../error-warning-report)
## Support
If you encounter issues with Grid Email:
- Email: support@mindzie.com
- Note which tables you're trying to send
- Include any error messages from the action history
---
## Python Script
Section: Actions
URL: https://docs.mindziestudio.com/mindzie_studio/actions/python-script
Source: /docs-master/mindzieStudio/actions/python-script/page.md
# Python Script
The Python Script action step allows you to execute custom Python code with access to your process mining data. This provides maximum flexibility for data transformation, custom integrations, and specialized processing.
## Overview
When you configure a Python Script action step, the system:
1. Collects data from all your selected analyses
2. Makes this data available to your Python code
3. Executes your script in a secure environment
4. Allows you to process, transform, or send data anywhere
This is the most powerful and flexible action step, suitable for advanced users who need custom functionality beyond the built-in options.
## When to Use Python Script
Use Python Script when you need to:
- Send data to custom APIs or webhooks
- Transform data before exporting to other systems
- Integrate with databases or data warehouses
- Create custom file formats or reports
- Perform calculations not available in standard mindzieStudio features
- Integrate with third-party services (Slack, Teams, Salesforce, etc.)
## Prerequisites
Before using Python Script:
1. Basic Python programming knowledge is required
2. Select analysis data in the Data step of the action wizard
3. Understand the data structures available from your analyses
## Configuration
To add a Python Script to your action, click the **+** button in the Action Steps section and select **Python Script**.
### Script Editor
The Python Script dialog provides a code editor where you write your Python code. The script has access to:
- All data from your selected analyses
- Standard Python libraries
- Common data processing libraries (pandas, requests, etc.)
### Available Data
Your script receives the selected analysis data in structured formats. You can access:
- Raw event log data
- Calculated metrics and statistics
- Analysis results and tables
- Visualization data
### Example Scripts
#### Send Data to Webhook
```python
import requests
import json
# Access the analysis data
data = get_analysis_data()
# Send to a webhook
response = requests.post(
'https://your-webhook-url.com/endpoint',
json=data,
headers={'Content-Type': 'application/json'}
)
if response.status_code == 200:
print("Data sent successfully")
else:
print(f"Error: {response.status_code}")
```
#### Export to Database
```python
import pandas as pd
from sqlalchemy import create_engine
# Get analysis data as DataFrame
df = get_analysis_dataframe()
# Connect to database
engine = create_engine('postgresql://user:pass@host:5432/database')
# Write data to table
df.to_sql('process_metrics', engine, if_exists='replace', index=False)
print(f"Exported {len(df)} rows to database")
```
#### Send Slack Notification
```python
import requests
# Get key metrics
metrics = get_analysis_data()
avg_duration = metrics['average_duration']
case_count = metrics['case_count']
# Send to Slack
slack_message = {
"text": f"Daily Process Summary: {case_count} cases processed, avg duration: {avg_duration}"
}
requests.post(
'https://hooks.slack.com/services/YOUR/WEBHOOK/URL',
json=slack_message
)
```
#### Custom CSV Export
```python
import pandas as pd
from datetime import datetime
# Get data
df = get_analysis_dataframe()
# Transform data
df['export_date'] = datetime.now().strftime('%Y-%m-%d')
df['source'] = 'mindzieStudio'
# Save to custom location
filename = f"process_export_{datetime.now().strftime('%Y%m%d')}.csv"
df.to_csv(f'/exports/{filename}', index=False)
print(f"Exported to {filename}")
```
## Best Practices
1. **Test scripts manually first**: Develop and test your Python code before scheduling it in an action. Use Python notebooks to verify logic.
2. **Handle errors gracefully**: Include try/except blocks to catch and log errors. Failed scripts should provide useful error messages.
3. **Log important steps**: Use print statements to track execution progress. These appear in the action history.
4. **Keep credentials secure**: Don't hardcode passwords or API keys in scripts. Use environment variables or secure storage.
5. **Consider execution time**: Actions have timeout limits. Optimize scripts for efficiency, especially with large datasets.
6. **Validate data before processing**: Check that expected data exists before attempting to use it. Handle missing data gracefully.
## Common Patterns
### Error Handling
```python
try:
data = get_analysis_data()
process_data(data)
print("Success")
except Exception as e:
print(f"Error: {str(e)}")
# Optionally send alert
send_error_notification(str(e))
```
### Data Validation
```python
data = get_analysis_data()
if not data or len(data) == 0:
print("No data available - skipping export")
exit()
if 'required_column' not in data.columns:
print("Missing required column")
exit()
# Continue with processing
```
### Conditional Processing
```python
data = get_analysis_data()
# Only send alert if threshold exceeded
if data['average_duration'] > 24: # hours
send_alert("Process duration exceeds 24 hours!")
else:
print("Duration within acceptable range")
```
## Troubleshooting
### Script not executing
- Check action history for error messages
- Verify the action is enabled and scheduled
- Ensure Python syntax is correct
### Data not available
- Confirm analyses are selected in the Data step
- Verify the analyses have been executed and contain data
- Check the data access methods in your script
### Script timeout
- Optimize code for performance
- Process data in smaller batches
- Consider moving heavy processing to external systems
### External service errors
- Verify API endpoints and credentials
- Check network connectivity from the execution environment
- Add retry logic for transient failures
### Import errors
- Verify required libraries are available
- Contact support if you need additional Python packages
## Limitations
- Scripts execute in a sandboxed environment
- Some system-level operations are restricted
- External network access may be limited by security policies
- Execution time is limited to prevent runaway scripts
## Related Documentation
- [Actions Overview](../overview)
- [AI Automatic Report](../ai-automatic-report)
- [Grid Email](../grid-email)
- [Data Designer Project](../data-designer-project)
## Support
If you encounter issues with Python Scripts:
- Email: support@mindzie.com
- Include your script code (with sensitive data removed)
- Note any error messages from the action history
- Describe the expected vs. actual behavior
---
## Data Designer Project
Section: Actions
URL: https://docs.mindziestudio.com/mindzie_studio/actions/data-designer-project
Source: /docs-master/mindzieStudio/actions/data-designer-project/page.md
# Data Designer Project
The Data Designer Project action step allows you to automatically run mindzieDataDesigner projects to import or refresh event log data. This enables fully automated data pipelines where data is imported on a schedule.
## Overview
When you configure a Data Designer Project action step, the system:
1. Connects to mindzieDataDesigner
2. Executes your selected project
3. Imports or refreshes the event log data
4. Makes updated data available for your analyses
This is essential for maintaining current data in your process mining projects without manual intervention.
## When to Use Data Designer Project
Use Data Designer Project when you need to:
- Automatically refresh event log data on a schedule
- Import data before generating reports
- Keep your process mining analyses up-to-date
- Create end-to-end automation from data import to report distribution
## Prerequisites
Before using Data Designer Project:
1. You must have a mindzieDataDesigner project already configured
2. The project should be tested and working manually
3. Database connections and credentials must be properly configured
4. You need appropriate permissions to run Data Designer projects
## Configuration
To add a Data Designer Project step to your action, click the **+** button in the Action Steps section and select **Run Data Designer Project**.

### Settings
**Data Designer Project**: Select the project you want to run from the dropdown. This list shows all Data Designer projects available in your environment.
The dropdown displays:
- Project name
- Last modified date
- Creator (if available)
Simply select the project and click **Submit** to add it to your action.
## Common Use Cases
### Daily Data Refresh
Run a data import every morning before business hours:
| Setting | Value |
|---------|-------|
| Data Designer Project | Daily Sales Process Import |
| Trigger | Daily at 5:00 AM |
This ensures analysts have fresh data when they start their day.
### Pre-Report Data Update
Combine data import with report generation:
**Action Steps (in order):**
1. Run Data Designer Project - Import latest data
2. AI Automatic Report - Generate and send executive summary
**Trigger:** Weekly, Monday at 6:00 AM
This pattern ensures reports always contain the most recent data.
### End-to-End Automation Pipeline
Create a complete automated workflow:
**Action Steps:**
1. Run Data Designer Project - Import event log
2. Error & Warning Report - Check for import issues
3. AI Automatic Report - Send executive summary
4. Grid Email - Send detailed metrics to operations team
**Trigger:** Daily at 5:00 AM
By scheduling the data import first, all subsequent steps work with fresh data.
## Execution Order
When your action contains multiple steps, they execute in the order configured:
1. **Data import runs first** - Refreshes the underlying data
2. **Reports generate second** - Use the newly imported data
3. **Notifications send last** - Report on the results
Always place Data Designer Project steps before any steps that depend on the data.
## Best Practices
1. **Schedule before reports**: Run data imports with enough time buffer before report generation. Allow for import duration plus any processing time.
2. **Test projects manually first**: Verify your Data Designer project runs successfully before automating it. Fix any issues in the project configuration.
3. **Monitor import success**: Add an Error & Warning Report step to catch import failures. This alerts you if the data pipeline breaks.
4. **Consider data freshness requirements**: Schedule imports based on how current your data needs to be. Daily is common, but some processes may need hourly updates.
5. **Account for source system availability**: Ensure source databases are available when imports are scheduled. Avoid running during maintenance windows.
6. **Stagger multiple imports**: If you have multiple Data Designer projects, stagger their schedules to avoid overwhelming source systems.
## Troubleshooting
### Project not appearing in dropdown
- Verify the Data Designer project exists and is saved
- Check that you have permission to access the project
- Ensure the project is properly configured in mindzieDataDesigner
### Import failing
- Check action history for detailed error messages
- Verify database connections are still valid
- Confirm source data is available
- Test the project manually in mindzieDataDesigner
### Data not updating in analyses
- Verify the import completed successfully (check action history)
- Ensure analyses are configured to use the correct dataset
- Check if analyses need to be refreshed after data import
- Verify the Data Designer project targets the correct destination
### Timeout during import
- Large imports may exceed default timeouts
- Consider optimizing the Data Designer project
- Break large imports into smaller incremental updates
- Contact support if you need extended timeout limits
### Credential errors
- Database credentials may have expired
- Check that service accounts are still valid
- Update credentials in Data Designer project configuration
- Verify network connectivity to source systems
## Integration Patterns
### Sequential Processing
```
Action: Daily Process Mining Update
Steps:
1. Run Data Designer Project: Import Event Log
2. Wait for completion
3. AI Automatic Report: Generate Summary
Trigger: Daily 6:00 AM
```
### Parallel Data Sources
Create separate actions for independent data sources:
```
Action 1: Import Sales Data
- Run Data Designer Project: Sales Event Log
- Trigger: Daily 5:00 AM
Action 2: Import Support Data
- Run Data Designer Project: Support Tickets
- Trigger: Daily 5:00 AM
Action 3: Combined Report (scheduled after imports complete)
- AI Automatic Report: Cross-Process Analysis
- Trigger: Daily 6:00 AM
```
### Error Recovery
```
Action: Data Import with Monitoring
Steps:
1. Run Data Designer Project: Main Import
2. Error & Warning Report: Send to data-team@company.com
Trigger: Daily 5:00 AM
```
If the import fails, the error report notifies the team immediately.
## Related Documentation
- [Actions Overview](../overview)
- [AI Automatic Report](../ai-automatic-report)
- [Error & Warning Report](../error-warning-report)
- [mindzieDataDesigner Documentation](/mindzie_data_designer)
## Support
If you encounter issues with Data Designer Project actions:
- Email: support@mindzie.com
- Include the Data Designer project name
- Note any error messages from the action history
- Describe when the issue started occurring
---
## AI Model Configuration
Section: AI Assistants
URL: https://docs.mindziestudio.com/mindzie_studio/ai-assistants/ai-model-configuration
Source: /docs-master/mindzieStudio/ai-assistants/ai-model-configuration/page.md
# AI Model Configuration
mindzieStudio now offers dramatically improved large language model (LLM) integration, giving you flexible options to power your AI copilots and assistants. You can use mindzie's built-in proxy models, connect to popular cloud providers with your own API keys, or deploy on-premise models for complete control.
## Overview
The AI model configuration system allows you to:
- **Use mindzie Proxy Models**: Access fast and thinking models provided by mindzieStudio out of the box
- **Bring Your Own Models**: Connect to any OpenAI-compatible API with your own credentials
- **Cloud Providers**: Use OpenAI, OpenRouter, Grok, Gemini, and other major AI providers
- **On-Premise Deployment**: Deploy local models using LM Studio, Ollama, or similar platforms
- **Automatic Detection**: Let mindzieStudio automatically detect model capabilities, token limits, and features
- **Multiple Models**: Configure as many models as needed for different use cases
## When to Use AI Model Configuration
Configure AI models when you need to:
- Set up copilot assistants for the first time
- Switch between different AI providers based on cost or performance
- Deploy on-premise models for data privacy and security
- Use specialized models for specific tasks (fast models for quick responses, thinking models for complex analysis)
- Rotate API keys for security compliance
- Test new models before making them the default
## Prerequisites
Before configuring AI models:
- **Administrator Access**: You must have administrative access to mindzieStudio settings
- **API Keys**: Obtain API keys from your chosen provider (OpenAI, OpenRouter, etc.)
- **Provider Account**: Create an account with your AI provider if using external services
- **On-Premise Setup**: If using local models, install and configure LM Studio, Ollama, or equivalent software
## Accessing Copilot Settings
Navigate to the copilot settings through the administration panel.

1. Click your profile icon in the top-right corner
2. Select **Settings** from the dropdown menu
3. In the left sidebar, click **mindzie Copilot**
You will see the **mindzie Copilot Settings** page with two main sections:
- **LLM Providers**: Manage your AI service providers
- **LLM Models**: Configure specific models from your providers

## Adding an AI Provider
Providers are the AI services that host the models. You can add multiple providers and switch between them.
### Step 1: Open Add Provider Dialog
1. Click the **Add Provider** button in the **LLM Providers** section
2. The **Add Provider** dialog will open

### Step 2: Select Provider Type
Choose from the **Provider Type** dropdown:
- **OpenAI**: Official OpenAI API (GPT-4, GPT-3.5, etc.)
- **OpenRouter**: Access to multiple models through OpenRouter
- **Grok**: xAI's Grok models
- **Gemini**: Google's Gemini models
- **LM Studio**: Local deployment using LM Studio
- **Ollama**: Local deployment using Ollama
- **Other**: Any other OpenAI-compatible API
**Note**: For well-known providers, mindzieStudio automatically knows the base URL. For local deployments or custom providers, you'll need to provide the base URL.
### Step 3: Configure Provider Details
**Provider Name**: Enter a descriptive name for this provider (e.g., "OpenAI Production", "Local LM Studio")
**API Key**: Enter your API key from the provider
- For cloud providers, obtain this from your provider's dashboard
- For local deployments, this may not be required or can be left empty
**Organization ID (Optional)**: Some providers like OpenAI support organization IDs for billing and access control
**Base URL (Optional)**: For custom or local deployments
- LM Studio example: `http://localhost:1234/v1`
- Ollama example: `http://localhost:11434/v1`
- Custom API: Your server's API endpoint
### Step 4: Set Provider Status
**Active**: Check this box to enable the provider
- Uncheck to temporarily disable without deleting the configuration
- Useful when you want to pause usage but keep your API keys stored
**Set as Default Provider**: Check this box to make this provider the default
- The default provider is used when adding new models
- Simplifies configuration when you primarily use one provider
### Step 5: Test the Connection
Before saving, test that your provider is configured correctly.
1. Click the **Test Connection** button
2. mindzieStudio will attempt to connect to the provider using your credentials
3. A success or error message will appear

**Note**: If you see "Authentication failed: Invalid API key", verify your API key is correct and has not expired.
### Step 6: Save the Provider
Click **Create** to save the provider configuration.
Your provider will now appear in the **LLM Providers** table.

## Managing Existing Providers
### Editing a Provider
To update provider settings (such as rotating an API key):
1. Click the **edit icon** (pencil) in the **Actions** column
2. The **Edit Provider** dialog opens with current settings
3. Make your changes (e.g., update the API key)
4. Click **Test Connection** to verify the new credentials
5. Click **Update** to save changes

**Common Use Case**: API keys may need rotation based on your IT department's security policies. Use the Edit Provider function to update keys without recreating the entire configuration.
### Deleting a Provider
To remove a provider:
1. Click the **delete icon** (trash can) in the **Actions** column
2. Confirm the deletion
**Warning**: Deleting a provider will not delete associated models, but those models will no longer function without a valid provider.
## Adding a Model
Once you have configured at least one provider, you can add AI models.
### Step 1: Open Add Model Dialog
1. Click the **Add Model** button in the **LLM Models** section
2. The **Add Model** dialog will open

The dialog has two main sections:
- **Model Configuration** (left): Basic model settings
- **Testing & Validation** (right): Automatic capability detection
### Step 2: Select Provider
Choose the **Provider** from the dropdown menu.
This dropdown lists all active providers you've configured.
### Step 3: Select or Enter Model Name
You have two options for specifying the model:
#### Option A: Select from List (Recommended)
1. Click the **Select Model** button next to the **Provider Model Name** field
2. A **Select Model** dialog will appear with a search box
3. mindzieStudio will query the provider's API to get available models

4. Once loaded, you'll see a list of available models

5. Click on a model to select it (e.g., `gpt-5-search-api-2025-10-14`)
**Note**: Not all models from a provider may be suitable for chat. For example, OpenAI offers audio and embedding models that won't work with mindzieStudio copilots. Selecting an incompatible model will result in errors during use.
#### Option B: Manual Entry
If you know the exact model name, type it directly into the **Provider Model Name** field.
Examples:
- `gpt-4-turbo`
- `gpt-4o-mini`
- `claude-3-opus-20240229`
### Step 4: Configure Model Display Name
**Model Display Name**: Enter a friendly name that users will see
- Example: `GPT-4 Turbo (fast, cost-effective)`
- This name appears in the copilot interface when selecting models
### Step 5: Set Default Temperature
**Default Temperature**: Set between 0 and 2
- Lower values (0-0.3): More deterministic, focused responses
- Medium values (0.7-1.0): Balanced creativity and consistency
- Higher values (1.0-2.0): More creative and varied responses
**Default**: `1` is a good starting point for most use cases
### Step 6: Auto-Detect Capabilities
mindzieStudio can automatically detect what features the model supports.
1. Click the **Auto-Configure Capabilities** button in the **Testing & Validation** section
2. mindzieStudio will connect to the provider and test the model

3. Within seconds, the system will detect and configure:
- **Token Limits**: Maximum context and output tokens
- **Model Capabilities**: Supported features
- **Temperature Support**: Whether temperature parameter is available
- **System Messages**: Whether the model supports system messages
- **Tool Calling**: Whether the model can call external tools

4. Click **Close** on the success dialog
5. The capabilities will be auto-filled in the form

**Auto-Filled Information**:
- **Max Context Tokens**: 128,000 (in this example)
- **Max Output Tokens**: 16,000 (in this example)
- **Model Capabilities**: System Messages (checked), Temperature (unchecked in this example)
### Step 7: Manual Override (Optional)
You can manually edit the auto-detected capabilities if needed.
**Warning**: Only override if you are certain the auto-detection is incorrect. Incorrect capability settings will cause errors when using the model.
For example:
- If you incorrectly enable **Temperature** for a model that doesn't support it, API calls will fail
- If you set token limits too high, requests may be rejected
### Step 8: Set Model Status
**Active**: Check to enable the model for use
- Uncheck to temporarily disable without deleting
**Set as Tenant Default Model**: Check to make this the default model for all copilot assistants
- Only one model can be the tenant default
- Setting a new default will also set that model's provider as the default provider
### Step 9: Create the Model
1. Click the **Create** button
2. An **Information** dialog will confirm the model was added successfully

3. Click **Close**
4. The model now appears in the **LLM Models** table

## Understanding the Models Table
The **LLM Models** table displays:
| Column | Description |
|--------|-------------|
| **Model Name** | Display name you configured |
| **Provider** | Which provider hosts this model |
| **Provider Model Name** | Technical model identifier used by the API |
| **Family** | Model family (e.g., GPT4o, GPT5) if applicable |
| **Status** | Active or Inactive |
| **Tenant Default** | Shows "DEFAULT" if this is the tenant-wide default model |
| **Actions** | Edit or delete the model |
## Managing Models
### Editing a Model
To modify a model's configuration:
1. Click the **edit icon** in the **Actions** column
2. Update the settings in the **Edit Model** dialog
3. Click **Update** to save changes
### Setting a Different Default Model
To change which model is used by default:
1. Edit the model you want to make default
2. Check **Set as Tenant Default Model**
3. Click **Update**
The previous default will automatically be unmarked.
### Deleting a Model
To remove a model:
1. Click the **delete icon** in the **Actions** column
2. Confirm the deletion
**Note**: You cannot delete a model that is currently set as the tenant default. Set a different default first.
## Testing Your Configuration
After configuring providers and models, test your setup:
1. Navigate to a copilot-enabled feature (e.g., Investigations, AI Teammate)
2. Open the copilot interface
3. Verify your default model appears in the model selector
4. Send a test query to confirm the model responds correctly
## Supported Providers
### Cloud Providers
mindzieStudio supports any OpenAI-compatible API, including:
- **OpenAI**: GPT-4, GPT-4 Turbo, GPT-3.5, GPT-5 (when available)
- **OpenRouter**: Multi-provider access to hundreds of models
- **Anthropic Claude** (via OpenRouter or compatible proxy)
- **Grok** (xAI)
- **Google Gemini** (via compatible API)
- **Azure OpenAI Service**
- **Custom APIs**: Any service implementing OpenAI's API specification
### On-Premise Solutions
For data privacy and security, you can deploy models locally:
- **LM Studio**: Easy-to-use local model deployment
- **Ollama**: Lightweight local model serving
- **vLLM**: High-performance inference server
- **Text Generation Inference**: Hugging Face's inference server
- **LocalAI**: OpenAI-compatible local inference
**On-Premise Setup Requirements**:
1. Install your chosen local inference software
2. Download and load your preferred model
3. Start the local server (typically on `localhost:1234` or `localhost:11434`)
4. In mindzieStudio, add a provider with the local base URL
5. Add models using the local provider
## Best Practices
### API Key Security
- **Rotate Keys Regularly**: Change API keys periodically based on your security policies
- **Use Organization IDs**: When available, use organization IDs to track usage and costs
- **Limit Key Permissions**: Use API keys with minimum required permissions
- **Don't Share Keys**: Each user or team should have their own API credentials
### Model Selection
- **Fast Models for Real-Time**: Use models like `gpt-4o-mini` for quick copilot responses
- **Thinking Models for Analysis**: Use larger models like `gpt-5-search-api` for complex analysis tasks
- **Test Before Default**: Test new models thoroughly before setting them as tenant default
- **Monitor Costs**: Track usage and costs per model, especially for expensive models
### Provider Management
- **Keep Providers Active**: Only disable providers when necessary to avoid confusion
- **Descriptive Names**: Use clear provider names like "OpenAI Production" or "Local LM Studio Dev"
- **Test Connections**: Always test connections after adding or editing providers
- **Multiple Providers**: Configure backup providers in case your primary provider has issues
### Capability Configuration
- **Trust Auto-Detection**: Use auto-configure capabilities whenever possible
- **Don't Guess**: If auto-detection fails, consult the model's documentation rather than guessing
- **Verify Token Limits**: Incorrect token limits can cause unexpected truncation or errors
- **Update Regularly**: Model capabilities may change with API updates
## Troubleshooting
### Connection Test Fails
If testing a provider connection fails:
1. **Verify API Key**: Copy the key directly from your provider dashboard
2. **Check Base URL**: Ensure the base URL is correct and includes the protocol (http:// or https://)
3. **Network Access**: Confirm your network allows connections to the provider
4. **Provider Status**: Check if the provider's API is experiencing downtime
5. **Organization ID**: Remove the organization ID if not required
### Model Not Appearing in Copilot
If a model doesn't appear when using copilots:
1. **Check Active Status**: Ensure both provider and model are marked as Active
2. **Verify Provider**: Confirm the model's provider is active
3. **Reload Interface**: Refresh the copilot interface
4. **Check Permissions**: Verify you have access to use AI features
### Auto-Detection Fails
If auto-configure capabilities doesn't work:
1. **Test Provider First**: Ensure the provider connection is valid
2. **Check Model Name**: Verify the model name is correct
3. **API Permissions**: Some APIs require special permissions for capability queries
4. **Manual Configuration**: As a fallback, configure capabilities manually using the model's documentation
### Model Errors During Use
If a model returns errors when used:
1. **Review Capabilities**: Ensure capabilities match what the model actually supports
2. **Check Token Limits**: Verify max context and output tokens are not set too high
3. **Temperature Setting**: Some models don't support temperature - disable if needed
4. **API Quota**: Check if you've exceeded your provider's rate limits or quotas
## Example Configurations
### Example 1: OpenAI with Multiple Models
**Provider Configuration**:
- Provider Type: OpenAI
- Provider Name: "OpenAI Production"
- API Key: `sk-...` (your actual key)
- Active: Yes
- Default Provider: Yes
**Models**:
1. **Fast Model for Quick Responses**
- Model Name: "GPT-4o Mini (Fast & Cheap)"
- Provider Model Name: `gpt-4o-mini`
- Default Temperature: 0.7
- Tenant Default: Yes
2. **Thinking Model for Complex Analysis**
- Model Name: "GPT-5 Search API (Advanced)"
- Provider Model Name: `gpt-5-search-api-2025-10-14`
- Default Temperature: 1.0
- Tenant Default: No
### Example 2: On-Premise with LM Studio
**Provider Configuration**:
- Provider Type: LM Studio
- Provider Name: "Local LM Studio"
- API Key: (leave empty or use dummy value)
- Base URL: `http://localhost:1234/v1`
- Active: Yes
- Default Provider: Yes
**Model**:
- Model Name: "Llama 3.1 70B (Local)"
- Provider Model Name: `llama-3.1-70b-instruct`
- Default Temperature: 0.8
- Tenant Default: Yes
### Example 3: Mixed Cloud and On-Premise
Use multiple providers for flexibility:
**Providers**:
1. OpenAI (cloud) - for production workloads
2. LM Studio (local) - for development and sensitive data
**Models**:
- Default: OpenAI GPT-4o Mini (production)
- Secondary: Local Llama 3.1 (development/testing)
## Related Documentation
- [Using Copilots in Investigations](#) - Learn how to use AI assistants for process analysis
- [AI Teammate](#) - Configure and work with your AI teammate
- [Administration Settings](#) - Other tenant-wide configuration options
## Support
If you encounter issues configuring AI models:
- **Email**: support@mindzie.com
- **Documentation**: Consult your AI provider's API documentation for model names and capabilities
- **Testing**: Always test provider connections and model responses before setting as default
---
## Overview
Section: Alpha
URL: https://docs.mindziestudio.com/mindzie_studio/alpha/overview
Source: /docs-master/mindzieStudio/alpha/overview/page.md
# Alpha Features
Welcome to the mindzie Alpha Program. Alpha features are experimental capabilities that we're opening up to select tenants who want to be part of our early release program.
Current Alpha Features
The following capabilities are available to alpha testers:
AI Studio
Comprehensive predictive analytics platform with AutoML, simulations, and LLM-powered explanations.
---
## What is Alpha?
**Alpha features are works-in-progress.** They represent functionality that is most likely coming to mindzieStudio, but we're still testing and refining them. Some features may change significantly before general release, and in rare cases, a feature may not make it into the final product at all.
**Why participate?**
We release Alpha features early because we want real-world feedback from users like you. By trying these features, you help shape how they work and ensure they solve actual problems. Your input directly influences what gets built.
**Important considerations:**
- Use Alpha features at your own risk - they are not production-ready
- Expect bugs, incomplete documentation, and occasional breaking changes
- Features may be modified or removed based on feedback and technical decisions
- These features are only available to tenants with PreRelease enabled
---
## Current Alpha Features
### AI Studio
**[AI Studio (Alpha)](/mindzie_studio/alpha/ai-studio)** - Comprehensive predictive analytics platform for process mining with AutoML, LLM-powered explanations, and interview-based setup. Includes What-If Analysis, Digital Twin simulation, Feature Impact explanations, and automated model training.
---
## How to Enable Alpha Features
Alpha features require PreRelease to be enabled for your tenant. Contact your mindzie administrator or support@mindzie.com to request access.
Once PreRelease is enabled:
1. Log out and log back in to refresh your session
2. Alpha features will appear in their respective locations
3. Look for features marked with "(Alpha)" in their names
## Providing Feedback
We welcome feedback on alpha features! Your input helps shape these features before general release:
- **Email**: support@mindzie.com
- **Subject**: Include "Alpha Feedback: [Feature Name]"
- **Include**: What you were trying to do, what happened, and what you expected
Your feedback directly influences the development of these features.
---
## What to Expect from Alpha Features
Alpha features are:
- **Experimental**: Core functionality works but may have rough edges
- **Evolving**: Behavior and UI may change between updates
- **Limited Support**: Documentation may be incomplete
- **Valuable**: Your early testing helps improve the final product
## Feature Lifecycle
```
Alpha -> Beta -> General Availability
| | |
| | +-- Available to all, fully documented
| +-- Available to all, stable but may change
+-- PreRelease only, experimental
```
## Feature Summary Table
| Feature | Type | Product | Access |
|---------|------|---------|--------|
| AI Studio | Platform | mindzieStudio | Header menu > AI Studio (Alpha) |
---
## AI Studio
Section: Alpha
URL: https://docs.mindziestudio.com/mindzie_studio/alpha/ai-studio
Source: /docs-master/mindzieStudio/alpha/ai-studio/page.md
# AI Studio (Alpha)
**mindzie AI Studio** is a comprehensive predictive analytics platform for process mining. It empowers anyone - from data scientists to business analysts to process owners - to predict, explain, and optimize anything derivable from process data.

## Vision
AI Studio is built on three pillars:
1. **AutoML First** - The machine figures out the best approach; humans focus on insights
2. **LLM-Powered Explanation** - Everything is explained in plain language with generated reports
3. **Interview-Based Setup** - Non-technical users configure predictions through guided conversations
## How to Access AI Studio
AI Studio is available in the header navigation for tenants with PreRelease enabled.
1. Click **AI Studio (Alpha)** in the header menu
2. Select a category from the left sidebar
3. Explore the available features
---
## Feature Categories
AI Studio organizes its capabilities into seven main categories accessible from the left sidebar.
### DATA - The Foundation
Manage your data sources and features for machine learning.
| Section | Description |
|---------|-------------|
| **Event Logs** | Import and manage event logs for training and prediction |
| **Datasets** | View and manage enriched datasets ready for ML |
| **Feature Store** | Reusable feature sets with version control and templates |
**Key Capabilities:**
- Smart data ingestion with auto-detection of columns
- LLM-guided mapping through natural language interviews
- Automatic data quality reports
---
### PREDICT - Core Value
Predict what will happen in your processes.
| Section | Description |
|---------|-------------|
| **Outcomes** | Will a case succeed? Customer churn? SLA violation? |
| **Timing** | Remaining time, completion date, delay probability |
| **Next Steps** | What activity happens next? What path will the case take? |
| **Resources** | Who will handle this? Workload forecasting, bottleneck prediction |
| **Costs** | Total case cost, cost to completion, budget variance |
| **Risks** | Compliance risk, fraud probability, quality risk scores |
**Prediction Types:**
- Binary outcomes (yes/no)
- Multi-class outcomes
- Probability scores (0-100%)
- Time estimates with confidence intervals
---
### DETECT - Find Problems
Identify issues before they become critical.
| Section | Description |
|---------|-------------|
| **Anomalies** | ML-based detection of unusual patterns in control flow, performance, and semantics |
| **Conformance** | Compare actual execution against expected behavior (BPMN models, business rules, SLAs) |
| **Drift** | Detect changes over time in process behavior, model performance, and data distribution |
---
### SIMULATE - Explore the Future
Test scenarios and understand potential outcomes before making changes.
#### What-If Analysis
Run simulations to explore how process changes would impact key metrics. Configure scenario parameters and instantly see projected results.

**Scenario Configuration Options:**
- **Approval Threshold** - Adjust monetary thresholds for approval routing
- **Team Size** - Model the impact of adding or removing staff
- **Auto-Approve Low Risk** - Toggle automatic approval for low-risk cases
- **Max Queue Size** - Set queue capacity limits
**Simulation Results:**
The simulation compares your current metrics against the simulated scenario:
| Metric | What It Shows |
|--------|---------------|
| Avg Cycle Time | End-to-end processing time |
| Cases/Day | Throughput capacity |
| SLA Compliance | Percentage meeting service levels |
| Cost per Case | Average processing cost |
| Resource Utilization | How efficiently resources are used |
| Bottleneck Time | Time spent waiting at bottlenecks |
| Error Rate | Percentage of cases with errors |
The **Impact Visualization** shows at-a-glance whether changes improve or degrade Cycle Time, Throughput, and Quality.
The **Simulation Summary** provides an AI-generated plain-language explanation of the results, highlighting key improvements and any trade-offs to consider.
#### Digital Twin
Create a visual, real-time representation of your process. The Digital Twin shows your process map with live simulation capabilities.

**Digital Twin Features:**
- **Process Map Visualization** - See your discovered process model with all variants
- **Live Simulation** - Run simulations through the process to observe behavior
- **Variant Analysis** - View all process variants with their frequency percentages
- **Simulation Controls** - Start, stop, and monitor simulation progress
The Digital Twin enables you to:
- Understand how cases flow through your process
- Identify which variants are most common
- Test hypotheses about process behavior
- Visualize bottlenecks and parallel paths
#### Scenarios
Save and manage pre-built scenarios for common what-if analyses:
- Staff reduction impact
- Volume spike handling
- Process redesign effects
- Seasonal variation modeling
---
### EXPLAIN - Understand Why
Get clear explanations for predictions and outcomes.
#### Feature Impact
Understand what drives your model's predictions using SHAP (SHapley Additive exPlanations) values.

**Global Feature Importance:**
The left panel shows which features have the most influence on predictions across all cases:
- **Time Since Start** - How long the case has been running
- **Pending Activities** - Number of activities waiting to be completed
- **Customer Priority** - Priority level assigned to the customer
- **Order Amount** - Monetary value of the order
- **Resource Load** - Current workload of assigned resources
- **Has Escalation** - Whether the case has been escalated
- **Day of Week** - Which day the activity occurs
- **Region** - Geographic region of the case
**Case-Level Waterfall:**
The right panel shows how each feature contributes to a specific case's prediction:
- Green values (+) push the prediction higher
- Red values (-) push the prediction lower
- The final prediction combines all feature contributions
**AI-Generated Explanation:**
At the bottom, an AI-generated explanation describes in plain language why the model made its prediction. For example: *"This case is predicted to breach SLA primarily due to the 36-hour duration and 4 pending activities. The high customer priority also increases breach likelihood. Low resource load provides a small mitigating factor."*
#### Root Cause
Automated discovery of contributing factors when KPIs deviate from expectations. Identifies the "why" behind process problems with statistical significance.
#### Process Narrative
LLM-generated plain language explanations of case history. Get a story-like description of what happened in any case and why.
---
### AUTOMATE - Continuous Intelligence
Set up automated workflows and monitoring.
#### Scheduled Training
Configure automatic model training to keep your predictions accurate as data evolves.

**Training Configuration:**
- **Dataset Selection** - Choose which enriched dataset to use for training
- **Algorithm Selection** - Pick from multiple ML algorithms:
- **FastForest** - Fast, accurate ensemble method
- **LightGBM** - Gradient boosting for large datasets
- **FastTree** - Decision tree with high performance
- **Linear** - Simple, interpretable linear models
- **Search Intensity** - Balance between training time and model quality
- **Notification** - Get notified when training completes
**Activity Predictability Scan:**
Before training, the system scans your data to show which activities are predictable:
- **Activity** - The activity to predict
- **Rating** - How predictable the activity is (Recommended, Acceptable, etc.)
- **Percentage** - Occurrence rate in the dataset
- **Cases** - Number of cases containing this activity
This helps you select activities that will produce reliable predictions.
#### Alerts & Actions
Configure triggers based on predictions:
- High-risk case detected -> Email case owner
- SLA violation predicted -> Create task in workflow
- Anomaly detected -> Log to investigation queue
- Model drift detected -> Trigger retraining
#### Model Refresh
Automated model lifecycle management:
- Monitor model performance over time
- Detect when accuracy degrades
- Trigger retraining automatically
- Compare new models against current deployments
---
### MODELS - Your AI Assets
Manage your trained models and deployments.
#### Model Registry
Catalog of all trained models with their status, performance metrics, and version history.
#### Deployments
Deploy trained models to make predictions available as enrichment operators.

**Deploy to Enrichment:**
Select a completed training to deploy. The model will be added as an enrichment operator that generates prediction attributes for each case.
Each trained model shows:
- **Model Name** - The activity being predicted (e.g., "Imaging Ordered", "Consult Completed")
- **Enrichment** - Which dataset enrichment the model was trained on
- **Completed** - When training finished
- **Deploy Button** - Click to deploy the model
**Deployed Models:**
Once deployed, models appear in the Deployed Models panel. From here you can:
- Monitor which models are active
- View prediction capabilities
- Manage model lifecycle
Deployed models become available as enrichment operators in your data pipelines, automatically adding prediction columns to your cases.
#### Performance
Track model health and accuracy over time:
- Prediction volume and latency
- Accuracy trends
- Drift indicators
- Comparison against validation data
---
## Roadmap
AI Studio features are being released progressively. Current focus areas include:
**Available Now:**
- Scheduled Training with multiple algorithms
- Model Deployments to enrichments
- What-If Analysis with simulation
- Digital Twin visualization
- Feature Impact with SHAP explanations
**Coming Soon:**
- Cost Prediction - Total case cost estimation and cost driver identification
- Outcome Prediction - Binary and multi-class outcome predictions
- Anomaly Detection - Real-time detection of unusual patterns
- Process Narrative - AI-generated case explanations
---
## Providing Feedback
We welcome feedback on AI Studio! Your input helps shape these features before general release:
- **Email**: support@mindzie.com
- **Subject**: Include "Alpha Feedback: AI Studio"
- **Include**: What you were trying to do, what happened, and what you expected
---
## AI Copilot
Section: Application Guide
URL: https://docs.mindziestudio.com/mindzie_studio/application-guide/ai-copilot
Source: /docs-master/mindzieStudio/application-guide/ai-copilot/page.md
# AI Copilot
## Overview
The mindzie AI Copilot is an intelligent assistant designed specifically for process analytics and process improvement. It provides quick answers and insights about your process data through a simple chat interface.
## Accessing the AI Copilot
The AI Copilot is available in two main locations:
- **Dashboards** - Access from the right-hand side panel
- **Analysis Pages** - Available on the right-hand side during analysis

## AI Model Selection
The AI Copilot supports multiple AI models to suit different use cases:
### Available Models
1. **Fast Model** - Optimized for quick answers and rapid responses
2. **Thinking Model** - Provides more detailed analysis and complex reasoning
### Switching Between Models
To change the AI model:
1. Click on the model name displayed on the right-hand side of the screen
2. A model selector prompt will appear
3. Choose between the available models

### Custom AI Configuration
The AI Copilot can be configured to use your own AI setup and custom models:
- Default models are provided when using mindzie's AI configuration
- Custom AI models can be configured through administrative settings
- Once configured, your custom models will appear in the model selector
For information on setting up custom AI models, refer to the AI Model Configuration documentation in the Administration section.
## Using the AI Copilot
### Quick Access Buttons
The AI Copilot provides quick access to common process analytics queries:

Click the "mindzie" button to access pre-configured prompts that help you:
- Learn about mindzie features
- Get process-specific information
- Access common analytics functions
### Example Questions
You can ask the AI Copilot a wide variety of questions about your process:
- "Tell me about my process"
- "Tell me what I should fix"
- "Make some recommendations"
- "Tell me what activities are in the process"
- Request process insights and analytics
- Get process improvement suggestions
### Interface Features
#### Full Screen Mode
For more advanced interactions requiring additional screen space:
1. Click the square icon in the AI Copilot panel
2. The Copilot will expand to full screen mode
3. This provides more room for complex conversations and detailed responses

#### Clear Chat
To start a fresh conversation:
1. Locate the "Clear Chat" button at the bottom of the AI Copilot panel
2. Click to reset the conversation history
3. Begin a new chat session with a clean slate
## AI Copilot Focus
The AI Copilot is specifically designed as an AI assistant for process analytics. It focuses on:
- Process intelligence and insights
- Process improvement recommendations
- Activity and workflow analysis
- Performance metrics and KPIs
- Bottleneck identification
- Optimization opportunities
## Best Practices
1. **Be Specific** - Ask clear, focused questions about your process
2. **Use Context** - The AI Copilot understands your current process data
3. **Iterate** - Refine your questions based on initial responses
4. **Choose the Right Model** - Use the Fast Model for quick checks, Thinking Model for complex analysis
5. **Clear When Needed** - Start fresh conversations for different analysis topics
## Support
For additional assistance with the AI Copilot:
- Refer to the AI Model Configuration documentation for custom setup
- Contact mindzie support for advanced configuration options
- Check the latest documentation for new AI Copilot features and capabilities
---
## Actions Engine
Section: Application Guide
URL: https://docs.mindziestudio.com/mindzie_studio/application-guide/actions-engine
Source: /docs-master/mindzieStudio/application-guide/actions-engine/page.md
# Actions Engine
## Overview
The mindzie Actions Engine is a powerful automation platform that triggers alerts, notifications, AI reports, and other automated updates based on your process data. It enables you to transform process insights from discovery into continuous automated monitoring and action.
## Access Requirements
To use the Actions Engine, you must have one of the following user account levels:
- **Analyst** - Full access to create and manage actions
- **mindzie Developer** - Advanced configuration and scripting capabilities
## Accessing the Actions Engine
1. Navigate to the top of your screen
2. Click on **Actions Engine** in the main navigation menu

## Creating a New Action
### Starting a New Action
1. Click **New Action** in the top right corner
2. Provide a name and description for your action

### Selecting Analysis Data
Choose the process analysis data that will trigger your action:

1. Click the **plus (+) arrow** to add analysis
2. Select from your existing analyses:
- Outlier detection
- Maverick buying insights
- Compliance issues
- Conformance monitoring
- Process SLA tracking
- Duration analysis
- Risk assessments
- Performance metrics
3. Choose relevant insights (compliance, risk, performance, etc.)
4. Click **Submit** to add the analysis to your action
You can add:
- **Single analysis** - For focused, specific actions
- **Multiple analyses** - For comprehensive monitoring across criteria
### Configuring Action Steps
Action steps define what happens when your trigger conditions are met.

#### Available Action Steps
The Actions Engine uses no-code building blocks that can be combined:
1. **AI-Automated Reports** - Generate intelligent reports using AI
2. **Email Notifications** - Send alerts to stakeholders
3. **MS Teams Integration** - Post directly to Teams channels
4. **Error/Warning Tracking** - Default monitoring across the platform
5. **Python Scripting** - Custom extensions and integrations
#### Advanced Integration Options
For advanced scenarios, use Python scripting to:
- Integrate with third-party systems
- Trigger updates through APIs
- Put processes on hold based on compliance warnings
- Pause workflows automatically
- Create custom actions and workflows
### AI Report Configuration
To configure an AI-generated report:

1. Select **AI Report** as the action step
2. Provide a **Subject** for the report
3. Choose **Recipients** (users or groups)
4. Select the **Language** for the report
5. Add any **Additional Instructions** for the AI
6. Click **Submit** to save the configuration
### Setting Up Triggers
Triggers determine when and how often your action executes.

#### Trigger Frequency Options
- **Every Minute** - Real-time monitoring
- **Hourly** - Regular interval checks
- **Daily** - Once per day
- **Weekly** - Specific days of the week
- **Monthly** - Monthly reports and monitoring
- **Custom** - Define your own schedule
#### Schedule Configuration

Configure specific timing:
1. Select **Days of the Week** (e.g., Monday, Friday)
2. Choose **Start Time** for execution
3. Specify **Specific Days** if needed
4. Click **Save** to activate the trigger
**Example**: To send a report every Monday morning:
- Select "Monday" as the day
- Set start time to 9:00 AM
- Save the trigger
## Managing Actions
Once your action is configured, you have several management options:

### Manual Execution
- **Play Button** - Manually run the action immediately
- Use this to test your action before scheduling
### Action History
- **History Button** - View execution history
- See when the action last ran
- Check for errors or warnings
- Review insights from past executions
- Verify action performance
### Editing Actions
- **Edit Button** - Modify action configuration
- Update analysis selections
- Change action steps
- Adjust triggers and schedules
### Action Control
Use the **three-dot menu** to:
- **Disable** - Temporarily pause the action without deleting
- **Delete** - Permanently remove the action
- **Duplicate** - Create a copy for similar monitoring
## Use Cases
The Actions Engine supports various automation scenarios:
### Compliance Monitoring
- Detect policy violations
- Alert compliance officers
- Generate compliance reports
- Track conformance metrics
### Performance Alerts
- Monitor SLA breaches
- Identify bottlenecks
- Track duration anomalies
- Send performance dashboards
### Risk Management
- Flag high-risk processes
- Alert risk managers
- Generate risk assessment reports
- Track risk indicators
### Process Optimization
- Identify improvement opportunities
- Send optimization recommendations
- Track efficiency metrics
- Monitor process changes
### Management Reporting
- Daily executive summaries
- Weekly performance reports
- Monthly analytics dashboards
- Custom insights for stakeholders
## Best Practices
1. **Start Simple** - Begin with one analysis and one action step
2. **Test First** - Use manual execution to verify before scheduling
3. **Monitor History** - Regularly check execution history for issues
4. **Appropriate Frequency** - Match trigger frequency to business needs
5. **Clear Naming** - Use descriptive names for easy identification
6. **Document Instructions** - Add clear descriptions for AI reports
7. **Review Recipients** - Ensure the right people receive alerts
8. **Iterate** - Refine actions based on feedback and results
## Scalability
- **Unlimited Actions** - Configure as many actions as needed
- **Parallel Execution** - Multiple actions run independently
- **Background Processing** - Actions run automatically without user intervention
- **Complete Workflow** - From discovery to automated monitoring
## Support
For assistance with the Actions Engine:
- Contact mindzie support for advanced configuration
- Refer to Python scripting documentation for custom integrations
- Check the latest documentation for new action step types and features
---
## BPMN Editor
Section: Application Guide
URL: https://docs.mindziestudio.com/mindzie_studio/application-guide/bpmn-editor
Source: /docs-master/mindzieStudio/application-guide/bpmn-editor/page.md
# BPMN Editor
## Overview
The mindzie BPMN Editor is an integrated tool for creating and managing Business Process Model and Notation (BPMN) 2.0 diagrams directly within the platform. It supports both manual diagram creation and automatic generation from your actual process data.
## What is BPMN?
BPMN (Business Process Model and Notation) is a standard graphical notation for modeling business processes. BPMN 2.0 provides:
- Standardized process visualization
- Clear communication of process flows
- Documentation for training and compliance
- Process analysis and optimization
## Accessing the BPMN Editor
1. Click on **BPMN Editor** in the top menu
2. Select **New Diagram** to start creating

## Creating BPMN Diagrams Manually
### Starting a New Diagram
The BPMN Editor provides a complete set of tools for manual diagram creation:

### Standard BPMN 2.0 Elements
Create professional process diagrams using:
- **Tasks and Activities** - Process steps and operations
- **Gateways** - Decision points and branching logic
- **Events** - Start, end, and intermediate events
- **Swim Lanes** - Organizational boundaries and responsibilities
- **Flows** - Sequence flows and message flows
- **Artifacts** - Data objects and annotations
### Diagram Management
#### Loading Diagrams
- Import from **SharePoint** and other integrations
- Load existing BPMN files from external sources
- Access previously saved diagrams
#### Saving Diagrams
- Save directly to your **desktop**
- Export in standard BPMN format
- Store in integrated document repositories
### Building Your Diagram
1. **Add Elements** - Drag and drop BPMN components
2. **Create Swim Lanes** - Define organizational boundaries
3. **Draw Flows** - Connect activities with sequence flows
4. **Add Frames** - Extend diagrams with additional sections
5. **Annotate** - Add notes and documentation
## Auto-Generated BPMN from Process Data
One of mindzie's most powerful features is the ability to automatically generate BPMN diagrams directly from your actual process data.
### Advantages of Auto-Generated BPMN

#### As-Is Process Mapping
- Start with your **actual data flows** instead of theoretical models
- Generate diagrams based on **real process execution**
- Avoid the "boardroom mapping" problem
- Get accurate representation of current state
#### Living Documentation
- Diagrams **automatically update** with your data
- Always reflects the current process state
- No manual maintenance required
- Stays synchronized with actual operations
#### Multiple Use Cases
- **Conformance Checking** - Compare actual vs. intended process
- **Compliance Documentation** - Always current regulatory documentation
- **Training Materials** - Accurate process guides for new employees
- **Process Analysis** - Understand actual process behavior
### Generating BPMN from Data
To automatically generate BPMN diagrams:
1. Use the [BPMN Calculator](/mindzie_studio/calculators/bpmn) within mindzieStudio
2. Configure your process data source
3. The system automatically generates the BPMN diagram
4. The diagram reflects your actual process flows
### Editing Auto-Generated Diagrams

After auto-generation, you can enhance and customize:
1. Click **Edit** on the generated diagram
2. The diagram migrates to the BPMN Editor
3. Extend and modify as needed
4. Add additional details and annotations
### Extending Auto-Generated Diagrams

Once in the BPMN Editor, you can:
- **Map Out Details** - Add granular process steps
- **Add Notes** - Include insights and observations
- **Create Swim Lanes** - Define incremental organizational boundaries
- **Add Documentation** - Include training materials and guidelines
- **Annotate Changes** - Document process improvements
- **Export and Share** - Save for distribution
## Workflow: From Data to Documentation
### The Complete Process
1. **Auto-Generate** - Create initial BPMN from actual process data
2. **Review** - Verify the generated diagram matches expectations
3. **Edit** - Enhance with additional details and annotations
4. **Maintain** - Keep updated as process data changes
5. **Export** - Use for training, compliance, and analysis
### Benefits of This Approach
- **Accuracy** - Based on real data, not assumptions
- **Efficiency** - Automated generation saves time
- **Currency** - Always up-to-date with actual processes
- **Flexibility** - Can be customized and extended
- **Compliance** - Maintains documentation standards
## Use Cases
### Process Discovery
- Generate as-is process maps from event logs
- Identify actual process flows and variations
- Discover hidden process paths
### Compliance and Auditing
- Create compliant BPMN documentation
- Maintain current process documentation
- Support audit requirements with accurate diagrams
### Training and Onboarding
- Provide accurate process guides
- Show actual process flows
- Update training materials automatically
### Process Improvement
- Visualize current state (as-is)
- Design future state (to-be)
- Compare processes over time
- Identify optimization opportunities
### Conformance Checking
- Compare planned vs. actual processes
- Identify deviations and exceptions
- Monitor process compliance
## Best Practices
### For Manual Diagram Creation
1. **Follow BPMN Standards** - Use proper notation and conventions
2. **Keep It Clear** - Avoid overly complex diagrams
3. **Use Swim Lanes** - Clearly show organizational responsibilities
4. **Document Decisions** - Add notes at key decision points
5. **Save Regularly** - Export and backup your work
### For Auto-Generated Diagrams
1. **Start with Auto-Generation** - Let the system create the base
2. **Review Accuracy** - Verify the generated diagram is correct
3. **Enhance Strategically** - Add value through annotations and details
4. **Maintain Currency** - Regenerate periodically to stay current
5. **Document Changes** - Note when you deviate from auto-generated content
### General Best Practices
1. **Consistent Naming** - Use clear, descriptive names
2. **Version Control** - Track diagram versions over time
3. **Collaborate** - Share and review with stakeholders
4. **Purpose-Driven** - Create diagrams for specific use cases
5. **Update Regularly** - Keep documentation current
## Integration with mindzieStudio
The BPMN Editor is fully integrated with mindzieStudio:
- Access from the main navigation menu
- Automatically generate from process data
- Edit and customize within the same platform
- Export for use in other tools
- Share with stakeholders
## Support
For assistance with the BPMN Editor:
- Refer to BPMN 2.0 standard documentation for notation details
- Contact mindzie support for advanced features
- Check the [BPMN Calculator documentation](/mindzie_studio/calculators/bpmn) for auto-generation options
- Review the latest documentation for new editor features
---
## Creating Projects
Section: Application Guide
URL: https://docs.mindziestudio.com/mindzie_studio/application-guide/creating-projects
Source: /docs-master/mindzieStudio/application-guide/creating-projects/page.md
# Creating Projects
When you create a project in BPMN Studio, mindzieStudio guides you with two ways to start: model a process by hand on a blank canvas, or upload pictures of a process and let AI build the BPMN diagram for you.
## Overview
Every diagram in BPMN Studio lives inside a project. The guided new-project flow makes it easy to begin the right way:
1. **Start from scratch** - opens a blank canvas so you can model your process by hand.
2. **Generate from a picture** - you upload photos or screenshots of a flow, and the AI builds a BPMN 2.0 diagram for you automatically.
Both options are shown up front on the BPMN Studio projects screen, so the best way to start is always one click away.
## When to Use Each Option
Use **Start from scratch** when you:
- Already know the process and want to model it yourself
- Are designing a new process from a blank slate
- Want full manual control over every element
Use **Generate from a picture** when you:
- Have a photo of a whiteboard sketch, a screenshot of a flow, or a diagram in another tool
- Want a head start instead of an empty canvas
- Prefer to upload what you have and let AI do the first draft
## How to Access
BPMN Studio is available from the module selector after you sign in. Inside BPMN Studio, open the **Projects** screen. The two starting options appear at the top, and the **New project** button opens the same chooser.

## Start from Scratch
1. Choose **Start from scratch**.
2. Enter a project name and an optional description.
3. Select **Create**.
Your project is created and you can open the BPMN Editor to begin modeling.
## Generate from a Picture
This option walks you through a short wizard.

1. **Name** - give your project a name (and an optional description).
2. **Pictures** - add one or more photos or screenshots of your process. Images (.png, .jpg, .jpeg, .bmp) are the typical input; PDF, Word (.docx), and Visio (.vsdx) files also work.
3. **Review & start** - confirm what will be built, then select **Start building**.
After you start, the diagram is generated in the background. You can leave the page and keep working - mindzieStudio emails you when the diagram is ready, and it appears under your new project. You can also select **View progress** to watch the generation live.

## Related Documentation
- [BPMN Editor](/mindzie_studio/application-guide/bpmn-editor)
- [Project Management](/mindzie_studio/application-guide/project-management)
---
## Projects
Section: Application Guide
URL: https://docs.mindziestudio.com/mindzie_studio/application-guide/projects
Source: /docs-master/mindzieStudio/application-guide/projects/page.md
# Projects
## Overview
Projects in mindzie Studio provide a simple way to organize your process improvement work. They serve as containers for data sets, analysis, dashboards, and other process mining artifacts, helping you maintain structure and security across your process improvement initiatives.

## What are Projects?
Projects are organizational containers that allow you to:
- Group related process analysis work
- Organize by customer, business process, or business unit
- Manage multiple data sets within a single context
- Control user access and permissions
- Share process analysis with stakeholders
## Common Project Organization Strategies
### For Consultants
- **One project per customer** - Keep client work separate and secure
- **One project per engagement** - Organize by specific consulting projects
- **Multi-client projects** - Group similar industries or processes
### For Internal Teams
- **By Business Process** - Separate Order-to-Cash, Procure-to-Pay, etc.
- **By Business Unit** - Finance, Operations, Sales, etc.
- **By Initiative** - Specific improvement projects or transformation efforts
- **By Geography** - Regional or location-specific analysis
### Flexible Data Organization
Within each project, you can include:
- **Single Data Set** - Focused analysis on one process
- **Multiple Data Sets** - Compare processes, time periods, or variations
- **Related Processes** - End-to-end process chains
## Creating a New Project

To create a new project:
1. Click **Add New Project** in the top right corner
2. Choose from three options:
### Create Empty Project
- Start with a blank project
- Add data sets manually
- Build analysis from scratch
- Best for custom work
### Upload Project Package
- Import a previously saved project
- Share projects between environments
- Restore backed-up projects
- Transfer work between users
### Select from Project Gallery
- Access mindzie's sample projects
- Industry-specific examples
- Process templates and best practices
- Contact support@mindzie.com for additional samples
## Project Views
### Card View
The default card view provides:
- Visual project cards with thumbnails
- Quick access to projects
- At-a-glance project information
- Easy navigation
### List View

Switch to list view for:
- Tabular project listing
- Quick edit access
- Bulk project management
- Detailed project information
To switch views:
- Click the **List View icon** in the top right corner
- Toggle between card and list display
## Project Organization
### Shared Projects
Projects shared with you by other users appear in the "Shared Projects" section at the top.
### My Projects
Projects you own or have created appear in the "My Projects" section below.
## Managing Projects
### Project Menu Options

Access project management by clicking the **three dots** on any project card:
#### Edit Project
- Modify project name and details
- Update project settings
- Change project configuration
#### Add/Remove Thumbnail
- **Add Thumbnail** - Upload custom project image
- **Remove Thumbnail** - Return to default appearance
- Helps visual identification
#### Save Project Package
- Export entire project
- Share with other users
- Back up project work
- Transfer between environments
#### Import Application Colors and Charts
- Apply standardized styling
- Maintain brand consistency
- Reuse color schemes
#### Remove Project Colors
- Reset to default colors
- Administrator setting only
- Clear custom styling
#### Delete Project
- Permanently remove project
- Cannot be undone
- Removes all associated data and analysis
#### Assign Users
- Control project access
- Set user permissions
- Manage collaboration
## User Access and Security

### Assigning Users to Projects
1. Click the **three dots** on a project card
2. Select **Assign Users**
3. Choose users from the list
4. Set permission levels
### Permission Levels
#### Owner
- Full project control
- Can edit and delete project
- Can assign other users
- Can share with others
- Manages project security
#### Contributor
- Can access project
- Can view and analyze data
- Cannot modify project settings
- Cannot assign users
### Managing User Access
From the Assign Users dialog:
- **Select from All Users** - Add multiple users at once
- **Remove All Users** - Clear all user assignments
- **Owner Checkbox** - Grant owner-level permissions
- **Security Layer** - Users not assigned cannot see the project
### Security Benefits
Project-based security provides:
- **Access Control** - Only assigned users can see projects
- **Data Privacy** - Separate sensitive client or business data
- **Collaboration** - Share selectively with team members
- **Compliance** - Meet data access requirements
## Administrator Features
### Show All Projects

Administrators have special capabilities:
#### Access All Projects
If you are an administrator:
1. Enable **Show All Projects** toggle
2. View projects you don't have access to
3. Identify projects with the **head icon**
4. Click the head icon to assign yourself
#### Taking Ownership
Useful when:
- Original project creator has left the organization
- Projects need to be reassigned
- Administrative maintenance required
- Project ownership needs transfer
To take ownership:
1. Enable **Show All Projects**
2. Find the project with the head icon
3. Click the head icon
4. You are automatically assigned as owner
5. You can now manage or reassign the project
## Project Packages
### Saving Project Packages
Project packages allow you to:
- **Export Projects** - Save complete project with all data and analysis
- **Share Templates** - Create reusable project templates
- **Backup Work** - Protect against data loss
- **Transfer Projects** - Move between environments
To save a project package:
1. Click the three dots on a project
2. Select **Save Project Package**
3. Choose save location
4. Package includes data, analysis, dashboards, and settings
### Using Project Packages
Project packages are useful for:
- Sharing best practices across teams
- Creating starter templates for common processes
- Backing up important analysis work
- Migrating between development and production
- Training new users with pre-configured examples
## Best Practices
### Project Organization
1. **Clear Naming** - Use descriptive, consistent project names
2. **Logical Structure** - Group related work together
3. **Regular Cleanup** - Archive or delete unused projects
4. **Security First** - Only assign necessary users
5. **Document Purpose** - Use project descriptions
### Data Management
1. **Multiple Data Sets** - Use when comparing processes
2. **Time-Based Organization** - Separate by period when relevant
3. **Version Control** - Save project packages at milestones
4. **Clean Data** - Remove test or obsolete data sets
### Collaboration
1. **Assign Appropriately** - Give users the right permission level
2. **Owner Distribution** - Have multiple owners for important projects
3. **Regular Review** - Audit user access periodically
4. **Clear Communication** - Document project purpose and scope
### Performance
1. **Project Size** - Keep projects focused and manageable
2. **Data Volume** - Monitor data set sizes
3. **Regular Maintenance** - Clean up old analysis
4. **Archive Completed** - Save and remove finished projects
## Project Gallery
The Project Gallery provides:
- Industry-specific example projects
- Process templates and best practices
- Pre-configured analysis and dashboards
- Learning and training resources
### Accessing Additional Samples
To request sample project packages:
1. Contact support@mindzie.com
2. Specify your industry or process type
3. Request specific use cases or examples
4. mindzie support will provide relevant samples
## Support
For assistance with projects:
- Contact mindzie support for project gallery samples
- Refer to data import documentation for adding data sets
- Check security documentation for advanced permission settings
- Review the latest documentation for new project features
---
## Apps
Section: Application Guide
URL: https://docs.mindziestudio.com/mindzie_studio/application-guide/apps
Source: /docs-master/mindzieStudio/application-guide/apps/page.md
# Apps
Apps in mindzieStudio let you bundle dashboards, and analysis into a focused, purpose-built view for specific audiences. Instead of giving every user access to the full project workspace, you can create an app that contains only the dashboards and views relevant to their role.
## Overview
Apps are tenant-level containers that sit above individual projects. A single app can pull content from multiple projects, making it easy to build cross-project views. Each app has its own navigation sidebar, categories for organizing content, and user access controls.
**Key characteristics:**
- Apps span across projects -- you can include content from any project in the tenant
- Each app has its own set of assigned users with role-based access
- Users assigned to an app see only that app's content when they log in
- Apps support categories and subcategories for organizing content
## When to Use Apps
Use apps when:
- You need to give executives a simplified view with only high-level dashboards
- Operational staff need access to specific monitoring dashboards without seeing the full project
- You want to combine content from multiple projects into a single view
- You need to control which users see which dashboards and investigations
- You want to provide a focused, role-based experience for different user groups
## Accessing the Apps Page
To access apps, click **Apps** in the top navigation bar of mindzieStudio.

The Apps page is divided into two sections:
- **Shared Apps** -- apps that have been shared with you or the entire tenant
- **My Apps** -- apps you have created
Each app card displays the app name, creator, and creation date. The icons in the top-left corner of each card indicate user access levels.
## Creating a New App
### Step 1: Start the App Creation
1. Navigate to the **Apps** page
2. Click **Add New App** in the top-right corner
The app editor opens with a sidebar containing two tabs: **General** and **Categories**.

### Step 2: Set the App Name and Description
1. On the **General** tab, enter a **Name** for your app (e.g., "Executive App")
2. Optionally add a **Description** to explain the purpose of the app
3. Click **Save**
### Step 3: Add Categories (Optional)
Categories help organize the content within your app. For example, you might create categories like "Reporting", "Monitoring", or "Analysis".
1. Click the **Categories** tab in the sidebar
2. Click the add button to create a new category
3. Enter a **Title** and optional **Description**
4. Click **Submit**

You can create multiple categories and even nest subcategories within them.
## Adding Content to an App
Once your app is created, you can add dashboards and analysis to it from anywhere in mindzieStudio.
### Adding a Dashboard to an App
1. Navigate to **Dashboards** and open the dashboard you want to add

2. Click the three-dot menu (**...**) on the dashboard and select **Add to App**
3. In the **Add To App** dialog, you will see your available apps and their categories

4. Select where to place the dashboard:
- Click **Top Level** to add it directly to the app root
- Click a specific category (e.g., **Reporting**) to place it under that category
5. Click **Add**
## Viewing an App
When you open an app, it displays with its own sidebar navigation. The sidebar shows the app content organized by the categories you created.

The sidebar contains:
- Items added to the top level of the app
- Expandable category sections with their assigned items
- Navigation links to each dashboard or view
Users who are assigned to an app and log in to mindzieStudio will see only the app content -- they will not have access to the full project workspace.
## Managing App Users
You can control who has access to each app by assigning users with different roles.
### Assigning Users
1. On the **Apps** page, click the three-dot menu (**...**) on the app card
2. Select **Assign Users**
The **Manage App Users** dialog displays:
- A dropdown to search and add users
- A list of currently assigned users with their roles
- Controls to change roles or remove users
### User Roles
There are three access levels for app users:
- **Owner** -- full control over the app, including editing, adding content, and managing users
- **Contributor** -- can add and modify content within the app
- **Read-only (User)** -- can only view the app content; this is the most common role for end users
By default, the person who creates the app is the owner.
## Managing Apps
### App Card Options
From the Apps page, click the three-dot menu (**...**) on any app card to access these options:
- **Assign Users** -- manage who can access the app
- **Edit** -- modify the app name, description, and categories
- **Upload Thumbnail** -- set a custom image for the app card
- **Delete App** -- permanently remove the app
### Deleting an App
When deleting an app, a confirmation dialog appears requiring you to acknowledge that the app and its related entities will be permanently deleted. Check the confirmation box and click **Confirm** to proceed.

## Best Practices
1. **Name apps by audience** -- use clear names like "Executive Overview" or "Operations Dashboard" so users know which app is for them
2. **Use categories to organize** -- group related dashboards under categories like "Reporting", "Monitoring", or "Analysis"
3. **Assign minimal access** -- give most users read-only access unless they need to modify app content
4. **Combine across projects** -- take advantage of apps spanning multiple projects to build comprehensive views
5. **Keep it focused** -- include only the dashboards and views that are relevant to the target audience
## Related Documentation
- [Dashboards](../dashboards)
- [Investigations](../investigations)
## Support
If you encounter issues with Apps:
- Email: support@mindzie.com
---
## URL Deep Links
Section: Application Guide
URL: https://docs.mindziestudio.com/mindzie_studio/application-guide/url-deep-links
Source: /docs-master/mindzieStudio/application-guide/url-deep-links/page.md
# URL Deep Links
mindzieStudio supports direct URL navigation to specific entities. All URLs use query parameters and require authentication.
## Entity Navigation URLs
These URLs use the `/navigate` endpoint to open specific entities:
| Entity | URL Pattern |
|--------|-------------|
| Analysis | `/navigate?type=analysis&tenantid={tenantId}&analysisid={notebookId}` |
| Dashboard | `/navigate?type=dashboard&tenantid={tenantId}&dashboardid={dashboardId}` |
| Block | `/navigate?type=block&tenantid={tenantId}&blockid={blockId}&analysisid={notebookId}` |
| Tenant | `/navigate?type=tenant&tenantid={tenantId}` |
| Enrichment (by enrichment) | `/navigate?type=enrichment&tenantid={tenantId}&enrichmentid={enrichmentId}` |
| Enrichment (by notebook) | `/navigate?type=enrichment&tenantid={tenantId}&enrichmentnotebookid={enrichmentNotebookId}` |
### Enrichment URL Notes
- **By enrichment_id**: Navigates to the first notebook in the enrichment
- **By enrichment_notebook_id**: Navigates directly to a specific enrichment notebook
One enrichment can contain multiple enrichment notebooks. Use `enrichmentnotebookid` for direct navigation to a specific notebook, or `enrichmentid` to navigate to the first notebook in the enrichment.
## List Page Navigation URLs
These URLs use the `/navigate` endpoint to open list pages with proper tenant/project context:
| Page | URL Pattern |
|------|-------------|
| Projects | `/navigate?type=projects&tenantid={tenantId}` |
| Apps | `/navigate?type=apps&tenantid={tenantId}` |
| Investigations | `/navigate?type=investigations&tenantid={tenantId}&projectid={projectId}` |
| Datasets | `/navigate?type=datasets&tenantid={tenantId}&projectid={projectId}` |
| Actions | `/navigate?type=actions&tenantid={tenantId}&projectid={projectId}` |
| BPMN Editor | `/navigate?type=bpmn&tenantid={tenantId}&projectid={projectId}` |
## Sample URLs
### Entity Navigation Examples
```
# Analysis
https://www.mindziestudio.com/navigate?type=analysis&tenantid=02568EE1-083B-4A11-97A4-8944F5FCEB6D&analysisid=07651057-0682-4241-8C62-F345A5678DE1
# Dashboard
https://www.mindziestudio.com/navigate?type=dashboard&tenantid=02568EE1-083B-4A11-97A4-8944F5FCEB6D&dashboardid=AE1E87C5-EEE7-471A-801D-8B10CD932873
# Block
https://www.mindziestudio.com/navigate?type=block&tenantid=02568EE1-083B-4A11-97A4-8944F5FCEB6D&blockid=85FF0725-5E12-41FC-89BC-C286C4E86C28&analysisid=07651057-0682-4241-8C62-F345A5678DE1
# Enrichment
https://www.mindziestudio.com/navigate?type=enrichment&tenantid=02568EE1-083B-4A11-97A4-8944F5FCEB6D&enrichmentid=748D875C-7875-42A1-A728-302B1DA1CCB8
# Enrichment Notebook
https://www.mindziestudio.com/navigate?type=enrichment&tenantid=02568EE1-083B-4A11-97A4-8944F5FCEB6D&enrichmentnotebookid=63CAD0FD-A6AA-4BC4-A81C-5323C268FAC1
```
### List Page Navigation Examples
```
# Projects
https://www.mindziestudio.com/navigate?type=projects&tenantid=02568EE1-083B-4A11-97A4-8944F5FCEB6D
# Apps
https://www.mindziestudio.com/navigate?type=apps&tenantid=02568EE1-083B-4A11-97A4-8944F5FCEB6D
# Investigations
https://www.mindziestudio.com/navigate?type=investigations&tenantid=02568EE1-083B-4A11-97A4-8944F5FCEB6D&projectid=6BD84BD0-E1D8-4FA8-8E44-53805FFBA16C
# Datasets
https://www.mindziestudio.com/navigate?type=datasets&tenantid=02568EE1-083B-4A11-97A4-8944F5FCEB6D&projectid=6BD84BD0-E1D8-4FA8-8E44-53805FFBA16C
# Actions
https://www.mindziestudio.com/navigate?type=actions&tenantid=02568EE1-083B-4A11-97A4-8944F5FCEB6D&projectid=6BD84BD0-E1D8-4FA8-8E44-53805FFBA16C
# BPMN Editor
https://www.mindziestudio.com/navigate?type=bpmn&tenantid=02568EE1-083B-4A11-97A4-8944F5FCEB6D&projectid=6BD84BD0-E1D8-4FA8-8E44-53805FFBA16C
```
## Required Parameters
| URL Type | tenantid | projectid | analysisid | blockid | dashboardid | enrichmentid | enrichmentnotebookid |
|----------|----------|-----------|------------|---------|-------------|--------------|---------------------|
| analysis | Required | - | Required | - | - | - | - |
| dashboard | Required | - | - | - | Required | - | - |
| block | Required | - | Required | Required | - | - | - |
| tenant | Required | - | - | - | - | - | - |
| enrichment | Required | - | - | - | - | One of these | One of these |
| projects | Required | - | - | - | - | - | - |
| apps | Required | - | - | - | - | - | - |
| investigations | Required | Required | - | - | - | - | - |
| datasets | Required | Required | - | - | - | - | - |
| actions | Required | Required | - | - | - | - | - |
| bpmn | Required | Required | - | - | - | - | - |
## Notes
- **Authentication required**: Users must be logged in. Unauthenticated users are redirected to login first.
- **Permissions apply**: Users can only access content they have permission to view.
- **ID format**: All IDs are GUIDs (e.g., `02568EE1-083B-4A11-97A4-8944F5FCEB6D`).
- **Case insensitive**: Query parameter names are case-insensitive (`tenantId` and `tenantid` both work).
## Finding Entity IDs
When viewing an entity in mindzieStudio, the ID appears in the browser address bar. You can copy this ID to construct deep link URLs.
---
## Working Calendar Durations (Coming Soon)
Section: Application Guide
URL: https://docs.mindziestudio.com/mindzie_studio/application-guide/working-calendar-durations
Source: /docs-master/mindzieStudio/application-guide/working-calendar-durations/page.md
:::coming-soon
**Coming Soon** - This feature is currently in development and will be available in an upcoming release.
:::
# Working Calendar Duration Calculations
## Overview
mindzie now supports **working calendar-aware duration calculations** across filters, calculators, and enrichment operators. When enabled, duration calculations exclude non-working time such as nights, weekends, and holidays - giving you accurate business hour measurements instead of raw calendar time.
## How It Works
### Standard Calendar Time vs Working Calendar Time
| Scenario | Calendar Time | Working Calendar Time (9-5 Mon-Fri) |
|----------|---------------|-------------------------------------|
| Monday 4pm to Tuesday 10am | 18 hours | 2 hours (1hr Mon + 1hr Tue) |
| Friday 3pm to Monday 9am | 66 hours | 2 hours (Fri 3-5pm only) |
| Activity on a holiday | Counted | Excluded |
### The "Use Working Calendar" Option
When a Working Calendar is configured on your event log, a new checkbox appears in duration-related editors:
```
[x] Use Working Calendar (business hours only)
When enabled, durations exclude nights, weekends, and holidays
defined in the working calendar.
```
**Important:** This option only appears when your event log has a Working Calendar configured. If you don't see the option, you need to first add the "Set Working Calendar" enrichment to define your business hours.
## Setting Up a Working Calendar
Before you can use working calendar durations, you must configure a Working Calendar on your event log:
1. Open your notebook/analysis
2. Add an enrichment block
3. Select **Set Working Calendar** operator
4. Configure your working hours (e.g., 9:00 AM - 5:00 PM)
5. Configure working days (e.g., Monday - Friday)
6. Optionally add holidays
7. Execute the notebook
Once configured, all duration editors will show the "Use Working Calendar" option.
## Supported Components
The following components support the Use Working Calendar option:
### Filters
| Filter | Description |
|--------|-------------|
| **Case Duration** | Filter cases by total duration from first to last event |
| **Time Between Activities** | Filter cases by duration between two specific activities |
### Calculators
| Calculator | Description |
|------------|-------------|
| **Time Between Selected Events** | Calculate duration statistics between two event types |
| **Time To Activity** | Calculate duration from case start to a specific activity |
### Enrichment Operators
| Operator | Description |
|----------|-------------|
| **Duration Between Activities** | Create a case attribute with time between two activities |
| **Duration From Attribute To Activity** | Calculate duration from a date attribute to an activity |
| **Duration From Case Attribute To Activity Times** | Calculate duration from case attribute to multiple activity occurrences |
| **Time Difference From Activity To Current Time** | Calculate aging from an activity to current time |
| **Time Difference From Current Time** | Calculate aging from a date attribute to current time |
| **Event Time Difference** | Calculate duration between two event-level date/time attributes |
## Behavior Details
### Tri-State Logic
The Use Working Calendar setting uses tri-state logic:
| Value | Behavior |
|-------|----------|
| **Unchecked** | Force calendar time (ignore working calendar even if configured) |
| **Checked** | Force working calendar (use business hours only) |
| **Default** (when not explicitly set) | Follow log default setting |
### Graceful Fallback
If Use Working Calendar is enabled but no calendar is configured on the log, the calculation silently falls back to standard calendar time. This ensures backward compatibility and prevents errors.
### Persistence
The Use Working Calendar setting is saved with the filter, calculator, or enrichment operator configuration. When you edit an existing block, the setting will be restored to its previous value.
## Use Cases
### Measuring True Processing Time
**Scenario:** You want to measure how long your team takes to process invoices, but raw calendar time includes nights and weekends when no one is working.
**Solution:**
1. Configure a 9-5 Mon-Fri working calendar
2. Use the "Duration Between Activities" enrichment with Use Working Calendar enabled
3. Durations now reflect actual working time
### SLA Compliance Monitoring
**Scenario:** Your SLA requires responding to customer requests within 4 business hours, not 4 calendar hours.
**Solution:**
1. Configure your working calendar with your support hours
2. Use "Time Difference From Activity To Current Time" with Use Working Calendar enabled
3. Filter or alert on cases exceeding 4 hours of working time
### Accurate Aging Reports
**Scenario:** You need to report on how long cases have been waiting, but weekends shouldn't count against the aging metric.
**Solution:**
1. Configure a working calendar
2. Use "Time Difference From Current Time" with Use Working Calendar enabled
3. Aging reflects only business hours
## Technical Notes
- Working calendar calculations use the `WorkingCalendarCalculator` class centrally
- All duration calculations route through this calculator when enabled
- The working calendar is stored on the `SuperLog` object
- Calculations support complex calendars with varying hours per day and holiday exceptions
## Related Documentation
- [Filters Overview](/mindzie_studio/core-concepts/filters)
- [Calculators Overview](/mindzie_studio/core-concepts/calculators)
- [Enrichments Overview](/mindzie_studio/core-concepts/enrichments)
---
## Task Mining Agent Installation
Section: Task Mining
URL: https://docs.mindziestudio.com/mindzie_studio/task-mining/task-mining-agent-installation
Source: /docs-master/mindzieStudio/task-mining/task-mining-agent-installation/page.md
# Task Mining Agent Installation
## Overview
The mindzie Task Mining Agent is a desktop application that captures user interactions with their computer, including mouse clicks, keyboard actions, and application usage. This data can be used for process discovery, task analysis, and workflow optimization within mindzie Studio.
## Prerequisites
- Windows operating system
- Administrator privileges for installation
- Internet connection for downloading the installer
## Installation Steps
### Step 1: Download the Agent
Download the mindzie Task Mining Agent installer:
Download mindzie Task Mining Agent
### Step 2: Install the Agent
1. Run the downloaded installer file (`mindzieTaskMiningAgentSetup.exe`)
2. Follow the installation wizard prompts
3. Choose whether to launch the agent automatically after installation
### Step 3: Launch the Agent
After installation, you can launch the Task Mining Agent in two ways:
- From the Windows Start menu
- Automatically on startup (if selected during installation)
## Using the Task Mining Agent
### Main Interface
When the agent launches, you will see the main control interface with the following controls:
- **Record Button**: Start tracking user interactions on the desktop
- **Logs Button**: Open the directory where task mining logs are stored
### Starting a Recording
1. Click the **Record** button to begin capturing user interactions
2. A configuration dialog will appear with the following settings:
- **Case ID**: Optional identifier to link recordings to specific cases in process mining logs
- **Username**: Automatically captured from the system (can be modified)
- **Notes**: Add any additional context or information about the recording session
3. Click **OK** to start the recording
4. The agent will minimize to the system tray to avoid interfering with normal workflow
5. The agent will capture all desktop interactions including:
- Mouse clicks
- Keyboard actions
- Application switching
- Window interactions
### Stopping a Recording
To stop recording, access the agent from the system tray and click the stop button.
## Working with Task Mining Logs
### Log Storage
Task mining logs are automatically saved with a timestamp indicating when they were created. The logs are stored in a dedicated directory that can be accessed via the **Logs** button in the agent interface.
### Using Logs in mindzie
Task mining logs can be utilized in several ways:
#### Direct Import to mindzie Studio
Load task mining logs directly into mindzie Studio for immediate analysis and visualization.
#### Merge Multiple Logs
Use mindzie Data Designer to:
- Combine multiple task mining logs from different users or sessions
- Create comprehensive views of multi-user processes
- Analyze patterns across different recording sessions
#### Integration with Process Mining Data
Task mining data can be integrated with existing process mining logs in mindzie Data Designer:
- Link task mining activities to specific cases using the Case ID field
- Enrich process mining data with detailed desktop interaction information
- Create end-to-end process views combining system events and user actions
## Best Practices
### Recording Configuration
- **Use Case IDs**: When recording tasks related to specific process instances, always enter a Case ID to simplify integration with process mining data
- **Descriptive Notes**: Add meaningful notes to each recording session to provide context for later analysis
- **Username Accuracy**: Verify the username is correct for proper attribution in multi-user analysis
### Recording Sessions
- **Focus on Complete Tasks**: Record entire task workflows from start to finish
- **Minimize Interruptions**: Avoid unrelated activities during recording sessions
- **Regular Stops**: Stop and start new recordings for distinct tasks rather than one continuous recording
### Log Management
- **Regular Exports**: Periodically export or back up task mining logs
- **Organized Storage**: Use descriptive filenames and maintain organized log directories
- **Timely Analysis**: Import logs into mindzie Studio or Data Designer promptly for analysis
## Troubleshooting
### Agent Won't Launch
- Verify the installation completed successfully
- Check Windows Event Viewer for error messages
- Try reinstalling the agent with administrator privileges
### Recording Not Capturing Events
- Ensure the agent has necessary permissions to monitor system events
- Check that the recording was started successfully (agent minimized to tray)
- Verify no security software is blocking the agent's monitoring capabilities
### Cannot Find Log Files
- Click the **Logs** button in the agent interface to open the correct directory
- Check that recordings were properly stopped (not just agent closed)
- Verify sufficient disk space is available for log storage
## Support
For additional assistance with the Task Mining Agent:
- Contact mindzie support at [support@mindzie.com](mailto:support@mindzie.com)
- Visit the mindzie documentation portal
- Check the mindzie community forums for user discussions and tips
---
## Overview
Section: Release Notes
URL: https://docs.mindziestudio.com/mindzie_studio/release-notes/overview
Source: /docs-master/mindzieStudio/release-notes/overview/page.md
# mindzieStudio Release Notes
Stay up to date with the latest features, improvements, and bug fixes in mindzieStudio.
---
## 2026 Releases
| Version | Release Date | Highlights |
|---------|--------------|------------|
| [2026.153.3](/mindzie_studio/release-notes/2026-153) | June 3, 2026 | Workspace selector home screen, BPM Studio (Beta), AI Jobs (Beta), On-demand backups |
| [2026.140.1](/mindzie_studio/release-notes/2026-139) | May 19, 2026 | mindzieBackup utility, Faster event log loading, BPMN Studio approval workflow, Per-tenant settings |
| [2026.095.1](/mindzie_studio/release-notes/2026-095) | April 5, 2026 | AI Teammates Hub, Data Designer rebuild, Multi-language localization, Conformance redesign |
| [2026.011.4](/mindzie_studio/release-notes/2026-011) | January 11, 2026 | mindzieDesktop 26 standalone, REST API expansion, Flow Animation, Video Export |
---
## 2025 Releases
| Version | Release Date | Highlights |
|---------|--------------|------------|
| [2025.342.3](/mindzie_studio/release-notes/2025-342) | December 2, 2025 | Offline mode, Setup wizard redesign, Server-level settings, AI Teammate |
| [2025.264.1](/mindzie_studio/release-notes/2025-264) | September 21, 2025 | Azure AD authentication, Python API client, Copilot assistants |
| [2025.199.1](/mindzie_studio/release-notes/2025-199) | July 19, 2025 | Time Difference Calculator, Release Notes page, Security enhancements |
| [2025.115.3](/mindzie_studio/release-notes/2025-115) | April 29, 2025 | Installer progress display, Anonymous SMTP authentication |
| [2025.107.4](/mindzie_studio/release-notes/2025-107) | April 17, 2025 | Data Designer migration to mindzieStudio |
| [2025.078.3](/mindzie_studio/release-notes/2025-080) | March 21, 2025 | Case Stage duration calculation, Minute scheduling |
| [2025.029.1](/mindzie_studio/release-notes/2025-029) | January 26, 2025 | mindzieStudio Apps, Microsoft Teams integration |
---
## 2024 Releases
| Version | Release Date | Highlights |
|---------|--------------|------------|
| [2024.364.2](/mindzie_studio/release-notes/2024-364) | December 30, 2024 | Standalone dashboard authentication, Scheduler improvements |
| [2024.340.11](/mindzie_studio/release-notes/2024-340) | December 3, 2024 | BPMN improvements, USER role export permissions |
| [2024.310.1](/mindzie_studio/release-notes/2024-310) | November 6, 2024 | Project portability, Theme customization, BPMN suite |
| [2024.285.4](/mindzie_studio/release-notes/2024-285) | October 10, 2024 | Project management, UI customization, Command Center, BPMN editor |
---
For older release notes please contact support@mindzie.com
---
## Version 2026.153.3
Section: Release Notes
URL: https://docs.mindziestudio.com/mindzie_studio/release-notes/2026-153
Source: /docs-master/mindzieStudio/release-notes/2026-153/page.md
# Version 2026.153.3
**Release Date:** June 3, 2026
---
## New Features
### New Home Screen with Workspace Selector
After you sign in and choose a tenant, mindzieStudio now opens on a redesigned home screen. From here you pick the workspace you want to work in:
- **Process Intelligence** - analyze process mining and task mining event logs, and generate dashboards.
- **BPM Studio (Beta)** - model, review, and approve business processes using BPMN 2.0.
- **Data Designer** - build event logs from raw system data using SQL, transforms, and AI.
The home screen also includes a **Pick up where you left off** feed that gathers your recently modified dashboards, investigations, BPMN diagrams, and actions across the tenant, each tagged with its workspace, a relative timestamp, and a "You" marker. Filter chips let you narrow the feed to a single workspace. Every workspace has a **Home** button to return to the selector, and bookmarkable URLs let you jump straight into a workspace.
Access to each workspace is role based. If you don't have permission for a workspace, its card is shown locked with a short explanation rather than letting you open it.
### BPM Studio (Beta)
BPM Studio - the BPMN 2.0 process modeling workspace - is now available in Beta to all tenants (for users with the required role). New in this release:
- **Guided new-project chooser** - when you create a project, choose **Start from scratch** to model manually, or use one of the AI starting points below.
- **Generate from a picture** - upload an image of a process and have it turned into an editable BPMN diagram.
- **Start from an SOP** - upload one or more standard operating procedure documents (PDF, Word, text, or Markdown) and generate a BPMN diagram from them.
- **Auto layout** - a toolbar button arranges your whole diagram in one click, and the result can be undone with a single Ctrl+Z.
- **Export** - download any diagram as PNG, SVG, PDF, or Microsoft Visio (.vsdx).
- **Editor refinements** - the canvas re-fits when the window is resized so new diagrams aren't clipped, scrolling over an open menu no longer zooms the canvas, and entry-start cards now fill the full width.
### AI Jobs (Beta)
AI Investigations has been renamed **AI Jobs** and promoted from Alpha to Beta, available to all tenants (for users with the required permission). AI Jobs run AI agents that turn your inputs - documents, pictures, and SOPs - into results such as dashboards, reports, and BPMN diagrams.
- **Redesigned run experience** - a chat-style page with a live activity feed, honest progress, and (for BPMN jobs) a live diagram preview that updates as the agent works.
- **Persistent chat and reports** - your conversation and generated reports are saved, so they survive across sessions.
- **Add files to a running job** - upload data files and additional supporting files while a job is in progress.
- **Stop button** - cancel the running agent turn at any time.
- **Downloadable reports** - save the reports a job produces.
- **Email notifications** - receive an email when a job completes or fails.
- **On/off control** - administrators can enable or disable AI Jobs per tenant.
### Run Backup Now and Backup History
The administration **Backups** page adds a **Run backup now** button so administrators can trigger a backup on demand, plus a backup history page to review past backups.
### Configurable AI Agent Host
Administrators can now set the AI agent host from a Server Settings page, making it easier to point mindzieStudio at the correct agent environment for a deployment.
### Expanded "Copy for API" in the About Dialog
The About dialog's copy-for-API option now includes the product, tenant, and project names alongside their IDs, so the values you paste into API tools and support tickets are easier to read.
---
## Improvements
### Faster Home Feed
The **Pick up where you left off** feed loads asynchronously, so the home screen appears quickly even when there is a lot of recent activity to gather.
### Localized Workspace Selector
Changing the interface language now keeps you on your current tenant and fully localizes the workspace selector. (Bug #7515)
### Run Enrichments via the API
Enrichments can now be executed through the stateless API, making it easier to drive enrichment runs from external automation. (AB#7463)
---
## Bug Fixes
| Task | Title | Description |
|------|-------|-------------|
| 7043 | Editable Multi-Selector | Multi-Selector panels are now editable, and an unwanted internal scrollbar was removed from the histogram |
| 7054 | Conformance Diagram Scrolling | The BPMN diagram on the conformance page now scrolls, and the variant list refreshes after a run |
| 7059 | Calculator Dropdown Sorting | Discovery and BPMN calculator dropdowns are now sorted alphabetically |
| 7085 | Histogram Scrollbar | Removed an unnecessary internal scrollbar from the histogram panel |
| 7106 | Expected Order Saving | Expected Order now saves into the engine-controlled notebook like other engine settings |
| 7126 | Data Designer Empty Files | Empty files are removed automatically before a build so the build no longer fails |
| 7133 | Resource Column Discovery | Added clearer guidance for discovering the resource column in Data Designer |
| 7163 | Conformance Clear | Clearing conformance now keeps you on the variants page instead of returning to the getting-started screen |
| 7164 | Variant List Refresh | The variant list now refreshes after a conformance run completes |
| 7393 | Event Log Round-Trip | Restored the expected column-name convention when round-tripping event log files |
| 7458 | CSV Import and Export | Date and number detection now respects the active culture, and exports are anchored to tenant settings |
| 7462 | API Notebook Blocks | Notebook blocks created through the API are no longer removed when the server restarts |
| 7465 | Teams Webhook Flood | A dead Microsoft Teams webhook is now circuit-broken to stop a flood of error log entries |
| 7507 | Dataset Wizard Scrolling | Long enrichment steps in the dataset wizard now scroll instead of being clipped off-screen |
---
## Version 2026.140.1
Section: Release Notes
URL: https://docs.mindziestudio.com/mindzie_studio/release-notes/2026-139
Source: /docs-master/mindzieStudio/release-notes/2026-139/page.md
# Version 2026.140.1
**Release Date:** May 19, 2026
---
## New Features
### mindzieBackup Utility
A new console utility provides full backup of both the mindzieStudio database and project storage. Backups can be triggered on demand or run automatically through a built-in daily scheduler that is configured during installation. The utility also handles restore, including snapshot and restore of database users and roles, and automatically stops the application service and IIS app pool to ensure a clean restore.
### Faster Event Log Loading
Event log storage has been upgraded to deliver dramatically faster load times for large logs - what used to take minutes now takes seconds. The upgrade runs once per project through a guided in-app page that shows progress and clear next steps for administrators.
### BPMN Studio Approval Workflow
BPMN Studio now includes a full approval workflow for process models. A three-role review model (business owner, IT, and compliance reviewer) is paired with a three-tab inbox so reviewers can see what is pending their approval, what they have approved, and the full approval history. Each diagram tracks Publish, Deprecate, and Archive lifecycle states, and a new properties panel exposes diagram metadata for editing.
### BPMN Editor Improvements
The BPMN editor has been significantly expanded: drag elements directly from the palette onto the canvas, pick the next element inline as you build, and drop a new element onto an existing flow to split it. Additional improvements include automatic naming rules, diagram diff, one-click documentation generation, and image and PDF export. A new linter catches common modeling problems before publish, and the canvas auto-fits to the diagram when opened.
### Per-Tenant Settings and Manage Tenants Grid
The Manage Tenants page is now a sortable grid, and each tenant has its own settings page so administrators can configure tenant-specific options without leaving the page.
### Connected Users Last Activity
The Connected Users page now displays the last activity timestamp for each user, sourced from the audit log, making it easier to see who is actively working in the system.
### About Dialog API Helpers
The About dialog now includes copy buttons for the current tenant ID, project ID, and base URL. These values are ready to paste into API testing tools, scripts, or support tickets.
### AI Dashboard HTML Download
A Download HTML button has been added to AI Dashboards so you can save and share the full standalone HTML of any generated dashboard.
### Process Map Enhancements
The process map now draws arrows in the middle of each edge instead of only at the end, scales those arrows with the edge thickness, and shows per-edge wait-time labels directly on the diagram. When wait-time labels are shown, the colored heatmap overlay is hidden automatically to keep the view readable.
### Settings Consolidation
All regional settings (date format, time format, language, etc.) have been consolidated into a single tabbed Regional Settings panel for easier configuration.
### Error Logs Improvements
Error logs are now variant-aware, letting you scope errors to a specific variant of your process, and a new date-range Download All option lets you export every matching log entry for offline analysis.
### Docker Management in Configuration App
Docker container management has been moved out of the web UI and into the standalone Configuration app, where the Docker daemon URL is now configurable to support Windows Server deployments.
---
## Improvements
### Scheduled Actions Reliability
Scheduled actions now skip missed runs after a server restart instead of firing all backlogged runs at once, preventing notification storms after maintenance windows.
### SMTP Configuration
SMTP settings now load correctly when SMTP authentication is disabled, allowing relay configurations that do not require credentials.
### URL Generation
URLs generated from dashboards and notebooks now use the standard `/navigate?type=...` format, making them more reliable across deep links and shared links.
---
## Bug Fixes
| Task | Title | Description |
|------|-------|-------------|
| 7102 | Copilot Tool Calling Accuracy | Fixed O3 models incorrectly showing 0% tool calling accuracy in Auto-Configure |
| 7141 | Default User Role Typo | Corrected "Admininstrator" typo in the default user role label |
| 7228 | DateTime Parser Timezone | Fixed Data Designer DateTime parser failing on ISO 8601 dates that include a timezone offset |
| 7231 | Base Knowledge Timeout | Resolved Copilot base knowledge execution timing out after 5 minutes when all notebooks were pending |
| 7239 | Desktop Logging Crash | Fixed Desktop crash when Windows Event Log access is denied during message logging |
| 7240 | Desktop Update Check | Fixed Desktop page crash when the software update version check times out |
| 7241 | Desktop Startup Delay | Eliminated ~42 second Desktop startup delay when the update service is unreachable |
| 7245 | Project Deletion Timeout | Resolved timeout when deleting large projects |
| 7266 | Calculator Cost Logging | Stopped repeated invalid-type log entries during cost enrichment runs |
| 7267 | Calculator Concurrency | Fixed an intermittent error when multiple calculators ran at the same time |
| 7268 | Error Page Crash | Fixed crash that appeared on every page when no project was selected |
| 7269 | Investigation Explorer Crash | Fixed crash when opening the Investigation Explorer |
| 7270 | Navigation Crash | Fixed intermittent crash during page navigation |
| 7274 | Disable Account | Fixed Disable Account action so it correctly disables the user |
| 7278 | Action from AI Report | Fixed creating a new action from the AI Process Analyst report |
| 7279 | Block Image Rendering | Fixed block image rendering returning 500 in production |
| 7280 | Notebook Load Crash | Fixed notebook load crash affecting newly created analyses |
| 7281 | Copilot Context Restored | Fixed a Base Knowledge repair loop that left Copilot without context for affected investigations |
| 7292 | Investigation Count Off-by-One | Fixed Total Analyses count on the investigation list being off by one |
| 7293 | Notebook Name Truncation | Fixed long notebook names being cut off in the UI |
| 7294 | Dashboards URL Redirect | Fixed `/dashboards?projectId=X` URL redirecting to `/projects` instead of loading the dashboards list |
| 7298 | New Empty Analysis Error | Fixed error when creating a new empty analysis |
---
## Version 2026.095.1
Section: Release Notes
URL: https://docs.mindziestudio.com/mindzie_studio/release-notes/2026-095
Source: /docs-master/mindzieStudio/release-notes/2026-095/page.md
# Version 2026.095.1
**Release Date:** April 5, 2026
---
## New Features
### AI Teammates Hub
A new AI Teammates Hub provides a centralized interface for interacting with specialized AI agents. The hub features sidebar navigation with teammate selection and includes the Builder Teammate (creates real filter and calculator blocks), Actions Teammate (conversational action creation and management), and Help Teammate. Each teammate maintains independent conversation context and supports tool calling for deep integration with mindzieStudio.
### Data Designer Blazor Rebuild
The Data Designer has been completely rebuilt using Blazor and Tailwind CSS, replacing the legacy web interface. The AI capabilities have been split into two specialized assistants: Database Assistant (for schema exploration and SQL queries) and ETL Query Assistant (for building event log extraction queries). The new interface features Monaco code editors, markdown-rendered responses, session persistence, and a multi-agent architecture with improved prompt management.
### Multi-Language UI Localization
The entire mindzieStudio user interface now supports multi-language localization across seven languages: English, German, Spanish, French, Japanese, Dutch, Turkish, and newly added Danish (da-DK). Localization covers authentication pages, admin pages, copilot, AI features, enrichments, settings, notebooks, dashboards, and all wizard components.
### Event Log Configuration Wizard
A new Event Log Configuration Wizard in Data Designer guides users through building event log extraction queries with an interview-style workflow. The wizard includes system detection, process selection, query review, and post-processing steps, with AI-assisted guidance throughout each phase.
### Dataset Configuration Wizard Enhancements
The dataset upload wizard has been redesigned with a simplified stepper, AI-powered automatic configuration, and new steps including Process Information, Data Quality, Activity Cleanup, and Performance analysis. The wizard features a two-panel enrichment progress dialog with real-time execution logging and industry performance benchmarks.
### Case Completion Enrichment
A new Case Completion enrichment uses a milestone-based approach to determine whether cases are complete. This replaces the previous binary case closure model with a more flexible system that can evaluate multiple completion criteria.
### Case Cost Enrichment
New Case Cost enrichment (OperatorCaseCost) calculates the total cost per case by summing individual activity costs. The previous "Estimated Cost" has been renamed to "Activity Cost" for clarity, with a separate "Activity Information" consolidation combining cost-related operators.
### AI Reports
New AI-powered report generation for governance and compliance analysis. Includes three report types: GRC (Governance, Risk, Compliance) Report with case violation lists and compliance dashboards, Process Analyst Report with metric analysis, and SOP (Standard Operating Procedure) Report with procedural sub-steps. Reports can be generated as action steps with email scheduling.
### Conformance Analysis Redesign
The Conformance Analysis page has been redesigned with a tabbed layout for better space efficiency, non-blocking variant calculation, simplified statistics display, and a contextual position next to the Current tab instead of the previous top-level navigation. Includes AI-powered deviation notes per variant and a Getting Started panel for new users.
### Schema Report Service
A new Schema Report feature generates comprehensive database documentation in HTML, SQL DDL, and JSON formats. Reports can be scoped to specific projects in Data Designer for targeted documentation of event log structures.
### Working Calendar Support
Duration calculations now support working calendars, allowing time-between-activity calculations to account for business hours, weekends, and holidays.
### Brave Search Integration
Added Brave Search as a web search provider with a settings UI for API key management. Search capabilities are used by AI agents and copilot features for industry research and contextual guidance.
### BPMN Model Download
Discovered BPMN process models can now be downloaded as BPMN 2.0 XML files, enabling export to other process modeling tools. The BPMN visualization also now uses MSAGL Sugiyama layout for improved node positioning.
### Variant Classification Rules
New activity rules for bulk variant classification allow users to define rules that automatically categorize process variants based on activity patterns.
### Enrichment Block Disable Toggle
Individual enrichment blocks can now be enabled or disabled without deleting them, making it easier to test different enrichment configurations.
---
## Improvements
### Dropdown Menu Behavior
All dropdown menus now automatically flip direction when they would overflow the viewport edge, preventing menus from being cut off at screen boundaries.
### Process Map Click-to-Edit
Activities on the process map can now be clicked to open the activity editor directly, matching the existing click-to-edit behavior on Variant DNA views.
### API Standardization
All API DTOs have been standardized to camelCase JSON format. The LLM Proxy now has full OpenAI API compatibility including proper finish_reason handling, making it easier to integrate with third-party tools.
### Accessibility Improvements
Comprehensive ARIA accessibility attributes have been added to dropdown menus and navigation components, improving screen reader support and keyboard navigation.
### Data Designer Usability
- Backup confirmation dialog before destructive operations
- Auto-scroll to latest messages in AI chat panels
- Stop button for long-running AI agent operations
- Relative file paths instead of full system paths
- Markdown rendering in Database Assistant messages
- Project upload with name editing and secure restore
### Copilot Enhancements
Copilot now tracks context usage with a visual indicator. Base knowledge synchronization has been optimized to prevent timeouts, and the system handles form disposal more gracefully during navigation.
### Enrichment Pipeline
The enrichment pipeline now allows errors and warnings to continue processing instead of stopping entirely, improving resilience for large datasets.
### Desktop Startup
Improved Desktop startup reliability on corporate networks with better error handling, prerequisite check removal from the installer, and SQLite WAL mode to prevent database locking errors.
### DataType Detection Performance
The new DataTypeDetectorV2 provides 80x faster CSV column type detection during dataset upload, significantly reducing wait times for large files.
### Concurrent Activities Editor
The Concurrent Activities enrichment now uses proper UI controls instead of the previous raw JSON editor, making configuration more intuitive.
---
## Bug Fixes
| Task | Title | Description |
|------|-------|-------------|
| 7244 | Copilot Navigation Crash | Fixed ObjectDisposedException when navigating away while copilot is active |
| 7243 | Base Knowledge Timeout | Resolved execution timeout during base knowledge generation in copilot |
| 7232 | Null Tenant Error | Fixed null tenant errors during project operations |
| 7229 | Project Deletion FK | Resolved foreign key constraint error when deleting projects |
| 7227 | Missing Translations | Added 36 missing translation keys and fixed scrambled Status translations |
| 7225 | Console Errors | Fixed JavaScript console errors affecting application stability |
| 7224 | Hardcoded English | Localized remaining hardcoded English strings across 15 components |
| 7223 | Data Designer Navigation | Data Designer now opens in the same browser tab with a Back to Studio button |
| 7222 | Licensing Log | Improved hardware ID licensing message from error to informational warning |
| 7221 | Stale Cache | Cleaned up stale notebook execution cache references |
| 7219 | Data Overview Crash | Fixed null crash when data array is empty in Data Overview |
| 7218 | Missing Notebook | Repaired missing MAIN notebook in base knowledge investigations |
| 7217 | Output Block ID | Fixed base knowledge OutputBlock using incorrect ID when MAIN notebook missing |
| 7216 | Session Timeout Crash | Fixed dispatcher thread crash during session timeout navigation |
| 7215 | Data Designer Crash | Fixed ObjectDisposedException in Data Designer agent panel |
| 7214 | Unauthorized Page Crash | Fixed crash when accessing unauthorized pages |
| 7212 | Null Guards | Added null guards for CurrentTenant and CurrentProject across UI paths |
| 7209 | Turkish Character Bug | Fixed Turkish I Problem in string comparisons affecting case-insensitive operations |
| 7208 | Wizard Buttons | Fixed wizard button layout and navigation issues |
| 7207 | Zero-Event Crash | Fixed crash when analysis contains zero events |
| 7200 | Request Size Limit | Added RequestSizeLimit to LLM Proxy endpoints for large payloads |
| 7155 | Map Columns Cancel | Fixed Cancel button not working on the Map Columns screen |
| 7153 | Process Type Fields | Changed Process Type and Industry to free text fields for flexibility |
| 7148 | Wizard Cancel Button | Fixed dataset wizard Cancel button showing empty stepper container |
| 7146 | Expected Order | Fixed expected order computation when ProcessGraph is empty |
| 7133 | Resource Column | Added resource column guidance in Data Designer |
| 7132 | Dataset Wizard | Simplified dataset wizard choice screen and removed unused Templates page |
| 7125 | AI Agent Stop | Added Stop button to Data Designer AI Agent for canceling operations |
| 7124 | Auto-Scroll | Fixed auto-scroll not working in Data Designer AI panels |
| 7123 | Full Paths | Fixed Data Designer AI Agent showing full system paths instead of relative |
| 7122 | Date Format | Fixed tenant Date/Time format not applied consistently to all grids |
| 7115 | Actions User | Added get_current_user tool so Actions AI Teammate can identify the logged-in user |
| 7109 | Calculator Error | Improved Builder agent calculator error handling |
| 7105 | Pipeline Errors | Enrichment pipeline now tolerates non-critical errors and warnings |
| 7080 | Copilot Branding | Fixed Analysis Copilot incorrectly showing AI Teammate branding |
| 7062 | Process Map Edit | Added click-to-edit for activities on the process map |
---
## Technical Improvements
- Bulk leaf-first entity deletion for faster and more reliable project cleanup
- Standardized all API DTOs to camelCase JSON format across REST API and MCP clients
- MSAGL Sugiyama layout engine for improved BPMN and Petri net visualization
- Unified Data Designer authentication with main mindzieStudio login system
- Enabled TreatWarningsAsErrors across 136 projects to strengthen code quality
- LLM Proxy now fully OpenAI-compatible for seamless third-party integration
- Externalized agent prompts from C# code to YAML and Markdown definitions for easier maintenance
- Atomic MERGE operations for license management replacing locked WebDAV config
---
## Version 2026.011.4
Section: Release Notes
URL: https://docs.mindziestudio.com/mindzie_studio/release-notes/2026-011
Source: /docs-master/mindzieStudio/release-notes/2026-011/page.md
# Version 2026.011.4
**Release Date:** January 11, 2026
---
## New Features
### mindzieDesktop 26 - Fully Standalone Application
mindzieDesktop is now a completely standalone application with no external database dependencies. SQL Server is no longer required for Desktop installations, dramatically simplifying deployment and reducing infrastructure requirements. Users can install and run mindzieDesktop on any Windows machine without database configuration or IT support.
### Direct URL Browsing and F5 Refresh Support
All pages now support browser refresh (F5) without losing context. Share direct URLs to any analysis, dashboard, notebook, block, or enrichment. Users can bookmark and share specific views directly.
### Process Map Video Export
Export flow animation simulations to video format for presentations and documentation. Capture the animated process flow with bottleneck indicators and timing information.
### Flow Animation with Queue Indicators
Enhanced process map visualization with animated flow simulation showing frequency-proportional dot counts, bottleneck queue indicators, and a conformance overlay displaying case coverage percentages.
### Comprehensive REST API
Major expansion of the REST API with full CRUD operations for:
- Tenants
- Users
- Projects
- Investigations
- Dashboards and Panels
- Notebooks and Blocks
- Enrichments
### Google Gemini LLM Provider
Added Google Gemini as an LLM provider option alongside existing OpenAI and Azure OpenAI options.
### Tenant Expiration Date
Support for trial tenants with configurable expiration dates. Administrators can set time-limited access for evaluation purposes.
### Offline Mode
Complete offline operation support for air-gapped environments. Includes offline package importers for templates and assistants, with proper handling of licensing, telemetry, and software updates when disconnected.
---
## Improvements
### Data Designer Copilot UI
- Multi-line textarea input for pasting SQL queries
- Auto-scroll to show new responses
- Shift+Enter support for adding new lines
### File Upload Capacity
Maximum upload size increased to 1GB for large datasets.
### Attribute Sorting
Case and event attribute dropdowns are now sorted alphabetically in the LLM Predictor Editor for easier navigation.
### API Key Audit Trail
API keys now include "Created By" tracking for better accountability and security auditing.
### Server-Level Settings
Unified settings architecture with server-level defaults and tenant-level inheritance. Simplifies configuration management across multiple tenants.
### Tenant Search
Added search functionality to the Manage Tenants page for faster tenant lookup in multi-tenant deployments.
### Connected Users Tracking
API session tracking added to the Connected Users admin page, showing both UI and API connections.
### Desktop Setup Experience
- Improved Setup Wizard with version display and offline indicator
- Start Menu shortcut creation
- Better error logging and diagnostics
- Streamlined update process with single executable
### Configuration App Modernization
- New Service Settings dialog with improved layout
- Error Logs panel for troubleshooting
- Authentication type indicator
- Version check with offline mode support
---
## Bug Fixes
| Task | Title | Description |
|------|-------|-------------|
| 6754 | Group Attribute Values | Fixed Group Attribute Values not working with Event Attributes |
| 6739 | Dataset Cascade Delete | Deleting original dataset now properly cascade deletes enriched datasets |
| 6706 | Dashboard Selector Column | Fixed dashboard selector blocks creating with incorrect column reference |
| 6672 | Currency Formatting | Fixed currency dropdown showing $ instead of configured currency symbol |
| 6673 | Data Designer Copilot Visibility | Fixed copilot appearing in offline mode when disabled in settings |
| 6674 | License Save Error | Fixed license save error with proper directory permissions |
| 6680 | Duplicate Cases Calculator | Fixed error in Duplicate Cases calculator when no duplicates exist |
| 6682 | Login Security | Improved login and password management with account lockout on failed attempts |
| 6685 | LLM Provider Save | Fixed error when saving LLM provider configuration |
| 6653 | Update Check | Fixed update version check not working in Configuration app |
| 6663 | Empty Database | Fixed incorrect database status display and improved collation warning |
| 6664 | Currency Symbol | Fixed currency symbol display in dashboard panel format dropdown |
---
## Technical Improvements
- Improved caching architecture for better performance when multiple users edit simultaneously
- Server-side rendering for dashboard and block images
- Comprehensive URL generation supporting all shareable page types
- Enhanced data storage architecture for standalone Desktop deployments
- Strengthened code quality and stability across all components
---
## Version 2025.264.1
Section: Release Notes
URL: https://docs.mindziestudio.com/mindzie_studio/release-notes/2025-264
Source: /docs-master/mindzieStudio/release-notes/2025-264/page.md
# Version 2025.264.1
**Release Date:** September 21, 2025
---
## New Features
### Microsoft Azure Active Directory (Entra ID) Authentication
Sign in to mindzieStudio using your corporate Microsoft account. Supports multi-tenant organizations with automatic tenant detection, allowing employees to use their existing work credentials for seamless access. Custom company portal URLs can be configured to automatically direct users to the correct tenant and authentication method.
### Python API Client Library
Access mindzieStudio programmatically through the new Python API client library, published to PyPI as `mindzie-api`. Upload datasets, create investigations, execute notebooks, and retrieve results programmatically using authenticated API calls.
### Copilot Assistants Management
Create and manage custom copilot assistants with specialized knowledge and behavior. Configure assistant settings, system prompts, and knowledge bases through the new assistant grid and editor interface.
### Service Account Management
Tenant administrators can now create and manage service accounts for automated system integrations and API access, with proper authorization controls to ensure secure programmatic access.
---
## Improvements
### Enhanced User Management Interface
Role and Display Name fields are now visible for all users in the Edit User dialog, providing better visibility into user account details and permissions.
### Active Directory Configuration
Improved on-screen instructions and documentation for configuring Azure Active Directory authentication, making it easier to set up corporate SSO integration.
### Validation Message Improvements
Dashboard and variant validation messages now appear as warnings instead of errors, reducing noise while still providing important feedback about data quality.
### File Upload Experience
File upload validation messages now display as warnings rather than errors, providing a less disruptive experience when uploading data files while still alerting users to potential issues.
### Large Dataset Export
Improved handling of large dataset exports to prevent timeout issues when exporting substantial amounts of data.
---
## Bug Fixes
| Task | Title | Description |
|------|-------|-------------|
| 6571 | Copilot HTML Display | Fixed issue where copilot responses were displaying raw HTML instead of properly formatted content. |
| 6569 | Dataset Export Hanging | Resolved issue where dataset exports would hang indefinitely when exporting large amounts of data. |
| 6570 | Compiler Warnings | Fixed CS1998 and CS0168 compiler warnings to improve code quality. |
| 6568 | API Documentation | Corrected Swagger documentation issues in API controllers to ensure accurate API reference information. |
| 6256 | Pivot Calculator Validation | Fixed validation logic to prevent "Unknown aggregate function" error when configuring pivot calculators. |
| 6566 | NightlyErrorParser Bug Resolution | Improved automated bug detection and resolution process for errors found in nightly logs. |
| 5740 | Dashboard Block Execution | Fixed issue where blocks were being unnecessarily re-executed when adding them to dashboards. |
| 6455 | Filter Attribute Display | Resolved NullReferenceException that occurred when setting filter attribute data. |
| 6444 | Missing Copilot Table | Added graceful handling for missing tbl_copilot_notebook_run database table. |
| 6367 | ExecutionQueue Concurrency | Improved handling of concurrent execution queue operations to prevent conflicts. |
| 6402 | JavaScript Module Loading | Added error handling for JavaScript module loading failures to prevent application crashes. |
| 6262 | Temporary File Cleanup | Resolved IOException that occurred during temporary file cleanup operations. |
| 6281 | Error Logging | Enhanced error logging to capture complete stack traces for better troubleshooting. |
| 6329 | Antiforgery Exception Logging | Excluded AntiforgeryValidationException and FilterWarningException from error logs to reduce log noise. |
| 6264 | Filter Warning Logging | Changed FilterWarningException logging level from error to warning for more appropriate categorization. |
| 6534 | File Upload Cleanup | Applied 24-hour cleanup pattern to CSV and XES file uploads to prevent FileNotFoundException errors. |
---
## Version 2025.199.1
Section: Release Notes
URL: https://docs.mindziestudio.com/mindzie_studio/release-notes/2025-199
Source: /docs-master/mindzieStudio/release-notes/2025-199/page.md
# Version 2025.199.1
**Release Date:** July 19, 2025
---
## New Features
### Time Difference Calculator
Added new calculator to measure time elapsed from an activity to the current time, useful for tracking how long cases have been waiting or pending.
---
## Improvements
### Enhanced Security
Strengthened security validation for user inputs, data queries, and system messages to better protect your data.
### Project Visibility Controls
Project list now displays only your assigned projects by default. Administrators can access a "Show All Projects" option to view the complete project list across the organization.
### Dashboard Panel Error Messages
Improved error messages in dashboard panels to provide clearer information when issues occur.
### Alert Processing Performance
Significantly improved the speed of saving alarms during data enrichment operations.
### File Upload Enhancements
Enhanced file reading capabilities and added support for email attachments in data imports.
### Import Dialog
Improved file name display and organization in the import dialog for better clarity.
---
## Bug Fixes
| Task | Title | Description |
|------|-------|-------------|
| 5880 | Column Anonymization Restrictions | Case ID and Activity columns are now properly protected from being anonymized to preserve data integrity. |
| 5851 | Package Saving Permissions | All analysts and higher roles can now save packages. Fixed save functionality in Card View. |
| 6115 | Temporary File Cleanup | System now automatically removes temporary files older than 3 days to free up disk space. |
| 6214 | Data Designer Base URL | Fixed base URL configuration in Data Designer to ensure proper navigation. |
| 6220 | XES File Upload | Resolved issues with XES file uploads and improved error messaging when upload problems occur. |
| N/A | User Grid Display | Fixed hover-over behavior in the Users grid for better usability. |
| N/A | Project Card Menu | Fixed menu dismiss behavior when clicking items in project card view. |
| N/A | Data Designer Tenant Selection | Data Designer now properly redirects to main screen when tenant has not been selected. |
---
## Version 2025.115.3
Section: Release Notes
URL: https://docs.mindziestudio.com/mindzie_studio/release-notes/2025-115
Source: /docs-master/mindzieStudio/release-notes/2025-115/page.md
# Version 2025.115.3
**Release Date:** April 29, 2025
---
## New Features
### Installer Progress Display
The installer now displays progress both on the UI and the web update page, improving transparency and user experience during installation.
### Anonymous SMTP Authentication
Introduced support for anonymous SMTP authentication mode. This enables broader configuration flexibility when using external mail servers.
---
## Bug Fixes
| Task | Title | Description |
|------|-------|-------------|
| 6186 | Circuit Disconnection | Fixed an issue where the system would occasionally experience unexpected circuit disconnections. |
| 6185 | Missing Images in MDD Datasources | Addressed a problem where images were not loading correctly in MDD data sources. |
| 6152 | Event Order Filter - Follow Method Not Updating | Resolved a bug where the 'Follow' method in the Event Order Filter was not updating as expected. |
---
## Version 2025.107.4
Section: Release Notes
URL: https://docs.mindziestudio.com/mindzie_studio/release-notes/2025-107
Source: /docs-master/mindzieStudio/release-notes/2025-107/page.md
# Version 2025.107.4
**Release Date:** April 17, 2025
---
## New Features
### Data Designer Migration
Integrated Data Designer with mindzieStudio. Now there is only one website needed for the complete process mining workflow.
---
## Improvements
### License Key Display
Show license key in the UI and allow users to copy it.
### CaseStage Calculator Changes
Changed coloring and font for Case Stage Calculator View 1 for improved readability.
---
## Bug Fixes
| Task | Title | Description |
|------|-------|-------------|
| 6163 | License Key Display | Fixed license key display and copy functionality. |
| 6169 | CaseStage Calculator Changes | Corrected coloring and font issues for Case Stage Calculator View 1. |
---
## Version 2025.078.3
Section: Release Notes
URL: https://docs.mindziestudio.com/mindzie_studio/release-notes/2025-080
Source: /docs-master/mindzieStudio/release-notes/2025-080/page.md
# Version 2025.078.3
**Release Date:** March 21, 2025
---
## Improvements
### Duration Calculation in Case Stage Calculator
Added duration calculation to the Case Stage Calculator. This allows users to see how long each stage of the case took, improving analysis capabilities.
### Isolated Dashboard Improvements
- Hide title bar
- Show Logo
- Fix Background Coloring
### Minute Schedule as Action Trigger
Allow users to run an action every N minutes for more granular scheduling control.
### SSL Certificate Update
Signed installs with a new SSL certificate for improved security.
---
## Bug Fixes
| Task | Title | Description |
|------|-------|-------------|
| 6124 | Run Data Designer scheduled with two data sources | Fixed scheduling issues when running Data Designer with multiple data sources. |
| 6080 | Theme color editor changes colors on first load | Resolved issue where theme color editor would change colors unexpectedly on first load. |
| 6002 | Confirm delete tenant | Users are now prompted to confirm the delete tenant action. |
| 5754 | Histogram Editor should show 16 and Auto when first created | Always set the histogram editor to show 16 and Auto when first created for easier understanding. |
---
## Version 2025.029.1
Section: Release Notes
URL: https://docs.mindziestudio.com/mindzie_studio/release-notes/2025-029
Source: /docs-master/mindzieStudio/release-notes/2025-029/page.md
# Version 2025.029.1
**Release Date:** January 26, 2025
---
## New Features
### mindzieStudio Apps
mindzieStudio Apps allow users to see only the dashboards and analysis that are relevant to them, providing a focused and streamlined experience.
---
## Improvements
### Dataset Update Indicator on Dashboard
When a dataset is updated, the dashboard page will show an indicator to inform the analyst that the data has been refreshed.
---
## Bug Fixes
| Task | Title | Description |
|------|-------|-------------|
| 6060 | Selected Cases Over Time - incorrect statistics | Updated the statistics calculations to ensure that the correct values are displayed. |
| 6079 | Dashboard CoPilot - Editing dashboard shows copilot even if disabled | Make sure copilot is not shown when the feature has been turned off on the server. |
| 6026 | Python Action populate default container name | After allowing local python actions, ensure that the default container name is populated correctly. |
---
## Version 2024.364.2
Section: Release Notes
URL: https://docs.mindziestudio.com/mindzie_studio/release-notes/2024-364
Source: /docs-master/mindzieStudio/release-notes/2024-364/page.md
# Version 2024.364.2
**Release Date:** December 30, 2024
---
## Improvements
### Week Day Selector in All Action Schedulers
Consolidated scheduling options by removing the separate Weekly Scheduler. Daily Scheduler now handles the same functionality.
### Standalone Dashboard
Create standalone dashboard links with authentication support.
---
## Bug Fixes
| Task | Title | Description |
|------|-------|-------------|
| 6012 | Show All Tenants to TenantAdmin even if no users | Improved the TenantAdmin experience by showing all tenants even if they have no users. |
| 6011 | Reset Password Email colors | Improved the email template for password reset to match the new design. |
| 6005 | Loading too much in Actions screen | Only load the actions that are needed for the current view. |
| 6003 | Impersonate Roles not showing | Improved the roles display in the impersonation feature. |
---
## Version 2024.340.11
Section: Release Notes
URL: https://docs.mindziestudio.com/mindzie_studio/release-notes/2024-340
Source: /docs-master/mindzieStudio/release-notes/2024-340/page.md
# Version 2024.340.11
**Release Date:** December 3, 2024
---
## Improvements
### BPMN Clean Up
Improved BPMN layout and cleaned up the code for better maintainability.
### BPMN Send to Editor
Users can now send BPMN diagrams to the editor for further editing.
---
## Bug Fixes
| Task | Title | Description |
|------|-------|-------------|
| 5987 | Allow USER role to export from dashboard | A USER role is now allowed to export data from the Dashboard Panel. Updated ExportDataPolicy accordingly. |
---
## Version 2024.310.1
Section: Release Notes
URL: https://docs.mindziestudio.com/mindzie_studio/release-notes/2024-310
Source: /docs-master/mindzieStudio/release-notes/2024-310/page.md
# Version 2024.310.1
**Release Date:** November 6, 2024
---
## New Features
### Project Portability
Seamless project migration between Desktop, Enterprise, and SAAS platforms. Complete project packages now include:
- Process data
- Enrichments
- Analysis setups
- Dashboards
- BPMN diagrams
- UI Color Schemes
### Theme Customization System
New Theme Editor for UI and chart color customization. Save themes at project, tenant, or server level (Desktop/Enterprise/SAAS). Support for corporate branding.
### BPMN Modeling Suite
Full BPMN 2.0 standard compliance. Load, edit, and save BPMN diagrams with complete editing capabilities.
### Standalone Dashboard Sharing
Share dashboards via standalone links for fullscreen display without header/menus and with no timeout for command center usage.
### Additional Feature Highlights
- Log prompt sources globally (tenant, project, dashboard/analysis name)
- Add MFA toggle for user accounts
- Update UI colors and chart settings for better customization
---
## Improvements
### System Administration
Configurable timeout settings and debug timer. Improved dataset last-modified tracking. Enhanced MFA controls and logging.
### Data Visualization
Expanded chart customization: title locations, text size, axis formatting, multi-graph support. Heat maps, bubble charts, bar/column charts, line charts, world maps supported.
### Dashboard Enhancements
Improved dashboard filter controls. Command center display optimizations. Project color management enhancements.
---
## Bug Fixes
### Visualization Improvements
Fixed calculator and chart color persistence. Corrected label and pie chart display issues. Improved theme color stability.
### Dashboard Stability
Pivot row computation errors resolved. Fixed filter synchronization and grid hover anomalies. Improved multi-investigation dashboard behavior.
### System Reliability
Session management improvements. Enhanced error handling and logging. BPMN editor stability improvements.
### User Interface
Desktop color editor fixes. Consistent color application across UI elements. Thumbnail image update issues fixed.
### Performance Optimization
Faster dashboard loading. Enhanced calculator and filter editor responsiveness. Better chart rendering efficiency.
---
## Version 2024.285.4
Section: Release Notes
URL: https://docs.mindziestudio.com/mindzie_studio/release-notes/2024-285
Source: /docs-master/mindzieStudio/release-notes/2024-285/page.md
# Version 2024.285.4
**Release Date:** October 10, 2024
---
## New Features
### Project Management
Introduced project creation functionality allowing users to organize datasets, dashboards, investigations, and analyses. Implemented project portability between servers and added project ownership and user invitation features. Launched Project Gallery showcasing sample projects.
### UI Customization
Enabled color customization with save options for Project, Tenant, or Application levels.
### Command Center Enhancements
Developed color schemes suitable for large-scale displays. Added functionality to link dashboards for display without user login. Implemented auto-refresh feature for real-time data updates.
### BPMN Editor
Integrated full BPMN 2.0 standard diagram support. Enabled comprehensive editing and saving of BPMN diagrams.
---
## Improvements
### Knowledge Base Enhancement
Added contextual information to Copilot screen based on current analysis filters.
### Analytics Capabilities
Expanded "Duration Between an Attribute and an Activity" operator to support event attribute creation. Added functionality to calculate duration from events to Case Attributes.
### System Management
Implemented Debug Timer in footer. Added configurable Timeout setting at Tenant level. Improved documentation for timeout functionality.
### Security Upgrade
Added toggle for Multi-Factor Authentication on a per-user basis.
---
## Bug Fixes
| Task | Title | Description |
|------|-------|-------------|
| 5887 | Trend Dashboard Panel - Too much space | Resolved excessive spacing in Trend Dashboard Panel. |
| 5859 | Notes panel refresh issue | Fixed refresh issues with notes panel updates. |
| 5888 | Background color edit for Note Panels | Improved background color editing for Note Panels, including visual indicators for default colors. |
| 5861 | Investigation renaming message | Corrected investigation renaming process and removed unnecessary reload messages. |
| 5865 | Copilot expanded/collapsed state | Corrected Copilot expanded/collapsed state persistence. |
| 5870 | Dashboard Copilot Update Status | Implemented UI update when Dashboard Copilot status changes. |
| 5883 | Markdown colors | Addressed markdown color rendering problems in HTML output. |
| 5844 | Investigation - Change Dataset | Fixed dataset replacement errors in investigations. |
| 5849 | Edit - ActionStepRunDesigner | Resolved visibility issues with Data Designer Project selection. |
| 5845 | Notebook dashboard panels title | Fixed notebook panel title update and save functionality. |
| 5837 | Calc shows No Data | Addressed "No Data" display issues in calculations. |
| 5834 | SingleValueFromLabel wrong value | Corrected value display in SingleValueFromLabel with empty caseviews. |
| 5835 | Error determining chart type | Fixed chart type determination and display setting loading errors. |
| 5829 | Add Dashboard Panel to Notebook Dashboard | Resolved issues with adding various panel types to dashboards. |
| 5866 | Saving issue with specific tenant | Resolved persistent saving issues in specific tenant environments. |
| 5822 | Pen Testing - Defects | Addressed vulnerabilities identified during penetration testing. |
| 5833 | Deleting Notebooks not deleting correct dashboards | Corrected problems with notebook deletion and associated dashboard removal. |
| 5832 | Export Notebook not saving dashboards | Addressed export and import issues with notebook dashboards. |
| 4581 | Freeze Time - Loses date | Fixed date reset issue in Freeze Time enrichment block. |
# Product: mindzieDataDesigner
---
## Connectors Overview
Section: Connectors
URL: https://docs.mindziestudio.com/mindzie_data_designer/Connectors/overview
Source: /docs-master/mindzieDataDesigner/Connectors/overview/page.md
# Database Connectors Overview
**Category:** mindzieDataDesigner
Supported Data Connections
Click any connector below to view its detailed documentation.
## Introduction
mindzieDataDesigner provides native database connectors that enable direct connectivity to your data sources. These connectors are used to extract data from various database systems and transform it into event logs for process mining analysis in mindzieStudio.
## Supported Database Systems
mindzieDataDesigner supports a wide range of relational database systems, from lightweight embedded databases to enterprise-grade data warehouses.
### Enterprise Databases
| Connector | Description |
|-----------|-------------|
| [Microsoft SQL Server](/mindzie_data_designer/connectors/sql-server) | Full support for SQL Server 2012+, Azure SQL Database, and Azure SQL Managed Instance |
| [Oracle](/mindzie_data_designer/connectors/oracle) | Native connectivity to Oracle Database 11g and later versions |
| [IBM DB2](/mindzie_data_designer/connectors/ibm-db2) | Support for IBM DB2 on z/OS, i Series, and LUW platforms |
| [SAP HANA](/mindzie_data_designer/connectors/sap-hana) | High-performance connectivity to SAP HANA in-memory database |
| [SAP SuccessFactors](/mindzie_data_designer/connectors/sap-successfactors) | OData API connectivity to SAP SuccessFactors HCM |
| [Teradata](/mindzie_data_designer/connectors/teradata) | Enterprise data warehouse connectivity |
### Cloud Data Warehouses
| Connector | Description |
|-----------|-------------|
| [Snowflake](/mindzie_data_designer/connectors/snowflake) | Cloud-native data warehouse connectivity |
| [Amazon Redshift](/mindzie_data_designer/connectors/amazon-redshift) | AWS cloud data warehouse support |
### Open Source Databases
| Connector | Description |
|-----------|-------------|
| [PostgreSQL](/mindzie_data_designer/connectors/postgresql) | Full support for PostgreSQL 9.4 and later |
| [MySQL](/mindzie_data_designer/connectors/mysql) | Support for MySQL 5.6+ and MariaDB |
| [Firebird](/mindzie_data_designer/connectors/firebird) | Open source relational database support |
| [H2](/mindzie_data_designer/connectors/h2) | Lightweight Java SQL database |
### Desktop and Embedded Databases
| Connector | Description |
|-----------|-------------|
| [SQLite](/mindzie_data_designer/connectors/sqlite) | Lightweight file-based database |
| [Microsoft Access](/mindzie_data_designer/connectors/microsoft-access) | Microsoft Access database files (.mdb, .accdb) |
### Legacy and Specialized Systems
| Connector | Description |
|-----------|-------------|
| [Sybase ASE](/mindzie_data_designer/connectors/sybase-ase) | Sybase Adaptive Server Enterprise |
| [Vertica](/mindzie_data_designer/connectors/vertica) | High-performance analytics database |
| [ODBC](/mindzie_data_designer/connectors/odbc) | Generic ODBC connectivity for any ODBC-compliant data source |
## Choosing the Right Connector
When selecting a connector, consider:
1. **Native vs ODBC**: Use native connectors when available for better performance and feature support. Use ODBC only when a native connector is not available for your database.
2. **Authentication**: Most connectors support both database authentication and integrated authentication (Windows/Kerberos). Choose based on your security requirements.
3. **Network Configuration**: Ensure proper firewall rules and network access between mindzieDataDesigner and your database server.
## Common Configuration Steps
All database connectors follow a similar configuration pattern:
1. **Install Required Drivers**: Some connectors require additional client drivers to be installed
2. **Configure Connection String**: Build the connection string with server, database, and authentication details
3. **Test Connectivity**: Verify the connection before using it in data transformation scripts
4. **Set Up Security**: Configure appropriate database permissions for the mindzie service account
## Security Best Practices
- Use dedicated service accounts with minimum required permissions
- Enable encrypted connections (SSL/TLS) when possible
- Store credentials securely using environment variables or secure vaults
- Regularly rotate database passwords
- Monitor and audit database access
## Getting Help
If you encounter issues with a specific connector:
1. Check the individual connector documentation for troubleshooting steps
2. Verify network connectivity and firewall configuration
3. Confirm database credentials and permissions
4. Contact mindzie support for additional assistance
---
## Amazon Redshift
Section: Connectors
URL: https://docs.mindziestudio.com/mindzie_data_designer/Connectors/amazon-redshift
Source: /docs-master/mindzieDataDesigner/Connectors/amazon-redshift/page.md
# Amazon Redshift Connector
**Category:** Database Connectors
## Introduction
This document is created to help setup a mindzieDataDesigner connector to Amazon Redshift database. The mindzieDataDesigner is the ETL tool used by mindzieStudio to convert database tables to process mining event logs. The purpose of this document is to help creating the connection string and opening ports on the firewall if required.
## Overview
The Amazon Redshift connector provides optimized connectivity to Redshift clusters for large-scale analytical workloads and process mining scenarios.
## System Requirements
- **Cloud Platform:** Amazon Web Services (AWS)
- **Database System:** Amazon Redshift clusters
- **Authentication:** Database credentials, IAM authentication
- **Network:** VPC configuration, security groups
- **Dependencies:** Amazon Redshift .NET driver
## Connection String Format
### Basic Format
```
Server=cluster-endpoint.region.redshift.amazonaws.com;Port=5439;Database=database_name;User ID=username;Password=password;
```
### Connection Parameters
| Parameter | Description | Required | Example |
|-----------|-------------|----------|---------|
| `Server` | Redshift cluster endpoint | Yes | `mycluster.abc123.us-east-1.redshift.amazonaws.com` |
| `Port` | Port number | No | `5439` (default) |
| `Database` | Database name | Yes | `analytics` |
| `User ID` | Username | Yes | `mindzie_user` |
| `Password` | Password | Yes | `SecurePassword123` |
| `SSL` | Enable SSL | No | `true` |
| `Connection Timeout` | Connection timeout | No | `60` |
## Connection Examples
### Standard Redshift Connection
```
Server=mycluster.abc123.us-east-1.redshift.amazonaws.com;Port=5439;Database=process_analytics;User ID=mindzie_user;Password=SecurePassword123;SSL=true;
```
### IAM Authentication
```
Server=mycluster.abc123.us-east-1.redshift.amazonaws.com;Port=5439;Database=analytics;User ID=IAM:iam_user;Password=temp_password;SSL=true;
```
### Redshift Serverless
```
Server=workgroup.account.region.redshift-serverless.amazonaws.com;Port=5439;Database=dev;User ID=admin;Password=password;SSL=true;
```
## Troubleshooting
### Common Issues
**"Connection timeout" Error**
- Check VPC security groups and network ACLs
- Verify Redshift cluster is publicly accessible if needed
- Validate DNS resolution of cluster endpoint
**"Authentication failed" Error**
- Verify username and password are correct
- Check if user has CONNECT privilege to database
- For IAM authentication, ensure proper roles and policies
**"SSL connection failed" Error**
- Ensure SSL=true in connection string
- Check certificate validation settings
- Verify network allows SSL connections on port 5439
**mindzie Server Access:** For enhanced security, you can configure your firewall to only allow connections from mindzie servers by whitelisting specific IP addresses. Contact mindzie support to obtain the current IP addresses for the mindzie servers you are using.
## Related Information
- **Official Documentation:** [Amazon Redshift Documentation](https://docs.aws.amazon.com/redshift/)
- **Performance Tuning:** [Redshift Performance Tuning](https://docs.aws.amazon.com/redshift/latest/dg/c_optimizing-query-performance.html)
- **Security Guide:** [Redshift Security](https://docs.aws.amazon.com/redshift/latest/mgmt/security-overview.html)
---
💡 **Tip:** Use Redshift's COPY command to efficiently load large process datasets from S3, and leverage sort keys on timestamp columns for time-based process analysis queries.
---
## Firebird
Section: Connectors
URL: https://docs.mindziestudio.com/mindzie_data_designer/Connectors/firebird
Source: /docs-master/mindzieDataDesigner/Connectors/firebird/page.md
# Firebird Database Connector
**Category:** Database Connectors
## Introduction
This document is created to help setup a mindzieDataDesigner connector to Firebird database. The mindzieDataDesigner is the ETL tool used by mindzieStudio to convert database tables to process mining event logs. The purpose of this document is to help creating the connection string and opening ports on the firewall if required.
## Overview
The Firebird connector provides connectivity to Firebird databases across all supported platforms. This connector supports both embedded and server architectures, making it suitable for applications ranging from single-user desktop applications to multi-user enterprise systems.
## System Requirements
- **Database System:** Firebird 2.5 or later (Firebird 4.0+ recommended)
- **Architecture:** Classic, SuperServer, SuperClassic
- **Platform Support:** Windows, Linux, macOS, Unix
- **Dependencies:** FirebirdSql.Data.FirebirdClient .NET provider
## Connection String Format
### Basic Format
```
Server=hostname;Database=database_path;User=username;Password=password;
```
### Connection Parameters
| Parameter | Description | Required | Example |
|-----------|-------------|----------|---------|
| `Server` or `DataSource` | Server hostname | Yes | `firebird.company.com` |
| `Port` | Server port | No | `3050` (default) |
| `Database` | Database file path | Yes | `/data/process.fdb` |
| `User` or `User ID` | Username | Yes | `SYSDBA` |
| `Password` | Password | Yes | `masterkey` |
| `Charset` | Character set | No | `UTF8` |
| `Connection Timeout` | Connection timeout | No | `15` |
| `Pooling` | Connection pooling | No | `true` |
## Connection Examples
### Local Embedded Database
```
Server=localhost;Database=C:\Data\ProcessMining.fdb;User=SYSDBA;Password=masterkey;
```
### Remote Server Connection
```
Server=firebird-server.company.com;Database=/opt/firebird/data/analytics.fdb;User=MINDZIE_USER;Password=SecurePassword123;
```
### Connection with Charset
```
Server=firebird.company.com;Database=/data/process.fdb;User=SYSDBA;Password=password;Charset=UTF8;
```
### Embedded Database (No Server)
```
Database=C:\MyApp\data\embedded.fdb;User=SYSDBA;Password=masterkey;ServerType=1;
```
## Troubleshooting
### Common Issues
**"Connection rejected by remote interface" Error**
- Check Firebird server is running
- Verify hostname and port configuration
- Check firewall settings
- Ensure database file exists and is accessible
**"Login failed" Error**
- Verify username and password
- Check if user account exists
- Ensure user has connect privileges
- Validate authentication method
**"Database file not found" Error**
- Verify database file path is correct
- Check file permissions
- Ensure path uses correct directory separators
- Confirm database file exists
**"Arithmetic overflow or division by zero" Error**
- Check for numeric overflow in calculations
- Validate data types in operations
- Review stored procedure logic
- Check for division by zero conditions
## Related Information
- **Official Documentation:** [Firebird Documentation](https://firebirdsql.org/en/documentation/)
- **Firebird .NET Provider:** [FirebirdSql.Data.FirebirdClient](https://firebirdsql.org/en/net-provider/)
- **SQL Reference:** [Firebird SQL Reference](https://firebirdsql.org/file/documentation/html/en/refdocs/fblangref30/)
- **Performance Guide:** [Firebird Performance Tips](https://firebirdsql.org/en/performance-tips/)
---
💡 **Tip:** Firebird's multi-generational architecture provides excellent concurrency for read-heavy process mining workloads without reader-writer conflicts.
---
## H2
Section: Connectors
URL: https://docs.mindziestudio.com/mindzie_data_designer/Connectors/h2
Source: /docs-master/mindzieDataDesigner/Connectors/h2/page.md
# H2 Database Connector
**Category:** Database Connectors
## Introduction
This document is created to help setup a mindzieDataDesigner connector to H2 database. The mindzieDataDesigner is the ETL tool used by mindzieStudio to convert database tables to process mining event logs. The purpose of this document is to help creating the connection string and opening ports on the firewall if required.
## Overview
The H2 connector provides connectivity to H2 databases in various modes including embedded, server, and in-memory configurations. This connector is perfect for development environments, testing scenarios, and lightweight process mining applications.
## System Requirements
- **Database System:** H2 Database Engine 1.4 or later (2.x recommended)
- **Platform Support:** Cross-platform (Java-based)
- **Dependencies:** H2 database engine (included with connector)
- **Java Runtime:** Java 8 or later
## Connection String Format
### Embedded Database
```
Data Source=jdbc:h2:~/database_name;User=sa;Password=;
```
### Server Mode
```
Data Source=jdbc:h2:tcp://hostname:9092/database_name;User=sa;Password=password;
```
### In-Memory Database
```
Data Source=jdbc:h2:mem:database_name;User=sa;Password=;
```
## Connection Examples
### Local File Database
```
Data Source=jdbc:h2:~/ProcessMining;User=sa;Password=;
```
### Server Mode Connection
```
Data Source=jdbc:h2:tcp://h2server.company.com:9092/ProcessDB;User=mindzie_user;Password=SecurePassword123;
```
### In-Memory Database (Testing)
```
Data Source=jdbc:h2:mem:testdb;User=sa;Password=;DB_CLOSE_DELAY=-1;
```
### Encrypted Database
```
Data Source=jdbc:h2:~/SecureDB;CIPHER=AES;User=sa;Password=password file_password;
```
## Troubleshooting
### Common Issues
**"Database not found" Error**
- Verify file path and permissions
- Check if database files exist
- Ensure proper database URL format
**"Connection refused" Error (Server mode)**
- Verify H2 server is running
- Check hostname and port configuration
- Validate firewall and network settings
**"Out of memory" Error**
- Increase JVM heap size
- Optimize query performance
- Consider using file-based instead of in-memory database
## Related Information
- **Official Documentation:** [H2 Database Documentation](http://h2database.com/html/main.html)
- **H2 Console:** Built-in web-based database administration tool
- **Migration Guide:** [H2 to Production Database Migration](http://h2database.com/html/tutorial.html)
---
💡 **Tip:** Use H2's compatibility modes to ease migration from H2 development databases to production database systems like PostgreSQL or MySQL.
---
## IBM DB2
Section: Connectors
URL: https://docs.mindziestudio.com/mindzie_data_designer/Connectors/ibm-db2
Source: /docs-master/mindzieDataDesigner/Connectors/ibm-db2/page.md
# IBM DB2 Database Connector
**Category:** Database Connectors
## Introduction
This document is created to help setup a mindzieDataDesigner connector to IBM DB2 database. The mindzieDataDesigner is the ETL tool used by mindzieStudio to convert database tables to process mining event logs. The purpose of this document is to help creating the connection string and opening ports on the firewall if required.
## Overview
The IBM DB2 connector provides connectivity to IBM DB2 databases across various platforms including z/OS, Linux, Unix, and Windows. This connector supports both traditional DB2 LUW (Linux, Unix, Windows) and DB2 for z/OS mainframe environments.
## System Requirements
- **Database System:** IBM DB2 LUW 11.1 or later, DB2 for z/OS
- **Platform Support:** Windows, Linux, Unix, z/OS
- **Cloud Support:** IBM Db2 on Cloud, IBM Cloud Pak for Data
- **Dependencies:** IBM Data Server Driver or IBM DB2 Client
## Connection String Format
### Basic Format
```
Database=database_name;Server=hostname:port;UID=username;PWD=password;
```
### Connection Examples
### Local DB2 Database
```
Database=SAMPLE;Server=localhost:50000;UID=db2admin;PWD=password;
```
### Remote DB2 Server
```
Database=PRODDB;Server=db2server.company.com:50000;UID=mindzie_user;PWD=SecurePassword123;
```
### DB2 on Cloud
```
Database=BLUDB;Server=dashdb-entry.services.dal.bluemix.net:50000;UID=username;PWD=CloudPassword123;
```
### Connection with SSL
```
Database=SECUREDB;Server=db2server:50001;UID=username;PWD=password;Security=SSL;
```
**mindzie Server Access:** For enhanced security, you can configure your firewall to only allow connections from mindzie servers by whitelisting specific IP addresses. Contact mindzie support to obtain the current IP addresses for the mindzie servers you are using.
## Related Information
- **Official Documentation:** [IBM Db2 Documentation](https://www.ibm.com/docs/db2)
- **IBM Data Server Driver:** [IBM Data Server Clients](https://www.ibm.com/support/pages/downloading-ibm-data-server-driver-package-version-111-fix-pack-5)
---
💡 **Tip:** For mainframe DB2 connections, work with your z/OS systems administrator to configure proper network connectivity and security settings.
---
## Microsoft Access
Section: Connectors
URL: https://docs.mindziestudio.com/mindzie_data_designer/Connectors/microsoft-access
Source: /docs-master/mindzieDataDesigner/Connectors/microsoft-access/page.md
# Microsoft Access Database Connector
**Category:** Database Connectors
## Introduction
This document is created to help setup a mindzieDataDesigner connector to Microsoft Access database. The mindzieDataDesigner is the ETL tool used by mindzieStudio to convert database tables to process mining event logs. The purpose of this document is to help creating the connection string and opening ports on the firewall if required.
## Overview
The Microsoft Access connector enables connectivity to Access database files (.mdb and .accdb formats). This connector is ideal for small-scale process mining projects and legacy system integration where data is stored in Access databases.
## System Requirements
- **Database System:** Microsoft Access 2007 or later (.accdb), Access 2003 (.mdb)
- **Platform Support:** Windows (Access database engine required)
- **Dependencies:** Microsoft Access Database Engine (ACE) or Jet Database Engine
- **File Access:** Read/write permissions to Access database files
## Connection String Format
### Access 2007+ (.accdb)
```
Provider=Microsoft.ACE.OLEDB.12.0;Data Source=C:\path\to\database.accdb;
```
### Access 2003 (.mdb)
```
Provider=Microsoft.Jet.OLEDB.4.0;Data Source=C:\path\to\database.mdb;
```
## Connection Examples
### Standard .accdb Connection
```
Provider=Microsoft.ACE.OLEDB.12.0;Data Source=C:\ProcessData\ProcessMining.accdb;
```
### Password-Protected Database
```
Provider=Microsoft.ACE.OLEDB.12.0;Data Source=C:\ProcessData\SecureDB.accdb;Jet OLEDB:Database Password=mypassword;
```
### Read-Only Connection
```
Provider=Microsoft.ACE.OLEDB.12.0;Data Source=C:\ProcessData\ReadOnlyDB.accdb;Mode=Read;
```
### Legacy .mdb Connection
```
Provider=Microsoft.Jet.OLEDB.4.0;Data Source=C:\LegacyData\OldProcess.mdb;
```
## Troubleshooting
### Common Issues
**"Provider not found" Error**
- Install Microsoft Access Database Engine redistributable
- Verify 32-bit vs 64-bit compatibility
- Check provider name spelling and case
**"File not found" Error**
- Verify file path is correct and accessible
- Check file permissions for read/write access
- Ensure file is not locked by another application
**"Database password required" Error**
- Include password in connection string
- Verify password is correct
- Check for special characters in password
## Related Information
- **Microsoft Access:** [Access Database Engine Documentation](https://docs.microsoft.com/office/client-developer/access/)
- **OLE DB Providers:** [Microsoft OLE DB Documentation](https://docs.microsoft.com/sql/ado/guide/appendixes/microsoft-ole-db-provider-for-microsoft-jet)
---
💡 **Tip:** Consider migrating larger Access databases to SQL Server or other server-based systems for better performance and scalability in enterprise process mining scenarios.
---
## MySQL
Section: Connectors
URL: https://docs.mindziestudio.com/mindzie_data_designer/Connectors/mysql
Source: /docs-master/mindzieDataDesigner/Connectors/mysql/page.md
# MySQL Database Connector
**Category:** Database Connectors
## Introduction
This document is created to help setup a mindzieDataDesigner connector to MySQL database. The mindzieDataDesigner is the ETL tool used by mindzieStudio to convert database tables to process mining event logs. The purpose of this document is to help creating the connection string and opening ports on the firewall if required.
## Overview
The MySQL connector provides native connectivity to MySQL Server instances using the official MySQL .NET Connector. This connector supports all MySQL versions and deployment scenarios including on-premise, cloud, and containerized environments.
## System Requirements
- **Database System:** MySQL 5.7 or later (MySQL 8.0 recommended)
- **Supported Editions:** MySQL Community Server, MySQL Enterprise Edition
- **Cloud Support:** Amazon RDS for MySQL, Azure Database for MySQL, Google Cloud SQL
- **Platform Support:** Windows, Linux, macOS
- **Dependencies:** MySQL .NET Connector (MySql.Data) - included with connector
## Connection String Format
### Basic Format
```
Server=hostname;Port=3306;Database=database_name;Uid=username;Pwd=password;
```
### Connection Parameters
| Parameter | Description | Required | Example |
|-----------|-------------|----------|---------|
| `Server` or `Host` | MySQL server hostname/IP | Yes | `mysql.company.com` |
| `Port` | Server port number | No | `3306` (default) |
| `Database` | Database name | Yes | `process_mining` |
| `Uid` or `User ID` | MySQL username | Yes | `mindzie_user` |
| `Pwd` or `Password` | MySQL password | Yes | `SecurePassword123` |
| `Connection Timeout` | Connection timeout (seconds) | No | `30` |
| `Command Timeout` | Command timeout (seconds) | No | `600` |
| `Pooling` | Enable connection pooling | No | `true` |
| `Min Pool Size` | Minimum pool size | No | `0` |
| `Max Pool Size` | Maximum pool size | No | `100` |
| `SSL Mode` | SSL connection mode | No | `Required` |
| `CharSet` or `Character Set` | Character encoding | No | `utf8mb4` |
## Connection Examples
### Local MySQL Server
```
Server=localhost;Port=3306;Database=process_mining;Uid=mindzie_user;Pwd=password;
```
### Remote MySQL Server with SSL
```
Server=mysql.company.com;Port=3306;Database=process_mining;Uid=mindzie_user;Pwd=SecurePassword123;SSL Mode=Required;
```
### Amazon RDS MySQL
```
Server=myinstance.123456789012.us-east-1.rds.amazonaws.com;Port=3306;Database=process_mining;Uid=admin;Pwd=AWSPassword123;SSL Mode=Required;
```
### Azure Database for MySQL
```
Server=myserver.mysql.database.azure.com;Port=3306;Database=process_mining;Uid=mindzie@myserver;Pwd=AzurePassword123;SSL Mode=Required;
```
### Connection with Advanced Settings
```
Server=mysql-server;Port=3306;Database=process_mining;Uid=mindzie_user;Pwd=password;
Pooling=true;Min Pool Size=5;Max Pool Size=50;Connection Timeout=30;
Character Set=utf8mb4;SSL Mode=Preferred;
```
## Troubleshooting
### Common Connection Issues
**"Unable to connect to any of the specified MySQL hosts" Error**
- Verify server hostname and port
- Check network connectivity and firewall rules
- Ensure MySQL server is running: `systemctl status mysql`
- Validate MySQL bind-address configuration
**"Access denied for user" Error**
- Verify username and password are correct
- Check user exists: `SELECT User, Host FROM mysql.user;`
- Ensure user has proper privileges: `SHOW GRANTS FOR 'username'@'host';`
- Verify host-based access permissions
**"Unknown database" Error**
- Verify database name exists: `SHOW DATABASES;`
- Check user has access to the database
- Ensure proper database selection in connection string
**SSL Connection Errors**
- Verify SSL Mode setting matches server configuration
- Check MySQL SSL certificate configuration
- Use `SSL Mode=None` for testing (not recommended for production)
## Cloud-Specific Configurations
### Amazon RDS
- Use RDS endpoint as server name
- Enable SSL connections
- Configure security groups for access
### Azure Database for MySQL
- Use fully qualified server names
- Include server name in username: `user@servername`
- Configure firewall rules for client IPs
- Enable connection security settings
**mindzie Server Access:** For enhanced security, you can configure your firewall to only allow connections from mindzie servers by whitelisting specific IP addresses. Contact mindzie support to obtain the current IP addresses for the mindzie servers you are using.
### Google Cloud SQL
- Use public or private IP connections
- Configure authorized networks
- Enable SSL certificates for secure connections
## Related Information
- **Official Documentation:** [MySQL Documentation](https://dev.mysql.com/doc/)
- **MySQL .NET Connector:** [MySQL Connector/NET](https://dev.mysql.com/doc/connector-net/en/)
- **Performance Tuning:** [MySQL Performance Tuning](https://dev.mysql.com/doc/refman/8.0/en/optimization.html)
- **Security:** [MySQL Security Guide](https://dev.mysql.com/doc/refman/8.0/en/security.html)
---
💡 **Tip:** Use utf8mb4 character set to ensure full Unicode support, especially important for international process mining applications with multilingual data.
---
## ODBC
Section: Connectors
URL: https://docs.mindziestudio.com/mindzie_data_designer/Connectors/odbc
Source: /docs-master/mindzieDataDesigner/Connectors/odbc/page.md
# ODBC Generic Connector
**Category:** Database Connectors
## Introduction
This document is created to help setup a mindzieDataDesigner connector to any ODBC-compatible database. The mindzieDataDesigner is the ETL tool used by mindzieStudio to convert database tables to process mining event logs. The purpose of this document is to help creating the connection string and opening ports on the firewall if required.
## Overview
The ODBC connector provides universal connectivity to any database system that supports ODBC drivers. This connector is ideal for connecting to databases that don't have native .NET providers or for standardized database access across multiple systems.
## System Requirements
- **Database System:** Any ODBC-compliant database
- **ODBC Driver:** Specific driver for your target database
- **Platform Support:** Windows (primary), Linux (limited)
- **Dependencies:** ODBC driver for target database system
## Connection String Format
### DSN-Based Connection
```
DSN=MyDataSource;UID=username;PWD=password;
```
### DSN-Less Connection
```
Driver={Database Driver Name};Server=hostname;Database=database_name;UID=username;PWD=password;
```
## Connection Examples
### Using System DSN
```
DSN=ProductionDB;UID=mindzie_user;PWD=SecurePassword123;
```
### Direct Driver Connection
```
Driver={SQL Server};Server=server_name;Database=database_name;UID=username;PWD=password;
```
### IBM DB2 via ODBC
```
Driver={IBM DB2 ODBC DRIVER};Database=SAMPLE;Hostname=db2server;Port=50000;Protocol=TCPIP;UID=username;PWD=password;
```
## Related Information
- **Microsoft ODBC Documentation:** [ODBC API Reference](https://docs.microsoft.com/sql/odbc/)
- **Driver-Specific Documentation:** Consult your database vendor's ODBC driver documentation
---
💡 **Tip:** Configure ODBC Data Sources through Windows ODBC Data Source Administrator for easier connection string management.
---
## Oracle
Section: Connectors
URL: https://docs.mindziestudio.com/mindzie_data_designer/Connectors/oracle
Source: /docs-master/mindzieDataDesigner/Connectors/oracle/page.md
# Oracle Database Connector
**Category:** Database Connectors
## Introduction
This document is created to help setup a mindzieDataDesigner connector to Oracle Database. The mindzieDataDesigner is the ETL tool used by mindzieStudio to convert database tables to process mining event logs. The purpose of this document is to help creating the connection string and opening ports on the firewall if required.
## Overview
The Oracle connector provides native connectivity to Oracle Database instances using Oracle Managed Data Access (ODP.NET). This connector offers high performance, full Oracle feature support, and optimized timezone handling for global enterprises.
## System Requirements
- **Database System:** Oracle Database 11g Release 2 or later (19c recommended)
- **Supported Editions:** Express Edition (XE), Standard Edition, Enterprise Edition
- **Platform Support:** Windows, Linux, Unix
- **Cloud Support:** Oracle Cloud Infrastructure (OCI), Amazon RDS for Oracle, Oracle Autonomous Database
- **Dependencies:** Oracle Managed Data Access (ODP.NET) - included with connector
## Connection String Format
### Basic Format (Easy Connect)
```
Data Source=hostname:port/service_name;User Id=username;Password=password;
```
### TNS Names Format
```
Data Source=tns_alias;User Id=username;Password=password;
```
### Connection Parameters
| Parameter | Description | Required | Example |
|-----------|-------------|----------|---------|
| `Data Source` | Server connection details | Yes | `oracle-server:1521/ORCL` |
| `User Id` | Oracle username | Yes | `PROCESS_MINING` |
| `Password` | Oracle password | Yes | `SecurePassword123` |
| `Connection Timeout` | Connection timeout (seconds) | No | `60` |
| `Command Timeout` | Command timeout (seconds) | No | `600` |
| `Pooling` | Enable connection pooling | No | `true` |
| `Min Pool Size` | Minimum pool connections | No | `1` |
| `Max Pool Size` | Maximum pool connections | No | `100` |
| `DBA Privilege` | Administrative privileges | No | `SYSDBA` |
| `Persist Security Info` | Persist credentials | No | `false` |
## Connection Examples
### Local Oracle Express Edition (XE)
```
Data Source=localhost:1521/XE;User Id=MINDZIE_USER;Password=password;
```
### Oracle Enterprise Database
```
Data Source=oracle-prod.company.com:1521/PRODDB;User Id=PROCESS_MINING;Password=SecurePassword123;Connection Timeout=60;
```
### Using TNS Names
```
Data Source=PROD_ORACLE;User Id=MINDZIE_USER;Password=SecurePassword123;
```
### Oracle Autonomous Database (Cloud)
```
Data Source=mydb_high;User Id=ADMIN;Password=CloudPassword123;
```
### Connection with Advanced Settings
```
Data Source=oracle-server:1521/ORCL;User Id=MINDZIE_USER;Password=password;
Pooling=true;Min Pool Size=5;Max Pool Size=50;Connection Timeout=30;
```
### Pluggable Database (PDB) Connection
```
Data Source=oracle-server:1521/PDB1;User Id=PROCESS_USER;Password=password;
```
## Authentication Methods
### Database Authentication
- Standard Oracle username/password authentication
- Users created with `CREATE USER` statements
- Most common authentication method
### OS Authentication
```
Data Source=oracle-server:1521/ORCL;Integrated Security=yes;
```
### Proxy Authentication
```
Data Source=oracle-server:1521/ORCL;User Id=app_user;Password=password;Proxy User Id=end_user;
```
## Troubleshooting
### Common Connection Issues
**"ORA-12154: TNS:could not resolve the connect identifier" Error**
- Verify TNS names configuration in tnsnames.ora
- Check ORACLE_HOME and TNS_ADMIN environment variables
- Use Easy Connect syntax as alternative
- Validate service name and hostname
**"ORA-01017: invalid username/password" Error**
- Verify credentials are correct and user exists
- Check if account is locked: `ALTER USER username ACCOUNT UNLOCK;`
- Ensure user has CREATE SESSION privilege
- Validate password hasn't expired
**"ORA-12505: TNS:listener does not currently know of SID given" Error**
- Verify service name vs SID usage
- Check Oracle listener status: `lsnrctl status`
- Use service name instead of SID in modern Oracle versions
- Validate database service registration
**"ORA-00257: archiver error" Error**
- Check Oracle archive log space
- Contact Oracle DBA for maintenance
- Consider using read-only connection if available
**mindzie Server Access:** For enhanced security, you can configure your firewall to only allow connections from mindzie servers by whitelisting specific IP addresses. Contact mindzie support to obtain the current IP addresses for the mindzie servers you are using.
### Oracle Cloud Issues
**"ORA-28040: No matching authentication protocol" Error**
- Update Oracle client to compatible version
- Check Oracle Cloud authentication requirements
- Verify SSL/TLS configuration
## Oracle Autonomous Database Setup
### Prerequisites
1. **Download Wallet:** Get connection wallet from Oracle Cloud Console
2. **Extract Wallet:** Place files in accessible directory
3. **Set TNS_ADMIN:** Point to wallet directory
4. **Connection String:** Use service names from tnsnames.ora
### Autonomous Database Connection
```
Data Source=mydb_high;User Id=ADMIN;Password=WalletPassword123;
```
### Wallet Configuration
- Extract wallet.zip to secure directory
- Set TNS_ADMIN environment variable
- Use predefined service names (HIGH, MEDIUM, LOW)
## Related Information
- **Official Documentation:** [Oracle Database Documentation](https://docs.oracle.com/database/)
- **ODP.NET Guide:** [Oracle Data Provider for .NET](https://docs.oracle.com/database/121/ODPNT/)
- **Connection Strings:** [Oracle Connection String Reference](https://docs.oracle.com/database/121/ODPNT/ConnectionStrings.htm)
- **Oracle Cloud:** [Oracle Autonomous Database](https://docs.oracle.com/en/cloud/paas/autonomous-database/)
- **Performance Tuning:** [Oracle Performance Tuning Guide](https://docs.oracle.com/database/121/TGDBA/)
---
💡 **Tip:** For enterprise Oracle deployments, consider using Oracle Real Application Clusters (RAC) connection strings with multiple hosts for high availability and load distribution.
---
## PostgreSQL
Section: Connectors
URL: https://docs.mindziestudio.com/mindzie_data_designer/Connectors/postgresql
Source: /docs-master/mindzieDataDesigner/Connectors/postgresql/page.md
# PostgreSQL Database Connector
**Category:** Database Connectors
## Introduction
This document is created to help setup a mindzieDataDesigner connector to PostgreSQL database. The mindzieDataDesigner is the ETL tool used by mindzieStudio to convert database tables to process mining event logs. The purpose of this document is to help creating the connection string and opening ports on the firewall if required.
## Overview
The PostgreSQL connector provides high-performance connectivity to PostgreSQL databases using the Npgsql data provider. This connector supports advanced PostgreSQL features and is optimized for analytical workloads common in process mining.
## System Requirements
- **Database System:** PostgreSQL 10 or later (PostgreSQL 15+ recommended)
- **Cloud Support:** Amazon RDS for PostgreSQL, Azure Database for PostgreSQL, Google Cloud SQL
- **Platform Support:** Windows, Linux, macOS
- **Dependencies:** Npgsql .NET data provider - included with connector
## Connection String Format
### Basic Format
```
Host=hostname;Port=5432;Database=database_name;Username=username;Password=password;
```
### Connection Parameters
| Parameter | Description | Required | Example |
|-----------|-------------|----------|---------|
| `Host` or `Server` | PostgreSQL server hostname | Yes | `postgres.company.com` |
| `Port` | Server port number | No | `5432` (default) |
| `Database` | Database name | Yes | `process_mining` |
| `Username` or `User ID` | PostgreSQL username | Yes | `mindzie_user` |
| `Password` | PostgreSQL password | Yes | `SecurePassword123` |
| `Timeout` | Connection timeout (seconds) | No | `30` |
| `Command Timeout` | Command timeout (seconds) | No | `600` |
| `Pooling` | Enable connection pooling | No | `true` |
| `Minimum Pool Size` | Minimum pool connections | No | `1` |
| `Maximum Pool Size` | Maximum pool connections | No | `100` |
| `SSL Mode` | SSL connection mode | No | `Prefer` |
| `Trust Server Certificate` | Trust SSL certificate | No | `false` |
## Connection Examples
### Local PostgreSQL
```
Host=localhost;Port=5432;Database=process_mining;Username=mindzie_user;Password=password;
```
### Remote PostgreSQL with SSL
```
Host=postgres.company.com;Port=5432;Database=process_mining;Username=mindzie_user;Password=SecurePassword123;SSL Mode=Require;
```
### Amazon RDS PostgreSQL
```
Host=myinstance.123456789012.us-east-1.rds.amazonaws.com;Port=5432;Database=process_mining;Username=postgres;Password=RDSPassword123;SSL Mode=Require;
```
### Azure Database for PostgreSQL
```
Host=myserver.postgres.database.azure.com;Port=5432;Database=process_mining;Username=mindzie@myserver;Password=AzurePassword123;SSL Mode=Require;
```
### Connection with Pool Settings
```
Host=postgres-server;Port=5432;Database=process_mining;Username=mindzie_user;Password=password;
Pooling=true;Minimum Pool Size=5;Maximum Pool Size=50;Timeout=30;
```
## Troubleshooting
### Common Connection Issues
**"Connection refused" Error**
- Verify PostgreSQL is running: `systemctl status postgresql`
- Check server hostname and port number
- Validate firewall and network connectivity
- Ensure PostgreSQL accepts connections: check `listen_addresses`
**"Authentication failed" Error**
- Verify username and password are correct
- Check pg_hba.conf authentication configuration
- Ensure user exists: `\du` in psql
- Verify authentication method (md5, scram-sha-256)
**"Database does not exist" Error**
- Verify database name: `\l` in psql
- Check user has CONNECT privileges to database
- Ensure database is spelled correctly (case sensitive)
**SSL Connection Issues**
- Check PostgreSQL SSL configuration
- Verify SSL certificates if using Require mode
- Use SSL Mode=Prefer for automatic SSL negotiation
- Check Trust Server Certificate setting
## Cloud-Specific Configurations
### Amazon RDS PostgreSQL
- Use RDS endpoint as hostname
- Configure security groups for network access
- Enable SSL connections for data protection
### Azure Database for PostgreSQL
- Use fully qualified server names
- Include @servername in username for single server
- Configure firewall rules for client access
- Enable connection security features
**mindzie Server Access:** For enhanced security, you can configure your firewall to only allow connections from mindzie servers by whitelisting specific IP addresses. Contact mindzie support to obtain the current IP addresses for the mindzie servers you are using.
### Google Cloud SQL PostgreSQL
- Configure authorized networks or use Cloud SQL Proxy
- Enable SSL certificates for secure connections
- Use private IP for enhanced security
## Related Information
- **Official Documentation:** [PostgreSQL Documentation](https://www.postgresql.org/docs/)
- **Npgsql Provider:** [Npgsql Documentation](https://www.npgsql.org/doc/)
- **Performance Tuning:** [PostgreSQL Performance Tips](https://wiki.postgresql.org/wiki/Performance_Optimization)
- **Security:** [PostgreSQL Security](https://www.postgresql.org/docs/current/security.html)
---
💡 **Tip:** Leverage PostgreSQL's advanced analytical functions like window functions and CTEs for complex process mining queries that can be executed directly in the database for better performance.
---
## SAP HANA
Section: Connectors
URL: https://docs.mindziestudio.com/mindzie_data_designer/Connectors/sap-hana
Source: /docs-master/mindzieDataDesigner/Connectors/sap-hana/page.md
# SAP HANA Database Connector
**Category:** Database Connectors
## Introduction
This document is created to help setup a mindzieDataDesigner connector to SAP HANA database. The mindzieDataDesigner is the ETL tool used by mindzieStudio to convert database tables to process mining event logs. The purpose of this document is to help creating the connection string and opening ports on the firewall if required.
## Overview
The SAP HANA connector uses ODBC to provide robust connectivity to SAP HANA databases. This connector is optimized for enterprise SAP environments and supports on-premise SAP HANA instances, making it ideal for process mining large-scale enterprise data.
## System Requirements
- **Database System:** SAP HANA 1.0 or later (2.0 recommended)
- **Deployment Options:** On-premise
- **ODBC Driver:** SAP HANA ODBC Driver (minimum version 2.4)
## Prerequisites
The SAP HANA ODBC driver must be installed on your system. Please refer to SAP documentation for installation instructions.
## Connection String Format
### Basic ODBC Connection
```
Driver={HDBODBC};ServerNode=hostname:port;Database=database_name;UID=username;PWD=password;
```
### Connection Parameters
| Parameter | Description | Required | Example |
|-----------|-------------|----------|---------|
| `Driver` | ODBC driver name | Yes | `{HDBODBC}` or `{SAP HANA ODBC Driver}` |
| `ServerNode` | HANA server and port | Yes | `hana-server.company.com:30015` |
| `Database` | Target database/tenant | No | `PRD` or `SystemDB` |
| `UID` | Username | Yes | `MINDZIE_USER` |
| `PWD` | Password | Yes | `SecurePassword123` |
| `CHAR_AS_UTF8` | UTF-8 character handling | No | `1` |
| `CONNECTTIMEOUT` | Connection timeout | No | `30` |
| `COMMUNICATIONTIMEOUT` | Communication timeout | No | `0` (unlimited) |
| `RECONNECT` | Auto-reconnect setting | No | `1` (enabled) |
| `ENCRYPT` | Enable encryption | No | `true` |
## Connection Examples
### Standard On-Premise Connection
```
Driver={HDBODBC};ServerNode=hana-prod.company.com:30015;Database=PRD;UID=PROCESS_MINING_USER;PWD=SecurePassword123;CHAR_AS_UTF8=1;
```
### Multi-Tenant Database Container (MDC)
```
Driver={HDBODBC};ServerNode=hana-server:30013;Database=TENANT_DB;UID=MINDZIE_USER;PWD=password;
```
### High Availability Connection
```
Driver={HDBODBC};ServerNode=hana-node1:30015,hana-node2:30015,hana-node3:30015;Database=PRD;UID=MINDZIE_USER;PWD=password;RECONNECT=1;
```
## Required SAP HANA Permissions
The following SQL examples show the typical permissions needed for process mining. Replace the sample schema, table, and user names with your actual values:
```sql
-- Grant schema access (replace "PROCESS_MINING" with your schema name)
GRANT SELECT ON SCHEMA "YOUR_SCHEMA_NAME" TO YOUR_USERNAME;
-- Grant table-level permissions (replace with your actual table names)
GRANT SELECT ON "YOUR_SCHEMA_NAME"."YOUR_TABLE_NAME" TO YOUR_USERNAME;
-- For system views (if needed for metadata access)
GRANT SELECT ON SYS.M_DATABASES TO YOUR_USERNAME;
```
**Example with sample names:**
```sql
-- Sample permissions using example names
GRANT SELECT ON SCHEMA "PROCESS_MINING" TO MINDZIE_USER;
GRANT SELECT ON "PROCESS_MINING"."EVENT_LOG" TO MINDZIE_USER;
GRANT SELECT ON SYS.M_DATABASES TO MINDZIE_USER;
```
## Testing ODBC Connections
After configuring your ODBC connection, you can test it using various tools:
### Windows ODBC Data Source Administrator
- Built-in Windows utility (`odbcad32.exe`)
- Configure and test ODBC connections
- Access via Control Panel → Administrative Tools → ODBC Data Sources
### Database Client Tools
- **DBeaver:** Free, cross-platform database tool with ODBC support
- **HeidiSQL:** Windows-based SQL client supporting ODBC connections
- **SQL Server Management Studio:** Can connect to SAP HANA via ODBC
- **Toad for SAP:** Commercial tool with native SAP HANA support
### Microsoft Office Applications
- **Excel:** Connect via Data → Get Data → From Other Sources → From ODBC
- **Power BI:** Native SAP HANA connector and ODBC support
- **Access:** Link tables via ODBC connections
### Command Line Tools
- **isql:** Unix/Linux command line tool for testing ODBC connections
- **osql/sqlcmd:** Windows command line utilities (limited SAP HANA support)
### Simple Test Query
Once connected, test with a basic query:
```sql
SELECT CURRENT_TIMESTAMP FROM SYS.DUMMY;
```
## Firewall Configuration
### Required Firewall Ports
The following ports need to be opened on your firewall for SAP HANA ODBC connections:
| Port | Purpose | Default Instance (00) |
|------|---------|----------------------|
| 30013 | SystemDB SQL Connection | System database access |
| 30015 | Tenant Database SQL Connection | First tenant database |
| 443 | SAP HANA Cloud (HTTPS/SSL) | Cloud connections only |
### Port Numbering Scheme
- **System Database:** Port 30013 (for default instance 00)
- **Tenant Database:** Port 30015 (for default instance 00)
- **Pattern:** 3**NN**13 (SystemDB) or 3**NN**15 (Tenant DB), where **NN** = instance number
**Note:** Port numbers can be customized during SAP HANA installation. Check with your SAP HANA administrator for the exact ports used in your environment.
### Additional Considerations
- **High Availability:** Multiple ports may be required for cluster configurations
- **Load Balancers:** Additional ports may be needed for load balancer configurations
**Reference:** SAP Note 2477204 - FAQ: SAP HANA Services and Ports (requires SAP support access)
### mindzie Server Access
For enhanced security, you can configure your firewall to only allow connections from mindzie servers by whitelisting specific IP addresses. Contact mindzie support to obtain the current IP addresses for the mindzie servers you are using.
## CDPOS Change Document Extraction
CDPOS is a crucial SAP table that stores field-level changes to business objects, commonly used in process mining to track detailed modifications. Since CDPOS doesn't contain date fields directly, it must be joined with CDHDR (Change Document Header) for time-based filtering.
### Oracle Database Query
```sql
-- ORACLE SQL VERSION: GET ALL CDPOS RECORDS FOR LAST 2 YEARS
-- CDPOS does NOT have date/time fields - must join with CDHDR for filtering
-- DOCUMENTATION REFERENCES:
-- 1. CDHDR.UDATE = "Creation date of the change document" (SAP Datasheet)
-- 2. CDPOS.CHANGENR = CDHDR.CHANGENR is the standard join (SAP Community)
-- 3. "These two tables are connected by the change number" (Techlorean)
-- 4. CDHDR contains header info, CDPOS contains field-level details
SELECT CDPOS.*
FROM CDPOS
INNER JOIN CDHDR ON CDPOS.CHANGENR = CDHDR.CHANGENR
WHERE CDHDR.UDATE >= ADD_MONTHS(SYSDATE, -24) -- Oracle: Last 24 months (2 years)
-- ORACLE SPECIFIC NOTES:
-- 1. Uses ADD_MONTHS(SYSDATE, -24) for 2-year date calculation
-- 2. SYSDATE returns current date/time
-- 3. Alternative: CDHDR.UDATE >= SYSDATE - INTERVAL '2' YEAR
-- 4. Date format in CDHDR.UDATE should be compatible with Oracle DATE type
```
### SAP ODBC Query
```sql
-- SAP SQL VIA ODBC CONNECTOR: GET ALL CDPOS RECORDS FOR LAST 2 YEARS
-- CDPOS does NOT have date/time fields - must join with CDHDR for filtering
-- DOCUMENTATION REFERENCES:
-- 1. CDHDR.UDATE = "Creation date of the change document" (SAP Datasheet)
-- 2. CDPOS.CHANGENR = CDHDR.CHANGENR is the standard join (SAP Community)
-- 3. "These two tables are connected by the change number" (Techlorean)
-- 4. CDHDR contains header info, CDPOS contains field-level details
-- IMPORTANT: CDPOS is a cluster table - direct joins may not work via ODBC
-- This query may need to be split into separate queries depending on SAP version
SELECT CDPOS.*
FROM CDPOS
INNER JOIN CDHDR ON CDPOS.CHANGENR = CDHDR.CHANGENR
WHERE CDHDR.UDATE >= ADD_DAYS(CURRENT_DATE, -730) -- SAP HANA: Last 730 days (2 years)
-- SAP SQL SPECIFIC NOTES:
-- 1. Uses ADD_DAYS(CURRENT_DATE, -730) for 2-year calculation (SAP HANA)
-- 2. For older SAP systems, may need: CDHDR.UDATE >= '20220101' (hardcoded date)
-- 3. CDPOS is a cluster table - may require special handling via ODBC
-- 4. Alternative for non-HANA: Use DATE subtraction if supported
-- 5. Date format: CDHDR.UDATE is typically YYYYMMDD format in SAP
-- 6. For maximum compatibility, use client-side date parameter:
-- WHERE CDHDR.UDATE >= '?' -- Parameter for 2 years ago date
-- CLUSTER TABLE WARNING:
-- CDPOS is a cluster table in SAP, which may cause issues with ODBC connections
-- Consider using SAP RFC or function modules for better performance
-- Alternative: Query CDHDR first, then CDPOS separately using CHANGENR values
```
### SQL Server (T-SQL) Query
```sql
-- T-SQL (SQL SERVER) VERSION: GET ALL CDPOS RECORDS FOR LAST 2 YEARS
-- CDPOS does NOT have date/time fields - must join with CDHDR for filtering
-- DOCUMENTATION REFERENCES:
-- 1. CDHDR.UDATE = "Creation date of the change document" (SAP Datasheet)
-- 2. CDPOS.CHANGENR = CDHDR.CHANGENR is the standard join (SAP Community)
-- 3. "These two tables are connected by the change number" (Techlorean)
-- 4. CDHDR contains header info, CDPOS contains field-level details
SELECT CDPOS.*
FROM CDPOS
INNER JOIN CDHDR ON CDPOS.CHANGENR = CDHDR.CHANGENR
WHERE CDHDR.UDATE >= DATEADD(YEAR, -2, GETDATE()) -- T-SQL: Last 2 years from current date
-- T-SQL SPECIFIC NOTES:
-- 1. Uses DATEADD(YEAR, -2, GETDATE()) for 2-year date calculation
-- 2. GETDATE() returns current date/time
-- 3. Alternative: CDHDR.UDATE >= DATEADD(MONTH, -24, GETDATE())
-- 4. Date format in CDHDR.UDATE should be compatible with SQL Server datetime
-- 5. May need CONVERT() if UDATE is stored as string in YYYYMMDD format:
-- WHERE CONVERT(datetime, CDHDR.UDATE, 112) >= DATEADD(YEAR, -2, GETDATE())
```
## ODBC Driver Installation (mindzieStudio Server Only)
**Note:** This section is only required for the server running mindzieStudio.
### Download
Go to: **https://tools.hana.ondemand.com/#hanatools**
1. Create a free SAP account if needed (quick registration)
2. Find: **SAP HANA Client**
3. Download: **Windows on x64 64bit** version
4. File name: `hanaclient-x.x.x.x-windows-x64.zip`
### Install
1. Extract the ZIP file
2. Run `hdbsetup.exe` as Administrator
3. Select "Install new SAP HANA client"
4. Follow the wizard (accept defaults)
5. Done!
### Verify Installation
Run in PowerShell:
```powershell
Get-OdbcDriver | Where-Object {$_.Name -like "*HDB*"}
```
Should show: `HDBODBC [64-bit]`
### Driver Not Listed After Installation
```cmd
cd "C:\Program Files\SAP\hdbclient"
hdbodbc_cons.exe -i
```
## Troubleshooting
### Common Connection Issues
**"Cannot connect to server" Error**
- Verify server hostname and port number
- Check network connectivity and firewall rules
- Ensure SAP HANA instance is running and accepting connections
- Validate HANA service status with `HDB info`
**"Authentication failed" Error**
- Verify username and password are correct
- Check if user account is locked or expired
- Ensure user has CONNECT privilege
- Verify password policy compliance
**"Driver not found" Error**
- Install SAP HANA ODBC driver from SAP HANA Client
- Verify driver registration in ODBC Data Source Administrator
- Check for 32-bit vs 64-bit driver compatibility
- Ensure driver path is in system PATH
**"Table or view does not exist" Error**
- Verify table/view names and schema references
- Check user permissions on specific objects
- Use fully qualified names: `SCHEMA.TABLE`
- Validate case sensitivity in object names
## Related Information
- **SAP HANA Documentation:** [SAP Help Portal](https://help.sap.com/hana)
- **SAP HANA Client:** [SAP Software Downloads](https://support.sap.com/swdc)
- **ODBC Driver Reference:** [SAP HANA ODBC Driver Guide](https://help.sap.com/docs/SAP_HANA_CLIENT)
- **Connection Security:** [SAP HANA Security Guide](https://help.sap.com/docs/SAP_HANA_PLATFORM)
- **Performance Tuning:** [SAP HANA Performance Guide](https://help.sap.com/docs/SAP_HANA_PLATFORM)
---
## Sources and References
This documentation is based on the following sources:
### Official SAP Documentation
- **[SAP HANA Platform Documentation](https://help.sap.com/docs/SAP_HANA_PLATFORM)** - Official SAP HANA platform documentation
- **[SAP HANA ODBC Connection Properties](https://help.sap.com/docs/SAP_HANA_PLATFORM/0eec0d68141541d1b07893a39944924e/7cab593774474f2f8db335710b2f5c50.html)** - Official ODBC connection parameters
- **[SAP HANA Services and Ports (SAP Note 2477204)](https://userapps.support.sap.com/sap/support/knowledge/en/2477204)** - Official port documentation (requires SAP support access)
### Community and Technical Resources
- **[Qlik Community - SAP HANA ODBC Connection String](https://community.qlik.com/t5/Connectivity-Data-Prep/Connection-string-ODBC-for-SAP-Hana/td-p/2484444)** - Community validation of connection string format
- **[Microsoft Power Query SAP HANA Documentation](https://learn.microsoft.com/en-us/power-query/connectors/sap-hana/)** - Microsoft's SAP HANA connector documentation
---
## SAP SuccessFactors
Section: Connectors
URL: https://docs.mindziestudio.com/mindzie_data_designer/Connectors/sap-successfactors
Source: /docs-master/mindzieDataDesigner/Connectors/sap-successfactors/page.md
# SAP SuccessFactors Connector
**Category:** API Connectors
## Introduction
This document helps you set up a mindzieDataDesigner connector to SAP SuccessFactors. The mindzieDataDesigner is the ETL tool used by mindzieStudio to convert data to process mining event logs. SAP SuccessFactors is a cloud-based Human Experience Management (HXM) suite that provides HR, payroll, talent management, and workforce analytics capabilities. This connector uses the SuccessFactors OData API with OAuth 2.0 authentication to extract HR data for process mining.
## Overview
The SAP SuccessFactors connector uses the OData v2 API to provide secure, read-only access to SuccessFactors data. This connector supports OAuth 2.0 authentication with SAML 2.0 bearer assertion using X.509 certificates, which is the recommended authentication method for server-to-server integrations.
**Key capabilities:**
- Extract Employee Central data (employee profiles, employment history, org structure)
- Access time management, payroll, and talent data
- Read-only access ensuring data integrity
- Secure OAuth 2.0 authentication with X.509 certificates
## System Requirements
- SAP SuccessFactors instance with API access enabled
- Administrator access to SuccessFactors Admin Center
- Ability to create and manage API users and OAuth applications
## Prerequisites
Before configuring the connector, ensure you have:
- **Admin Center Access:** Permission to access the SuccessFactors Admin Center
- **User Management:** Permission to create technical/API users
- **OAuth Configuration:** Permission to register OAuth2 client applications
- **Role-Based Permissions (RBP):** Permission to create and assign permission groups and roles
- **Certificate Management:** Ability to generate or obtain X.509 certificates
## Credentials Required by mindzie
After completing the setup, provide the following credentials to mindzie:
| Credential | Description | Example |
|------------|-------------|---------|
| Company ID | Your SuccessFactors company identifier | `mycompanyPROD` |
| API Server URL | OData API endpoint for your data center | `https://api15.sapsf.com` |
| Technical User ID | Username of the API service account | `mindzie_api_user` |
| API Key | Client ID from OAuth application registration | `NGYzNzg1YjctZDM4...` |
| Private Key | Private key from X.509 certificate (Certificate.pem) | (PEM file contents) |
## Step 1: Determine Your API Server URL
SAP SuccessFactors uses different data centers. Your API server URL depends on which data center hosts your instance.
### Data Center to API URL Mapping
| Data Center | Location | API Server URL |
|-------------|----------|----------------|
| DC2 | Amsterdam | `https://api2.successfactors.eu` |
| DC4 | Ashburn | `https://api4.successfactors.com` |
| DC5 | Sydney | `https://api5.successfactors.com` |
| DC8 | Frankfurt | `https://api8.successfactors.eu` |
| DC10 | Ashburn (US Gov) | `https://api10.successfactors.com` |
| DC12 | Amsterdam | `https://api012.successfactors.eu` |
| DC15 | Shanghai | `https://api15.sapsf.cn` |
| DC17 | Ashburn | `https://api17.sapsf.com` |
| DC18 | Rot | `https://api18.sapsf.eu` |
| DC19 | Sydney | `https://api19.sapsf.com` |
| DC20 | Tokyo | `https://api20.sapsf.com` |
| DC22 | Riyadh | `https://api22.sapsf.com` |
| DC23 | Moscow | `https://api23.sapsf.com` |
| DC24 | Frankfurt | `https://api24.sapsf.eu` |
| DC25 | UAE | `https://api25.sapsf.com` |
| DC26 | Singapore | `https://api26.sapsf.com` |
| DC27 | Mumbai | `https://api27.sapsf.com` |
| DC28 | Canada | `https://api28.sapsf.com` |
**Finding your data center:**
1. Log into SuccessFactors
2. Look at the URL in your browser - the data center is typically indicated in the domain (e.g., `performancemanager4.successfactors.com` indicates DC4)
3. Or contact your SuccessFactors administrator
## Step 2: Find Your Company ID
1. Log into SAP SuccessFactors Admin Center
2. Navigate to **Company Settings** or **Company System and Logo Settings**
3. The **Company ID** is displayed on this page
4. This is typically a string like `mycompanyPROD` or `ACME_Corp_Production`
**Alternative method:**
- Check your SuccessFactors login URL - the company ID is often part of the URL
- Contact your SuccessFactors administrator
## Step 3: Create a Technical API User
Create a dedicated service account for the mindzie integration. This user should never be used for interactive logins.
1. Go to **Admin Center** -> **Manage Employees**
2. Click **Add New Employee** or **Add New User**
3. Fill in the required fields:
- **Username:** `mindzie_api_user` (or your preferred naming convention)
- **First Name:** `mindzie`
- **Last Name:** `API Service`
- **Email:** A monitored service account email address
4. Set a secure password (this will be used for initial setup only)
5. **Important:** This user should be flagged as a "technical user" or "service account" if your instance supports this distinction
6. Save the user
**Note:** Record the username - this will be provided to mindzie as the **Technical User ID**.
## Step 4: Create a Permission Group
Create a permission group to manage API access permissions.
1. Go to **Admin Center** -> **Manage Permission Groups**
2. Click **Create New** to create a new permission group
3. Configure the group:
- **Group Name:** `mindzie_API_Access` (or similar)
- **Description:** `Permission group for mindzie process mining API access`
4. Add the technical user created in Step 3 to this group
5. Save the permission group
## Step 5: Create a Read-Only Permission Role
Create a role that grants read-only access to the data required for process mining.
1. Go to **Admin Center** -> **Manage Permission Roles**
2. Click **Create New** to create a new role
3. Configure the role:
- **Role Name:** `mindzie_ReadOnly_Role`
- **Description:** `Read-only access for mindzie process mining integration`
4. **Grant Permission Group:** Assign the permission group created in Step 4
5. **Configure Permissions:** Enable the following permissions based on your data requirements:
### Administrator Permissions
| Permission | Description |
|------------|-------------|
| Admin access to OData API | Required for API access |
| Admin access to Metadata Framework | Access to entity metadata |
### User Permissions
| Permission | Description |
|------------|-------------|
| Employee Central OData API | Access to Employee Central data |
| Time Management OData API | Access to time tracking data |
| Compensation OData API | Access to compensation data |
### Employee Data Permissions
| Permission | Description |
|------------|-------------|
| Employee Data - View | View employee profile information |
| Employment Details - View | View employment history |
| Job Information - View | View job and position data |
| Organizational Data - View | View org structure |
| Personal Information - View | View personal details |
| Compensation Information - View | View salary and comp data |
**Note:** Grant only the minimum permissions required for your process mining use case. The specific permissions needed depend on which SuccessFactors modules and data you need to analyze.
6. Save the permission role
## Step 6: Register OAuth2 Client Application
Register an OAuth2 client application for secure API authentication.
### 6.1 Generate X.509 Certificate
You need an X.509 certificate for OAuth authentication. You can either:
- Use an existing enterprise certificate
- Generate a self-signed certificate
**To generate a self-signed certificate (using OpenSSL):**
```bash
# Generate private key and certificate (valid for 2 years)
openssl req -newkey rsa:2048 -nodes -keyout private_key.pem -x509 -days 730 -out certificate.pem -subj "/CN=mindzie-sf-integration/O=Your Company/C=US"
```
**Important:** Keep the private key (`private_key.pem`) secure. This will be provided to mindzie.
### 6.2 Register the OAuth Application
1. Go to **Admin Center** -> **Manage OAuth2 Client Applications**
2. Click **Register Client Application**
3. Configure the application:
- **Application Name:** `mindzie Process Mining Integration`
- **Description:** `OAuth2 client for mindzie data extraction`
- **Application URL:** `https://mindzie.com` (or as provided by mindzie)
4. **Upload X.509 Certificate:**
- Upload the `certificate.pem` file generated above
- The certificate is used to sign the SAML assertion
5. **API Access:**
- Select the APIs this application can access
- At minimum, enable **OData API** access
6. Click **Register** to complete the registration
7. **Record the API Key:** After registration, the system displays an **API Key** (also called Client ID). Record this value - it will be provided to mindzie.
## Step 7: Provide Credentials to mindzie
Securely transmit the following credentials to mindzie:
| Credential | Value |
|------------|-------|
| Company ID | Your company identifier from Step 2 |
| API Server URL | Your data center URL from Step 1 |
| Technical User ID | Username from Step 3 |
| API Key | Client ID from Step 6 |
| Private Key | Contents of `private_key.pem` from Step 6.1 |
**Security recommendations:**
- Use secure file transfer or encrypted email
- Never send all credentials in a single message
- Consider using a secure credential sharing service
- Delete temporary copies after transmission
## Required SuccessFactors Permissions Summary
The following permissions are required for the mindzie integration:
### Minimum Required Permissions
- Admin access to OData API
- Employee Central OData API (for Employee Central data)
- Employee Data - View
- Employment Details - View
### Recommended Additional Permissions (based on use case)
- Job Information - View
- Organizational Data - View
- Personal Information - View
- Compensation Information - View
- Time Management OData API
- Compensation OData API
## Testing the Connection (Optional)
You can verify your API configuration using the SAP Business Accelerator Hub:
1. Go to [SAP Business Accelerator Hub](https://api.sap.com/)
2. Search for "SAP SuccessFactors" APIs
3. Use the "Try Out" feature with your credentials
4. Test a simple query like retrieving the company information entity
**Alternative: Using cURL**
```bash
# This is a simplified example - actual OAuth flow is more complex
curl -X GET "https://[your-api-server]/odata/v2/User?$top=1" \
-H "Authorization: Bearer [your-oauth-token]" \
-H "Accept: application/json"
```
## Firewall Configuration
### Outbound Access Required
mindzie servers need outbound HTTPS access to your SuccessFactors data center:
| Port | Protocol | Destination | Purpose |
|------|----------|-------------|---------|
| 443 | HTTPS | Your API Server URL (from Step 1) | OData API calls |
### No Inbound Ports Required
The mindzie integration is entirely outbound from mindzie to SuccessFactors. No inbound firewall rules are required on your network.
### IP Whitelisting (Optional)
For enhanced security, you can restrict API access to mindzie IP addresses:
1. Contact mindzie support to obtain the current IP addresses
2. Configure IP restrictions in SuccessFactors Admin Center if supported
3. Or configure your network firewall to allow only mindzie IPs to reach SuccessFactors
## Revoking Access
If you need to disable the mindzie integration:
### Immediate Revocation
1. Go to **Admin Center** -> **Manage OAuth2 Client Applications**
2. Find the mindzie application
3. Click **Revoke** or **Disable** to immediately invalidate the OAuth credentials
### Complete Removal
1. Revoke the OAuth application (above)
2. Delete or deactivate the technical API user created in Step 3
3. Remove the permission role created in Step 5
4. Remove the permission group created in Step 4
## Troubleshooting
### OAuth Authentication Errors
**"Invalid client credentials"**
- Verify the API Key (Client ID) is correct
- Ensure the OAuth application is not revoked or disabled
- Check that the X.509 certificate has not expired
**"SAML assertion failed"**
- Verify the private key matches the certificate registered in SuccessFactors
- Ensure the Technical User ID is correct and the user is active
- Check that the Company ID is correct
### Permission Denied Errors
**"Insufficient privileges"**
- Verify the technical user is assigned to the correct permission group
- Check that the permission role has the required API permissions enabled
- Ensure Admin access to OData API is granted
**"Entity not accessible"**
- The specific entity may require additional permissions
- Check RBP settings for the entity in question
- Consult SAP documentation for entity-specific permissions
### Certificate Issues
**"Certificate expired"**
- Generate a new X.509 certificate
- Update the certificate in the OAuth application registration
- Provide the new private key to mindzie
**"Certificate not trusted"**
- For self-signed certificates, ensure the certificate is properly uploaded
- For enterprise certificates, verify the certificate chain
### API Rate Limits
SAP SuccessFactors enforces API rate limits. If you encounter rate limiting:
- mindzie implements appropriate throttling
- Contact SAP support for rate limit increases if needed
- Consider filtering data at the query level to reduce API calls
### Connection Timeout
**"Connection timed out"**
- Verify the API Server URL is correct for your data center
- Check network connectivity and firewall rules
- Ensure SuccessFactors is not experiencing an outage
## Related Information
- **SAP SuccessFactors Help Portal:** [help.sap.com/successfactors](https://help.sap.com/docs/SAP_SUCCESSFACTORS_PLATFORM)
- **SAP Business Accelerator Hub:** [api.sap.com](https://api.sap.com/)
- **SuccessFactors API Reference:** [SAP SuccessFactors OData API](https://help.sap.com/docs/SAP_SUCCESSFACTORS_PLATFORM/d599f15995d348a1b45ba5603e2aba9b/03e1fc3791684367a6a76a614a2916de.html)
---
## Sources and References
This documentation is based on the following sources:
### Official SAP Documentation
- **[SAP SuccessFactors Platform Documentation](https://help.sap.com/docs/SAP_SUCCESSFACTORS_PLATFORM)** - Official platform documentation
- **[SAP SuccessFactors API Reference](https://help.sap.com/docs/SAP_SUCCESSFACTORS_PLATFORM/d599f15995d348a1b45ba5603e2aba9b/03e1fc3791684367a6a76a614a2916de.html)** - OData API documentation
- **[SAP SuccessFactors Data Centers](https://help.sap.com/docs/SAP_SUCCESSFACTORS_PLATFORM/568fdf1f14f14fd089c46c2e47f729e4/c1875a2c6ca5498380c2cdb93c1b1900.html)** - Data center information
- **[OAuth 2.0 SAML Bearer Assertion](https://help.sap.com/docs/SAP_SUCCESSFACTORS_PLATFORM/d599f15995d348a1b45ba5603e2aba9b/d05ab47c88934234925e09ce7ac1f0aa.html)** - OAuth authentication guide
### SAP Community Resources
- **[SAP Community - SuccessFactors](https://community.sap.com/topics/successfactors)** - Community discussions and best practices
- **[SAP Business Accelerator Hub](https://api.sap.com/)** - API testing and documentation
---
## Snowflake
Section: Connectors
URL: https://docs.mindziestudio.com/mindzie_data_designer/Connectors/snowflake
Source: /docs-master/mindzieDataDesigner/Connectors/snowflake/page.md
# Snowflake Data Warehouse Connector
**Category:** Database Connectors
## Introduction
This document is created to help setup a mindzieDataDesigner connector to Snowflake database. The mindzieDataDesigner is the ETL tool used by mindzieStudio to convert database tables to process mining event logs. The purpose of this document is to help creating the connection string and opening ports on the firewall if required.
## Overview
The Snowflake connector provides high-performance connectivity to Snowflake data warehouses. Optimized for analytical workloads and process mining scenarios.
## System Requirements
- **Cloud Platform:** Snowflake (AWS, Azure, Google Cloud)
- **Authentication:** Username/Password, SSO, Key Pair, OAuth
- **Platform Support:** Cross-platform cloud access
- **Dependencies:** Snowflake .NET connector
## Connection String Format
### Basic Format
```
Account=myaccount.region;User=username;Password=password;Database=database_name;Schema=schema_name;Warehouse=warehouse_name;
```
### Connection Parameters
| Parameter | Description | Required | Example |
|-----------|-------------|----------|---------|
| `Account` | Snowflake account identifier | Yes | `mycompany.us-east-1` |
| `User` | Snowflake username | Yes | `MINDZIE_USER` |
| `Password` | Snowflake password | Yes* | `SecurePassword123` |
| `Database` | Default database | No | `PROCESS_MINING` |
| `Schema` | Default schema | No | `PUBLIC` |
| `Warehouse` | Compute warehouse | No | `ANALYTICS_WH` |
| `Role` | Snowflake role | No | `ANALYST` |
| `Connection Timeout` | Connection timeout | No | `60` |
## Connection Examples
### Standard Connection
```
Account=mycompany.us-east-1;User=MINDZIE_USER;Password=SecurePassword123;Database=PROCESS_MINING;Schema=PUBLIC;Warehouse=ANALYTICS_WH;
```
### Connection with Role
```
Account=mycompany.eu-west-1;User=ANALYST_USER;Password=password;Database=DATA_WAREHOUSE;Schema=ANALYTICS;Warehouse=LARGE_WH;Role=ANALYST_ROLE;
```
### Multi-Cloud Connection
```
Account=mycompany.aws-us-west-2;User=SERVICE_USER;Password=password;Database=ENTERPRISE_DB;Warehouse=AUTO_WH;
```
## Troubleshooting
### Common Issues
**"Authentication failed" Error**
- Verify account identifier format
- Check username and password
- Ensure user account is not suspended
- Verify MFA settings if enabled
**"Warehouse not found" Error**
- Check warehouse name spelling and case
- Verify warehouse exists and is accessible
- Ensure user has USAGE privileges on warehouse
**"Database/Schema not found" Error**
- Verify database and schema names
- Check access privileges
- Use fully qualified object names
## Related Information
- **Official Documentation:** [Snowflake Documentation](https://docs.snowflake.com/)
- **Snowflake Connector:** [.NET Driver Guide](https://docs.snowflake.com/en/user-guide/dotnet-driver.html)
- **Best Practices:** [Snowflake Performance Tuning](https://docs.snowflake.com/en/user-guide/performance-tuning.html)
---
💡 **Tip:** Use Snowflake's automatic clustering and query acceleration features to optimize performance for large-scale process mining workloads.
---
## SQLite
Section: Connectors
URL: https://docs.mindziestudio.com/mindzie_data_designer/Connectors/sqlite
Source: /docs-master/mindzieDataDesigner/Connectors/sqlite/page.md
# SQLite Database Connector
**Category:** Database Connectors
## Introduction
This document is created to help setup a mindzieDataDesigner connector to SQLite database. The mindzieDataDesigner is the ETL tool used by mindzieStudio to convert database tables to process mining event logs. The purpose of this document is to help creating the connection string and opening ports on the firewall if required.
## Overview
The SQLite connector allows mindzieDataDesigner to connect to SQLite database files directly. SQLite is ideal for development, testing, and small-to-medium sized applications where a lightweight, serverless database solution is needed.
## System Requirements
- **Database System:** SQLite 3.x
- **File Access:** Read/write permissions to SQLite database files
- **Platforms:** Windows, Linux, macOS
- **Dependencies:** Built into .NET - no additional drivers required
## Connection String Format
### Basic Format
```
Data Source=C:\path\to\database.db
```
### Standard Parameters
| Parameter | Description | Required | Example |
|-----------|-------------|----------|---------|
| `Data Source` | Path to SQLite database file | Yes | `C:\data\mydatabase.db` |
| `Version` | SQLite version (usually 3) | No | `3` |
| `Password` | Database password (if encrypted) | No | `mypassword` |
| `Read Only` | Open in read-only mode | No | `true` or `false` |
| `Cache` | Cache mode setting | No | `Shared` or `Private` |
## Connection Examples
### Basic Connection
```
Data Source=C:\MyProject\database.db;Version=3;
```
### Read-Only Connection
```
Data Source=C:\MyProject\database.db;Version=3;Read Only=true;
```
### Password-Protected Database
```
Data Source=C:\MyProject\database.db;Version=3;Password=mypassword;
```
### Relative Path Connection
```
Data Source=.\database.db;Version=3;
```
### In-Memory Database
```
Data Source=:memory:;Version=3;New=true;
```
## Troubleshooting
### Common Issues
**"Database is locked" Error**
- Ensure no other applications have the database file open
- Check for proper connection disposal in your application
- Consider using WAL mode for better concurrency
**"Unable to open the database file" Error**
- Verify the file path is correct and accessible
- Check read/write permissions on the database file and directory
- Ensure the directory structure exists
**Performance Issues**
- Check database size and consider VACUUM operations
- Review indexing strategy
- Monitor concurrent connections and implement connection pooling
### Connection String Validation
Test your connection string with a simple query:
```sql
SELECT sqlite_version();
```
## Related Information
- **Official Documentation:** [SQLite.org](https://sqlite.org/)
- **System.Data.SQLite:** [Official .NET Provider](https://system.data.sqlite.org/)
- **SQL Syntax:** SQLite supports most standard SQL operations
- **Tools:** DB Browser for SQLite, SQLiteStudio
---
💡 **Tip:** SQLite databases are single files, making them easy to backup, share, and deploy with your applications.
---
## SQL Server
Section: Connectors
URL: https://docs.mindziestudio.com/mindzie_data_designer/Connectors/sql-server
Source: /docs-master/mindzieDataDesigner/Connectors/sql-server/page.md
# Microsoft SQL Server Connector
**Category:** Database Connectors
## Introduction
This document is created to help setup a mindzieDataDesigner connector to Microsoft SQL Server database. The mindzieDataDesigner is the ETL tool used by mindzieStudio to convert database tables to process mining event logs. The purpose of this document is to help creating the connection string and opening ports on the firewall if required.
## Overview
The Microsoft SQL Server connector provides native connectivity to SQL Server instances, offering high performance and full feature support. This connector is optimized for enterprise environments and supports all SQL Server versions from 2012 onwards.
## System Requirements
- **Database System:** Microsoft SQL Server 2012 or later
- **Supported Editions:** Express, Standard, Enterprise, Developer
- **Platforms:** Windows Server, Linux (SQL Server 2017+)
- **Cloud Support:** Azure SQL Database, Azure SQL Managed Instance
- **Dependencies:** Uses native SQL Server client drivers
## Connection String Format
### Standard SQL Server Authentication
```
Server=server_name;Database=database_name;User ID=username;Password=password;
```
### Windows Authentication
```
Server=server_name;Database=database_name;Integrated Security=true;
```
### Connection Parameters
| Parameter | Description | Required | Example |
|-----------|-------------|----------|---------|
| `Server` or `Data Source` | SQL Server instance name/IP | Yes | `localhost\SQLEXPRESS` |
| `Database` or `Initial Catalog` | Database name | Yes | `MyDatabase` |
| `User ID` | SQL Server username | No* | `sa` |
| `Password` | SQL Server password | No* | `MyPassword123` |
| `Integrated Security` | Use Windows Authentication | No | `true` or `SSPI` |
| `Connection Timeout` | Connection timeout (seconds) | No | `30` |
| `Command Timeout` | Command timeout (seconds) | No | `600` |
| `Encrypt` | Enable SSL/TLS encryption | No | `true` or `false` |
| `TrustServerCertificate` | Trust server certificate | No | `true` or `false` |
| `ApplicationName` | Application identifier | No | `mindzieDataDesigner` |
*Required unless using Integrated Security
## Connection Examples
### Local SQL Server Express
```
Server=localhost\SQLEXPRESS;Database=ProcessMining;Integrated Security=true;Connection Timeout=30;
```
### SQL Server with Authentication
```
Server=sql-server.company.com;Database=ProcessMining;User ID=mindzie_user;Password=SecurePassword123;Encrypt=true;TrustServerCertificate=false;
```
### Azure SQL Database
```
Server=tcp:myserver.database.windows.net,1433;Database=ProcessMining;User ID=mindzie_user@myserver;Password=SecurePassword123;Encrypt=true;TrustServerCertificate=false;Connection Timeout=30;
```
### SQL Server with Custom Port
```
Server=192.168.1.100,1435;Database=ProcessMining;User ID=mindzie_user;Password=SecurePassword123;
```
### High Availability (Always On)
```
Server=tcp:ag-listener.company.com;Database=ProcessMining;User ID=mindzie_user;Password=SecurePassword123;MultiSubnetFailover=true;
```
## Authentication Methods
### Windows Authentication (Recommended for Domain Environments)
- Uses current Windows user credentials
- No password storage in connection strings
- Supports Active Directory integration
- Best for internal corporate environments
### SQL Server Authentication
- Uses SQL Server native login accounts
- Requires username and password in connection string
- Works across different platforms and networks
- Suitable for web applications and external access
### Azure Active Directory Authentication
```
Server=tcp:myserver.database.windows.net;Database=ProcessMining;Authentication=Active Directory Integrated;
```
## Troubleshooting
### Common Connection Issues
**"Login failed for user" Error**
- Verify username and password are correct
- Check if the user account is enabled and not locked
- Ensure the user has permission to access the specified database
- For Windows Authentication, verify the account has login rights
**"Server not found or not accessible" Error**
- Verify server name and port number
- Check network connectivity and firewall settings
- Ensure SQL Server is running and accepting connections
- Verify SQL Server Browser service is running (for named instances)
**"Timeout expired" Error**
- Increase `Connection Timeout` value
- Check network latency and stability
- Verify server resources and performance
- Consider query optimization for large datasets
**"Certificate chain was issued by an untrusted authority" Error**
- Set `TrustServerCertificate=true` for development environments
- Install proper SSL certificates for production environments
- Use `Encrypt=false` only in secure internal networks
## Azure SQL Considerations
### Azure SQL Database
- Use fully qualified server names: `server.database.windows.net`
- Always use encrypted connections
- Consider firewall rules and IP restrictions
**mindzie Server Access:** For enhanced security, you can configure your firewall to only allow connections from mindzie servers by whitelisting specific IP addresses. Contact mindzie support to obtain the current IP addresses for the mindzie servers you are using.
### Connection Resilience
```
Server=tcp:myserver.database.windows.net;Database=ProcessMining;User ID=user@myserver;
Password=password;Encrypt=true;Connection Timeout=30;ConnectRetryCount=3;
ConnectRetryInterval=10;
```
## Related Information
- **Official Documentation:** [Microsoft SQL Server Documentation](https://docs.microsoft.com/sql/)
- **Azure SQL:** [Azure SQL Database Documentation](https://docs.microsoft.com/azure/azure-sql/)
- **Connection Strings:** [ConnectionStrings.com - SQL Server](https://www.connectionstrings.com/sql-server/)
- **Security:** [SQL Server Security Best Practices](https://docs.microsoft.com/sql/relational-databases/security/)
---
💡 **Tip:** For enterprise deployments, consider using Windows Authentication with service accounts for enhanced security and easier credential management.
---
## Sybase ASE
Section: Connectors
URL: https://docs.mindziestudio.com/mindzie_data_designer/Connectors/sybase-ase
Source: /docs-master/mindzieDataDesigner/Connectors/sybase-ase/page.md
# Sybase ASE Database Connector
**Category:** Database Connectors
## Introduction
This document is created to help setup a mindzieDataDesigner connector to Sybase ASE database. The mindzieDataDesigner is the ETL tool used by mindzieStudio to convert database tables to process mining event logs. The purpose of this document is to help creating the connection string and opening ports on the firewall if required.
## Overview
The Sybase ASE connector provides connectivity to Sybase Adaptive Server Enterprise databases. This connector supports Sybase's unique features and is optimized for enterprise environments where Sybase ASE is used for business-critical applications.
## System Requirements
- **Database System:** Sybase ASE 15.0 or later (16.0+ recommended)
- **Platform Support:** Unix, Linux, Windows
- **Dependencies:** Sybase ADO.NET Data Provider or ODBC driver
- **Network:** TCP/IP connectivity to Sybase server
## Connection String Format
### ADO.NET Provider
```
Data Source=hostname:port;Database=database_name;UID=username;PWD=password;
```
### ODBC Connection
```
Driver={Sybase ASE ODBC Driver};Server=hostname;Port=port;Database=database_name;UID=username;PWD=password;
```
## Connection Examples
### Standard Connection
```
Data Source=sybase-server:5000;Database=process_db;UID=mindzie_user;PWD=SecurePassword123;
```
### Connection with Additional Parameters
```
Data Source=sybase-prod:5000;Database=analytics;UID=sa;PWD=password;Connection Timeout=60;Command Timeout=300;
```
### Encrypted Connection
```
Data Source=sybase-server:5000;Database=secure_db;UID=user;PWD=password;Encryption=ssl;
```
## Troubleshooting
### Common Issues
**"Login failed" Error**
- Verify username and password
- Check if login account is locked or disabled
- Ensure user has permission to access the database
- Validate server name and port configuration
**"Server not found" Error**
- Check hostname and port number
- Verify network connectivity
- Ensure Sybase server is running
- Check interfaces file configuration
**"Database not accessible" Error**
- Verify database exists and is online
- Check user permissions for the database
- Ensure database is not in single-user mode
## Related Information
- **SAP Documentation:** [SAP ASE Documentation](https://help.sap.com/ase)
- **Sybase Developer Network:** Historical Sybase documentation and resources
- **Migration Guide:** [ASE Migration Documentation](https://help.sap.com/docs/SAP_ASE)
---
💡 **Tip:** When working with legacy Sybase ASE systems, coordinate with database administrators to ensure proper backup strategies and maintenance windows for your process mining activities.
---
## Teradata
Section: Connectors
URL: https://docs.mindziestudio.com/mindzie_data_designer/Connectors/teradata
Source: /docs-master/mindzieDataDesigner/Connectors/teradata/page.md
# Teradata Database Connector
**Category:** Database Connectors
## Introduction
This document is created to help setup a mindzieDataDesigner connector to Teradata database. The mindzieDataDesigner is the ETL tool used by mindzieStudio to convert database tables to process mining event logs. The purpose of this document is to help creating the connection string and opening ports on the firewall if required.
## Overview
The Teradata connector provides high-performance connectivity to Teradata systems for enterprise-scale analytics and process mining scenarios.
## System Requirements
- **Database System:** Teradata Database 16.0 or later (17.x recommended)
- **Architecture:** Massively Parallel Processing (MPP)
- **Platform Support:** Teradata systems on various platforms
- **Dependencies:** Teradata .NET Data Provider
- **Network:** Teradata Gateway or direct network connectivity
## Connection String Format
### Basic Format
```
Data Source=hostname;User ID=username;Password=password;Database=database_name;
```
### Connection Parameters
| Parameter | Description | Required | Example |
|-----------|-------------|----------|---------|
| `Data Source` | Teradata server name | Yes | `teradata.company.com` |
| `User ID` | Username | Yes | `mindzie_user` |
| `Password` | Password | Yes | `SecurePassword123` |
| `Database` | Default database | No | `ANALYTICS_DB` |
| `Connection Timeout` | Connection timeout | No | `60` |
| `Command Timeout` | Query timeout | No | `1800` |
| `Session Mode` | Session mode | No | `Teradata` |
| `Logmech` | Authentication mechanism | No | `TD2` |
## Connection Examples
### Standard Connection
```
Data Source=teradata-prod.company.com;User ID=mindzie_user;Password=SecurePassword123;Database=PROCESS_ANALYTICS;
```
### Connection with Extended Timeout
```
Data Source=teradata.company.com;User ID=analyst;Password=password;Database=DW;Connection Timeout=120;Command Timeout=3600;
```
### LDAP Authentication
```
Data Source=teradata-server;User ID=domain\username;Password=password;Database=ANALYTICS;Logmech=LDAP;
```
### Multi-Statement Connection
```
Data Source=teradata.company.com;User ID=user;Password=password;Database=DB;Session Mode=Teradata;
```
## Troubleshooting
### Common Issues
**"Login failed" Error**
- Verify username and password
- Check authentication mechanism (Logmech)
- Ensure user account is not locked
- Validate network connectivity to Teradata system
**"Database not found" Error**
- Verify database name exists
- Check user permissions for database access
- Ensure proper database qualification in queries
**"Query timeout" Error**
- Increase Command Timeout value
- Optimize query performance
- Check for resource constraints
- Monitor workload management settings
**"Connection timeout" Error**
- Increase Connection Timeout value
- Check network connectivity and latency
- Verify Teradata system availability
- Review firewall and network configuration
**mindzie Server Access:** For enhanced security, you can configure your firewall to only allow connections from mindzie servers by whitelisting specific IP addresses. Contact mindzie support to obtain the current IP addresses for the mindzie servers you are using.
## Related Information
- **Official Documentation:** [Teradata Documentation](https://docs.teradata.com/)
- **Teradata .NET Provider:** [.NET Data Provider Guide](https://docs.teradata.com/r/Teradata-.NET-Data-Provider-for-Microsoft-Windows)
- **SQL Reference:** [Teradata SQL Reference](https://docs.teradata.com/r/Teradata-VantageTM-SQL-Data-Definition-Language-Syntax-and-Examples)
- **Performance Guide:** [Teradata Performance Tuning](https://docs.teradata.com/r/Teradata-VantageTM-Database-Design)
---
💡 **Tip:** Leverage Teradata's columnar capabilities and temporal features for efficient time-based process mining analysis on large enterprise datasets.
---
## Vertica
Section: Connectors
URL: https://docs.mindziestudio.com/mindzie_data_designer/Connectors/vertica
Source: /docs-master/mindzieDataDesigner/Connectors/vertica/page.md
# Vertica Analytics Database Connector
**Category:** Database Connectors
## Introduction
This document is created to help setup a mindzieDataDesigner connector to Vertica database. The mindzieDataDesigner is the ETL tool used by mindzieStudio to convert database tables to process mining event logs. The purpose of this document is to help creating the connection string and opening ports on the firewall if required.
## Overview
The Vertica connector provides high-performance connectivity to Vertica analytical databases. Optimized for big data analytics and complex queries, this connector supports Vertica's columnar storage and massively parallel processing capabilities.
## System Requirements
- **Database System:** Vertica 9.0 or later (Vertica 11+ recommended)
- **Deployment:** On-premise, Vertica on AWS, Vertica on Azure, Vertica on Google Cloud
- **Platform Support:** Linux, Windows
- **Dependencies:** Vertica ADO.NET driver
## Connection String Format
### Basic Format
```
Server=hostname;Port=5433;Database=database_name;User=username;Password=password;
```
### Connection Parameters
| Parameter | Description | Required | Example |
|-----------|-------------|----------|---------|
| `Server` | Vertica server hostname | Yes | `vertica-cluster.company.com` |
| `Port` | Server port number | No | `5433` (default) |
| `Database` | Database name | Yes | `analytics_db` |
| `User` | Username | Yes | `mindzie_user` |
| `Password` | Password | Yes | `SecurePassword123` |
| `ConnectionTimeout` | Connection timeout | No | `60` |
| `SSL` | Enable SSL connection | No | `true` |
## Connection Examples
### Standard Connection
```
Server=vertica-node1.company.com;Port=5433;Database=process_analytics;User=mindzie_user;Password=SecurePassword123;
```
### SSL-Enabled Connection
```
Server=vertica-cluster.company.com;Port=5433;Database=analytics_db;User=analyst;Password=password;SSL=true;
```
### Cloud Connection
```
Server=vertica-aws.company.com;Port=5433;Database=cloud_analytics;User=cloud_user;Password=CloudPassword123;SSL=true;
```
**mindzie Server Access:** For enhanced security, you can configure your firewall to only allow connections from mindzie servers by whitelisting specific IP addresses. Contact mindzie support to obtain the current IP addresses for the mindzie servers you are using.
## Related Information
- **Official Documentation:** [Vertica Documentation](https://www.vertica.com/docs/)
- **Performance Guide:** [Vertica Performance Tuning](https://www.vertica.com/docs/latest/HTML/Content/Authoring/AdministratorsGuide/Tuning/TuningOverview.htm)
---
💡 **Tip:** Design your queries to take advantage of Vertica's columnar storage by selecting only necessary columns and using efficient WHERE clause predicates.
---
## AI Agents Overview
Section: AI Agents
URL: https://docs.mindziestudio.com/mindzie_data_designer/ai-agents/overview
Source: /docs-master/mindzieDataDesigner/ai-agents/overview/page.md
# AI Agents
mindzieDataDesigner includes three AI agents, each designed for a different level of experience and use case. All three agents are accessible from the toolbar at the top of the application.
## Quick Reference
| Agent | Purpose | Best For |
|-------|---------|----------|
| **DB Assistant** | Explore databases and write SQL queries | Users who want to understand their data |
| **ETL Assistant** | Build event logs with AI-driven planning and execution | Experienced users who know what they want |
| **AI Event Log Builder** | Step-by-step guided event log creation | First-time users who want guidance |
## Which Agent Should I Use?
**"I just want to look at my data"** - Use the [DB Assistant](/mindzie_data_designer/ai-agents/db-assistant). It is a general-purpose SQL assistant with no process mining knowledge. It helps you explore schemas, write queries, and understand your database.
**"I know what I want and I want the AI to build it"** - Use the [ETL Assistant](/mindzie_data_designer/ai-agents/etl-assistant). It interviews you about your goals, creates an implementation plan, and then autonomously builds the event log.
**"I'm new to this and want to be walked through it"** - Use the [AI Event Log Builder](/mindzie_data_designer/ai-agents/ai-event-log-builder). It guides you through 8 sequential steps, asking questions along the way and making sure nothing is missed.
## How to Access
All three agents are available from the toolbar at the top of mindzieDataDesigner:
1. Open a project in mindzieDataDesigner
2. Look at the toolbar icons next to Browser, Build, and Backup
3. Click **DB Assistant**, **ETL Assistant**, or **AI Event Log Builder**
Each agent opens in its own chat panel where you can interact with it using natural language.
## Shared Features
All three agents share common infrastructure:
- **Security** - An input guard screens all messages before they reach the agent, blocking prompt injection and dangerous SQL
- **Data Source Management** - All agents can list, create, test, and switch database connections
- **Schema Exploration** - All agents can browse tables, columns, relationships, and preview data
- **Query Execution** - All agents can run SQL queries against your connected database
- **Playground** - All agents can save and manage queries in the Playground folder
The ETL Assistant and AI Event Log Builder additionally share:
- **ERP Knowledge Base** - A database of known ERP table patterns for automatic system detection
- **ETL Methodology** - Shared process mining methodology for consistent event log construction
- **Validation Tools** - Script validation, event log building, and quality checks
## Agent Comparison
| Feature | DB Assistant | ETL Assistant | AI Event Log Builder |
|---------|-------------|---------------|---------------------|
| Schema exploration | Yes | Yes | Yes |
| SQL query writing | Yes | Yes | Yes |
| Data source management | Yes | Yes | Yes |
| Process mining knowledge | No | Yes | Yes |
| ERP system detection | No | Yes | Yes |
| Event log building | No | Yes | Yes |
| Script validation | No | Yes | Yes |
| Implementation planning | No | Yes | Yes |
| Guided step-by-step flow | No | No | Yes (8 gates) |
| Autonomous execution | No | Yes | Limited |
| Modify existing event logs | No | Yes | No |
| Partial tasks | Yes (SQL only) | Yes | No (must complete all steps) |
---
## DB Assistant
Section: AI Agents
URL: https://docs.mindziestudio.com/mindzie_data_designer/ai-agents/db-assistant
Source: /docs-master/mindzieDataDesigner/ai-agents/db-assistant/page.md
# DB Assistant


The DB Assistant is a general-purpose SQL assistant in mindzieDataDesigner. It helps you explore your database, write queries, and understand your data. It has no process mining knowledge -- it is purely a database tool.
## What It Can Do
- **Explore database schema** - Browse tables, columns, data types, and relationships
- **Write SQL queries** - Generate queries for reporting, analysis, and data extraction
- **Explain table relationships** - Describe how tables are connected through joins and foreign keys
- **Optimize queries** - Suggest performance improvements for slow queries
- **Find data patterns** - Search for specific tables, columns, or data characteristics
- **Debug SQL errors** - Help troubleshoot query syntax and logic issues
- **Save queries** - Store queries in the Playground folder for later use
- **Manage data sources** - Create, test, and switch database connections
## How to Access
1. Open a project in mindzieDataDesigner
2. Click **DB Assistant** in the toolbar at the top of the application
3. The assistant opens in a chat panel
## How to Interact
The DB Assistant uses free-form chat. Ask whatever you want about your database in natural language. The assistant uses tools behind the scenes to explore your schema, run queries, and return results.
## Example Prompts
### Exploring the Database
- "What tables are in this database?"
- "Show me the biggest tables by row count"
- "What columns does the orders table have?"
- "How are orders and invoices related?"
### Writing Queries
- "Write a query that shows the top 10 customers by order count"
- "Show me all orders from the last 30 days"
- "How many records have a NULL status?"
- "Join the order and payment tables and show me the result"
### Understanding Data
- "What does this table contain? Show me some sample data"
- "Are there any duplicate records in the customer table?"
- "What are the distinct values in the status column?"
- "Explain the relationship between these three tables"
### Data Source Management
- "What data sources are available?"
- "Connect to the production database"
- "Create a new data source for my SQL Server"
- "Test the connection to the staging database"
### Saving Work
- "Save this query for later"
- "Show me my saved queries"
## What It Cannot Do
The DB Assistant does not have process mining knowledge. It cannot:
- Build event logs or process mining artifacts
- Detect ERP systems or business processes
- Create case attributes or activity scripts
- Perform any ETL methodology tasks
For event log creation, use the [ETL Assistant](/mindzie_data_designer/ai-agents/etl-assistant) or the [AI Event Log Builder](/mindzie_data_designer/ai-agents/ai-event-log-builder) instead.
## Tools Available
The DB Assistant has access to the following tools:
| Tool Category | Capabilities |
|---------------|-------------|
| Schema exploration | Browse tables, view table schemas, preview data, list datetime columns |
| Query execution | Run SQL queries against the connected database |
| Table sizing | Get table sizes and row counts |
| Data source management | List, create, test, and switch data source connections |
| Playground | Save, edit, list, and delete playground scripts |
| Web search | Search the web for SQL syntax and database documentation |
---
## ETL Assistant
Section: AI Agents
URL: https://docs.mindziestudio.com/mindzie_data_designer/ai-agents/etl-assistant
Source: /docs-master/mindzieDataDesigner/ai-agents/etl-assistant/page.md
# ETL Assistant

The ETL Assistant is a two-phase ETL consultant in mindzieDataDesigner that builds complete event logs for process mining. It has deep knowledge of ERP systems, database structures, and the mindzie ETL methodology.
## How It Works
The ETL Assistant operates in two distinct phases:
### Phase 1: Planning
During the Planning phase, the assistant:
1. **Interviews you** to understand your data and goals
2. **Explores the database** to identify tables, relationships, and data patterns
3. **Detects the ERP system** (SAP, Oracle, Dynamics, NetSuite, etc.)
4. **Researches the data model** using the built-in ERP knowledge base and web search
5. **Builds an Implementation Plan** documenting the Case ID strategy, activity definitions, and script specifications
6. **Presents the plan for review** -- you approve before execution begins
### Phase 2: Execution
Once you approve the plan, the assistant:
1. **Works autonomously** to implement the approved plan
2. **Creates SQL scripts** for activities and case attributes
3. **Validates each script** to ensure correctness
4. **Builds the event log** and reports the results
5. **Reports any issues** -- if something fundamental is wrong, it explains and asks for guidance
No questions are asked during execution. The assistant works until the event log is complete.
## How to Access
1. Open a project in mindzieDataDesigner
2. Click **ETL Assistant** in the toolbar at the top of the application
3. The assistant opens in a chat panel
## How to Interact
Start by describing what you want. The assistant asks clarifying questions during Planning, then works autonomously during Execution.
## Example Prompts
### Starting a New Event Log
- "Build me an Accounts Payable event log"
- "I want to analyze our order-to-cash process"
- "Help me create a procurement event log from this SAP database"
- "Set up process mining for our service ticket workflow"
### Fully Autonomous Mode
- "You figure it out" -- this gives the assistant permission to work fully autonomously. It makes reasonable assumptions, documents them, and keeps going until the event log is built.
### Working with Existing Scripts
- "Add more activities to the existing event log"
- "Add customer name and currency as case attributes"
- "The Case ID is wrong, it should use the purchase order number instead"
- "Rebuild the event log with the updated scripts"
### Table Setup (Shortcut)
- "Set up the AP tables for Dynamics AX"
- "Configure the used tables for NetSuite order-to-cash"
### Debugging
- "Why does the event log have zero events?"
- "The validation is failing with duplicate Case IDs, can you fix it?"
- "Check why the invoice activity has no rows"
## ETL Assistant vs. AI Event Log Builder
The ETL Assistant is more flexible and powerful than the AI Event Log Builder. With the ETL Assistant you can:
- **Skip ahead** -- jump straight to what you need without going through all steps
- **Give broad instructions** -- let the AI figure out the approach
- **Modify existing event logs** -- add activities, change Case ID, adjust scripts incrementally
- **Perform partial tasks** -- "just set up the tables" or "just validate the scripts"
The trade-off is that it requires more knowledge of what you want. If you are new to process mining and want step-by-step guidance, use the [AI Event Log Builder](/mindzie_data_designer/ai-agents/ai-event-log-builder) instead.
## Tools Available
The ETL Assistant has access to everything the DB Assistant has, plus ETL-specific tools:
| Tool Category | Capabilities |
|---------------|-------------|
| Schema exploration | Browse tables, view schemas, preview data, list datetime columns |
| Query execution | Run SQL queries against the connected database |
| Table sizing | Get table sizes and row counts |
| Data source management | List, create, test, and switch connections |
| Playground | Save, edit, list, and delete scripts |
| ERP detection | Detect the source ERP system and list supported business processes |
| ERP knowledge | Discover ERP-specific tables using the built-in knowledge base |
| Script management | Create and edit activity scripts and case attribute scripts |
| Validation | Validate case attributes, activities, and review queries |
| Building | Build the event log and read build output |
| Plan management | Create implementation plans, update sections, track checklist progress |
| Web search | Research ERP data models and SQL patterns online |
---
## AI Event Log Builder
Section: AI Agents
URL: https://docs.mindziestudio.com/mindzie_data_designer/ai-agents/ai-event-log-builder
Source: /docs-master/mindzieDataDesigner/ai-agents/ai-event-log-builder/page.md
# AI Event Log Builder

The AI Event Log Builder is a guided wizard in mindzieDataDesigner that walks you through creating an event log step by step. It uses a structured approach with 8 sequential gates that must be completed in order. Each gate is a focused conversation about one topic.
## How to Access
1. Open a project in mindzieDataDesigner
2. Click **AI Event Log Builder** in the toolbar at the top of the application
3. The wizard opens in a chat panel and begins at Gate 1
## The 8 Gates
The AI Event Log Builder follows a fixed sequence of 8 gates. You must complete each gate before moving to the next.
### Gate 1: System Detection (AI-Lead)
The assistant analyzes your database tables and identifies the ERP system (SAP, Oracle, Dynamics, NetSuite, etc.). You confirm or correct the detection.
> **Assistant:** "Based on your schema, this appears to be NetSuite. I recognized tables like transaction, transactionline, and entity which are characteristic of NetSuite. Is this correct?"
>
> **You:** "Yes"
### Gate 2: Process Selection (User-Lead)
You tell the assistant which business process to analyze. The assistant validates your choice against the detected ERP system.
> **Assistant:** "What business process would you like to analyze? For NetSuite, common processes include Accounts Payable, Order-to-Cash, and Procurement."
>
> **You:** "AP"
### Gate 3: Research Phase (Autonomous)
The assistant researches the ERP system's data model using the built-in knowledge base and web search. It creates a research document summarizing the tables, columns, and relationships relevant to your selected process. No interaction is needed during this gate -- you can watch the progress.
### Gate 4: Case ID Configuration (AI-Lead)
Based on the research, the assistant recommends a Case ID strategy. You confirm or modify the recommendation.
> **Assistant:** "For Accounts Payable in NetSuite, I recommend using the transaction table with the id column, filtered to type = 'VendBill'. This captures vendor bills as individual cases. Would you like to continue with this configuration?"
>
> **You:** "Yes" or "No, I want to include vendor credits too"
### Gate 5: Activities Configuration (AI-Lead)
The assistant recommends which activities (events) to track based on the research. You confirm or modify the list.
> **Assistant:** "Here are the recommended activities: Bill Created (datecreated), Bill Approved (approvaldate), Bill Paid (closedate). Would you like to continue with these, or make changes?"
>
> **You:** "Add the due date as well"
### Gate 6: Generate Implementation Plan (AI-Lead)
The assistant summarizes everything discovered and decided so far into a formal Implementation Plan document. You review and confirm to proceed.
### Gate 7: Script Creation and Validation (AI-Lead)
The assistant creates all SQL scripts for activities and case attributes, then validates each one. You review the validation results.
### Gate 8: Event Log Validation (AI-Lead)
The assistant builds the event log and presents statistics (total events, cases, activities, date range). You confirm the results are acceptable to complete the process.
## Gate Types Explained
Each gate follows one of three interaction patterns:
| Type | Label | How It Works |
|------|-------|-------------|
| AI-Lead (Type A) | The assistant presents its analysis or recommendation | You confirm, correct, or ask for changes. The wizard does not advance without your confirmation. |
| Autonomous (Type B) | The assistant works on its own | You watch the progress. The wizard auto-advances when the work is complete. |
| User-Lead (Type C) | The assistant waits for your input | You provide the requested information. The assistant validates your answer and confirms. |
## Resume Support
The AI Event Log Builder saves progress automatically. If you close it and reopen later, it picks up where you left off. A banner shows "Resumed from previous session" with an option to start fresh if you prefer to begin again.
## How to Interact
You do not need to know SQL or process mining to use this wizard. The assistant asks questions and you answer them. Most gates require a simple confirmation ("yes, that looks right") or a short answer ("Accounts Payable").
## AI Event Log Builder vs. ETL Assistant
The AI Event Log Builder is structured and predictable. Every user goes through the same 8 steps in the same order. This makes it:
- **Better for first-time users** who do not know what questions to ask
- **More consistent** -- the same process every time
- **Easier to follow** -- you always know where you are (Step 3 of 8)
- **Self-documenting** -- it creates research and plan documents along the way
The trade-off is less flexibility. You cannot skip steps, go back to previous gates, or ask it to do partial tasks. For that flexibility, use the [ETL Assistant](/mindzie_data_designer/ai-agents/etl-assistant) instead.
## Tools Available
The AI Event Log Builder has access to the same tools as the ETL Assistant:
| Tool Category | Capabilities |
|---------------|-------------|
| Schema exploration | Browse tables, view schemas, preview data, list datetime columns |
| Query execution | Run SQL queries against the connected database |
| ERP detection | Detect the source ERP system and list supported processes |
| ERP knowledge | Discover ERP-specific tables using the built-in knowledge base |
| Script management | Create and edit activity scripts and case attribute scripts |
| Validation | Validate case attributes, activities, and review queries |
| Building | Build the event log and read build output |
| Plan management | Create implementation plans, update sections, track progress |
| Web search | Research ERP data models online |
---
## SAP Data Extraction
Section: Source System Guides
URL: https://docs.mindziestudio.com/mindzie_data_designer/source-system-guides/sap-data-extraction
Source: /docs-master/mindzieDataDesigner/source-system-guides/sap-data-extraction/page.md
# SAP Data Extraction Guide
This guide explains how to extract data from SAP ERP tables and export them to CSV files for process mining analysis with mindzie.
---
## **[CRITICAL] Use Technical Field Names, NOT Display Names**
| | |
|---|---|
| **REQUIREMENT** | When exporting SAP data, you **MUST** use the original database column names (technical field names like `EBELN`, `EBELP`, `AEDAT`), **NOT** the display names or descriptions (like "Purchasing Document", "Item", "Created On"). |
**Why this matters:**
- Display names vary by language and SAP configuration
- Technical field names are consistent across all SAP systems
- **Table joins are impossible without matching technical field names** - for example, joining EKKO (headers) to EKPO (items) requires both files to have `EBELN` as the column name
- mindzie's data transformation relies on standard SAP field names
**How to ensure technical names in SE16N:**
1. Go to **Settings** -> **Display**
2. Uncheck "Column Descriptions" or "Display Descriptions"
3. Verify your exported header row shows names like `EBELN|BUKRS|BSTYP|AEDAT` not `Purchasing Doc|Company Code|Doc Type|Created On`
| Correct Header (Technical Names) | Wrong Header (Display Names) |
|----------------------------------|------------------------------|
| `EBELN\|BUKRS\|BSTYP\|AEDAT` | `Purchasing Doc\|Company Code\|Doc Type\|Created On` |
**If you export with display names, the data cannot be processed and you will need to re-extract.**
---
## Before You Begin
### Verify Your Access
Before starting, confirm you have:
- SAP GUI installed and configured
- Valid SAP login credentials
- Read access to required tables (your IT team can verify this)
- Sufficient local disk space for exported files
- The list of tables to extract (provided by mindzie)
### Understand Your Data Requirements
Review the extraction requirements document provided by mindzie. It specifies:
- Which tables to extract (e.g., EKKO, EKPO, BKPF, BSEG)
- Required date ranges
- Any specific filters to apply
- Expected data volumes
### Plan Your Extraction
| Data Volume | Recommended Approach |
|-------------|---------------------|
| < 100,000 rows | Direct export via SE16N |
| 100,000 - 500,000 rows | Export with date filters, batch if needed |
| > 500,000 rows | Background processing or date-range batching |
---
## Transaction Codes for Data Export
SAP provides several transactions for viewing and exporting table data:
| Transaction | Name | Best For |
|-------------|------|----------|
| **SE16N** | General Table Display | Most extractions (recommended) |
| **SE16** | Data Browser | Simple single-table exports |
| **SQVI** | QuickViewer | Joining multiple tables |
| **SE37** | Function Builder | RFC_READ_TABLE (programmatic) |
**Recommendation:** Use **SE16N** for most extractions. It provides the best balance of features and ease of use.
---
## Method 1: SE16N Export (Recommended)
SE16N (General Table Display) is the preferred method for extracting SAP table data.
### Step 1: Access SE16N
1. Log into SAP GUI
2. In the command field (top left), type: `SE16N`
3. Press **Enter**
### Step 2: Enter Table Name
1. In the "Table" field, enter the table name (e.g., `EKKO`)
2. Press **Enter** or click the **Execute** button
### Step 3: Configure Display Settings (Important!)
Before executing, adjust settings for complete data extraction:
1. Go to menu: **Settings** -> **Display**
2. Set "Maximum Number of Hits" to a high value (e.g., 999999999)
3. Set "List Width" to **1023** (maximum) to capture all columns
Alternatively, use the **Settings** button on the toolbar.
**Critical Setting:**
```
Maximum Number of Hits: 999999999
List Width: 1023
```
### Step 4: Select Fields to Display
1. Click the **Fields** button or go to **Edit** -> **Fields**
2. Select all fields you need (or click **Select All** for complete extraction)
3. Confirm with **Enter**
**Tip:** For process mining, select ALL fields unless specifically instructed otherwise. mindzie will filter what's needed.
### Step 5: Apply Filters (If Required)
If your extraction requires date filters:
1. Find the date field (e.g., AEDAT, ERDAT, BUDAT)
2. Enter the date range in format: `YYYYMMDD`
```
Example filter for 2023-2024 data:
AEDAT: [20230101] to [20241231]
```
### Step 6: Execute the Query
1. Press **F8** or click the **Execute** button
2. Wait for results to display (may take time for large tables)
### Step 7: Export to Spreadsheet/CSV
**Option A: Using the Export Icon**
1. Look for the **Download** icon (arrow pointing down into a tray) in the toolbar
2. Click it to open export options
3. Select **Spreadsheet**
**Option B: Using Keyboard Shortcut**
1. Press **Shift + F8** or **Ctrl + Shift + F7**
2. Select **Spreadsheet** option
**Option C: Using Menu**
1. Go to: **List** -> **Export** -> **Spreadsheet**
2. Or: **System** -> **List** -> **Save** -> **Local File**
### Step 8: Choose Export Format
When the format dialog appears:
| Format | Extension | When to Use |
|--------|-----------|-------------|
| **Text with Tabs** | .txt | Best for large datasets - recommended for mindzie |
| **Spreadsheet (XLSX)** | .xlsx | Smaller datasets, Excel compatibility |
| **Unconverted** | .txt | Raw data, preserves all formatting |
**For mindzie: Select "Text with Tabs" or "Unconverted"**
### Step 9: Save the File
1. Choose a save location on your local drive
2. Use naming convention: `TableName_YYYYMMDD.txt`
- Example: `EKKO_20240315.txt`
3. Click **Save**
### Step 10: Verify the Export
1. Open the file in a text editor (Notepad++, VS Code - NOT Excel)
2. Verify:
- Header row is present
- Data rows look complete
- No truncated columns
- Record count matches expected
---
## Method 2: SE16 Export (Alternative)
SE16 (Data Browser) is simpler but has more limitations.
### Step-by-Step Process
1. Enter transaction: `SE16`
2. Enter table name and press **Enter**
3. Set selection criteria (date ranges, filters)
4. **Important:** Change "Width of Output List" to `1023`
5. Click **Execute (F8)**
6. Export via: **Edit** -> **Download** -> **Spreadsheet**
### SE16 Limitations
- Maximum 1024 characters width (may truncate wide tables)
- Lower row limits than SE16N
- Can cause system performance issues with large tables
---
## Method 3: SQVI Quick View (For Complex Queries)
Use SQVI when you need to join multiple tables or create custom queries.
### When to Use SQVI
- Joining master data with transaction data
- Creating custom field selections
- Applying complex filter logic
### Basic SQVI Process
1. Enter transaction: `SQVI`
2. Create a new QuickView
3. Select base table and join tables
4. Define fields and filters
5. Execute and export results
**Note:** SQVI requires additional SAP knowledge. Contact your SAP Basis team or mindzie support if you need assistance with complex queries.
---
## Export Format Options
### Available Formats in SAP
| Format | Description | Pros | Cons |
|--------|-------------|------|------|
| **Unconverted** | Raw text, pipe-delimited | Fastest, preserves all data | Requires conversion |
| **Text with Tabs** | Tab-separated values | Good for large files | Tab handling in Excel |
| **Spreadsheet** | Excel format (XLS/XLSX) | Opens directly in Excel | Row limits, formatting issues |
| **Rich Text** | RTF format | Preserves formatting | Very slow, large files |
| **HTML** | Web format | Browser viewable | Not suitable for analysis |
### Recommended Format for mindzie
**Primary Choice:** Text with Tabs (.txt)
- Works for all data sizes
- No row limitations
- Preserves data integrity
**Alternative:** Unconverted (.txt)
- Best for very large datasets
- Uses pipe (|) delimiter
- Requires specifying delimiter when opening
### Converting Tab-Delimited to CSV
If you need true CSV format:
1. Open the .txt file in Excel:
- File -> Open -> Select the .txt file
- Choose "Delimited" in the wizard
- Select "Tab" as delimiter
- Complete the wizard
2. Save as CSV:
- File -> Save As
- Choose "CSV (Comma delimited)"
- Use UTF-8 encoding if available
**Or use a text editor** to find/replace tabs with commas.
---
## Handling Large Datasets
### Signs You Have a Large Dataset
- Query takes more than 5 minutes
- SAP displays "Maximum hits reached" warning
- Export fails or times out
- File size exceeds 500MB
### Strategy 1: Date Range Batching
Split the extraction by date ranges:
```
Batch 1: AEDAT 20230101 to 20230630 -> EKKO_2023H1.txt
Batch 2: AEDAT 20230701 to 20231231 -> EKKO_2023H2.txt
Batch 3: AEDAT 20240101 to 20240630 -> EKKO_2024H1.txt
```
Then combine files (keeping only one header row).
### Strategy 2: Background Processing (SE16)
For very large tables:
1. In SE16, enter selection criteria
2. Go to: **Program** -> **Execute in Background** (or press F9)
3. In Background Print dialog:
- Uncheck "Print Immediately"
- Uncheck "Delete After Output"
4. Save the job as "Immediate"
5. Monitor in transaction **SM37**
6. Once complete, access spool and save to local file:
- **System** -> **List** -> **Save** -> **Local File**
### Strategy 3: Field Reduction
If you don't need all columns:
1. Only select required fields instead of "Select All"
2. Focus on fields specified in the extraction requirements
3. This reduces file size and export time
### Strategy 4: Company Code / Plant Filtering
If applicable, filter by organizational units:
```
BUKRS (Company Code): [1000]
WERKS (Plant): [P001]
```
Export each unit separately and combine.
---
## CSV Format Requirements for mindzie
### File Specifications
| Requirement | Value |
|-------------|-------|
| **Encoding** | UTF-8 |
| **Delimiter** | Comma (,) or Tab or Pipe (\|) |
| **Text Qualifier** | Double quotes (") |
| **Header Row** | Required - first row |
| **Date Format** | YYYYMMDD or YYYY-MM-DD |
| **Time Format** | HHMMSS or HH:MM:SS |
### File Naming Convention
```
TableName_YYYYMMDD.csv
```
Examples:
- `EKKO_20240315.csv`
- `BKPF_20240315.csv`
- `CDPOS_20240315.csv`
### Handling Special Characters
SAP may export special characters that need attention:
| Character | Issue | Solution |
|-----------|-------|----------|
| Commas in text | Breaks CSV structure | Ensure text is quoted |
| Line breaks | Creates false rows | Replace with spaces |
| German umlauts | Encoding issues | Use UTF-8 encoding |
| Currency symbols | Display issues | Keep as-is, mindzie handles |
---
## Common Issues and Solutions
### Issue: "Maximum Number of Entries Reached"
**Cause:** Default row limit hit
**Solution:**
1. Go to Settings -> User Parameters
2. Increase "Maximum number of hits"
3. Or apply date filters to reduce data
### Issue: Columns Are Truncated
**Cause:** List width too narrow
**Solution:**
1. Before executing, set "Width of Output List" to 1023
2. Or use SE16N instead of SE16
### Issue: Export Takes Too Long / Times Out
**Cause:** Too much data for online processing
**Solution:**
1. Use background processing (Strategy 2 above)
2. Split by date ranges
3. Filter by organizational units
### Issue: File Opens Incorrectly in Excel
**Cause:** Excel auto-formatting
**Solution:**
1. Don't double-click to open
2. Use File -> Open -> Text Import Wizard
3. Specify correct delimiter
4. Set date columns as "Text" to preserve format
### Issue: Missing Time Fields in CDPOS/CDHDR
**Cause:** UTIME field not extracted
**Solution:**
1. Ensure UTIME is in selected fields
2. Verify it's populated in source table
3. Contact SAP Basis if field is empty
### Issue: Error "No Authorization"
**Cause:** Missing table read permissions
**Solution:**
1. Contact your SAP Security team
2. Request read access to specific tables
3. Provide the table list from extraction requirements
### Issue: Special Characters Display as "?"
**Cause:** Character encoding mismatch
**Solution:**
1. Export as "Unconverted" format
2. Open with UTF-8 encoding
3. Verify SAP GUI code page settings
---
## Validation Checklist
Before sending files to mindzie, verify:
### File Structure
- Header row present with column names
- Consistent delimiter throughout file
- No blank rows in middle of data
- File opens correctly in text editor
### Data Completeness
- All required columns are present
- Date/time fields are populated (not empty)
- Row count matches expected volume
- Date range covers required period
### Format Compliance
- File encoding is UTF-8
- Date format is consistent (YYYYMMDD)
- No truncated columns
- Special characters preserved correctly
### File Delivery
- File naming follows convention
- Files compressed if over 50MB
- Secure transfer method used
- Extraction date documented
---
## Quick Reference
### SE16N Export - Quick Steps
```
1. Transaction: SE16N
2. Enter table name
3. Set Max Hits: 999999999
4. Set List Width: 1023
5. Select fields (or Select All)
6. Apply date filters if needed
7. Execute (F8)
8. Export: Shift+F8 -> Spreadsheet -> Text with Tabs
9. Save as: TableName_YYYYMMDD.txt
```
### Keyboard Shortcuts
| Shortcut | Action |
|----------|--------|
| F8 | Execute query |
| Shift + F8 | Export to spreadsheet |
| Ctrl + Shift + F7 | Export (alternative) |
| Ctrl + Y | Select mode for copy |
| Ctrl + C | Copy selected data |
### Common Table Names
| Table | Description | Typical Size |
|-------|-------------|--------------|
| EKKO | Purchase Order Headers | Medium |
| EKPO | Purchase Order Items | Large |
| EBAN | Purchase Requisitions | Medium |
| BKPF | Accounting Doc Headers | Large |
| BSEG | Accounting Doc Items | Very Large |
| CDHDR | Change Doc Headers | Large |
| CDPOS | Change Doc Items | Very Large |
| LFA1 | Vendor Master | Small |
| MARA | Material Master | Medium |
---
## Sample Extraction Workflow
### Example: Extracting EKKO (Purchase Order Headers)
**Objective:** Extract 2 years of purchase order headers
**Steps:**
1. **Login** to SAP GUI
2. **Open SE16N**
- Type SE16N in command field, press Enter
3. **Enter Table**
- Table: EKKO
- Press Enter
4. **Configure Settings**
- Settings -> Display
- Max Hits: 999999999
- List Width: 1023
5. **Set Date Filter**
- Field: AEDAT (Creation Date)
- From: 20230101
- To: 20241231
6. **Select Fields**
- Click "Fields" button
- Click "Select All"
- Confirm
7. **Execute**
- Press F8
- Wait for results (may take 1-5 minutes)
8. **Verify Results**
- Check row count in status bar
- Scroll to verify all columns visible
9. **Export**
- Press Shift + F8
- Select "Spreadsheet"
- Choose "Text with Tabs"
- Save as: EKKO_20240315.txt
10. **Validate**
- Open in Notepad++
- Verify header row
- Check first/last rows
- Confirm no truncation
---
## Support
If you encounter issues not covered in this guide:
1. Note the exact error message
2. Record which table and transaction you're using
3. Document the steps you followed
4. Contact mindzie support with this information
### Helpful Resources
**SAP Community Articles:**
- [SAP SE16 Download Formats & Options](https://www.dab-europe.com/en/articles/formats-for-download-from-sap-se16/)
- [SAP How To Export To Excel](https://www.newsaperp.com/en/blog-sapgui-sap-how-to-export-to-excel)
- [SE16N Data Export Discussion](https://community.sap.com/t5/enterprise-resource-planning-q-a/sap-export-to-csv/qaq-p/12374292)
---
## NetSuite Setup Guide
Section: Source System Guides
URL: https://docs.mindziestudio.com/mindzie_data_designer/source-system-guides/netsuite-setup-guide
Source: /docs-master/mindzieDataDesigner/source-system-guides/netsuite-setup-guide/page.md
# mindzie NetSuite Setup Guide for Administrators
## Overview
This guide walks a NetSuite administrator through the configuration required to give mindzie programmatic, read-only access to your NetSuite account so that mindzie can extract data for AI-driven process mining and analytics.
The setup uses NetSuite's standard **Token Based Authentication (TBA)** mechanism. No passwords are shared. mindzie receives a dedicated set of tokens that you create, scope, and can revoke at any time.
The whole process typically takes 15-30 minutes for an administrator who already has the required NetSuite permissions.
---
## What mindzie Will Be Able to Do
The role you create for mindzie is **read-only across the entire account**. mindzie cannot create, update, or delete any records in NetSuite.
The role unlocks four programmatic access channels, all using the same token credentials:
| Channel | Purpose |
|---|---|
| REST Web Services | Record-level reads and SuiteQL queries over HTTPS |
| SuiteAnalytics Connect | ODBC/JDBC bulk extracts for historical data loads |
| SuiteAnalytics Connect - Read All | Cross-subsidiary read for consolidated analytics |
| SuiteScript / RESTlets | Calling custom endpoints if your team builds any |
Authentication uses **OAuth 1.0a TBA** (the NetSuite-recommended pattern for server-to-server integrations). Basic auth and password-based access are not used.
---
## Prerequisites
Before you start, confirm:
- You have a NetSuite role with **Administrator** or equivalent permissions to create roles, users, integration records, and access tokens.
- The **SuiteCloud** features required below are licensed on your account (Token Based Authentication, REST Web Services, SuiteAnalytics Connect). If any are missing, contact your NetSuite account manager before continuing.
- You know your NetSuite **Account ID** (visible in the URL when you log in, e.g. `1234567` or `1234567_SB1` for sandbox).
---
## Configuration Steps
Complete all five steps in order. Steps 1 and 2 only need to be done once per NetSuite account; if TBA and Integration features are already enabled, you can skip Step 1.
### Step 1: Enable Required Features
1. Go to **Setup -> Company -> Enable Features**.
2. Open the **SuiteCloud** tab.
3. Confirm the following are enabled (check the box and save if not):
- **Token-Based Authentication**
- **REST Web Services**
- **SuiteAnalytics Workbook**
- **SuiteAnalytics Connect** (under SuiteAnalytics)
- **Client SuiteScript** and **Server SuiteScript**
4. Accept the SuiteCloud terms of service if prompted.
5. Click **Save**.
### Step 2: Create the Integration Record
The integration record represents the mindzie application connecting to your NetSuite account. It produces the **Consumer Key** and **Consumer Secret**.
1. Go to **Setup -> Integration -> Manage Integrations -> New**.
2. Fill in:
- **Name:** `mindzie Studio`
- **State:** `Enabled`
- **Description:** `mindzie process mining integration - read only`
3. Under **Authentication**:
- Check **Token-Based Authentication**.
- Uncheck **TBA: Authorization Flow** (not needed for server-to-server).
- Uncheck **Authorization Code Grant** (OAuth 2.0, not used here).
4. Click **Save**.
5. **Important:** NetSuite will display the **Consumer Key / Client ID** and **Consumer Secret / Client Secret** at the bottom of the screen **only once**. Copy both values immediately into a secure password manager. If you lose them you must reset and regenerate.
### Step 3: Create the mindzie Role
This role is what controls what mindzie can see. It is read-only.
1. Go to **Setup -> Users/Roles -> Manage Roles -> New**.
2. Configure the **General** section:
- **Name:** `mindzie Studio Role`
- **ID:** `_mindzie_studio_role` (or leave blank to auto-assign)
- **Center Type:** `Classic Center`
- Check **Web Services Only Role**
- Check **Core Administration Permissions**
3. Under the **Permissions** subtab, configure each section:
**Transactions, Lists, Custom Record:** Set every permission to **View** (read-only).
**Reports:** Add **SuiteAnalytics Workbook** with level **View**.
**Setup:** Add the following with level **Full** unless noted:
- `Log in using Access Tokens` -- Full
- `REST Web Services` -- Full
- `SuiteAnalytics Connect` -- Full
- `SuiteAnalytics Connect - Read All` -- Full
- `SuiteScript` -- Full
- `User Access Tokens` -- Full
4. Under **Subsidiary Restrictions** (OneWorld accounts only): select **All** subsidiaries unless your security policy dictates otherwise.
5. Click **Save**.
### Step 4: Create the mindzie User
A dedicated employee record holds the role assignment. mindzie never logs in interactively as this user; the user exists only to anchor the access token.
1. Go to **Lists -> Employees -> Employees -> New**.
2. Fill in minimum required fields:
- **Name:** `mindzie API User`
- **Email:** an email address your team controls (NetSuite requires one; mindzie does not need access to the inbox).
- **Subsidiary:** primary subsidiary (OneWorld accounts only).
3. Open the **Access** subtab:
- Check **Give Access**.
- Leave **Send New Access Notification Email** unchecked.
- Under **Roles**, add `mindzie Studio Role`.
4. Click **Save**.
### Step 5: Generate the Access Token
This step links the integration, user, and role together and produces the **Token ID** and **Token Secret**.
1. Go to **Setup -> Users/Roles -> Access Tokens -> New**.
2. Fill in:
- **Application Name:** `mindzie Studio` (the integration from Step 2)
- **User:** `mindzie API User` (from Step 4)
- **Role:** `mindzie Studio Role` (from Step 3)
- **Token Name:** `mindzie Studio Token` (or leave default)
3. Click **Save**.
4. **Important:** NetSuite will display the **Token ID** and **Token Secret** **only once**. Copy both values immediately into your secure password manager.
---
## What to Send to mindzie
After completing the steps above, send mindzie the following five values. All five are required; mindzie cannot connect with any of them missing.
| # | Item | Where it came from | Example format |
|---|---|---|---|
| 1 | **Account ID** | Your NetSuite URL | `1234567` or `1234567_SB1` |
| 2 | **Consumer Key / Client ID** | Step 2 (Integration Record) | 64-character hex string |
| 3 | **Consumer Secret / Client Secret** | Step 2 (Integration Record) | 64-character hex string |
| 4 | **Token ID** | Step 5 (Access Token) | 64-character hex string |
| 5 | **Token Secret** | Step 5 (Access Token) | 64-character hex string |
Also helpful, but not strictly required:
- **NetSuite environment:** Production, Sandbox, or Release Preview
- **Primary subsidiary** (OneWorld accounts) and currency
- **Date range** of historical data you want extracted in the first load
- **Time zone** of the NetSuite account
---
## How to Send It Securely
These four secrets together grant read access to your entire NetSuite account. Treat them like a production database password.
**Do not** send them by:
- Plaintext email
- Slack, Teams, or other chat tools without an expiring secret feature
- Shared network drives or unencrypted file shares
- Screenshots in tickets or wikis
**Do** send them by one of:
- A one-time secret link service (e.g. 1Password "Share", Bitwarden Send, Doppler share, or your corporate equivalent) with an expiry of 24 hours or less.
- An encrypted message through your IT-approved channel.
- A scheduled call where you read them while mindzie's engineer enters them directly into the connector.
If you need a delivery method, ask your mindzie contact and we will send you a one-time secret link to upload the values into.
---
## What Happens Next
Once mindzie receives the credentials:
1. We enter them into the mindzie Studio NetSuite connector.
2. We run a connection test (a single read against your account metadata).
3. We confirm with you in writing that the connection is healthy.
4. We schedule the first historical data extract with you.
The first extract is read-heavy; we coordinate timing with your team so it does not collide with month-end close or other peak load periods.
---
## Verifying the Setup Yourself
Before sending credentials, you can confirm the role works by signing in to NetSuite as the `mindzie API User`, switching to the `mindzie Studio Role`, and confirming you can:
- Open the **SuiteAnalytics Workbook** menu without an access denied error.
- View (but not edit) any transaction or list record.
You will not be able to do much else interactively, which is expected -- this role is built for API access, not for human use.
---
## Revoking Access
If you ever need to cut mindzie's access:
- **Fastest:** Go to **Setup -> Users/Roles -> Access Tokens**, find the mindzie token, and click **Revoke**. This kills the connection immediately.
- **More thorough:** Also disable the integration record (Step 2) and inactivate the `mindzie API User` employee record.
After revocation, notify mindzie support so we can clean up our side and acknowledge the change.
---
## Need Help?
Contact mindzie support at **support@mindzie.com** with:
- Your NetSuite Account ID (do **not** include the secrets in the email)
- The step number you are stuck on
- The exact error message NetSuite is showing
We can join a screen-share with your administrator to walk through any step that is not behaving as documented.
# Product: mindzieBpmStudio
---
## Overview
Section: Getting Started
URL: https://docs.mindziestudio.com/mindzie_bpm_studio/getting-started/overview
Source: /docs-master/mindzieBpmStudio/getting-started/overview/page.md
# BPM Studio Overview
BPM Studio is the mindzie workspace for modeling business processes with the BPMN 2.0 standard. You draw processes on an interactive canvas - or let AI draft them from a picture or a procedure document - then organize the diagrams into projects and share them with your team.
> BPM Studio is currently released as a **Beta** module.
## What You Can Do
- **Model processes in BPMN 2.0** - Draw events, tasks, gateways, pools, and lanes on a full-featured canvas with drag-and-drop editing, auto layout, and undo/redo.
- **Generate diagrams with AI** - Upload a photo or screenshot of a flow, or a procedure document (PDF, Word, or text), and receive a ready-made BPMN diagram you can refine by hand. You can also start an AI job from a chat description.
- **Organize work in projects** - Group related diagrams into projects, search them, and control access by assigning users to each project.
- **Keep every version** - Each save creates a numbered version of the diagram, so your work is never overwritten silently.
- **Export and share** - Export any diagram as PNG, SVG, PDF, or Visio (VSDX).
- **Work in your language** - The interface is available in eight languages: English, German, French, Spanish, Dutch, Turkish, Japanese, and Danish.
## Where BPM Studio Fits
BPM Studio is one of the mindzie platform modules, alongside Process Intelligence (process mining and task mining) and Data Designer (event log construction). All modules share the same sign-in, tenants, and projects, and you switch between them from the module selector that appears after you sign in.

## Next Steps
1. [Opening BPM Studio](/mindzie_bpm_studio/getting-started/opening-bpm-studio) - sign in and find the module.
2. [Creating Your First Diagram](/mindzie_bpm_studio/getting-started/creating-your-first-diagram) - a five-minute quickstart.
3. [Editor Overview](/mindzie_bpm_studio/editor/overview) - learn the editor screen.
---
## Opening BPM Studio
Section: Getting Started
URL: https://docs.mindziestudio.com/mindzie_bpm_studio/getting-started/opening-bpm-studio
Source: /docs-master/mindzieBpmStudio/getting-started/opening-bpm-studio/page.md
# Opening BPM Studio
BPM Studio is opened from the mindzie module selector - the screen you land on after signing in and choosing a tenant.
## Steps
1. Sign in to mindzieStudio with your email and password.
2. If you belong to more than one tenant, select the tenant you want to work in.
3. On the welcome screen, find the **BPM Studio (Beta)** card and click **Open**.

You land on the BPM Studio **Projects** page, ready to create or open a project.
## Permissions
Opening BPM Studio requires the **Analyst** role or higher in the tenant. If your role does not allow access, the card shows a message explaining that you need additional permissions - contact your tenant administrator.
## Finding Your Way Around
Once inside BPM Studio you'll see:
- **Left navigation** - Projects, Diagrams, AI Jobs, and Editor. Diagrams, AI Jobs, and Editor become active once you open a project.
- **Header** - a home button that returns you to the module selector, a breadcrumb showing where you are, the language switcher, and your user name.
- **Help & docs** - opens this documentation site in a new tab.
## Picking Up Where You Left Off
The module selector's "Pick up where you left off" panel lists the projects you opened recently, including BPM Studio projects - click one to jump straight back into it.
---
## Creating Your First Diagram
Section: Getting Started
URL: https://docs.mindziestudio.com/mindzie_bpm_studio/getting-started/creating-your-first-diagram
Source: /docs-master/mindzieBpmStudio/getting-started/creating-your-first-diagram/page.md
# Creating Your First Diagram
This quickstart takes you from an empty workspace to a saved BPMN diagram.
## 1. Create a Project
Diagrams live inside projects, so the first step is creating one.
1. Open BPM Studio. You land on the **Projects** page.
2. Under **How do you want to start?**, click **Start from scratch**. (You can also click **New project**, which offers the same choices.)
3. Enter a name for the project - for example, "Order Handling" - and an optional description.
4. Click **Create**.

The project opens on its **Diagrams** page, which is empty for now.
> Prefer to let AI draw the first version for you? Choose **Generate from a picture** or **Start from an SOP** instead - see [Creating Diagrams with AI](/mindzie_bpm_studio/ai/creating-diagrams-with-ai).
## 2. Create a Diagram
1. Click **New diagram**.
2. Enter a name (up to 200 characters) and an optional description (up to 1000 characters).
3. Click **Create**.
The editor opens with a blank canvas containing a single start event.

## 3. Draw the Process
1. Drag a **Task** from the palette on the left onto the canvas.
2. Click the start event to select it, then use the **+** quick-connect button that appears next to it to draw a connection to your task.
3. Add more tasks, a gateway, and an end event the same way.
4. Click any element and type to give it a name.
5. Click **Auto layout** in the toolbar at any time to tidy the whole diagram in one click (undo with Ctrl+Z if you preferred your own arrangement).
For the full set of editing techniques, see [Editing Basics](/mindzie_bpm_studio/editor/editing-basics).
## 4. Save
**Auto save** is on by default - the diagram saves itself a moment after you stop editing, and the toolbar shows the result ("Saved v2 at 09:14"). You can also click **Save draft** to save immediately.
Every save creates a new numbered version - you can see the current version next to the diagram title. See [Saving and Versions](/mindzie_bpm_studio/editor/saving-and-versions).
## 5. Find It Again
Click **Diagrams** in the left navigation to return to the project's diagram list. Your diagram is there with its version number and last-modified time. Click its name to open it again.
---
## Working with Projects
Section: Projects and Diagrams
URL: https://docs.mindziestudio.com/mindzie_bpm_studio/projects/working-with-projects
Source: /docs-master/mindzieBpmStudio/projects/working-with-projects/page.md
# Working with Projects
Projects are the containers for your BPMN diagrams. Every diagram belongs to exactly one project, and access to a diagram is controlled by who is assigned to its project.

## The Projects Page
The Projects page lists every project you have access to, with the number of diagrams in each and when it was last modified. Use the **Search projects** box to filter the list by name.
## Creating a Project
Click **New project** (or use one of the start cards at the top of the page) and choose how to begin:
| Option | What happens |
|--------|--------------|
| **Start from scratch** | Enter a name and optional description; an empty project is created and opened on its Diagrams page. |
| **Generate from a picture** | A wizard creates the project and an AI job that builds the first diagram from a photo or screenshot of a flow. |
| **Start from an SOP** | A wizard creates the project and an AI job that builds the first diagram from your procedure documents (PDF, Word, or text). |
The AI options are described in [Creating Diagrams with AI](/mindzie_bpm_studio/ai/creating-diagrams-with-ai). They appear only when AI agents are enabled for your tenant.
## Sharing a Project: Assign Users
On projects you own, the project row shows an **assign users** action (the person icon). It opens a dialog showing:
- **Project members** - everyone who currently has access, with their role (the project creator is the **Owner**).
- **Add a user** - other users in your tenant, each with an **Assign** button.

Only assigned users see the project and its diagrams.
## Renaming a Project
Click the **edit** action (pencil icon) on the project row. You can change the name (up to 200 characters) and the description, then click **Save**.
## Deleting a Project
Click the **delete** action (trash icon) on the project row and confirm. Deleting a project removes its diagrams as well, so make sure nothing in it is still needed - there is no undo.
> The assign users, edit, and delete actions appear only on projects you own. On projects shared with you, you can open the project and work with its diagrams, but not change the project itself.
## Opening a Project
Click the project name. You land on the project's **Diagrams** page, and the left navigation's **Diagrams**, **AI Jobs**, and **Editor** entries become active for that project.
---
## Managing Diagrams
Section: Projects and Diagrams
URL: https://docs.mindziestudio.com/mindzie_bpm_studio/projects/managing-diagrams
Source: /docs-master/mindzieBpmStudio/projects/managing-diagrams/page.md
# Managing Diagrams
Each project has a **Diagrams** page listing the BPMN diagrams it contains. Open it by clicking a project on the Projects page, or via **Diagrams** in the left navigation while a project is open.

## The Diagram List
For every diagram you see:
| Column | Meaning |
|--------|---------|
| **Name** | The diagram's name and optional description. Click to open it in the editor. |
| **State** | The diagram's state. In this release every diagram is a **Draft**. |
| **Version** | The current version number (v1, v2, ...). A new version is created on every save. |
| **Last modified** | When the diagram was last saved, as a relative time. |
## Creating a Diagram
1. Click **New diagram**.
2. Enter a **Name** (required, up to 200 characters) and an optional **Description** (up to 1000 characters).
3. Click **Create**.

The diagram is created as version 1 and opens in the editor.
## Renaming a Diagram
Renaming happens in the editor: open the diagram and click its title in the editor's title bar to edit it in place. See [Editor Overview](/mindzie_bpm_studio/editor/overview).
## Deleting a Diagram
Click the **delete** action (trash icon) on the diagram's row and confirm. You can also delete the open diagram from inside the editor with the **Delete** toolbar button. Deletion cannot be undone.
## Versions
Every save - manual or auto save - writes a new numbered version. The list always shows the latest version number; opening the diagram opens that latest version. See [Saving and Versions](/mindzie_bpm_studio/editor/saving-and-versions).
---
## Editor Overview
Section: Diagram Editor
URL: https://docs.mindziestudio.com/mindzie_bpm_studio/editor/overview
Source: /docs-master/mindzieBpmStudio/editor/overview/page.md
# Editor Overview
The editor is where you draw and refine BPMN diagrams. It opens when you create a diagram or click one in the Diagrams list.

## The Editor Screen
| Area | What it does |
|------|--------------|
| **Tab strip** (top) | Each open diagram gets its own tab. Switch tabs freely - unsaved edits in other tabs are kept. Close a tab with its **x**. |
| **Title bar** | The diagram name (click it to rename in place), the current version (v1, v2, ...), an asterisk when there are unsaved changes, and the save status ("Saved v4 at 07:14"). |
| **Toolbar** | Zoom out / **Fit** / zoom in, **Auto layout**, export buttons (**PNG**, **SVG**, **PDF**, **VSDX**), **Delete**, the **Auto save** toggle, and **Save draft**. |
| **Palette** (left) | The BPMN shapes you drag onto the canvas. Click the arrow at the top of the palette to switch between the narrow icon view and the wide labeled view. |
| **Canvas** (center) | The diagram itself. Drag shapes from the palette, click to select, drag to move. |
| **Properties panel** (right) | Shows the selected element's type, ID, and name. Collapsible. |
## Working with Tabs
Open several diagrams at once - each gets a tab, and edits in progress survive switching between them. If you navigate to **Editor** in the left navigation with no diagram open, you get a welcome screen with your recent diagrams.
There is an upper limit on simultaneous tabs; if you reach it, close some tabs before opening another diagram.
## Renaming a Diagram
Click the diagram title in the title bar, type the new name, and press Enter (or click elsewhere) to confirm. Press Escape to cancel.
## Zoom and Layout
- **-** / **+** zoom out and in; **Fit** zooms so the whole diagram is visible.
- **Auto layout** rearranges the entire diagram into a tidy layout in one click. If you preferred your arrangement, press Ctrl+Z to undo it.
## Deleting the Open Diagram
The **Delete** toolbar button deletes the diagram you are looking at, after a confirmation dialog. This is the same operation as deleting from the Diagrams list, and it cannot be undone.
## Next
- [BPMN Elements](/mindzie_bpm_studio/editor/bpmn-elements) - what every palette shape means.
- [Editing Basics](/mindzie_bpm_studio/editor/editing-basics) - selecting, connecting, and arranging elements.
- [Saving and Versions](/mindzie_bpm_studio/editor/saving-and-versions) - how saving works.
- [Exporting Diagrams](/mindzie_bpm_studio/editor/exporting-diagrams) - PNG, SVG, PDF, and Visio export.
---
## BPMN Elements
Section: Diagram Editor
URL: https://docs.mindziestudio.com/mindzie_bpm_studio/editor/bpmn-elements
Source: /docs-master/mindzieBpmStudio/editor/bpmn-elements/page.md
# BPMN Elements
The palette on the left side of the editor contains the BPMN 2.0 shapes you can add to a diagram. Click the arrow at the top of the palette to switch between the narrow icon view and the wide labeled view; items with a small arrow open a flyout with more specific variants.

## Events
Events mark things that happen during a process.
| Element | Use it for |
|---------|------------|
| **Start event** | Where the process begins. |
| **Intermediate event** | Something that happens mid-process. Choose between the **throw** variant (the process produces the event) and the **catch** variant (the process waits for it). |
| **End event** | Where a path of the process finishes. |
## Tasks
Tasks are the work steps of the process. The Task flyout offers the standard BPMN 2.0 task types:
| Element | Use it for |
|---------|------------|
| **Task** | A generic unit of work. |
| **User task** | Work a person performs in an application. |
| **Service task** | Work performed automatically by a system. |
| **Send task** | Sending a message to an outside participant. |
| **Receive task** | Waiting for a message from an outside participant. |
| **Manual task** | Work done outside any system. |
| **Business rule task** | Evaluating a business rule or decision. |
| **Script task** | An automated script step. |
| **Call activity** | Invoking another, separately defined process. |
## Gateways
Gateways split and join the flow.
| Element | Use it for |
|---------|------------|
| **Exclusive gateway** | Exactly one outgoing path is taken. |
| **Parallel gateway** | All outgoing paths run at the same time. |
| **Inclusive gateway** | One or more outgoing paths are taken. |
| **Event-based gateway** | The path is decided by whichever event happens first. |
| **Complex gateway** | A branching condition that doesn't fit the other types. |
## Containers and Data
| Element | Use it for |
|---------|------------|
| **Sub-process** | A group of steps that form a process of their own. |
| **Pool** | A participant in the process (a company, department, or system). Add lanes inside a pool to show roles. |
| **Data object** | Information a step reads or produces. |
| **Data store** | A place where data is kept beyond the life of the process. |
| **Text annotation** | A free-text note attached to the diagram. |
## Hints on Problem Elements
While you edit, elements with potential problems - for example a task with no connections yet - show a small yellow marker. Use the markers as a checklist while you complete the diagram.
---
## Editing Basics
Section: Diagram Editor
URL: https://docs.mindziestudio.com/mindzie_bpm_studio/editor/editing-basics
Source: /docs-master/mindzieBpmStudio/editor/editing-basics/page.md
# Editing Basics
Everything on the canvas is edited directly: drag shapes in, click to select, and use the controls that appear around the selection.
## Adding Elements
Drag a shape from the palette onto the canvas and drop it where you want it. For element types grouped in a flyout (tasks, gateways, intermediate events, data), hover the group to open the flyout and drag the specific variant.
## Selecting
Click an element to select it. A selected element shows:
- A **quick-connect (+)** button - click it to draw a connection to another element, or to create and connect a new element in one step.
- A small popup where you can type the element's **name** and, for events, choose the event subtype.
- Its details in the **properties panel** on the right (type, ID, name).

Click empty canvas to clear the selection.
## Connecting Elements
Use the quick-connect **+** on a selected element and click the target element. The connection is routed automatically and re-routes itself when you move elements around.
## Moving and Arranging
- Drag an element to move it; connections follow.
- Click **Auto layout** in the toolbar to rearrange the whole diagram automatically.
- Use **-** / **Fit** / **+** to zoom; **Fit** shows the entire diagram.
## Naming Elements
Select an element and type its name into the popup that appears, or into the **Name** field of the properties panel. Clear, action-oriented names ("Approve invoice", "Check credit") keep the diagram readable.
## Undo and Redo
- **Ctrl+Z** undoes the last change - including an Auto layout.
- **Ctrl+Y** redoes it.
## Deleting Elements
Select an element and press **Delete** on your keyboard, or use the **x** in the quick-connect controls.
> The **Delete** button in the toolbar deletes the whole diagram, not the selected element.
---
## Saving and Versions
Section: Diagram Editor
URL: https://docs.mindziestudio.com/mindzie_bpm_studio/editor/saving-and-versions
Source: /docs-master/mindzieBpmStudio/editor/saving-and-versions/page.md
# Saving and Versions
Every diagram keeps a numbered version history: each save - whether you clicked the button or auto save did it for you - records a new version.
## Auto Save
**Auto save** is the checkbox in the editor toolbar, and it is on by default. A moment after you stop editing, the diagram saves itself and the title bar shows the result - for example "Saved v4 at 07:14".
Untick the checkbox if you prefer to save manually - for example while experimenting with a change you may not keep.
## Manual Save
Click **Save draft** in the toolbar to save immediately. The button shows a spinner while the save is in flight.
## How Versions Work
- A new diagram starts at **v1**.
- Every save writes the next version: v2, v3, and so on.
- The current version is shown next to the diagram title in the editor and in the **Version** column of the Diagrams list.
- An asterisk (*) after the title means there are changes that have not been saved yet.

## What This Means in Practice
- You never lose a previous state to an accidental save - earlier versions remain recorded.
- The Diagrams list and the editor always open the **latest** version.
- If several saves happen in quick succession (for example with auto save on while you edit actively), expect the version number to advance more than once - that's normal.
---
## Exporting Diagrams
Section: Diagram Editor
URL: https://docs.mindziestudio.com/mindzie_bpm_studio/editor/exporting-diagrams
Source: /docs-master/mindzieBpmStudio/editor/exporting-diagrams/page.md
# Exporting Diagrams
Export the open diagram from the editor toolbar. Four formats are available, each as a one-click button:

| Button | Format | Best for |
|--------|--------|----------|
| **PNG** | Raster image | Pasting into slides, chat, or documents. |
| **SVG** | Vector image | Web pages and print - scales without losing sharpness. |
| **PDF** | PDF document | Sharing a printable copy. |
| **VSDX** | Microsoft Visio drawing | Continuing work in Visio. Requires Visio support on the server - if the button reports an error, ask your administrator. |
Clicking a button downloads the file through your browser; the diagram itself is unchanged.
## Tips
- Export reflects the diagram as it currently looks on the canvas - run **Auto layout** or tidy the arrangement first if the export is going into a document.
- For the sharpest result in printed material, prefer **SVG** or **PDF** over PNG.
---
## Creating Diagrams with AI
Section: AI Assistance
URL: https://docs.mindziestudio.com/mindzie_bpm_studio/ai/creating-diagrams-with-ai
Source: /docs-master/mindzieBpmStudio/ai/creating-diagrams-with-ai/page.md
# Creating Diagrams with AI
BPM Studio can draft a BPMN diagram for you from material you already have - a photo or screenshot of a flow, a procedure document, or simply a description you type. You then refine the generated diagram in the editor like any other.
> The AI options appear only when AI agents are enabled for your tenant. If you don't see them, ask your tenant administrator.
## Where to Start
There are two entry points:
- **From the Projects page** - the **Generate from a picture** and **Start from an SOP** cards create a new project together with the AI job.
- **From inside a project** - open **AI Jobs** in the left navigation and click **New job** to add a generated diagram to the current project.

The **New job** dialog offers three ways to start:
| Option | You provide | Result |
|--------|-------------|--------|
| **Start from scratch** | A description of the process, written in chat | The AI builds the diagram from your description. |
| **Generate from a picture** | Photos or screenshots of a flow | The AI reads the image and builds the BPMN diagram. |
| **Start from an SOP** | Procedure documents (PDF, Word, or text) | The AI reads the documents and builds the BPMN diagram. |
## The Wizard
Each option walks you through a short wizard - for example, **Start from an SOP**:
1. **Name** - the name for the AI job (and, when starting from the Projects page, the new project). Add an optional description.
2. **Documents** - upload one or more procedure documents.
3. **Confirm** - review what will be processed and submit.

## While the Job Runs
Generation runs in the background - you can leave the page. You'll receive an email when the diagram is ready, and the job appears in the project's **AI Jobs** list, where you can check its progress and open the result.
## After Generation
The generated diagram appears under the project like any other diagram: open it in the editor, fix anything the AI got wrong, rearrange with **Auto layout**, and save - every save creates a new version, so the AI's original draft stays in the history.
---
## Changing the Display Language
Section: Interface
URL: https://docs.mindziestudio.com/mindzie_bpm_studio/interface/changing-the-display-language
Source: /docs-master/mindzieBpmStudio/interface/changing-the-display-language/page.md
# Changing the Display Language
The BPM Studio interface is available in eight languages. Each user picks their own language; it does not affect anyone else.
## Supported Languages
| | |
|---|---|
| English | Nederlands (Dutch) |
| Deutsch (German) | Türkçe (Turkish) |
| Français (French) | 日本語 (Japanese) |
| Español (Spanish) | Dansk (Danish) |
## Switching Language
1. Click the **flag icon** in the header.
2. Pick a language from the list - the current one is marked with a check.
3. The page reloads in the selected language.

Your choice is remembered for future sessions on the same browser.
## What Changes - and What Doesn't
- The BPM Studio **interface** - navigation, buttons, dialogs, column headers - follows your language choice. Translation coverage is still being completed, so some texts may appear in English.
- **Diagram content does not change.** Element names stay exactly as their author wrote them, in whatever language that was. Everyone sees the same labels.
---
## Coming Features
Section: Coming Features
URL: https://docs.mindziestudio.com/mindzie_bpm_studio/coming-features/overview
Source: /docs-master/mindzieBpmStudio/coming-features/overview/page.md
# Coming Features
BPM Studio is in active development, and its capabilities grow with every release. This page lists what is planned. It is not a commitment to scope or timing, and the order below does not reflect priority - features ship when they are ready.
## Planned Capabilities
- **Lifecycle states** - Move diagrams through Draft, In Review, Approved, Published, and Deprecated states instead of everything living as a draft.
- **Approvals** - Submit a diagram for review, assign approvers, and track sign-off before publishing.
- **Periodic re-approval reminders** - Set a review cadence on published processes and get notified when a re-approval is due.
- **Comments and mentions** - Discuss a diagram directly on its elements, with threads, replies, and @mentions.
- **Document generation** - Turn a diagram into a formatted Word or PDF process document.
- **Multilingual diagram content** - Translate element names and descriptions so each viewer can read the process in their own language.
- **Folders and search** - Organize diagrams in folder trees and find them with full-text search.
- **Object library** - Define roles, systems, and documents once and reuse them across diagrams.
- **RACI matrices** - Assign Responsible, Accountable, Consulted, and Informed roles to activities and export the matrix.
- **Version history viewing** - Browse and compare earlier versions of a diagram, not just the latest.
- **Validation panel** - A dedicated view of all open issues in a diagram, with explanations and quick fixes.
- **ARIS import** - Bring existing process models across from ARIS.
- **Process simulation** - Run tokens through a model to estimate durations, costs, and bottlenecks before changing the real process.
- **Process mining integration** - Compare a designed process against how it actually runs, using event data from Process Intelligence.
- **Audit history** - A reviewable trail of who changed what and when.
- **Dashboards and reports** - Governance overviews showing review status and activity across all processes.
- **Read-only process portal** - A simple site where anyone in the organization can browse published processes.
- **API access** - Work with diagrams and projects programmatically.
## Have a Request?
If one of these matters to you - or something is missing - tell your mindzie contact. Customer feedback decides what gets built first.
# Product: mindzieAPI
---
## Quick Start
Section: Getting Started
URL: https://docs.mindziestudio.com/mindzie_api/getting-started/quick-start
Source: /docs-master/mindzieAPI/getting-started/quick-start/page.md
# Quick Start Guide
**Get Up and Running in Minutes**
Follow this step-by-step guide to make your first successful API calls to mindzieStudio and start integrating process mining capabilities into your applications.
## Prerequisites
- **API Credentials:** Access token, tenant ID, and project ID
- **Base URL:** Your mindzie instance API endpoint
- **HTTPS Access:** Secure connection to your mindzie instance
- **Development Environment:** Your preferred programming language and HTTP client
**Don't have credentials?** Check the [Authentication Guide](/mindzie_api/authentication) to learn how to obtain your API access credentials.
## Step 1: Test Basic Connectivity
Start by testing basic connectivity to ensure your mindzie instance is accessible:
```bash
curl -X GET "https://your-mindzie-instance.com/api/Action/ping"
```
**Expected Response:**
```json
{
"status": "ok",
"timestamp": "2024-01-15T10:30:00Z",
"version": "1.0.0"
}
```
## Step 2: Verify Authentication
Test your authentication credentials with the authenticated ping endpoint:
```bash
curl -X GET "https://your-mindzie-instance.com/api/Action/ping/authenticated" \
-H "Authorization: Bearer YOUR_ACCESS_TOKEN" \
-H "X-Tenant-Id: YOUR_TENANT_GUID" \
-H "X-Project-Id: YOUR_PROJECT_GUID" \
-H "Content-Type: application/json"
```
**Expected Response:**
```json
{
"status": "authenticated",
"timestamp": "2024-01-15T10:30:00Z",
"tenantId": "12345678-1234-1234-1234-123456789012",
"projectId": "87654321-4321-4321-4321-210987654321",
"userId": "user@company.com",
"permissions": ["read", "write", "admin"]
}
```
## Step 3: Your First API Call
Let's make a practical API call to retrieve action history:
```bash
curl -X GET "https://your-mindzie-instance.com/api/Action/history?limit=5" \
-H "Authorization: Bearer YOUR_ACCESS_TOKEN" \
-H "X-Tenant-Id: YOUR_TENANT_GUID" \
-H "X-Project-Id: YOUR_PROJECT_GUID" \
-H "Content-Type: application/json"
```
**Example Response:**
```json
{
"actions": [
{
"actionId": "87654321-4321-4321-4321-210987654321",
"actionType": "analyze",
"status": "completed",
"startTime": "2024-01-15T10:30:00Z",
"endTime": "2024-01-15T10:32:15Z",
"duration": 135,
"userId": "user@company.com"
}
],
"pagination": {
"currentPage": 1,
"totalPages": 1,
"totalItems": 1,
"itemsPerPage": 5
}
}
```
## Language-Specific Examples
### JavaScript
Use fetch API or axios for modern web applications and Node.js backends.
### Python
Use requests library for data science workflows and backend automation.
### C#/.NET
Use HttpClient for enterprise applications and microservices.
## JavaScript Example
Complete example using modern JavaScript and fetch API:
```javascript
// Configuration
const API_CONFIG = {
baseURL: 'https://your-mindzie-instance.com/api',
token: 'YOUR_ACCESS_TOKEN',
tenantId: 'YOUR_TENANT_GUID',
projectId: 'YOUR_PROJECT_GUID'
};
// Helper function for API requests
async function callMindzieAPI(endpoint, options = {}) {
const url = `${API_CONFIG.baseURL}${endpoint}`;
const defaultHeaders = {
'Authorization': `Bearer ${API_CONFIG.token}`,
'X-Tenant-Id': API_CONFIG.tenantId,
'X-Project-Id': API_CONFIG.projectId,
'Content-Type': 'application/json'
};
try {
const response = await fetch(url, {
...options,
headers: { ...defaultHeaders, ...options.headers }
});
if (!response.ok) {
throw new Error(`HTTP ${response.status}: ${response.statusText}`);
}
return await response.json();
} catch (error) {
console.error('API call failed:', error);
throw error;
}
}
// Example usage
async function quickStartExample() {
try {
// 1. Test connectivity
console.log('Testing connectivity...');
const pingResult = await callMindzieAPI('/Action/ping');
console.log('Ping successful:', pingResult);
// 2. Test authentication
console.log('Testing authentication...');
const authResult = await callMindzieAPI('/Action/ping/authenticated');
console.log('Authentication successful:', authResult);
// 3. Get action history
console.log('Fetching action history...');
const history = await callMindzieAPI('/Action/history?limit=5');
console.log('Action history:', history);
console.log('Quick start completed successfully!');
return history;
} catch (error) {
console.error('Quick start failed:', error);
throw error;
}
}
// Run the example
quickStartExample();
```
## Python Example
Complete example using Python requests library:
```python
import requests
import json
from typing import Dict, Any
class MindzieQuickStart:
def __init__(self, base_url: str, token: str, tenant_id: str, project_id: str):
self.base_url = base_url.rstrip('/')
self.headers = {
'Authorization': f'Bearer {token}',
'X-Tenant-Id': tenant_id,
'X-Project-Id': project_id,
'Content-Type': 'application/json'
}
def call_api(self, endpoint: str, method: str = 'GET', **kwargs) -> Dict[str, Any]:
"""Make an API call to mindzie"""
url = f"{self.base_url}{endpoint}"
try:
response = requests.request(
method=method,
url=url,
headers=self.headers,
**kwargs
)
response.raise_for_status()
return response.json()
except requests.exceptions.RequestException as e:
print(f"API call failed: {e}")
raise
def run_quick_start(self):
"""Execute the quick start sequence"""
print("Starting mindzie API Quick Start...")
try:
# 1. Test connectivity
print("1. Testing connectivity...")
ping_result = requests.get(f"{self.base_url}/api/Action/ping")
ping_result.raise_for_status()
print(f" Connectivity OK: {ping_result.json()}")
# 2. Test authentication
print("2. Testing authentication...")
auth_result = self.call_api('/api/Action/ping/authenticated')
print(f" Authentication OK: {auth_result['status']}")
# 3. Get action history
print("3. Fetching action history...")
history = self.call_api('/api/Action/history?limit=5')
print(f" Retrieved {len(history['actions'])} actions")
print("Quick start completed successfully!")
return history
except Exception as e:
print(f"Quick start failed: {e}")
raise
# Usage example
if __name__ == "__main__":
# Configure your credentials
quick_start = MindzieQuickStart(
base_url='https://your-mindzie-instance.com/api',
token='YOUR_ACCESS_TOKEN',
tenant_id='YOUR_TENANT_GUID',
project_id='YOUR_PROJECT_GUID'
)
# Run the quick start
result = quick_start.run_quick_start()
print(f"Final result: {json.dumps(result, indent=2)}")
```
## C#/.NET Example
Complete example using C# HttpClient:
```csharp
using System;
using System.Net.Http;
using System.Text.Json;
using System.Threading.Tasks;
public class MindzieQuickStart
{
private readonly HttpClient _httpClient;
private readonly string _baseUrl;
public MindzieQuickStart(string baseUrl, string token, string tenantId, string projectId)
{
_baseUrl = baseUrl.TrimEnd('/');
_httpClient = new HttpClient();
_httpClient.DefaultRequestHeaders.Add("Authorization", $"Bearer {token}");
_httpClient.DefaultRequestHeaders.Add("X-Tenant-Id", tenantId);
_httpClient.DefaultRequestHeaders.Add("X-Project-Id", projectId);
}
public async Task CallApiAsync(string endpoint)
{
try
{
var response = await _httpClient.GetAsync($"{_baseUrl}{endpoint}");
response.EnsureSuccessStatusCode();
var content = await response.Content.ReadAsStringAsync();
return JsonSerializer.Deserialize(content, new JsonSerializerOptions
{
PropertyNameCaseInsensitive = true
});
}
catch (HttpRequestException ex)
{
Console.WriteLine($"API call failed: {ex.Message}");
throw;
}
}
public async Task RunQuickStartAsync()
{
Console.WriteLine("Starting mindzie API Quick Start...");
try
{
// 1. Test connectivity
Console.WriteLine("1. Testing connectivity...");
using var pingClient = new HttpClient();
var pingResponse = await pingClient.GetAsync($"{_baseUrl}/api/Action/ping");
pingResponse.EnsureSuccessStatusCode();
Console.WriteLine(" Connectivity OK");
// 2. Test authentication
Console.WriteLine("2. Testing authentication...");
var authResult = await CallApiAsync("/api/Action/ping/authenticated");
Console.WriteLine($" Authentication OK: {authResult.Status}");
// 3. Get action history
Console.WriteLine("3. Fetching action history...");
var history = await CallApiAsync("/api/Action/history?limit=5");
Console.WriteLine($" Retrieved {history.Actions.Length} actions");
Console.WriteLine("Quick start completed successfully!");
}
catch (Exception ex)
{
Console.WriteLine($"Quick start failed: {ex.Message}");
throw;
}
}
public void Dispose()
{
_httpClient?.Dispose();
}
}
// Data models
public class AuthResponse
{
public string Status { get; set; }
public string TenantId { get; set; }
public string ProjectId { get; set; }
public string UserId { get; set; }
}
public class ActionHistoryResponse
{
public ActionItem[] Actions { get; set; }
public PaginationInfo Pagination { get; set; }
}
public class ActionItem
{
public string ActionId { get; set; }
public string ActionType { get; set; }
public string Status { get; set; }
public DateTime StartTime { get; set; }
public DateTime? EndTime { get; set; }
}
public class PaginationInfo
{
public int CurrentPage { get; set; }
public int TotalPages { get; set; }
public int TotalItems { get; set; }
}
// Usage
class Program
{
static async Task Main(string[] args)
{
var quickStart = new MindzieQuickStart(
"https://your-mindzie-instance.com/api",
"YOUR_ACCESS_TOKEN",
"YOUR_TENANT_GUID",
"YOUR_PROJECT_GUID"
);
try
{
await quickStart.RunQuickStartAsync();
}
finally
{
quickStart.Dispose();
}
}
}
```
## Common Issues & Solutions
### Authentication Failures
- **401 Unauthorized:** Verify your access token is correct and not expired
- **403 Forbidden:** Check tenant/project IDs and user permissions
- **400 Bad Request:** Ensure all required headers are included
### Connection Issues
- **Network timeouts:** Check firewall settings and network connectivity
- **SSL/TLS errors:** Verify certificate validity and HTTPS configuration
- **DNS resolution:** Confirm the mindzie instance URL is correct
### Rate Limiting
- **429 Too Many Requests:** Implement exponential backoff retry logic
- **Monitor rate limits:** Check response headers for rate limit information
- **Optimize requests:** Use pagination and filtering to reduce API calls
## Next Steps
**Congratulations!** You've successfully completed the mindzieAPI quick start. Next, explore the [Actions API](/mindzie_api/action) or [Blocks API](/mindzie_api/block) to start building powerful integrations.
---
## Authentication
Section: Getting Started
URL: https://docs.mindziestudio.com/mindzie_api/getting-started/authentication
Source: /docs-master/mindzieAPI/getting-started/authentication/page.md
# Authentication
**Secure Access to the mindzieAPI**
Learn how to authenticate with the mindzieAPI using Bearer tokens, manage tenant and project access, and implement secure API integration patterns.
## Authentication Overview
The mindzieAPI uses Bearer token authentication combined with tenant and project identifiers to provide secure, multi-tenant access to mindzie resources.
## API Key Types
The mindzieAPI supports two types of API keys with different access levels:
### Tenant API Keys (Standard)
Tenant API Keys are scoped to a specific tenant and are used for most API operations:
- Access projects, datasets, investigations, and dashboards within the tenant
- Execute notebooks and blocks
- Manage project-level resources
**Create at:** Settings -> API Keys (within mindzieStudio)
### Global API Keys (Server API Keys)
Global API Keys have system-wide administrative access and are required for:
- **Tenant API** - Create, list, update, and delete tenants
- **User API (Global)** - Create and manage users across all tenants
- Assign users to tenants
**Create at:** `/admin/global-api-keys` (Administrator access required)
**IMPORTANT:** The Tenant API endpoints (`/api/tenant`) require a Global API Key. Regular tenant-specific API keys cannot access these endpoints and will receive a 401 Unauthorized response.
## Required Headers
### For Tenant-Scoped Operations
```
Authorization: Bearer YOUR_TENANT_API_KEY
Content-Type: application/json
```
The tenant ID is typically included in the URL path (e.g., `/api/{tenantId}/project`).
### For Global Operations (Tenant/User Management)
```
Authorization: Bearer YOUR_GLOBAL_API_KEY
Content-Type: application/json
```
**Security Note:** Always use HTTPS when making API requests to protect your access tokens in transit.
## Obtaining Access Tokens
### Enterprise Server
For Enterprise Server deployments, contact your mindzie administrator to obtain:
- API access token
- Tenant ID (GUID format)
- Project ID (GUID format)
- Base API URL for your instance
### SaaS Deployment
For SaaS users, access tokens can be generated through:
- mindzie Studio user interface (Settings → API Keys)
- Contacting your account administrator
- Using the authentication endpoints (if enabled)
## Testing Authentication
Use the ping endpoints to verify your authentication setup:
### Basic Connectivity Test
```bash
curl -X GET "https://your-mindzie-instance.com/api/Action/ping"
```
### Authenticated Test
```bash
curl -X GET "https://your-mindzie-instance.com/api/Action/ping/authenticated" \
-H "Authorization: Bearer YOUR_ACCESS_TOKEN" \
-H "X-Tenant-Id: YOUR_TENANT_GUID" \
-H "X-Project-Id: YOUR_PROJECT_GUID"
```
### Successful Response
```json
{
"status": "authenticated",
"timestamp": "2024-01-15T10:30:00Z",
"tenantId": "12345678-1234-1234-1234-123456789012",
"projectId": "87654321-4321-4321-4321-210987654321",
"userId": "user@company.com",
"permissions": ["read", "write", "admin"]
}
```
## Security Best Practices
### Token Security
Store tokens securely using environment variables or secure credential management systems.
### Token Expiration
Monitor token expiration and implement refresh mechanisms to maintain uninterrupted access.
### Multi-Tenant
Each token is scoped to specific tenants and projects for secure data isolation.
## Implementation Examples
### JavaScript/Node.js
```javascript
const apiConfig = {
baseURL: process.env.MINDZIE_API_URL,
token: process.env.MINDZIE_ACCESS_TOKEN,
tenantId: process.env.MINDZIE_TENANT_ID,
projectId: process.env.MINDZIE_PROJECT_ID
};
const makeAuthenticatedRequest = async (endpoint, options = {}) => {
const url = `${apiConfig.baseURL}${endpoint}`;
const headers = {
'Authorization': `Bearer ${apiConfig.token}`,
'X-Tenant-Id': apiConfig.tenantId,
'X-Project-Id': apiConfig.projectId,
'Content-Type': 'application/json',
...options.headers
};
try {
const response = await fetch(url, {
...options,
headers
});
if (!response.ok) {
throw new Error(`API request failed: ${response.status} ${response.statusText}`);
}
return await response.json();
} catch (error) {
console.error('API request error:', error);
throw error;
}
};
```
### Python
```python
import os
import requests
from typing import Dict, Any
class MindzieAPIClient:
def __init__(self):
self.base_url = os.getenv('MINDZIE_API_URL')
self.token = os.getenv('MINDZIE_ACCESS_TOKEN')
self.tenant_id = os.getenv('MINDZIE_TENANT_ID')
self.project_id = os.getenv('MINDZIE_PROJECT_ID')
if not all([self.base_url, self.token, self.tenant_id, self.project_id]):
raise ValueError("Missing required environment variables")
def _get_headers(self) -> Dict[str, str]:
return {
'Authorization': f'Bearer {self.token}',
'X-Tenant-Id': self.tenant_id,
'X-Project-Id': self.project_id,
'Content-Type': 'application/json'
}
def make_request(self, method: str, endpoint: str, **kwargs) -> Dict[str, Any]:
url = f"{self.base_url.rstrip('/')}{endpoint}"
headers = self._get_headers()
if 'headers' in kwargs:
headers.update(kwargs['headers'])
kwargs['headers'] = headers
try:
response = requests.request(method, url, **kwargs)
response.raise_for_status()
return response.json()
except requests.exceptions.RequestException as e:
raise Exception(f"API request failed: {e}")
# Usage
client = MindzieAPIClient()
result = client.make_request('GET', '/api/Action/ping/authenticated')
```
### C#/.NET
```csharp
using System;
using System.Net.Http;
using System.Text.Json;
using System.Threading.Tasks;
public class MindzieApiClient
{
private readonly HttpClient _httpClient;
private readonly string _baseUrl;
private readonly string _tenantId;
private readonly string _projectId;
public MindzieApiClient(string baseUrl, string accessToken, string tenantId, string projectId)
{
_baseUrl = baseUrl.TrimEnd('/');
_tenantId = tenantId;
_projectId = projectId;
_httpClient = new HttpClient();
_httpClient.DefaultRequestHeaders.Add("Authorization", $"Bearer {accessToken}");
_httpClient.DefaultRequestHeaders.Add("X-Tenant-Id", tenantId);
_httpClient.DefaultRequestHeaders.Add("X-Project-Id", projectId);
}
public async Task GetAsync(string endpoint)
{
var response = await _httpClient.GetAsync($"{_baseUrl}{endpoint}");
response.EnsureSuccessStatusCode();
var content = await response.Content.ReadAsStringAsync();
return JsonSerializer.Deserialize(content);
}
public async Task PostAsync(string endpoint, object data)
{
var json = JsonSerializer.Serialize(data);
var content = new StringContent(json, System.Text.Encoding.UTF8, "application/json");
var response = await _httpClient.PostAsync($"{_baseUrl}{endpoint}", content);
response.EnsureSuccessStatusCode();
var responseContent = await response.Content.ReadAsStringAsync();
return JsonSerializer.Deserialize(responseContent);
}
}
// Usage
var client = new MindzieApiClient(
Environment.GetEnvironmentVariable("MINDZIE_API_URL"),
Environment.GetEnvironmentVariable("MINDZIE_ACCESS_TOKEN"),
Environment.GetEnvironmentVariable("MINDZIE_TENANT_ID"),
Environment.GetEnvironmentVariable("MINDZIE_PROJECT_ID")
);
```
## Error Handling
### Common Authentication Errors
| Status Code | Error | Description | Solution |
|-------------|-------|-------------|----------|
| `401` | Unauthorized | Invalid or missing access token | Verify token and ensure it's not expired |
| `403` | Forbidden | Valid token but insufficient permissions | Check tenant/project access or request permissions |
| `400` | Bad Request | Missing required headers | Ensure X-Tenant-Id and X-Project-Id are provided |
### Example Error Response
```json
{
"error": "invalid_token",
"message": "The provided access token is invalid or expired",
"timestamp": "2024-01-15T10:30:00Z",
"requestId": "req_12345"
}
```
## Next Steps
Once authentication is working, try the [Quick Start Guide](/mindzie_api/quick-start) to make your first API calls or explore the [Response Formats](/mindzie_api/response-formats) documentation.
---
## Response Formats
Section: Getting Started
URL: https://docs.mindziestudio.com/mindzie_api/getting-started/response-formats
Source: /docs-master/mindzieAPI/getting-started/response-formats/page.md
# Response Formats
**Understanding API Response Structures**
Learn about mindzieAPI response formats, status codes, error handling patterns, and data structures to build robust integrations.
## Standard Response Format
All mindzieAPI responses follow consistent JSON formatting with predictable structures:
### Successful Response
```json
{
"data": {
// Primary response data
},
"metadata": {
"timestamp": "2024-01-15T10:30:00Z",
"requestId": "req_12345",
"version": "1.0.0"
},
"pagination": {
// Present for paginated responses
"currentPage": 1,
"totalPages": 5,
"totalItems": 100,
"itemsPerPage": 20,
"hasNext": true,
"hasPrevious": false
}
}
```
### Error Response
```json
{
"error": {
"code": "validation_failed",
"message": "Request validation failed",
"details": {
"field": "datasetId",
"reason": "Invalid GUID format"
},
"timestamp": "2024-01-15T10:30:00Z",
"requestId": "req_12345"
}
}
```
## Response Types
### Success Responses
HTTP 2xx status codes with structured JSON data and metadata.
### Error Responses
HTTP 4xx/5xx status codes with detailed error information.
### Pagination
Consistent pagination format for large dataset responses.
## HTTP Status Codes
### Success Codes (2xx)
| Code | Status | Description | Usage |
|------|--------|-------------|-------|
| `200` | OK | Request successful, data returned | GET requests, successful operations |
| `201` | Created | Resource successfully created | POST requests creating new resources |
| `202` | Accepted | Request accepted for async processing | Long-running operations, queued tasks |
| `204` | No Content | Request successful, no data returned | DELETE requests, updates without return data |
### Client Error Codes (4xx)
| Code | Status | Description | Common Causes |
|------|--------|-------------|---------------|
| `400` | Bad Request | Invalid request format or parameters | Missing headers, invalid JSON, malformed data |
| `401` | Unauthorized | Authentication required or failed | Missing/invalid token, expired credentials |
| `403` | Forbidden | Valid auth but insufficient permissions | Limited user access, wrong tenant/project |
| `404` | Not Found | Requested resource doesn't exist | Invalid endpoint, non-existent resource ID |
| `422` | Unprocessable Entity | Valid format but business logic validation failed | Invalid business rules, constraint violations |
| `429` | Too Many Requests | Rate limit exceeded | Too many API calls in time window |
### Server Error Codes (5xx)
| Code | Status | Description | Action |
|------|--------|-------------|--------|
| `500` | Internal Server Error | Unexpected server error | Retry with exponential backoff |
| `502` | Bad Gateway | Upstream service error | Check service status, retry later |
| `503` | Service Unavailable | Service temporarily unavailable | Retry after delay, check maintenance |
| `504` | Gateway Timeout | Request timeout | Increase timeout, optimize request |
## Common Response Patterns
### Single Resource Response
```json
{
"actionId": "87654321-4321-4321-4321-210987654321",
"actionType": "analyze",
"status": "completed",
"startTime": "2024-01-15T10:30:00Z",
"endTime": "2024-01-15T10:32:15Z",
"duration": 135,
"result": {
"outputId": "98765432-8765-4321-4321-987654321098",
"recordsProcessed": 10000
}
}
```
### Collection Response with Pagination
```json
{
"actions": [
{
"actionId": "87654321-4321-4321-4321-210987654321",
"actionType": "analyze",
"status": "completed"
},
{
"actionId": "11111111-2222-3333-4444-555555555555",
"actionType": "export",
"status": "processing"
}
],
"pagination": {
"currentPage": 1,
"totalPages": 5,
"totalItems": 100,
"itemsPerPage": 20,
"hasNext": true,
"hasPrevious": false,
"links": {
"first": "/api/Action/history?page=1&limit=20",
"next": "/api/Action/history?page=2&limit=20",
"last": "/api/Action/history?page=5&limit=20"
}
}
}
```
### Async Operation Response
```json
{
"operationId": "op_12345678-1234-1234-1234-123456789012",
"status": "processing",
"progress": {
"percentage": 45,
"currentStep": "data_analysis",
"totalSteps": 5,
"estimatedCompletion": "2024-01-15T10:35:00Z"
},
"trackingUrl": "/api/Execution/status/op_12345678-1234-1234-1234-123456789012",
"message": "Processing dataset analysis..."
}
```
## Error Response Details
### Validation Error
```json
{
"error": {
"code": "validation_failed",
"message": "Request validation failed",
"details": {
"errors": [
{
"field": "datasetId",
"code": "invalid_format",
"message": "Must be a valid GUID"
},
{
"field": "parameters.timeout",
"code": "out_of_range",
"message": "Must be between 1 and 3600 seconds"
}
]
},
"timestamp": "2024-01-15T10:30:00Z",
"requestId": "req_12345"
}
}
```
### Authentication Error
```json
{
"error": {
"code": "invalid_token",
"message": "The provided access token is invalid or expired",
"details": {
"tokenType": "bearer",
"expiresAt": "2024-01-15T09:00:00Z",
"suggestion": "Please refresh your access token"
},
"timestamp": "2024-01-15T10:30:00Z",
"requestId": "req_12345"
}
}
```
### Rate Limiting Error
```json
{
"error": {
"code": "rate_limit_exceeded",
"message": "Rate limit exceeded for this endpoint",
"details": {
"limit": 100,
"remaining": 0,
"resetTime": "2024-01-15T11:00:00Z",
"retryAfter": 1800
},
"timestamp": "2024-01-15T10:30:00Z",
"requestId": "req_12345"
}
}
```
## Response Headers
### Standard Headers
| Header | Description | Example |
|--------|-------------|---------|
| `Content-Type` | Response format | application/json; charset=utf-8 |
| `X-Request-Id` | Unique request identifier | req_12345678 |
| `X-Response-Time` | Server processing time | 145ms |
| `X-API-Version` | API version used | 1.0.0 |
### Rate Limiting Headers
| Header | Description | Example |
|--------|-------------|---------|
| `X-RateLimit-Limit` | Maximum requests per window | 100 |
| `X-RateLimit-Remaining` | Remaining requests in window | 95 |
| `X-RateLimit-Reset` | Window reset timestamp | 1642251600 |
| `Retry-After` | Seconds to wait before retry | 3600 |
## Best Practices for Error Handling
### JavaScript Example
```javascript
async function handleAPIResponse(response) {
// Check if response is ok
if (!response.ok) {
const errorData = await response.json();
switch (response.status) {
case 400:
throw new ValidationError(errorData.error.message, errorData.error.details);
case 401:
throw new AuthenticationError('Authentication failed');
case 403:
throw new AuthorizationError('Insufficient permissions');
case 404:
throw new NotFoundError('Resource not found');
case 429:
const retryAfter = response.headers.get('Retry-After');
throw new RateLimitError(`Rate limited. Retry after ${retryAfter} seconds`);
case 500:
case 502:
case 503:
case 504:
throw new ServerError('Server error occurred. Please retry.');
default:
throw new APIError(`Unexpected error: ${response.status}`);
}
}
return await response.json();
}
// Usage with retry logic
async function apiCallWithRetry(url, options, maxRetries = 3) {
for (let attempt = 1; attempt <= maxRetries; attempt++) {
try {
const response = await fetch(url, options);
return await handleAPIResponse(response);
} catch (error) {
if (error instanceof RateLimitError) {
const retryAfter = parseInt(error.retryAfter) || Math.pow(2, attempt);
await new Promise(resolve => setTimeout(resolve, retryAfter * 1000));
continue;
}
if (error instanceof ServerError && attempt < maxRetries) {
const delay = Math.pow(2, attempt) * 1000; // Exponential backoff
await new Promise(resolve => setTimeout(resolve, delay));
continue;
}
throw error;
}
}
}
```
### Python Example
```python
import requests
import time
from typing import Dict, Any
class APIError(Exception):
def __init__(self, message: str, status_code: int = None, details: Dict = None):
super().__init__(message)
self.status_code = status_code
self.details = details
def handle_api_response(response: requests.Response) -> Dict[str, Any]:
"""Handle API response with proper error handling"""
if response.ok:
return response.json()
try:
error_data = response.json()
except ValueError:
error_data = {"error": {"message": response.text}}
error_info = error_data.get("error", {})
message = error_info.get("message", f"HTTP {response.status_code}")
details = error_info.get("details", {})
if response.status_code == 429:
retry_after = response.headers.get('Retry-After', '60')
raise APIError(f"Rate limited. Retry after {retry_after} seconds",
response.status_code, details)
elif response.status_code >= 500:
raise APIError(f"Server error: {message}", response.status_code, details)
elif response.status_code >= 400:
raise APIError(f"Client error: {message}", response.status_code, details)
raise APIError(f"Unexpected error: {message}", response.status_code, details)
def api_call_with_retry(url: str, method: str = 'GET', max_retries: int = 3, **kwargs) -> Dict[str, Any]:
"""Make API call with automatic retry logic"""
for attempt in range(1, max_retries + 1):
try:
response = requests.request(method, url, **kwargs)
return handle_api_response(response)
except APIError as e:
if e.status_code == 429:
retry_after = int(e.details.get('retryAfter', 60))
time.sleep(retry_after)
continue
elif e.status_code >= 500 and attempt < max_retries:
delay = 2 ** attempt # Exponential backoff
time.sleep(delay)
continue
raise
raise APIError(f"Max retries ({max_retries}) exceeded")
```
## Next Steps
Now that you understand response formats, explore specific API sections like [Actions](/mindzie_api/action), [Blocks](/mindzie_api/block), or [Datasets](/mindzie_api/dataset) to see these patterns in action.
---
## Overview
Section: Action
URL: https://docs.mindziestudio.com/mindzie_api/action/overview
Source: /docs-master/mindzieAPI/action/overview/page.md
# Actions API
Execute and manage workflow actions programmatically.
## Overview
The Actions API provides endpoints for managing and executing workflow actions within mindzieStudio. Actions are automated workflow components that can be executed on demand or on schedule.
## Base URL Structure
All Action API endpoints follow this pattern:
```
/api/{tenantId}/{projectId}/action/...
```
**Path Parameters:**
| Parameter | Type | Description |
|-----------|------|-------------|
| `tenantId` | GUID | Your tenant identifier |
| `projectId` | GUID | Your project identifier |
## Available Endpoints
### Health Monitoring
Test connectivity and validate authentication.
- **GET** `/api/{tenantId}/{projectId}/action/unauthorized-ping` - Basic connectivity test (no auth required)
- **GET** `/api/{tenantId}/{projectId}/action/ping` - Authenticated connectivity test
[View Ping Documentation](/mindzie_api/action/ping)
### Action Management
List and retrieve action details.
- **GET** `/api/{tenantId}/{projectId}/action` - List all actions for a project
- **GET** `/api/{tenantId}/{projectId}/action/{actionId}` - Get specific action details
[View Action Management Documentation](/mindzie_api/action/list-actions)
### Execute Actions
Trigger action execution programmatically.
- **GET** `/api/{tenantId}/{projectId}/action/execute/{actionId}` - Execute an action
[View Execute Documentation](/mindzie_api/action/execute)
## Authentication
Most endpoints require authentication via Bearer token or API key. The only exception is the `unauthorized-ping` endpoint which can be called without authentication.
**Example authenticated request:**
```http
GET https://your-mindzie-instance.com/api/{tenantId}/{projectId}/action/ping
Authorization: Bearer {your-access-token}
```
## Common Use Cases
- **Health Monitoring:** Use ping endpoints to verify API connectivity and authentication
- **Automation:** Execute actions programmatically as part of ETL pipelines or scheduled jobs
- **Integration:** Trigger mindzieStudio workflows from external systems
- **Monitoring:** List and inspect actions to track workflow status
## Error Responses
All endpoints return standard HTTP status codes:
| Status | Description |
|--------|-------------|
| 200 | Success |
| 401 | Unauthorized - invalid or missing authentication |
| 404 | Not found - action or resource does not exist |
## Get Started
1. Start with [Ping Endpoints](/mindzie_api/action/ping) to test connectivity
2. Use [Action Management](/mindzie_api/action/list-actions) to discover available actions
3. [Execute Actions](/mindzie_api/action/execute) to trigger workflows
---
## Ping
Section: Action
URL: https://docs.mindziestudio.com/mindzie_api/action/ping
Source: /docs-master/mindzieAPI/action/ping/page.md
# Ping Endpoints
Health monitoring and connectivity testing for the Actions API.
## Overview
Ping endpoints provide a simple way to test connectivity and validate authentication with the mindzieAPI. These endpoints are essential for monitoring system health and troubleshooting connection issues.
## Unauthorized Ping
**GET** `/api/{tenantId}/{projectId}/action/unauthorized-ping`
Basic connectivity test that does not require authentication. Use this to verify the API is accessible.
### Request
```http
GET https://your-mindzie-instance.com/api/{tenantId}/{projectId}/action/unauthorized-ping
```
### Path Parameters
| Parameter | Type | Required | Description |
|-----------|------|----------|-------------|
| `tenantId` | GUID | Yes | Your tenant identifier |
| `projectId` | GUID | Yes | Your project identifier |
### Response
```
HTTP/1.1 200 OK
Content-Type: text/plain
Ping Successful
```
### Use Cases
- Basic connectivity testing
- Load balancer health checks
- Network troubleshooting
- Service availability monitoring
## Authenticated Ping
**GET** `/api/{tenantId}/{projectId}/action/ping`
Authenticated connectivity test that validates credentials and verifies access to the specified tenant and project.
### Request
```http
GET https://your-mindzie-instance.com/api/{tenantId}/{projectId}/action/ping
Authorization: Bearer {your-access-token}
```
### Path Parameters
| Parameter | Type | Required | Description |
|-----------|------|----------|-------------|
| `tenantId` | GUID | Yes | Your tenant identifier |
| `projectId` | GUID | Yes | Your project identifier |
### Response
**Success (200 OK):**
```
HTTP/1.1 200 OK
Content-Type: text/plain
Ping Successful (tenant id: 12345678-1234-1234-1234-123456789012)
```
**Unauthorized (401):**
```
HTTP/1.1 401 Unauthorized
Content-Type: text/plain
{error message describing authorization failure}
```
### Use Cases
- Authentication validation
- Permission verification
- Token validity testing
- Tenant/project access validation
## Implementation Examples
### cURL
```bash
# Unauthorized ping
curl -X GET "https://your-mindzie-instance.com/api/12345678-1234-1234-1234-123456789012/87654321-4321-4321-4321-210987654321/action/unauthorized-ping"
# Authenticated ping
curl -X GET "https://your-mindzie-instance.com/api/12345678-1234-1234-1234-123456789012/87654321-4321-4321-4321-210987654321/action/ping" \
-H "Authorization: Bearer YOUR_ACCESS_TOKEN"
```
### JavaScript/Node.js
```javascript
const TENANT_ID = '12345678-1234-1234-1234-123456789012';
const PROJECT_ID = '87654321-4321-4321-4321-210987654321';
const BASE_URL = 'https://your-mindzie-instance.com';
// Unauthorized ping
const unauthorizedPing = async () => {
const response = await fetch(
`${BASE_URL}/api/${TENANT_ID}/${PROJECT_ID}/action/unauthorized-ping`
);
const text = await response.text();
console.log('Unauthorized ping:', text);
return response.ok;
};
// Authenticated ping
const authenticatedPing = async (token) => {
const response = await fetch(
`${BASE_URL}/api/${TENANT_ID}/${PROJECT_ID}/action/ping`,
{
headers: {
'Authorization': `Bearer ${token}`
}
}
);
if (response.ok) {
const text = await response.text();
console.log('Authenticated ping:', text);
return true;
} else {
console.error('Authentication failed:', response.status);
return false;
}
};
```
### Python
```python
import requests
TENANT_ID = '12345678-1234-1234-1234-123456789012'
PROJECT_ID = '87654321-4321-4321-4321-210987654321'
BASE_URL = 'https://your-mindzie-instance.com'
def unauthorized_ping():
"""Basic connectivity test without authentication."""
url = f'{BASE_URL}/api/{TENANT_ID}/{PROJECT_ID}/action/unauthorized-ping'
response = requests.get(url)
print(f'Unauthorized ping: {response.text}')
return response.ok
def authenticated_ping(token):
"""Authenticated connectivity test."""
url = f'{BASE_URL}/api/{TENANT_ID}/{PROJECT_ID}/action/ping'
headers = {
'Authorization': f'Bearer {token}'
}
response = requests.get(url, headers=headers)
if response.ok:
print(f'Authenticated ping: {response.text}')
return True
else:
print(f'Authentication failed: {response.status_code}')
return False
```
### C#
```csharp
using System.Net.Http;
using System.Threading.Tasks;
public class ActionApiClient
{
private readonly HttpClient _httpClient;
private readonly string _baseUrl;
private readonly Guid _tenantId;
private readonly Guid _projectId;
public ActionApiClient(string baseUrl, Guid tenantId, Guid projectId, string accessToken)
{
_baseUrl = baseUrl;
_tenantId = tenantId;
_projectId = projectId;
_httpClient = new HttpClient();
_httpClient.DefaultRequestHeaders.Authorization =
new System.Net.Http.Headers.AuthenticationHeaderValue("Bearer", accessToken);
}
public async Task UnauthorizedPingAsync()
{
var url = $"{_baseUrl}/api/{_tenantId}/{_projectId}/action/unauthorized-ping";
var response = await _httpClient.GetAsync(url);
var content = await response.Content.ReadAsStringAsync();
Console.WriteLine($"Unauthorized ping: {content}");
return response.IsSuccessStatusCode;
}
public async Task AuthenticatedPingAsync()
{
var url = $"{_baseUrl}/api/{_tenantId}/{_projectId}/action/ping";
var response = await _httpClient.GetAsync(url);
var content = await response.Content.ReadAsStringAsync();
if (response.IsSuccessStatusCode)
{
Console.WriteLine($"Authenticated ping: {content}");
return true;
}
else
{
Console.WriteLine($"Authentication failed: {response.StatusCode}");
return false;
}
}
}
```
## Best Practices
- **Health Checks:** Use the unauthorized ping for automated health monitoring systems
- **Pre-flight Validation:** Call authenticated ping before executing actions to validate credentials
- **Error Handling:** Always handle network timeouts and authentication failures gracefully
- **Monitoring:** Set up automated alerts based on ping failures to detect service outages early
---
## Action Management
Section: Action
URL: https://docs.mindziestudio.com/mindzie_api/action/list-actions
Source: /docs-master/mindzieAPI/action/list-actions/page.md
# Action Management
Full CRUD operations for managing actions in your mindzieStudio project. Actions are workflow components that can be executed to perform automated tasks.
---
## API Endpoints
| Method | Endpoint | Description |
|--------|----------|-------------|
| GET | `/api/{tenantId}/{projectId}/action` | List all actions |
| GET | `/api/{tenantId}/{projectId}/action/{actionId}` | Get action details |
| POST | `/api/{tenantId}/{projectId}/action` | Create action |
| PUT | `/api/{tenantId}/{projectId}/action/{actionId}` | Update action |
| DELETE | `/api/{tenantId}/{projectId}/action/{actionId}` | Delete action |
| POST | `/api/{tenantId}/{projectId}/action/{actionId}/enable` | Enable action |
| POST | `/api/{tenantId}/{projectId}/action/{actionId}/disable` | Disable action |
---
## List All Actions
**GET** `/api/{tenantId}/{projectId}/action`
Retrieve all actions configured for a project.
### Path Parameters
| Parameter | Type | Required | Description |
|-----------|------|----------|-------------|
| `tenantId` | GUID | Yes | Your tenant identifier |
| `projectId` | GUID | Yes | Your project identifier |
### Response (200 OK)
```json
{
"actions": [
{
"actionId": "aaaaaaaa-bbbb-cccc-dddd-eeeeeeeeeeee",
"projectId": "87654321-4321-4321-4321-210987654321",
"name": "Daily Data Refresh",
"description": "Refreshes data from source systems daily",
"isEnabled": true,
"maxRunTime": 3600,
"actionStatus": "Idle",
"nextRunTime": "2024-01-16T06:00:00Z",
"lastRunTime": "2024-01-15T06:00:00Z",
"lastRunResult": "Success",
"dateCreated": "2024-01-01T10:00:00Z",
"dateModified": "2024-01-15T14:30:00Z",
"createdBy": "a1b2c3d4-e5f6-7890-abcd-ef1234567890",
"modifiedBy": "a1b2c3d4-e5f6-7890-abcd-ef1234567890",
"triggers": [...],
"steps": [...]
}
],
"totalCount": 1
}
```
---
## Get Action Details
**GET** `/api/{tenantId}/{projectId}/action/{actionId}`
Retrieve detailed information about a specific action.
### Path Parameters
| Parameter | Type | Required | Description |
|-----------|------|----------|-------------|
| `tenantId` | GUID | Yes | Your tenant identifier |
| `projectId` | GUID | Yes | Your project identifier |
| `actionId` | GUID | Yes | The action to retrieve |
### Response (200 OK)
```json
{
"actionId": "aaaaaaaa-bbbb-cccc-dddd-eeeeeeeeeeee",
"projectId": "87654321-4321-4321-4321-210987654321",
"name": "Daily Data Refresh",
"description": "Refreshes data from source systems daily",
"isEnabled": true,
"maxRunTime": 3600,
"actionStatus": "Idle",
"nextRunTime": "2024-01-16T06:00:00Z",
"lastRunTime": "2024-01-15T06:00:00Z",
"lastRunResult": "Success",
"dateCreated": "2024-01-01T10:00:00Z",
"dateModified": "2024-01-15T14:30:00Z",
"createdBy": "a1b2c3d4-e5f6-7890-abcd-ef1234567890",
"modifiedBy": "a1b2c3d4-e5f6-7890-abcd-ef1234567890",
"triggers": [
{
"triggerId": "11111111-1111-1111-1111-111111111111",
"actionId": "aaaaaaaa-bbbb-cccc-dddd-eeeeeeeeeeee",
"triggerType": "DailyScheduler",
"settings": "{}",
"frequency": 1,
"eventName": null,
"startDate": "2024-01-01",
"dateCreated": "2024-01-01T10:00:00Z"
}
],
"steps": [
{
"stepId": "22222222-2222-2222-2222-222222222222",
"actionId": "aaaaaaaa-bbbb-cccc-dddd-eeeeeeeeeeee",
"stepNumber": 1,
"stepType": "Python",
"description": "Execute data refresh script",
"settings": "{\"script\": \"refresh_data.py\"}",
"dateCreated": "2024-01-01T10:00:00Z"
}
]
}
```
### Response Fields
| Field | Type | Description |
|-------|------|-------------|
| `actionId` | GUID | Unique action identifier |
| `projectId` | GUID | Project this action belongs to |
| `name` | string | Display name |
| `description` | string | Action description |
| `isEnabled` | boolean | Whether the action is enabled |
| `maxRunTime` | integer | Maximum run time in seconds |
| `actionStatus` | string | Current status (Idle, Running, etc.) |
| `nextRunTime` | datetime | Next scheduled execution |
| `lastRunTime` | datetime | Last execution time |
| `lastRunResult` | string | Result of last execution |
| `triggers` | array | Trigger configurations |
| `steps` | array | Action step definitions |
---
## Create Action
**POST** `/api/{tenantId}/{projectId}/action`
Create a new action in the project.
### Path Parameters
| Parameter | Type | Required | Description |
|-----------|------|----------|-------------|
| `tenantId` | GUID | Yes | Your tenant identifier |
| `projectId` | GUID | Yes | Your project identifier |
### Request Body
```json
{
"name": "Weekly Report",
"description": "Generate weekly analysis report",
"isEnabled": true,
"maxRunTime": 1800,
"steps": [
{
"stepNumber": 1,
"stepType": "Python",
"description": "Generate report",
"settings": "{\"script\": \"generate_report.py\"}"
},
{
"stepNumber": 2,
"stepType": "Email",
"description": "Send report via email",
"settings": "{\"recipients\": [\"team@company.com\"]}"
}
],
"triggers": [
{
"triggerType": "WeeklyScheduler",
"frequency": 1,
"startDate": "2024-01-08"
}
]
}
```
### Request Fields
| Field | Type | Required | Description |
|-------|------|----------|-------------|
| `name` | string | Yes | Action name (must be unique in project) |
| `description` | string | No | Action description |
| `isEnabled` | boolean | No | Whether action is enabled (default: true) |
| `maxRunTime` | integer | No | Max run time in seconds (default: 3600) |
| `steps` | array | Yes | At least one step is required |
| `triggers` | array | No | Optional trigger configurations |
### Step Object
| Field | Type | Required | Description |
|-------|------|----------|-------------|
| `stepNumber` | integer | No | Execution order (auto-assigned if not provided) |
| `stepType` | string | Yes | Type: Python, Email, Webhook, etc. |
| `description` | string | No | Step description |
| `settings` | string | Yes | JSON configuration for the step |
### Trigger Object
| Field | Type | Required | Description |
|-------|------|----------|-------------|
| `triggerType` | string | Yes | Type: HourlyScheduler, DailyScheduler, WeeklyScheduler, MonthlyScheduler, EventTrigger |
| `frequency` | integer | No | Frequency multiplier |
| `startDate` | date | No | When to start the schedule |
| `eventName` | string | No | Event name (for EventTrigger) |
| `settings` | string | No | Additional trigger settings |
### Response (201 Created)
Returns the created action with assigned IDs.
### Error Responses
**Conflict (409) - Duplicate Name**
```json
{
"Error": "An action with this name already exists in the project"
}
```
---
## Update Action
**PUT** `/api/{tenantId}/{projectId}/action/{actionId}`
Update an existing action.
### Path Parameters
| Parameter | Type | Required | Description |
|-----------|------|----------|-------------|
| `tenantId` | GUID | Yes | Your tenant identifier |
| `projectId` | GUID | Yes | Your project identifier |
| `actionId` | GUID | Yes | The action to update |
### Request Body
```json
{
"name": "Updated Weekly Report",
"description": "Updated description",
"isEnabled": true,
"maxRunTime": 2400,
"steps": [
{
"stepId": "22222222-2222-2222-2222-222222222222",
"stepNumber": 1,
"stepType": "Python",
"description": "Updated step",
"settings": "{\"script\": \"updated_report.py\"}"
}
],
"triggers": [
{
"triggerId": "11111111-1111-1111-1111-111111111111",
"triggerType": "DailyScheduler",
"frequency": 1,
"startDate": "2024-02-01"
}
]
}
```
All fields are optional - only provided fields will be updated.
### Response (200 OK)
Returns the updated action.
---
## Delete Action
**DELETE** `/api/{tenantId}/{projectId}/action/{actionId}`
Permanently delete an action.
### Path Parameters
| Parameter | Type | Required | Description |
|-----------|------|----------|-------------|
| `tenantId` | GUID | Yes | Your tenant identifier |
| `projectId` | GUID | Yes | Your project identifier |
| `actionId` | GUID | Yes | The action to delete |
### Response (204 No Content)
Empty response on success.
---
## Enable Action
**POST** `/api/{tenantId}/{projectId}/action/{actionId}/enable`
Enable a disabled action.
### Response (200 OK)
Returns the updated action with `isEnabled: true`.
---
## Disable Action
**POST** `/api/{tenantId}/{projectId}/action/{actionId}/disable`
Disable an action.
### Response (200 OK)
Returns the updated action with `isEnabled: false`.
---
## Implementation Examples
### cURL
```bash
# List all actions
curl -X GET "https://your-mindzie-instance.com/api/{tenantId}/{projectId}/action" \
-H "Authorization: Bearer YOUR_API_KEY"
# Create an action
curl -X POST "https://your-mindzie-instance.com/api/{tenantId}/{projectId}/action" \
-H "Authorization: Bearer YOUR_API_KEY" \
-H "Content-Type: application/json" \
-d '{
"name": "Daily Report",
"description": "Generate daily report",
"isEnabled": true,
"steps": [
{
"stepNumber": 1,
"stepType": "Python",
"description": "Run report script",
"settings": "{\"script\": \"daily_report.py\"}"
}
],
"triggers": [
{
"triggerType": "DailyScheduler",
"frequency": 1,
"startDate": "2024-01-15"
}
]
}'
# Update an action
curl -X PUT "https://your-mindzie-instance.com/api/{tenantId}/{projectId}/action/{actionId}" \
-H "Authorization: Bearer YOUR_API_KEY" \
-H "Content-Type: application/json" \
-d '{"name": "Updated Daily Report"}'
# Delete an action
curl -X DELETE "https://your-mindzie-instance.com/api/{tenantId}/{projectId}/action/{actionId}" \
-H "Authorization: Bearer YOUR_API_KEY"
# Enable/Disable action
curl -X POST "https://your-mindzie-instance.com/api/{tenantId}/{projectId}/action/{actionId}/enable" \
-H "Authorization: Bearer YOUR_API_KEY"
curl -X POST "https://your-mindzie-instance.com/api/{tenantId}/{projectId}/action/{actionId}/disable" \
-H "Authorization: Bearer YOUR_API_KEY"
```
### Python
```python
import requests
BASE_URL = 'https://your-mindzie-instance.com'
TENANT_ID = '12345678-1234-1234-1234-123456789012'
PROJECT_ID = '87654321-4321-4321-4321-210987654321'
class ActionManager:
def __init__(self, api_key):
self.headers = {
'Authorization': f'Bearer {api_key}',
'Content-Type': 'application/json'
}
def list_actions(self):
"""List all actions."""
url = f'{BASE_URL}/api/{TENANT_ID}/{PROJECT_ID}/action'
response = requests.get(url, headers=self.headers)
response.raise_for_status()
return response.json()
def get_action(self, action_id):
"""Get action details."""
url = f'{BASE_URL}/api/{TENANT_ID}/{PROJECT_ID}/action/{action_id}'
response = requests.get(url, headers=self.headers)
response.raise_for_status()
return response.json()
def create_action(self, name, steps, description=None, triggers=None):
"""Create a new action."""
url = f'{BASE_URL}/api/{TENANT_ID}/{PROJECT_ID}/action'
data = {
'name': name,
'description': description,
'isEnabled': True,
'steps': steps,
'triggers': triggers or []
}
response = requests.post(url, json=data, headers=self.headers)
response.raise_for_status()
return response.json()
def update_action(self, action_id, **kwargs):
"""Update an action."""
url = f'{BASE_URL}/api/{TENANT_ID}/{PROJECT_ID}/action/{action_id}'
response = requests.put(url, json=kwargs, headers=self.headers)
response.raise_for_status()
return response.json()
def delete_action(self, action_id):
"""Delete an action."""
url = f'{BASE_URL}/api/{TENANT_ID}/{PROJECT_ID}/action/{action_id}'
response = requests.delete(url, headers=self.headers)
response.raise_for_status()
def enable_action(self, action_id):
"""Enable an action."""
url = f'{BASE_URL}/api/{TENANT_ID}/{PROJECT_ID}/action/{action_id}/enable'
response = requests.post(url, headers=self.headers)
response.raise_for_status()
return response.json()
def disable_action(self, action_id):
"""Disable an action."""
url = f'{BASE_URL}/api/{TENANT_ID}/{PROJECT_ID}/action/{action_id}/disable'
response = requests.post(url, headers=self.headers)
response.raise_for_status()
return response.json()
# Usage
manager = ActionManager('your-api-key')
# Create an action
action = manager.create_action(
name='Daily Report',
description='Generate daily analysis report',
steps=[
{
'stepNumber': 1,
'stepType': 'Python',
'description': 'Generate report',
'settings': '{"script": "daily_report.py"}'
}
],
triggers=[
{
'triggerType': 'DailyScheduler',
'frequency': 1,
'startDate': '2024-01-15'
}
]
)
print(f"Created action: {action['actionId']}")
# Disable then enable
manager.disable_action(action['actionId'])
print("Action disabled")
manager.enable_action(action['actionId'])
print("Action enabled")
# Update the action
updated = manager.update_action(action['actionId'], name='Updated Daily Report')
# Delete the action
manager.delete_action(action['actionId'])
print("Action deleted")
```
### JavaScript/Node.js
```javascript
const BASE_URL = 'https://your-mindzie-instance.com';
const TENANT_ID = '12345678-1234-1234-1234-123456789012';
const PROJECT_ID = '87654321-4321-4321-4321-210987654321';
class ActionManager {
constructor(apiKey) {
this.headers = {
'Authorization': `Bearer ${apiKey}`,
'Content-Type': 'application/json'
};
}
async listActions() {
const url = `${BASE_URL}/api/${TENANT_ID}/${PROJECT_ID}/action`;
const response = await fetch(url, { headers: this.headers });
if (!response.ok) throw new Error(`Failed: ${response.status}`);
return response.json();
}
async createAction(name, steps, description = null, triggers = []) {
const url = `${BASE_URL}/api/${TENANT_ID}/${PROJECT_ID}/action`;
const response = await fetch(url, {
method: 'POST',
headers: this.headers,
body: JSON.stringify({ name, description, isEnabled: true, steps, triggers })
});
if (!response.ok) throw new Error(`Failed: ${response.status}`);
return response.json();
}
async updateAction(actionId, updates) {
const url = `${BASE_URL}/api/${TENANT_ID}/${PROJECT_ID}/action/${actionId}`;
const response = await fetch(url, {
method: 'PUT',
headers: this.headers,
body: JSON.stringify(updates)
});
if (!response.ok) throw new Error(`Failed: ${response.status}`);
return response.json();
}
async deleteAction(actionId) {
const url = `${BASE_URL}/api/${TENANT_ID}/${PROJECT_ID}/action/${actionId}`;
const response = await fetch(url, {
method: 'DELETE',
headers: this.headers
});
if (!response.ok) throw new Error(`Failed: ${response.status}`);
}
async enableAction(actionId) {
const url = `${BASE_URL}/api/${TENANT_ID}/${PROJECT_ID}/action/${actionId}/enable`;
const response = await fetch(url, { method: 'POST', headers: this.headers });
if (!response.ok) throw new Error(`Failed: ${response.status}`);
return response.json();
}
async disableAction(actionId) {
const url = `${BASE_URL}/api/${TENANT_ID}/${PROJECT_ID}/action/${actionId}/disable`;
const response = await fetch(url, { method: 'POST', headers: this.headers });
if (!response.ok) throw new Error(`Failed: ${response.status}`);
return response.json();
}
}
// Usage
const manager = new ActionManager('your-api-key');
// Create action
const action = await manager.createAction(
'Daily Report',
[{ stepNumber: 1, stepType: 'Python', description: 'Run script', settings: '{}' }],
'Generate daily report',
[{ triggerType: 'DailyScheduler', frequency: 1, startDate: '2024-01-15' }]
);
// Toggle enable/disable
await manager.disableAction(action.actionId);
await manager.enableAction(action.actionId);
// Delete
await manager.deleteAction(action.actionId);
```
---
## Best Practices
1. **Unique Names**: Action names must be unique within a project
2. **Step Order**: Steps execute in stepNumber order
3. **Enable/Disable**: Use enable/disable endpoints rather than deleting and recreating
4. **Triggers**: Use appropriate trigger types for your scheduling needs
5. **MaxRunTime**: Set reasonable timeouts to prevent runaway actions
---
## Execute
Section: Action
URL: https://docs.mindziestudio.com/mindzie_api/action/execute
Source: /docs-master/mindzieAPI/action/execute/page.md
# Execute Action
Trigger action execution programmatically within mindzieStudio.
## Overview
The Execute Action endpoint allows you to trigger a specific action within mindzieStudio. Actions are queued for asynchronous execution and you receive an execution ID to track progress.
## Execute Action
**GET** `/api/{tenantId}/{projectId}/action/execute/{actionId}`
Execute a specific action by its ID. The action is added to an execution queue and processed asynchronously.
### Request
```http
GET https://your-mindzie-instance.com/api/{tenantId}/{projectId}/action/execute/{actionId}
Authorization: Bearer {your-access-token}
```
### Path Parameters
| Parameter | Type | Required | Description |
|-----------|------|----------|-------------|
| `tenantId` | GUID | Yes | Your tenant identifier |
| `projectId` | GUID | Yes | Your project identifier |
| `actionId` | GUID | Yes | The action to execute |
### Response
**Success (200 OK):**
```json
{
"actionId": "87654321-4321-4321-4321-210987654321",
"actionExecutionId": "11111111-2222-3333-4444-555555555555",
"dateStarted": "2024-01-15T10:30:00Z",
"dateEnded": null,
"status": "Queued",
"notes": null
}
```
### Response Fields
| Field | Type | Description |
|-------|------|-------------|
| `actionId` | GUID | The ID of the action being executed |
| `actionExecutionId` | GUID | Unique identifier for this execution instance |
| `dateStarted` | datetime | When the execution was queued |
| `dateEnded` | datetime | When execution completed (null if still running) |
| `status` | string | Current execution status |
| `notes` | string | Additional execution notes or error messages |
### Error Responses
**Action Not Found (404):**
```json
{
"error": "Action not found",
"actionId": "87654321-4321-4321-4321-210987654321"
}
```
**Execution Creation Failed (404):**
```json
{
"error": "Action can't create execution",
"actionId": "87654321-4321-4321-4321-210987654321"
}
```
**Unauthorized (401):**
```
HTTP/1.1 401 Unauthorized
{error message describing authorization failure}
```
## Execution Status Values
| Status | Description |
|--------|-------------|
| Queued | Action is queued and waiting to be processed |
| Running | Action is currently executing |
| Completed | Action completed successfully |
| Failed | Action execution failed |
## Implementation Examples
### cURL
```bash
curl -X GET "https://your-mindzie-instance.com/api/12345678-1234-1234-1234-123456789012/87654321-4321-4321-4321-210987654321/action/execute/aaaaaaaa-bbbb-cccc-dddd-eeeeeeeeeeee" \
-H "Authorization: Bearer YOUR_ACCESS_TOKEN"
```
### JavaScript/Node.js
```javascript
const TENANT_ID = '12345678-1234-1234-1234-123456789012';
const PROJECT_ID = '87654321-4321-4321-4321-210987654321';
const BASE_URL = 'https://your-mindzie-instance.com';
const executeAction = async (actionId, token) => {
const url = `${BASE_URL}/api/${TENANT_ID}/${PROJECT_ID}/action/execute/${actionId}`;
try {
const response = await fetch(url, {
method: 'GET',
headers: {
'Authorization': `Bearer ${token}`
}
});
if (response.ok) {
const result = await response.json();
console.log('Action queued:', result);
console.log('Execution ID:', result.actionExecutionId);
return result;
} else if (response.status === 404) {
const error = await response.json();
console.error('Action not found:', error);
throw new Error(error.error);
} else {
throw new Error(`Execution failed: ${response.status}`);
}
} catch (error) {
console.error('Error executing action:', error);
throw error;
}
};
// Example usage
executeAction('aaaaaaaa-bbbb-cccc-dddd-eeeeeeeeeeee', 'your_token')
.then(result => {
// Store actionExecutionId for tracking
const executionId = result.actionExecutionId;
});
```
### Python
```python
import requests
TENANT_ID = '12345678-1234-1234-1234-123456789012'
PROJECT_ID = '87654321-4321-4321-4321-210987654321'
BASE_URL = 'https://your-mindzie-instance.com'
def execute_action(action_id, token):
"""Execute an action and return execution details."""
url = f'{BASE_URL}/api/{TENANT_ID}/{PROJECT_ID}/action/execute/{action_id}'
headers = {
'Authorization': f'Bearer {token}'
}
response = requests.get(url, headers=headers)
if response.ok:
result = response.json()
print(f'Action queued: {result}')
print(f'Execution ID: {result["actionExecutionId"]}')
return result
elif response.status_code == 404:
error = response.json()
print(f'Action not found: {error}')
raise Exception(error['error'])
else:
raise Exception(f'Execution failed: {response.status_code}')
# Example usage
result = execute_action('aaaaaaaa-bbbb-cccc-dddd-eeeeeeeeeeee', 'your_token')
execution_id = result['actionExecutionId']
```
### C#
```csharp
using System;
using System.Net.Http;
using System.Text.Json;
using System.Threading.Tasks;
public class ActionExecutionResult
{
public Guid ActionId { get; set; }
public Guid ActionExecutionId { get; set; }
public DateTime? DateStarted { get; set; }
public DateTime? DateEnded { get; set; }
public string Status { get; set; }
public string Notes { get; set; }
}
public class ActionApiClient
{
private readonly HttpClient _httpClient;
private readonly string _baseUrl;
private readonly Guid _tenantId;
private readonly Guid _projectId;
public ActionApiClient(string baseUrl, Guid tenantId, Guid projectId, string accessToken)
{
_baseUrl = baseUrl;
_tenantId = tenantId;
_projectId = projectId;
_httpClient = new HttpClient();
_httpClient.DefaultRequestHeaders.Authorization =
new System.Net.Http.Headers.AuthenticationHeaderValue("Bearer", accessToken);
}
public async Task ExecuteActionAsync(Guid actionId)
{
var url = $"{_baseUrl}/api/{_tenantId}/{_projectId}/action/execute/{actionId}";
var response = await _httpClient.GetAsync(url);
if (response.IsSuccessStatusCode)
{
var json = await response.Content.ReadAsStringAsync();
var result = JsonSerializer.Deserialize(json,
new JsonSerializerOptions { PropertyNameCaseInsensitive = true });
Console.WriteLine($"Action queued. Execution ID: {result.ActionExecutionId}");
return result;
}
else if (response.StatusCode == System.Net.HttpStatusCode.NotFound)
{
throw new Exception($"Action {actionId} not found");
}
else
{
throw new Exception($"Execution failed: {response.StatusCode}");
}
}
}
```
## Best Practices
- **Store Execution ID:** Always store the `actionExecutionId` returned to track execution progress
- **Check Action Exists:** Use the Get Action endpoint first to verify the action exists and is enabled
- **Handle Async Nature:** Actions execute asynchronously - the response indicates the action was queued, not completed
- **Error Handling:** Implement proper error handling for 404 responses (action not found) and 401 (unauthorized)
- **Idempotency:** Each call creates a new execution - avoid duplicate calls if not intended
---
## Execution History
Section: Action
URL: https://docs.mindziestudio.com/mindzie_api/action/history
Source: /docs-master/mindzieAPI/action/history/page.md
# Action Execution History
Track and monitor action execution history and download result packages.
## Overview
The Action Execution API provides endpoints for tracking action execution history, monitoring status, and downloading execution results. This API uses a separate controller from the main Actions API.
**Base URL:** `/api/{tenantId}/{projectId}/actionexecution`
## Get Execution History for an Action
**GET** `/api/{tenantId}/{projectId}/actionexecution/action/{actionId}`
Retrieve all execution history for a specific action.
### Request
```http
GET https://your-mindzie-instance.com/api/{tenantId}/{projectId}/actionexecution/action/{actionId}
Authorization: Bearer {your-access-token}
```
### Path Parameters
| Parameter | Type | Required | Description |
|-----------|------|----------|-------------|
| `tenantId` | GUID | Yes | Your tenant identifier |
| `projectId` | GUID | Yes | Your project identifier |
| `actionId` | GUID | Yes | The action to get execution history for |
### Response
**Success (200 OK):**
```json
{
"items": [
{
"actionId": "aaaaaaaa-bbbb-cccc-dddd-eeeeeeeeeeee",
"actionExecutionId": "11111111-2222-3333-4444-555555555555",
"dateStarted": "2024-01-15T10:30:00Z",
"dateEnded": "2024-01-15T10:32:15Z",
"status": "Completed",
"notes": null
},
{
"actionId": "aaaaaaaa-bbbb-cccc-dddd-eeeeeeeeeeee",
"actionExecutionId": "22222222-3333-4444-5555-666666666666",
"dateStarted": "2024-01-14T10:30:00Z",
"dateEnded": "2024-01-14T10:31:45Z",
"status": "Completed",
"notes": null
}
]
}
```
## Get Last Execution for an Action
**GET** `/api/{tenantId}/{projectId}/actionexecution/lastaction/{actionId}`
Retrieve the most recent execution for a specific action.
### Request
```http
GET https://your-mindzie-instance.com/api/{tenantId}/{projectId}/actionexecution/lastaction/{actionId}
Authorization: Bearer {your-access-token}
```
### Path Parameters
| Parameter | Type | Required | Description |
|-----------|------|----------|-------------|
| `tenantId` | GUID | Yes | Your tenant identifier |
| `projectId` | GUID | Yes | Your project identifier |
| `actionId` | GUID | Yes | The action to get the last execution for |
### Response
**Success (200 OK):**
```json
{
"actionId": "aaaaaaaa-bbbb-cccc-dddd-eeeeeeeeeeee",
"actionExecutionId": "11111111-2222-3333-4444-555555555555",
"dateStarted": "2024-01-15T10:30:00Z",
"dateEnded": "2024-01-15T10:32:15Z",
"status": "Completed",
"notes": null
}
```
**Not Found (404):**
```json
{
"error": "Can't find action",
"actionId": "aaaaaaaa-bbbb-cccc-dddd-eeeeeeeeeeee"
}
```
## Get Specific Execution Details
**GET** `/api/{tenantId}/{projectId}/actionexecution/{executionId}`
Retrieve details for a specific execution by its execution ID.
### Request
```http
GET https://your-mindzie-instance.com/api/{tenantId}/{projectId}/actionexecution/{executionId}
Authorization: Bearer {your-access-token}
```
### Path Parameters
| Parameter | Type | Required | Description |
|-----------|------|----------|-------------|
| `tenantId` | GUID | Yes | Your tenant identifier |
| `projectId` | GUID | Yes | Your project identifier |
| `executionId` | GUID | Yes | The execution to retrieve |
### Response
**Success (200 OK):**
```json
{
"actionId": "aaaaaaaa-bbbb-cccc-dddd-eeeeeeeeeeee",
"actionExecutionId": "11111111-2222-3333-4444-555555555555",
"dateStarted": "2024-01-15T10:30:00Z",
"dateEnded": "2024-01-15T10:32:15Z",
"status": "Completed",
"notes": null
}
```
**Not Found (404):**
```json
{
"error": "Can't find action",
"executionId": "11111111-2222-3333-4444-555555555555"
}
```
## Download Execution Package
**GET** `/api/{tenantId}/{projectId}/actionexecution/downloadpackage/{executionId}`
Download the results package (ZIP file) for a completed execution.
### Request
```http
GET https://your-mindzie-instance.com/api/{tenantId}/{projectId}/actionexecution/downloadpackage/{executionId}
Authorization: Bearer {your-access-token}
```
### Path Parameters
| Parameter | Type | Required | Description |
|-----------|------|----------|-------------|
| `tenantId` | GUID | Yes | Your tenant identifier |
| `projectId` | GUID | Yes | Your project identifier |
| `executionId` | GUID | Yes | The execution to download results for |
### Response
**Success (200 OK):**
Returns a ZIP file download containing execution results, reports, and artifacts.
```
HTTP/1.1 200 OK
Content-Type: application/zip
Content-Disposition: attachment; filename="{executionId}.zip"
[binary ZIP file content]
```
**Not Found (404):**
```json
{
"error": "Execution not found",
"executionId": "11111111-2222-3333-4444-555555555555"
}
```
```json
{
"error": "Zip file not found",
"executionId": "11111111-2222-3333-4444-555555555555"
}
```
## Execution Response Fields
| Field | Type | Description |
|-------|------|-------------|
| `actionId` | GUID | The action that was executed |
| `actionExecutionId` | GUID | Unique identifier for this execution |
| `dateStarted` | datetime | When execution started |
| `dateEnded` | datetime | When execution completed (null if still running) |
| `status` | string | Current execution status |
| `notes` | string | Execution notes or error messages |
## Execution Status Values
| Status | Description |
|--------|-------------|
| Queued | Execution is queued, waiting to start |
| Running | Execution is currently in progress |
| Completed | Execution finished successfully |
| Failed | Execution encountered an error |
## Implementation Examples
### cURL
```bash
# Get execution history for an action
curl -X GET "https://your-mindzie-instance.com/api/12345678-1234-1234-1234-123456789012/87654321-4321-4321-4321-210987654321/actionexecution/action/aaaaaaaa-bbbb-cccc-dddd-eeeeeeeeeeee" \
-H "Authorization: Bearer YOUR_ACCESS_TOKEN"
# Get last execution
curl -X GET "https://your-mindzie-instance.com/api/12345678-1234-1234-1234-123456789012/87654321-4321-4321-4321-210987654321/actionexecution/lastaction/aaaaaaaa-bbbb-cccc-dddd-eeeeeeeeeeee" \
-H "Authorization: Bearer YOUR_ACCESS_TOKEN"
# Get specific execution
curl -X GET "https://your-mindzie-instance.com/api/12345678-1234-1234-1234-123456789012/87654321-4321-4321-4321-210987654321/actionexecution/11111111-2222-3333-4444-555555555555" \
-H "Authorization: Bearer YOUR_ACCESS_TOKEN"
# Download execution package
curl -X GET "https://your-mindzie-instance.com/api/12345678-1234-1234-1234-123456789012/87654321-4321-4321-4321-210987654321/actionexecution/downloadpackage/11111111-2222-3333-4444-555555555555" \
-H "Authorization: Bearer YOUR_ACCESS_TOKEN" \
-o execution_results.zip
```
### JavaScript/Node.js
```javascript
const TENANT_ID = '12345678-1234-1234-1234-123456789012';
const PROJECT_ID = '87654321-4321-4321-4321-210987654321';
const BASE_URL = 'https://your-mindzie-instance.com';
// Get execution history for an action
const getExecutionHistory = async (actionId, token) => {
const url = `${BASE_URL}/api/${TENANT_ID}/${PROJECT_ID}/actionexecution/action/${actionId}`;
const response = await fetch(url, {
headers: { 'Authorization': `Bearer ${token}` }
});
if (response.ok) {
const result = await response.json();
return result.items;
}
throw new Error(`Failed: ${response.status}`);
};
// Get last execution for an action
const getLastExecution = async (actionId, token) => {
const url = `${BASE_URL}/api/${TENANT_ID}/${PROJECT_ID}/actionexecution/lastaction/${actionId}`;
const response = await fetch(url, {
headers: { 'Authorization': `Bearer ${token}` }
});
if (response.ok) {
return await response.json();
} else if (response.status === 404) {
return null;
}
throw new Error(`Failed: ${response.status}`);
};
// Get specific execution details
const getExecution = async (executionId, token) => {
const url = `${BASE_URL}/api/${TENANT_ID}/${PROJECT_ID}/actionexecution/${executionId}`;
const response = await fetch(url, {
headers: { 'Authorization': `Bearer ${token}` }
});
if (response.ok) {
return await response.json();
}
throw new Error(`Failed: ${response.status}`);
};
// Download execution package
const downloadPackage = async (executionId, token) => {
const url = `${BASE_URL}/api/${TENANT_ID}/${PROJECT_ID}/actionexecution/downloadpackage/${executionId}`;
const response = await fetch(url, {
headers: { 'Authorization': `Bearer ${token}` }
});
if (response.ok) {
const blob = await response.blob();
// Save or process the ZIP file
return blob;
}
throw new Error(`Failed: ${response.status}`);
};
```
### Python
```python
import requests
TENANT_ID = '12345678-1234-1234-1234-123456789012'
PROJECT_ID = '87654321-4321-4321-4321-210987654321'
BASE_URL = 'https://your-mindzie-instance.com'
def get_execution_history(action_id, token):
"""Get all executions for an action."""
url = f'{BASE_URL}/api/{TENANT_ID}/{PROJECT_ID}/actionexecution/action/{action_id}'
headers = {'Authorization': f'Bearer {token}'}
response = requests.get(url, headers=headers)
response.raise_for_status()
return response.json()['items']
def get_last_execution(action_id, token):
"""Get the most recent execution for an action."""
url = f'{BASE_URL}/api/{TENANT_ID}/{PROJECT_ID}/actionexecution/lastaction/{action_id}'
headers = {'Authorization': f'Bearer {token}'}
response = requests.get(url, headers=headers)
if response.status_code == 404:
return None
response.raise_for_status()
return response.json()
def get_execution(execution_id, token):
"""Get details for a specific execution."""
url = f'{BASE_URL}/api/{TENANT_ID}/{PROJECT_ID}/actionexecution/{execution_id}'
headers = {'Authorization': f'Bearer {token}'}
response = requests.get(url, headers=headers)
response.raise_for_status()
return response.json()
def download_package(execution_id, token, output_path):
"""Download the execution results package."""
url = f'{BASE_URL}/api/{TENANT_ID}/{PROJECT_ID}/actionexecution/downloadpackage/{execution_id}'
headers = {'Authorization': f'Bearer {token}'}
response = requests.get(url, headers=headers)
response.raise_for_status()
with open(output_path, 'wb') as f:
f.write(response.content)
return output_path
# Example: Monitor execution until complete
def wait_for_completion(execution_id, token, max_wait_seconds=300):
import time
start_time = time.time()
while time.time() - start_time < max_wait_seconds:
execution = get_execution(execution_id, token)
status = execution['status']
if status == 'Completed':
print(f'Execution completed successfully')
return execution
elif status == 'Failed':
print(f'Execution failed: {execution.get("notes", "Unknown error")}')
return execution
else:
print(f'Status: {status}, waiting...')
time.sleep(5)
raise TimeoutError('Execution did not complete within timeout')
```
## Best Practices
- **Poll for Status:** After executing an action, poll the execution endpoint to monitor progress
- **Handle Long-Running Actions:** Use appropriate timeouts when waiting for completion
- **Download Results:** For actions that produce output, download the package after completion
- **Error Handling:** Check the `notes` field for error details when status is "Failed"
- **Execution History:** Use history endpoints for auditing and debugging past executions
---
## Overview
Section: AI Coding Tools
URL: https://docs.mindziestudio.com/mindzie_api/llm-access/overview
Source: /docs-master/mindzieAPI/llm-access/overview/page.md
# AI Coding Tools
**Make your AI assistant understand the mindzieAPI instantly**
Modern AI coding tools like Claude Code, Cursor, Windsurf, and GitHub Copilot can read documentation directly from URLs. We provide LLM-optimized documentation files that give your AI coding assistant complete knowledge of the mindzieAPI.
## Quick Reference
Copy these URLs to configure your AI coding tools:
| Resource | URL | Best For |
|----------|-----|----------|
| **Full Documentation** | `https://docs.mindziestudio.com/llms-full.txt` | Complete API understanding (~120K tokens) |
| **Documentation Index** | `https://docs.mindziestudio.com/llms.txt` | Quick reference with links to pages |
---
## Claude Code
Claude Code can access documentation using WebFetch or custom instructions.
### Method 1: WebFetch (Recommended)
In a Claude Code session, fetch the complete documentation:
```
Please read the mindzieAPI documentation from https://docs.mindziestudio.com/llms-full.txt
```
Claude will fetch and read the entire API documentation. You can then ask questions about endpoints, authentication, request/response formats, and get code examples.
### Method 2: Add to Project Instructions
For persistent access across sessions, add to your project's `CLAUDE.md` or `.claude/settings.json`:
```markdown
## mindzieAPI Reference
When working with the mindzieAPI, fetch documentation from:
https://docs.mindziestudio.com/llms-full.txt
This contains complete API documentation including:
- Authentication (Bearer tokens, API keys)
- All endpoints (tenants, users, projects, datasets, blocks, dashboards)
- Request/response formats
- Code examples in multiple languages
```
### Example Prompts
Once Claude has the documentation, you can ask:
- "How do I authenticate with the mindzieAPI?"
- "Write Python code to create a new dataset"
- "What's the endpoint for executing a block?"
- "Show me how to upload a CSV file to a project"
---
## Cursor IDE
Cursor can index documentation using the @docs feature for instant access during coding.
### Setup Steps
1. Open **Cursor Settings** (Cmd/Ctrl + ,)
2. Navigate to **Features** > **Docs**
3. Click **Add new doc**
4. Enter URL: `https://docs.mindziestudio.com/llms-full.txt`
5. Name it: `mindzieAPI`
### Usage
Reference the documentation in Cursor chat:
```
@mindzieAPI How do I authenticate API requests?
```
```
@mindzieAPI Write a function to list all projects in a tenant
```
---
## Windsurf
Windsurf supports external documentation sources for AI-assisted coding.
### Setup
1. Open Windsurf settings
2. Navigate to the knowledge base or documentation section
3. Add `https://docs.mindziestudio.com/llms-full.txt` as an external source
### Usage
When coding, Windsurf will automatically reference the mindzieAPI documentation to provide accurate suggestions and completions.
---
## GitHub Copilot
While Copilot doesn't directly fetch URLs, you can provide context through project files.
### Option 1: Include in Project
Create a `docs/mindzieAPI.md` file in your project with the API reference. Copilot will use this as context when you're working in that project.
### Option 2: Copilot Chat
In GitHub Copilot Chat, paste key sections of the documentation or reference the URL:
```
Using the mindzieAPI documented at https://docs.mindziestudio.com/llms-full.txt,
write a Python class to manage datasets.
```
---
## Cody (Sourcegraph)
Cody can index external documentation for context-aware assistance.
### Setup
1. Open Cody settings
2. Add `https://docs.mindziestudio.com/llms-full.txt` to your context sources
3. The documentation will be available across your coding sessions
---
## Generic LLM Usage
For any LLM interface (ChatGPT, Claude web, etc.), you can:
1. **Fetch the index first:** Visit `https://docs.mindziestudio.com/llms.txt` to see the documentation structure
2. **Get complete docs:** Copy the content from `https://docs.mindziestudio.com/llms-full.txt` into your LLM context
3. **Ask questions:** The LLM now understands the entire mindzieAPI
---
## What's Included
The LLM documentation covers all mindzieAPI capabilities:
| Category | Coverage |
|----------|----------|
| **Authentication** | API keys (Global and Tenant), Bearer tokens, scopes, security best practices |
| **Tenants** | Multi-tenant management, creation, updates, deletion with safeguards |
| **Users** | Global operations, tenant-scoped operations, roles and permissions |
| **Projects** | CRUD operations, caching, user access, import/export (.mpz files) |
| **Datasets** | Creation, CSV/XES import, updates, column mapping, file formats |
| **Blocks** | Analysis blocks, execution, results retrieval, block types |
| **Dashboards** | Management, panel configuration, sharing and public URLs |
| **Enrichments** | Pipelines, Python notebook integration, execution |
| **Actions** | Named action execution, ping endpoints, execution history |
| **Execution** | Async job management, queue operations, status tracking |
---
## Context Window Considerations
Different AI models have different context limits. Here's how our documentation files fit:
| Model | Context Limit | llms-full.txt | Recommendation |
|-------|--------------|---------------|----------------|
| Claude Opus 4 | 200K tokens | Fits (~120K) | Use full documentation |
| Claude Sonnet | 200K tokens | Fits (~120K) | Use full documentation |
| GPT-4 Turbo | 128K tokens | Tight fit | Use full documentation |
| GPT-4o | 128K tokens | Tight fit | Use full documentation |
| Claude Haiku | 200K tokens | Fits (~120K) | Use full documentation |
| Gemini Pro | 128K tokens | Tight fit | May need index + specific pages |
| GPT-3.5 | 16K tokens | Too large | Use index, fetch specific pages |
### For Smaller Context Windows
If your model has limited context:
1. Use `llms.txt` (the index) to understand the API structure
2. Identify which sections you need
3. Fetch individual markdown files from `/docs-master/mindzieAPI/{category}/{page}/page.md`
---
## File Formats
| URL | Format | Size | Tokens |
|-----|--------|------|--------|
| `/llms.txt` | Markdown (index) | ~6 KB | ~1.5K |
| `/llms-full.txt` | Markdown (complete) | ~470 KB | ~120K |
| `/docs-master/.../*.md` | Markdown (individual pages) | 2-15 KB each | ~500-4K each |
---
## Keeping Documentation Current
The LLM documentation is regenerated whenever the API documentation is updated. The files include a timestamp showing when they were last generated.
For the most current documentation, your AI tool should fetch fresh copies rather than caching indefinitely.
---
## MCP Server Integration
For advanced AI tool integration, the mindzieAPI provides an MCP (Model Context Protocol) server that enables AI assistants to interact with mindzieStudio programmatically.
The MCP server includes tools like `mindzie_list_block_types` with a `unified` category parameter that returns all block types (filters, calculators, and enrichments) with complete metadata in a single call.
[View MCP Server Documentation](/mindzie_api/llm-access/mcp-server)
---
## Next Steps
Ready to start coding with AI assistance? Here are some things to try:
1. Point your AI coding tool to `https://docs.mindziestudio.com/llms-full.txt`
2. Ask: "How do I authenticate with the mindzieAPI?"
3. Request: "Write Python code to list all projects"
4. Build: Complete integrations with AI-assisted code generation
For human-readable documentation, see the [Quick Start Guide](/mindzie_api/quick-start) or explore the full [API Reference](/mindzie_api).
---
## MCP Server
Section: AI Coding Tools
URL: https://docs.mindziestudio.com/mindzie_api/llm-access/mcp-server
Source: /docs-master/mindzieAPI/llm-access/mcp-server/page.md
# MCP Server
## Model Context Protocol Integration
The mindzieAPI MCP server enables AI coding assistants to interact with mindzieStudio programmatically. MCP (Model Context Protocol) provides a standardized way for AI tools to access external capabilities.
## Available Tools
The MCP server exposes the following tools for AI assistants:
### mindzie_list_block_types
Retrieve information about available block types (filters, calculators, enrichments).
#### Parameters
| Parameter | Type | Required | Description |
|-----------|------|----------|-------------|
| `category` | String | No | Filter by category: "filters", "calculators", "unified", or omit for filters only |
#### Category Options
| Value | Returns |
|-------|---------|
| `"filters"` | Filter block types only (default) |
| `"calculators"` | Calculator block types only |
| `"unified"` | All block types including enrichments, grouped by category |
#### Example: Get All Block Types (Recommended)
```
mindzie_list_block_types category="unified"
```
Returns complete metadata for all block types:
```json
{
"BlockTypes": [
{
"OperatorName": "CaseAttributeFilter",
"DisplayName": "Case Attribute Filter",
"Description": "Filter cases based on attribute values",
"Category": "Attribute Filters",
"BlockType": "Filter",
"DocumentationUrl": "/mindzie_studio/filters/case-attribute-filter",
"UsageFrequency": "High",
"CommonUseCases": ["Filter by customer segment", "Focus on specific regions"]
},
{
"OperatorName": "CaseDurationCalculator",
"DisplayName": "Case Duration Calculator",
"Description": "Calculate the total duration of cases",
"Category": "Time Calculators",
"BlockType": "Calculator",
"DocumentationUrl": "/mindzie_studio/calculators/case-duration-calculator",
"UsageFrequency": "High",
"CommonUseCases": ["Analyze cycle times", "Identify slow cases"]
},
{
"OperatorName": "CaseStageCalculator",
"DisplayName": "Case Stage Calculator",
"Description": "Assign stage labels to cases based on activity patterns",
"Category": "Stage Analysis",
"BlockType": "Enrichment",
"DocumentationUrl": "/mindzie_studio/enrichments/case-stage-calculator",
"UsageFrequency": "Medium",
"CommonUseCases": ["Track case progress", "Monitor stage transitions"]
}
],
"Categories": ["Attribute Filters", "Time Filters", "Time Calculators", "Stage Analysis"],
"TotalCount": 45,
"ByBlockCategory": {
"Filter": [...],
"Calculator": [...],
"Enrichment": [...]
}
}
```
#### Example: Get Filters Only
```
mindzie_list_block_types category="filters"
```
#### Example: Get Calculators Only
```
mindzie_list_block_types category="calculators"
```
### mindzie_list_projects
List available projects in the current tenant.
#### Parameters
| Parameter | Type | Required | Description |
|-----------|------|----------|-------------|
| `tenant_id` | String | Yes | The tenant identifier |
### mindzie_get_project
Get details about a specific project.
#### Parameters
| Parameter | Type | Required | Description |
|-----------|------|----------|-------------|
| `tenant_id` | String | Yes | The tenant identifier |
| `project_id` | String | Yes | The project identifier |
### mindzie_execute_block
Execute a block and return results.
#### Parameters
| Parameter | Type | Required | Description |
|-----------|------|----------|-------------|
| `tenant_id` | String | Yes | The tenant identifier |
| `project_id` | String | Yes | The project identifier |
| `block_id` | String | Yes | The block to execute |
### mindzie_generate_url
Generate URLs to mindzieStudio pages and entities for navigation or sharing.
#### Parameters
| Parameter | Type | Required | Description |
|-----------|------|----------|-------------|
| `type` | String | Yes | URL type (see URL Types below) |
| `entity_id` | String | Conditional | Entity ID for entity-specific pages |
| `parent_id` | String | Conditional | Parent ID (projectId or notebookId) |
#### URL Types
**List Pages** (no entity_id required):
| Type | parent_id | Description |
|------|-----------|-------------|
| `projects` | - | Projects list |
| `apps` | - | Apps list |
| `investigations` | projectId | Investigations for a project |
| `dashboards-list` | projectId | Dashboards list for a project |
| `datasets` | projectId | Datasets for a project |
| `actions` | projectId | Actions for a project |
| `bpmn` | projectId | BPMN editor for a project |
**Entity Pages** (entity_id required):
| Type | entity_id | parent_id | Description |
|------|-----------|-----------|-------------|
| `dashboard` | dashboardId | - | Single dashboard |
| `analysis` | notebookId | - | Notebook/analysis page |
| `block` | blockId | notebookId | Specific block |
| `enrichment` | enrichmentId | projectId (optional) | Enrichment notebook |
#### Example: Get Dashboard URL
```
mindzie_generate_url type="dashboard" entity_id="{dashboardId}"
```
Returns:
```json
{
"url": "https://host/navigate?type=dashboard&id=...",
"entityType": "dashboard",
"entityId": "...",
"tenantId": "..."
}
```
#### Example: Get Block URL
```
mindzie_generate_url type="block" entity_id="{blockId}" parent_id="{notebookId}"
```
#### Example: Get Investigations List URL
```
mindzie_generate_url type="investigations" parent_id="{projectId}"
```
## Prerequisites
Before setting up the MCP server, ensure you have:
1. **Node.js 18 or later** - Download from [nodejs.org](https://nodejs.org)
2. **A mindzie API token** - Generate from your mindzieStudio account settings
3. **Your mindzieStudio instance URL** - Either `https://www.mindziestudio.com` (cloud) or your on-premise URL
## Installation
The mindzie MCP server is installed automatically via npx - no manual installation required:
```bash
npx -y @mindzie/mcp-server
```
## Environment Variables
| Variable | Required | Description |
|----------|----------|-------------|
| `MINDZIE_API_URL` | Yes | Your mindzieStudio instance URL |
| `MINDZIE_API_TOKEN` | Yes | Your API authentication token |
---
## Setup by Application
### Claude Desktop
Claude Desktop is Anthropic's desktop application for Claude AI.
**Windows Configuration**
Edit the configuration file at:
```
%APPDATA%\Claude\claude_desktop_config.json
```
Add the mindzie MCP server:
```json
{
"mcpServers": {
"mindzie": {
"command": "npx",
"args": ["-y", "@mindzie/mcp-server"],
"env": {
"MINDZIE_API_URL": "https://www.mindziestudio.com",
"MINDZIE_API_TOKEN": "your-api-token-here"
}
}
}
}
```
**macOS Configuration**
Edit the configuration file at:
```
~/Library/Application Support/Claude/claude_desktop_config.json
```
Add the same configuration as Windows above.
**After Configuration**
1. Save the configuration file
2. Restart Claude Desktop completely (quit and reopen)
3. Look for the hammer icon in the chat interface - this indicates MCP tools are available
---
### Claude Code (CLI)
Claude Code is Anthropic's command-line interface for Claude AI.
**Add the MCP Server**
Run this command to register the mindzie MCP server:
```bash
claude mcp add mindzie -- npx -y @mindzie/mcp-server
```
**Set Environment Variables**
Windows (PowerShell):
```powershell
$env:MINDZIE_API_URL = "https://www.mindziestudio.com"
$env:MINDZIE_API_TOKEN = "your-api-token-here"
```
Windows (Command Prompt):
```cmd
set MINDZIE_API_URL=https://www.mindziestudio.com
set MINDZIE_API_TOKEN=your-api-token-here
```
macOS/Linux:
```bash
export MINDZIE_API_URL="https://www.mindziestudio.com"
export MINDZIE_API_TOKEN="your-api-token-here"
```
**Persistent Configuration**
Add the environment variables to your shell profile (`.bashrc`, `.zshrc`, or PowerShell profile) for persistence.
---
### Cursor IDE
Cursor is an AI-powered code editor built on VS Code.
**Configuration File Location**
Create or edit `.cursor/mcp.json` in your home directory or project root:
```json
{
"mcpServers": {
"mindzie": {
"command": "npx",
"args": ["-y", "@mindzie/mcp-server"],
"env": {
"MINDZIE_API_URL": "https://www.mindziestudio.com",
"MINDZIE_API_TOKEN": "your-api-token-here"
}
}
}
}
```
**Alternative: Settings UI**
1. Open Cursor
2. Go to **Settings** (Ctrl/Cmd + ,)
3. Search for "MCP"
4. Click **Edit in settings.json**
5. Add the mindzie server configuration
**Verify Setup**
After configuration, restart Cursor and check that mindzie tools appear in the AI assistant's available tools.
---
### Windsurf (Codeium)
Windsurf is Codeium's AI-powered IDE.
**Configuration File Location**
Create or edit the MCP configuration file:
Windows:
```
%USERPROFILE%\.codeium\windsurf\mcp_config.json
```
macOS/Linux:
```
~/.codeium/windsurf/mcp_config.json
```
**Configuration**
```json
{
"mcpServers": {
"mindzie": {
"command": "npx",
"args": ["-y", "@mindzie/mcp-server"],
"env": {
"MINDZIE_API_URL": "https://www.mindziestudio.com",
"MINDZIE_API_TOKEN": "your-api-token-here"
}
}
}
}
```
**Verify Setup**
1. Restart Windsurf
2. Open the Cascade panel
3. The mindzie tools should be available for process mining queries
---
### VS Code with Continue Extension
Continue is an open-source AI coding assistant for VS Code.
**Install Continue**
1. Open VS Code
2. Go to Extensions (Ctrl/Cmd + Shift + X)
3. Search for "Continue" and install it
**Configure MCP Server**
Edit Continue's configuration file:
Windows:
```
%USERPROFILE%\.continue\config.json
```
macOS/Linux:
```
~/.continue/config.json
```
Add the MCP server to the `mcpServers` section:
```json
{
"mcpServers": [
{
"name": "mindzie",
"command": "npx",
"args": ["-y", "@mindzie/mcp-server"],
"env": {
"MINDZIE_API_URL": "https://www.mindziestudio.com",
"MINDZIE_API_TOKEN": "your-api-token-here"
}
}
]
}
```
**Verify Setup**
1. Restart VS Code
2. Open the Continue panel
3. Type `/tools` to see available MCP tools including mindzie
---
## Troubleshooting
### MCP Server Not Connecting
1. **Verify Node.js installation**: Run `node --version` (must be 18+)
2. **Test the server manually**: Run `npx -y @mindzie/mcp-server` in terminal
3. **Check environment variables**: Ensure both `MINDZIE_API_URL` and `MINDZIE_API_TOKEN` are set
4. **Restart the application**: Close completely and reopen
### Authentication Errors
1. **Verify your API token**: Tokens may expire or be revoked
2. **Check token permissions**: Ensure the token has access to required resources
3. **Verify the URL**: Confirm `MINDZIE_API_URL` points to your correct instance
### Tools Not Appearing
1. **Check configuration syntax**: Ensure JSON is valid (no trailing commas)
2. **Verify file location**: Configuration file must be in the correct path
3. **Check application logs**: Look for MCP-related error messages
4. **Restart completely**: Some applications cache MCP configurations
### Common Configuration Mistakes
| Mistake | Solution |
|---------|----------|
| Missing `-y` flag in npx args | Add `-y` to skip confirmation: `["-y", "@mindzie/mcp-server"]` |
| Trailing comma in JSON | Remove trailing commas from JSON objects |
| Wrong config file location | Double-check the path for your OS |
| Token contains special characters | Ensure token is properly quoted in JSON |
---
## Security Best Practices
1. **Never commit tokens to version control** - Use environment variables or secrets managers
2. **Use project-specific tokens** - Create separate tokens for different projects
3. **Rotate tokens regularly** - Especially for production environments
4. **Restrict token permissions** - Only grant access to required resources
5. **Monitor token usage** - Review API access logs periodically
## Unified Discovery for AI Assistants
The `unified` category parameter is designed specifically for AI assistants. When an AI needs to understand what analysis capabilities are available, it can make a single MCP call:
```
mindzie_list_block_types category="unified"
```
This returns everything the AI needs to:
1. **Understand available capabilities**: All filters, calculators, and enrichments
2. **Select appropriate block types**: Based on `UsageFrequency` and `CommonUseCases`
3. **Link to documentation**: Each block type includes `DocumentationUrl`
4. **Identify relationships**: The `RelatedBlocks` field suggests complementary block types
### Example AI Workflow
An AI assistant helping a user analyze process duration might:
1. Call `mindzie_list_block_types category="unified"` to discover capabilities
2. Find block types where `CommonUseCases` contains "duration"
3. Suggest the `CaseDurationCalculator` and `WaitTimeCalculator`
4. Create the appropriate blocks using the API
5. Execute and interpret results
## Response Field Reference
When using `category="unified"`, each block type includes:
| Field | Description | AI Use |
|-------|-------------|--------|
| `OperatorName` | Technical identifier | Use when creating blocks via API |
| `DisplayName` | Human-readable name | Show to users |
| `Description` | Brief description | Help users understand purpose |
| `Category` | Functional grouping | Organize suggestions |
| `BlockType` | Filter/Calculator/Enrichment | Determine usage context |
| `DocumentationUrl` | Link to docs | Fetch detailed information |
| `UsageFrequency` | High/Medium/Low | Prioritize common blocks |
| `CommonUseCases` | Example scenarios | Match to user goals |
| `RelatedBlocks` | Related block types | Suggest complementary blocks |
| `UsageNotes` | Additional guidance | Provide context to users |
## Best Practices
### For AI Assistants
1. **Start with unified discovery**: Always call with `category="unified"` first
2. **Cache results**: Block type metadata changes infrequently
3. **Match use cases**: Use the `CommonUseCases` field to find relevant blocks
4. **Suggest related blocks**: Use `RelatedBlocks` to offer complementary analysis
### For Developers
1. **Secure your tokens**: Never expose API tokens in client-side code
2. **Use appropriate scopes**: Request only the permissions needed
3. **Handle rate limits**: Implement exponential backoff for retries
4. **Validate responses**: Check for errors before processing results
## Next Steps
- [Unified Block Types API](/mindzie_api/block/discovery) - Direct API documentation
- [URL Generation API](/mindzie_api/navigation/url-generation) - Generate navigation URLs
- [AI Coding Tools Overview](/mindzie_api/llm-access/overview) - General AI tool integration
- [Authentication](/mindzie_api/authentication/overview) - API authentication details
---
## Overview
Section: Authentication
URL: https://docs.mindziestudio.com/mindzie_api/authentication/overview
Source: /docs-master/mindzieAPI/authentication/overview/page.md
# Authentication
**Secure Access to the mindzieAPI**
Learn how to authenticate with the mindzieAPI using Bearer tokens, manage tenant and project access, and implement secure API integration patterns.
## Authentication Overview
The mindzieAPI uses Bearer token authentication combined with tenant and project identifiers to provide secure, multi-tenant access to mindzie resources.
## API Key Types
The mindzieAPI supports two types of API keys with different access levels:
### Tenant API Keys (Standard)
Tenant API Keys are scoped to a specific tenant and are used for most API operations:
- Access projects, datasets, investigations, and dashboards within the tenant
- Execute notebooks and blocks
- Manage project-level resources
**Create at:** Settings -> API Keys (within mindzieStudio)
### Global API Keys (Server API Keys)
Global API Keys have system-wide administrative access and are required for:
- **Tenant API** - Create, list, update, and delete tenants
- **User API (Global)** - Create and manage users across all tenants
- Assign users to tenants
**Create at:** `/admin/global-api-keys` (Administrator access required)
**IMPORTANT:** The Tenant API endpoints (`/api/tenant`) require a Global API Key. Regular tenant-specific API keys cannot access these endpoints and will receive a 401 Unauthorized response.
## Required Headers
### For Tenant-Scoped Operations
```
Authorization: Bearer YOUR_TENANT_API_KEY
Content-Type: application/json
```
The tenant ID is typically included in the URL path (e.g., `/api/{tenantId}/project`).
### For Global Operations (Tenant/User Management)
```
Authorization: Bearer YOUR_GLOBAL_API_KEY
Content-Type: application/json
```
**Security Note:** Always use HTTPS when making API requests to protect your access tokens in transit.
## Obtaining Access Tokens
### Enterprise Server
For Enterprise Server deployments, contact your mindzie administrator to obtain:
- API access token
- Tenant ID (GUID format)
- Project ID (GUID format)
- Base API URL for your instance
### SaaS Deployment
For SaaS users, access tokens can be generated through:
- mindzie Studio user interface (Settings → API Keys)
- Contacting your account administrator
- Using the authentication endpoints (if enabled)
## Testing Authentication
Use the ping endpoints to verify your authentication setup:
### Basic Connectivity Test
```bash
curl -X GET "https://your-mindzie-instance.com/api/Action/ping"
```
### Authenticated Test
```bash
curl -X GET "https://your-mindzie-instance.com/api/Action/ping/authenticated" \
-H "Authorization: Bearer YOUR_ACCESS_TOKEN" \
-H "X-Tenant-Id: YOUR_TENANT_GUID" \
-H "X-Project-Id: YOUR_PROJECT_GUID"
```
### Successful Response
```json
{
"status": "authenticated",
"timestamp": "2024-01-15T10:30:00Z",
"tenantId": "12345678-1234-1234-1234-123456789012",
"projectId": "87654321-4321-4321-4321-210987654321",
"userId": "user@company.com",
"permissions": ["read", "write", "admin"]
}
```
## Security Best Practices
### Token Security
Store tokens securely using environment variables or secure credential management systems.
### Token Expiration
Monitor token expiration and implement refresh mechanisms to maintain uninterrupted access.
### Multi-Tenant
Each token is scoped to specific tenants and projects for secure data isolation.
## Implementation Examples
### JavaScript/Node.js
```javascript
const apiConfig = {
baseURL: process.env.MINDZIE_API_URL,
token: process.env.MINDZIE_ACCESS_TOKEN,
tenantId: process.env.MINDZIE_TENANT_ID,
projectId: process.env.MINDZIE_PROJECT_ID
};
const makeAuthenticatedRequest = async (endpoint, options = {}) => {
const url = `${apiConfig.baseURL}${endpoint}`;
const headers = {
'Authorization': `Bearer ${apiConfig.token}`,
'X-Tenant-Id': apiConfig.tenantId,
'X-Project-Id': apiConfig.projectId,
'Content-Type': 'application/json',
...options.headers
};
try {
const response = await fetch(url, {
...options,
headers
});
if (!response.ok) {
throw new Error(`API request failed: ${response.status} ${response.statusText}`);
}
return await response.json();
} catch (error) {
console.error('API request error:', error);
throw error;
}
};
```
### Python
```python
import os
import requests
from typing import Dict, Any
class MindzieAPIClient:
def __init__(self):
self.base_url = os.getenv('MINDZIE_API_URL')
self.token = os.getenv('MINDZIE_ACCESS_TOKEN')
self.tenant_id = os.getenv('MINDZIE_TENANT_ID')
self.project_id = os.getenv('MINDZIE_PROJECT_ID')
if not all([self.base_url, self.token, self.tenant_id, self.project_id]):
raise ValueError("Missing required environment variables")
def _get_headers(self) -> Dict[str, str]:
return {
'Authorization': f'Bearer {self.token}',
'X-Tenant-Id': self.tenant_id,
'X-Project-Id': self.project_id,
'Content-Type': 'application/json'
}
def make_request(self, method: str, endpoint: str, **kwargs) -> Dict[str, Any]:
url = f"{self.base_url.rstrip('/')}{endpoint}"
headers = self._get_headers()
if 'headers' in kwargs:
headers.update(kwargs['headers'])
kwargs['headers'] = headers
try:
response = requests.request(method, url, **kwargs)
response.raise_for_status()
return response.json()
except requests.exceptions.RequestException as e:
raise Exception(f"API request failed: {e}")
# Usage
client = MindzieAPIClient()
result = client.make_request('GET', '/api/Action/ping/authenticated')
```
### C#/.NET
```csharp
using System;
using System.Net.Http;
using System.Text.Json;
using System.Threading.Tasks;
public class MindzieApiClient
{
private readonly HttpClient _httpClient;
private readonly string _baseUrl;
private readonly string _tenantId;
private readonly string _projectId;
public MindzieApiClient(string baseUrl, string accessToken, string tenantId, string projectId)
{
_baseUrl = baseUrl.TrimEnd('/');
_tenantId = tenantId;
_projectId = projectId;
_httpClient = new HttpClient();
_httpClient.DefaultRequestHeaders.Add("Authorization", $"Bearer {accessToken}");
_httpClient.DefaultRequestHeaders.Add("X-Tenant-Id", tenantId);
_httpClient.DefaultRequestHeaders.Add("X-Project-Id", projectId);
}
public async Task GetAsync(string endpoint)
{
var response = await _httpClient.GetAsync($"{_baseUrl}{endpoint}");
response.EnsureSuccessStatusCode();
var content = await response.Content.ReadAsStringAsync();
return JsonSerializer.Deserialize(content);
}
public async Task PostAsync(string endpoint, object data)
{
var json = JsonSerializer.Serialize(data);
var content = new StringContent(json, System.Text.Encoding.UTF8, "application/json");
var response = await _httpClient.PostAsync($"{_baseUrl}{endpoint}", content);
response.EnsureSuccessStatusCode();
var responseContent = await response.Content.ReadAsStringAsync();
return JsonSerializer.Deserialize(responseContent);
}
}
// Usage
var client = new MindzieApiClient(
Environment.GetEnvironmentVariable("MINDZIE_API_URL"),
Environment.GetEnvironmentVariable("MINDZIE_ACCESS_TOKEN"),
Environment.GetEnvironmentVariable("MINDZIE_TENANT_ID"),
Environment.GetEnvironmentVariable("MINDZIE_PROJECT_ID")
);
```
## Error Handling
### Common Authentication Errors
| Status Code | Error | Description | Solution |
|-------------|-------|-------------|----------|
| `401` | Unauthorized | Invalid or missing access token | Verify token and ensure it's not expired |
| `403` | Forbidden | Valid token but insufficient permissions | Check tenant/project access or request permissions |
| `400` | Bad Request | Missing required headers | Ensure X-Tenant-Id and X-Project-Id are provided |
### Example Error Response
```json
{
"error": "invalid_token",
"message": "The provided access token is invalid or expired",
"timestamp": "2024-01-15T10:30:00Z",
"requestId": "req_12345"
}
```
## Next Steps
Once authentication is working, try the [Quick Start Guide](/mindzie_api/quick-start) to make your first API calls or explore the [Response Formats](/mindzie_api/response-formats) documentation.
---
## Overview
Section: Block
URL: https://docs.mindziestudio.com/mindzie_api/block/overview
Source: /docs-master/mindzieAPI/block/overview/page.md
# Blocks
## Analysis Block Management
Manage analysis blocks within notebooks including filters, calculators, and alerts. Complete operations for working with process mining analysis blocks.
## Features
### Block Type Discovery
Discover all available block types (filters, calculators, enrichments) in a single API call with complete metadata.
[Discover Block Types](/mindzie_api/block/discovery)
### Block Management
Get, update, and delete analysis blocks. Create blocks via the Notebook API.
[Manage Blocks](/mindzie_api/block/management)
### Block Execution
Execute individual blocks and monitor processing status with asynchronous queuing.
[Execute Blocks](/mindzie_api/block/execution)
### Block Results
Retrieve analysis results and execution history from completed block executions.
[Get Results](/mindzie_api/block/results)
### Block Types
Explore different block types including filters, calculators, and alert configurations.
[Explore Types](/mindzie_api/block/types)
## Available Endpoints
### Block Type Discovery
- **GET** `/api/tenant/{tenantId}/project/{projectId}/block/types/all` - Get all block types (filters, calculators, enrichments) in a single call
### Connectivity Testing
- **GET** `/api/{tenantId}/{projectId}/block/unauthorized-ping` - Public connectivity test (no auth required)
- **GET** `/api/{tenantId}/{projectId}/block/ping` - Authenticated connectivity test
### Block Operations
- **GET** `/api/{tenantId}/{projectId}/block/{blockId}` - Get block details
- **PUT** `/api/{tenantId}/{projectId}/block/{blockId}` - Update block metadata
- **DELETE** `/api/{tenantId}/{projectId}/block/{blockId}` - Delete a block
### Block Execution
- **POST** `/api/{tenantId}/{projectId}/block/{blockId}/execute` - Queue block for execution
### Block Results
- **GET** `/api/{tenantId}/{projectId}/block/{blockId}/results` - Get execution results
- **GET** `/api/{tenantId}/{projectId}/block/{blockId}/output-data` - Get output data (via ExecutionController)
## Creating Blocks
Block creation is handled through the Notebook API:
**POST** `/api/{tenantId}/{projectId}/notebook/{notebookId}/blocks`
See [Notebook API](/mindzie_api/notebook/overview) for block creation details.
## Block Types
mindzieStudio supports various types of analysis blocks:
### Filter Blocks
Apply filters to focus analysis on specific data subsets and conditions.
- Activity filters
- Time period filters
- Case attribute filters
### Calculator Blocks
Perform calculations and generate metrics from process mining data.
- Duration calculations
- Frequency analysis
- Performance metrics
### Alert Blocks
Configure monitoring alerts and notifications for process deviations.
- Threshold alerts
- Pattern detection
- Compliance monitoring
## Common Use Cases
- **Dynamic Analysis:** Build and modify analysis workflows programmatically
- **Automated Reporting:** Execute blocks on schedule and export results
- **Custom Dashboards:** Create tailored visualizations with specific block configurations
- **Data Processing Pipelines:** Chain multiple blocks for complex analysis workflows
- **Real-time Monitoring:** Set up alert blocks for continuous process monitoring
## Authentication
All Block API endpoints (except `unauthorized-ping`) require valid authentication with appropriate permissions for the target tenant and project.
## Getting Started
Begin with [Block Management](/mindzie_api/block/management) to learn how to work with blocks, then explore [Block Types](/mindzie_api/block/types) for specific analysis configurations.
---
## Discovery
Section: Block
URL: https://docs.mindziestudio.com/mindzie_api/block/discovery
Source: /docs-master/mindzieAPI/block/discovery/page.md
# Block Type Discovery
## Unified Block Types Endpoint
**GET** `/api/tenant/{tenantId}/project/{projectId}/block/types/all`
Discover all available block types (filters, calculators, and enrichments) in a single API call. This unified endpoint is the recommended way to retrieve complete information about all analysis capabilities available in mindzieStudio.
## Why Use the Unified Endpoint?
The unified endpoint provides several advantages over querying individual category endpoints:
- **Single Request**: Get all block types in one API call instead of multiple requests
- **Complete Metadata**: Includes enrichments which are not available through category-specific endpoints
- **Grouped Response**: Results are organized by block category for easy processing
- **Rich Metadata**: Each block type includes documentation URLs, usage notes, and related blocks
- **AI Integration**: Optimized for AI coding assistants and MCP server integration
## Request
```http
GET /api/tenant/{tenantId}/project/{projectId}/block/types/all
Authorization: Bearer {token}
```
### Path Parameters
| Parameter | Type | Required | Description |
|-----------|------|----------|-------------|
| `tenantId` | GUID | Yes | The tenant identifier |
| `projectId` | GUID | Yes | The project identifier |
## Response
### Response Structure
```json
{
"BlockTypes": [...],
"Categories": ["Attribute Filters", "Time Filters", "Calculators", ...],
"TotalCount": 45,
"ByBlockCategory": {
"Filter": [...],
"Calculator": [...],
"Enrichment": [...]
}
}
```
### Response Fields
| Field | Type | Description |
|-------|------|-------------|
| `BlockTypes` | Array | All block types with complete metadata |
| `Categories` | Array | List of all unique categories |
| `TotalCount` | Integer | Total number of block types available |
| `ByBlockCategory` | Object | Block types grouped by Filter/Calculator/Enrichment |
### Block Type Object
Each block type in the `BlockTypes` array contains:
| Field | Type | Description |
|-------|------|-------------|
| `OperatorName` | String | Unique identifier for the block type (e.g., "CaseAttributeFilter") |
| `DisplayName` | String | Human-readable name shown in the UI |
| `Description` | String | Brief description of what the block does |
| `Category` | String | Functional category (e.g., "Attribute Filters", "Time Filters") |
| `BlockType` | String | Top-level classification: "Filter", "Calculator", or "Enrichment" |
| `DocumentationUrl` | String | URL to the documentation page for this block type |
| `UsageFrequency` | String | How commonly this block type is used ("High", "Medium", "Low") |
| `ExcludeFromOrFilter` | Boolean | Whether this filter can be used in OR combinations |
| `AutoTitleEnabled` | Boolean | Whether automatic title generation is supported |
| `SupportedDisplayTypes` | Array | Supported visualization types for results |
| `UsageNotes` | String | Additional guidance for using this block type |
| `RelatedBlocks` | Array | List of related block types |
| `CommonUseCases` | Array | Typical scenarios where this block type is useful |
## Example Response
```json
{
"BlockTypes": [
{
"OperatorName": "CaseAttributeFilter",
"DisplayName": "Case Attribute Filter",
"Description": "Filter cases based on attribute values such as customer type, region, or priority level",
"Category": "Attribute Filters",
"BlockType": "Filter",
"DocumentationUrl": "/mindzie_studio/filters/case-attribute-filter",
"UsageFrequency": "High",
"ExcludeFromOrFilter": false,
"AutoTitleEnabled": true,
"SupportedDisplayTypes": ["table", "chart"],
"UsageNotes": "Supports exact match, contains, and regex patterns",
"RelatedBlocks": ["EventAttributeFilter", "CaseIdFilter"],
"CommonUseCases": [
"Filter by customer segment",
"Focus on specific regions",
"Analyze high-priority cases"
]
},
{
"OperatorName": "CaseDurationCalculator",
"DisplayName": "Case Duration Calculator",
"Description": "Calculate the total duration of cases from start to end",
"Category": "Time Calculators",
"BlockType": "Calculator",
"DocumentationUrl": "/mindzie_studio/calculators/case-duration-calculator",
"UsageFrequency": "High",
"ExcludeFromOrFilter": false,
"AutoTitleEnabled": true,
"SupportedDisplayTypes": ["histogram", "table", "boxplot"],
"UsageNotes": "Duration is calculated in the project's configured time unit",
"RelatedBlocks": ["ActivityDurationCalculator", "WaitTimeCalculator"],
"CommonUseCases": [
"Analyze case cycle times",
"Identify slow-running cases",
"Compare process efficiency"
]
},
{
"OperatorName": "CaseStageCalculator",
"DisplayName": "Case Stage Calculator",
"Description": "Assign stage labels to cases based on activity patterns and rules",
"Category": "Stage Analysis",
"BlockType": "Enrichment",
"DocumentationUrl": "/mindzie_studio/enrichments/case-stage-calculator",
"UsageFrequency": "Medium",
"ExcludeFromOrFilter": false,
"AutoTitleEnabled": true,
"SupportedDisplayTypes": ["sankey", "table"],
"UsageNotes": "Requires stage definitions to be configured",
"RelatedBlocks": ["CaseStatusEnrichment", "MilestoneDetector"],
"CommonUseCases": [
"Track case progress through stages",
"Identify bottleneck stages",
"Monitor stage transitions"
]
}
],
"Categories": [
"Attribute Filters",
"Time Filters",
"Activity Filters",
"Time Calculators",
"Count Calculators",
"Stage Analysis",
"Data Enrichment"
],
"TotalCount": 45,
"ByBlockCategory": {
"Filter": [
{ "OperatorName": "CaseAttributeFilter", "DisplayName": "Case Attribute Filter", ... },
{ "OperatorName": "DateRangeFilter", "DisplayName": "Date Range Filter", ... }
],
"Calculator": [
{ "OperatorName": "CaseDurationCalculator", "DisplayName": "Case Duration Calculator", ... }
],
"Enrichment": [
{ "OperatorName": "CaseStageCalculator", "DisplayName": "Case Stage Calculator", ... }
]
}
}
```
## JavaScript Example
```javascript
// Discover all available block types
async function discoverAllBlockTypes(tenantId, projectId, token) {
const response = await fetch(
`/api/tenant/${tenantId}/project/${projectId}/block/types/all`,
{
method: 'GET',
headers: {
'Authorization': `Bearer ${token}`,
'Content-Type': 'application/json'
}
}
);
if (!response.ok) {
throw new Error(`Failed to discover block types: ${response.status}`);
}
const data = await response.json();
console.log(`Discovered ${data.TotalCount} block types:`);
console.log(`- Filters: ${data.ByBlockCategory.Filter.length}`);
console.log(`- Calculators: ${data.ByBlockCategory.Calculator.length}`);
console.log(`- Enrichments: ${data.ByBlockCategory.Enrichment.length}`);
return data;
}
// Find block types by category
function getBlockTypesByCategory(allTypes, category) {
return allTypes.BlockTypes.filter(bt => bt.Category === category);
}
// Find high-usage block types
function getHighUsageBlockTypes(allTypes) {
return allTypes.BlockTypes.filter(bt => bt.UsageFrequency === 'High');
}
// Usage
const blockTypes = await discoverAllBlockTypes(tenantId, projectId, token);
const timeFilters = getBlockTypesByCategory(blockTypes, 'Time Filters');
const popular = getHighUsageBlockTypes(blockTypes);
```
## Python Example
```python
import requests
from typing import Dict, List, Any
class BlockTypeDiscovery:
def __init__(self, base_url: str, tenant_id: str, project_id: str, token: str):
self.base_url = base_url
self.tenant_id = tenant_id
self.project_id = project_id
self.headers = {
'Authorization': f'Bearer {token}',
'Content-Type': 'application/json'
}
def discover_all(self) -> Dict[str, Any]:
"""Discover all available block types"""
url = f"{self.base_url}/api/tenant/{self.tenant_id}/project/{self.project_id}/block/types/all"
response = requests.get(url, headers=self.headers)
response.raise_for_status()
return response.json()
def get_filters(self) -> List[Dict]:
"""Get all filter block types"""
data = self.discover_all()
return data.get('ByBlockCategory', {}).get('Filter', [])
def get_calculators(self) -> List[Dict]:
"""Get all calculator block types"""
data = self.discover_all()
return data.get('ByBlockCategory', {}).get('Calculator', [])
def get_enrichments(self) -> List[Dict]:
"""Get all enrichment block types"""
data = self.discover_all()
return data.get('ByBlockCategory', {}).get('Enrichment', [])
def find_by_use_case(self, keyword: str) -> List[Dict]:
"""Find block types matching a use case keyword"""
data = self.discover_all()
results = []
for block_type in data['BlockTypes']:
use_cases = block_type.get('CommonUseCases', [])
if any(keyword.lower() in uc.lower() for uc in use_cases):
results.append(block_type)
return results
# Usage
discovery = BlockTypeDiscovery(
'https://your-mindzie-instance.com',
'tenant-guid',
'project-guid',
'your-auth-token'
)
# Discover all block types
all_types = discovery.discover_all()
print(f"Total block types: {all_types['TotalCount']}")
# Get block types by category
filters = discovery.get_filters()
calculators = discovery.get_calculators()
enrichments = discovery.get_enrichments()
# Find block types for duration analysis
duration_blocks = discovery.find_by_use_case('duration')
```
## Category-Specific Endpoints
The unified endpoint is recommended for most use cases. However, category-specific endpoints are still available:
| Endpoint | Description |
|----------|-------------|
| `GET /block/types?category=filters` | Filters only |
| `GET /block/types?category=calculators` | Calculators only |
| `GET /block/types/{operatorName}` | Single block type details |
| `GET /block/types/{operatorName}/schema` | Configuration schema for a block type |
## MCP Server Integration
AI coding assistants can use the mindzieAPI MCP server to discover block types programmatically:
```
mindzie_list_block_types category="unified"
```
This MCP tool call returns the same unified response, making it easy for AI tools to understand all available analysis capabilities.
See [MCP Server Integration](/mindzie_api/llm-access/mcp-server) for complete documentation.
## Use Cases
### Building Dynamic UIs
Use the unified endpoint to populate block type selection menus with complete information about each option.
### AI-Powered Analysis
AI assistants can discover available analysis capabilities and suggest appropriate block types based on user goals.
### Documentation Generation
Generate dynamic documentation by iterating through all block types and their metadata.
### Capability Auditing
Enumerate all available analysis capabilities for a project to ensure complete coverage.
---
## Types
Section: Block
URL: https://docs.mindziestudio.com/mindzie_api/block/types
Source: /docs-master/mindzieAPI/block/types/page.md
# Block Types
## Analysis Block Categories
Explore different block types including filters, calculators, and alert configurations. Learn about each type's capabilities, configuration options, and creation endpoints.
## Filter Blocks
**POST** `/api/{tenantId}/{projectId}/block/filter`
Filter blocks apply data filtering criteria to datasets, reducing data by applying conditions such as date ranges, value filters, or logical expressions. They are the foundation for focused analysis on specific data subsets.
### Capabilities
- **Date Range Filtering:** Filter data within specific time periods
- **Activity Filtering:** Include or exclude specific process activities
- **Case Attribute Filtering:** Filter based on case properties and metadata
- **Value Range Filtering:** Apply numeric and text value conditions
- **Complex Logic:** Combine multiple filters with AND/OR operations
### Request Body
```json
{
"notebookId": "660e8400-e29b-41d4-a716-446655440000",
"blockTitle": "Date Range Filter",
"blockDescription": "Filters process data for the last 30 days"
}
```
### Configuration Examples
```javascript
// Date range filter configuration
{
"filterType": "dateRange",
"startDate": "2024-01-01T00:00:00Z",
"endDate": "2024-01-31T23:59:59Z",
"dateField": "timestamp"
}
// Activity filter configuration
{
"filterType": "activity",
"include": ["Order Created", "Payment Processed"],
"exclude": ["System Log"]
}
// Case attribute filter configuration
{
"filterType": "caseAttribute",
"attribute": "customerType",
"operator": "equals",
"value": "Premium"
}
```
## Calculator Blocks
**POST** `/api/{tenantId}/{projectId}/block/calculator`
Calculator blocks perform mathematical operations and analytical calculations on datasets. They compute metrics, aggregations, statistical measures, and derived values for process mining analysis.
### Capabilities
- **Duration Calculations:** Process cycle times and lead times
- **Frequency Analysis:** Activity occurrence rates and patterns
- **Performance Metrics:** Throughput, efficiency, and utilization
- **Statistical Analysis:** Mean, median, percentiles, and distributions
- **Custom Formulas:** Complex mathematical expressions and KPIs
### Request Body
```json
{
"notebookId": "660e8400-e29b-41d4-a716-446655440000",
"blockTitle": "Process Duration Calculator",
"blockDescription": "Calculates average case duration and cycle times"
}
```
### Configuration Examples
```javascript
// Duration calculation configuration
{
"calculationType": "duration",
"startActivity": "Order Created",
"endActivity": "Order Completed",
"unit": "hours",
"aggregation": "average"
}
// Frequency calculation configuration
{
"calculationType": "frequency",
"groupBy": "activity",
"timeWindow": "daily",
"metric": "count"
}
// Custom KPI calculation configuration
{
"calculationType": "custom",
"formula": "(completedCases / totalCases) * 100",
"resultUnit": "percentage",
"name": "Completion Rate"
}
```
## Alert Blocks
**POST** `/api/{tenantId}/{projectId}/block/alert`
Alert blocks monitor data conditions and trigger notifications when specific criteria are met. They provide automated monitoring and exception detection for process mining workflows and compliance requirements.
### Capabilities
- **Threshold Monitoring:** Alert when metrics exceed defined limits
- **Pattern Detection:** Identify unusual process behavior patterns
- **Compliance Monitoring:** Track adherence to business rules
- **Performance Alerts:** Monitor SLA violations and performance degradation
- **Real-time Notifications:** Immediate alerts for critical conditions
### Request Body
```json
{
"notebookId": "660e8400-e29b-41d4-a716-446655440000",
"blockTitle": "SLA Violation Alert",
"blockDescription": "Alerts when case duration exceeds SLA threshold"
}
```
### Configuration Examples
```javascript
// Threshold alert configuration
{
"alertType": "threshold",
"metric": "caseDuration",
"operator": "greaterThan",
"threshold": 48,
"unit": "hours",
"severity": "high"
}
// Pattern deviation alert configuration
{
"alertType": "patternDeviation",
"baselinePattern": "Order -> Payment -> Fulfillment",
"deviationTolerance": 0.1,
"minOccurrences": 10
}
// Compliance alert configuration
{
"alertType": "compliance",
"rule": "approvalRequired",
"condition": "amount > 1000",
"requiredActivity": "Manager Approval"
}
```
## Block Type Comparison
Choose the right block type for your analysis needs:
| Block Type | Primary Purpose | Input | Output | Use Cases |
|------------|-----------------|-------|--------|-----------|
| **Filter** | Data reduction and focusing | Full dataset | Filtered dataset | Time period analysis, specific process paths |
| **Calculator** | Metrics and KPI computation | Dataset (filtered or full) | Calculated values/metrics | Performance measurement, statistical analysis |
| **Alert** | Monitoring and notifications | Metrics or dataset | Alert conditions/notifications | SLA monitoring, exception detection |
## Example: Complete Block Workflow
This example demonstrates creating different block types for a comprehensive analysis:
```javascript
// Create a filter block to focus on recent data
const createDateFilter = async (notebookId) => {
const response = await fetch(`/api/${tenantId}/${projectId}/block/filter`, {
method: 'POST',
headers: {
'Content-Type': 'application/json',
'Authorization': `Bearer ${token}`
},
body: JSON.stringify({
notebookId: notebookId,
blockTitle: 'Last 30 Days Filter',
blockDescription: 'Focus analysis on recent process data'
})
});
return await response.json();
};
// Create a calculator block to compute metrics
const createDurationCalculator = async (notebookId) => {
const response = await fetch(`/api/${tenantId}/${projectId}/block/calculator`, {
method: 'POST',
headers: {
'Content-Type': 'application/json',
'Authorization': `Bearer ${token}`
},
body: JSON.stringify({
notebookId: notebookId,
blockTitle: 'Average Duration Calculator',
blockDescription: 'Calculate average case processing time'
})
});
return await response.json();
};
// Create an alert block for monitoring
const createSLAAlert = async (notebookId) => {
const response = await fetch(`/api/${tenantId}/${projectId}/block/alert`, {
method: 'POST',
headers: {
'Content-Type': 'application/json',
'Authorization': `Bearer ${token}`
},
body: JSON.stringify({
notebookId: notebookId,
blockTitle: 'SLA Violation Alert',
blockDescription: 'Monitor for SLA breaches'
})
});
return await response.json();
};
// Build complete analysis workflow
const buildAnalysisWorkflow = async (notebookId) => {
try {
// 1. Filter data to recent period
const filterBlock = await createDateFilter(notebookId);
console.log('Created filter block:', filterBlock.blockId);
// 2. Calculate performance metrics
const calculatorBlock = await createDurationCalculator(notebookId);
console.log('Created calculator block:', calculatorBlock.blockId);
// 3. Set up monitoring alerts
const alertBlock = await createSLAAlert(notebookId);
console.log('Created alert block:', alertBlock.blockId);
return {
filter: filterBlock,
calculator: calculatorBlock,
alert: alertBlock
};
} catch (error) {
console.error('Error building workflow:', error);
throw error;
}
};
```
## Python Implementation
```python
import requests
from typing import Dict, Any
class BlockTypeManager:
def __init__(self, base_url: str, tenant_id: str, project_id: str, token: str):
self.base_url = base_url
self.tenant_id = tenant_id
self.project_id = project_id
self.headers = {
'Authorization': f'Bearer {token}',
'Content-Type': 'application/json'
}
def create_filter_block(self, notebook_id: str, title: str, description: str) -> Dict[str, Any]:
"""Create a filter block for data reduction"""
url = f"{self.base_url}/api/{self.tenant_id}/{self.project_id}/block/filter"
payload = {
'notebookId': notebook_id,
'blockTitle': title,
'blockDescription': description
}
response = requests.post(url, json=payload, headers=self.headers)
response.raise_for_status()
return response.json()
def create_calculator_block(self, notebook_id: str, title: str, description: str) -> Dict[str, Any]:
"""Create a calculator block for metrics computation"""
url = f"{self.base_url}/api/{self.tenant_id}/{self.project_id}/block/calculator"
payload = {
'notebookId': notebook_id,
'blockTitle': title,
'blockDescription': description
}
response = requests.post(url, json=payload, headers=self.headers)
response.raise_for_status()
return response.json()
def create_alert_block(self, notebook_id: str, title: str, description: str) -> Dict[str, Any]:
"""Create an alert block for monitoring"""
url = f"{self.base_url}/api/{self.tenant_id}/{self.project_id}/block/alert"
payload = {
'notebookId': notebook_id,
'blockTitle': title,
'blockDescription': description
}
response = requests.post(url, json=payload, headers=self.headers)
response.raise_for_status()
return response.json()
def create_analysis_pipeline(self, notebook_id: str) -> Dict[str, Any]:
"""Create a complete analysis pipeline with all block types"""
pipeline = {}
# Create filter block
pipeline['filter'] = self.create_filter_block(
notebook_id,
'Data Filter',
'Filter dataset for analysis scope'
)
# Create calculator block
pipeline['calculator'] = self.create_calculator_block(
notebook_id,
'Performance Calculator',
'Calculate key performance metrics'
)
# Create alert block
pipeline['alert'] = self.create_alert_block(
notebook_id,
'Performance Alert',
'Monitor performance thresholds'
)
return pipeline
# Usage example
block_manager = BlockTypeManager(
'https://your-mindzie-instance.com',
'tenant-guid',
'project-guid',
'your-auth-token'
)
# Create complete analysis pipeline
pipeline = block_manager.create_analysis_pipeline('notebook-guid')
print(f"Created pipeline with {len(pipeline)} blocks")
```
## Important Notes
**Block Dependencies:** Blocks can be chained together where filter blocks reduce data, calculator blocks compute metrics, and alert blocks monitor the results for exceptions.
**Best Practice:** Start with filter blocks to reduce data scope, then use calculator blocks for analysis, and finally add alert blocks for ongoing monitoring and notifications.
---
## Execution
Section: Block
URL: https://docs.mindziestudio.com/mindzie_api/block/execution
Source: /docs-master/mindzieAPI/block/execution/page.md
# Block Execution
## Execute Analysis Blocks
Execute individual blocks asynchronously and monitor their processing status. Blocks process data according to their type and configuration.
## Execute Block
**POST** `/api/{tenantId}/{projectId}/block/{blockId}/execute`
Queues a block for asynchronous execution. The block will process data according to its type and configuration (filter, calculator, alert, etc.). Returns an execution ID for tracking progress.
### Path Parameters
| Parameter | Type | Required | Description |
|-----------|------|----------|-------------|
| `tenantId` | GUID | Yes | The tenant identifier |
| `projectId` | GUID | Yes | The project identifier |
| `blockId` | GUID | Yes | The block identifier to execute |
### Request Body (Optional)
```json
{
"parameters": {
"dateFrom": "2024-01-01",
"dateTo": "2024-12-31",
"threshold": 1000
}
}
```
### Response (202 Accepted)
```json
{
"blockId": "550e8400-e29b-41d4-a716-446655440000",
"executionId": "770e8400-e29b-41d4-a716-446655440000",
"status": "Queued",
"dateQueued": "2024-01-15T10:30:00Z",
"dateStarted": null,
"dateEnded": null,
"result": null,
"errorMessage": null,
"message": "Block execution has been queued"
}
```
### Response Fields
| Field | Type | Description |
|-------|------|-------------|
| `blockId` | GUID | The block that was queued |
| `executionId` | GUID | Unique identifier for this execution |
| `status` | string | Current execution status |
| `dateQueued` | datetime | When the execution was queued |
| `dateStarted` | datetime | When execution started (null if not started) |
| `dateEnded` | datetime | When execution completed (null if not finished) |
| `result` | object | Execution result data (null until complete) |
| `errorMessage` | string | Error details if execution failed |
| `message` | string | Human-readable status message |
### Error Responses
**Not Found (404):**
```json
{
"Error": "Block not found",
"BlockId": "550e8400-e29b-41d4-a716-446655440000"
}
```
**Unauthorized (401):**
```
{error message describing authorization failure}
```
## Execution Status Values
Block execution progresses through these status values:
| Status | Description |
|--------|-------------|
| `Queued` | Block is waiting in the execution queue |
| `Running` | Block is currently processing data |
| `Success` | Block completed execution successfully |
| `Failed` | Block execution failed with errors |
| `Cancelled` | Block execution was cancelled |
## Implementation Examples
### cURL
```bash
# Execute block without parameters
curl -X POST "https://your-mindzie-instance.com/api/12345678-1234-1234-1234-123456789012/87654321-4321-4321-4321-210987654321/block/550e8400-e29b-41d4-a716-446655440000/execute" \
-H "Authorization: Bearer YOUR_ACCESS_TOKEN" \
-H "Content-Type: application/json"
# Execute block with parameters
curl -X POST "https://your-mindzie-instance.com/api/12345678-1234-1234-1234-123456789012/87654321-4321-4321-4321-210987654321/block/550e8400-e29b-41d4-a716-446655440000/execute" \
-H "Authorization: Bearer YOUR_ACCESS_TOKEN" \
-H "Content-Type: application/json" \
-d '{"parameters": {"dateFrom": "2024-01-01", "dateTo": "2024-12-31"}}'
```
### JavaScript/Node.js
```javascript
const TENANT_ID = '12345678-1234-1234-1234-123456789012';
const PROJECT_ID = '87654321-4321-4321-4321-210987654321';
const BASE_URL = 'https://your-mindzie-instance.com';
class BlockExecutor {
constructor(token) {
this.headers = {
'Authorization': `Bearer ${token}`,
'Content-Type': 'application/json'
};
}
async executeBlock(blockId, parameters = null) {
const url = `${BASE_URL}/api/${TENANT_ID}/${PROJECT_ID}/block/${blockId}/execute`;
const body = parameters ? JSON.stringify({ parameters }) : null;
const response = await fetch(url, {
method: 'POST',
headers: this.headers,
body: body
});
if (response.status === 202) {
return await response.json();
}
throw new Error(`Execution failed: ${response.statusText}`);
}
}
// Usage
const executor = new BlockExecutor('your-auth-token');
// Execute without parameters
const result = await executor.executeBlock('block-guid');
console.log(`Execution queued: ${result.executionId}`);
// Execute with parameters
const resultWithParams = await executor.executeBlock('block-guid', {
dateFrom: '2024-01-01',
dateTo: '2024-12-31'
});
```
### Python
```python
import requests
TENANT_ID = '12345678-1234-1234-1234-123456789012'
PROJECT_ID = '87654321-4321-4321-4321-210987654321'
BASE_URL = 'https://your-mindzie-instance.com'
class BlockExecutor:
def __init__(self, token):
self.headers = {
'Authorization': f'Bearer {token}',
'Content-Type': 'application/json'
}
def execute_block(self, block_id, parameters=None):
"""Queue block for execution."""
url = f'{BASE_URL}/api/{TENANT_ID}/{PROJECT_ID}/block/{block_id}/execute'
payload = {'parameters': parameters} if parameters else {}
response = requests.post(url, json=payload, headers=self.headers)
if response.status_code == 202:
return response.json()
else:
raise Exception(f'Failed to execute block: {response.text}')
# Usage
executor = BlockExecutor('your-auth-token')
# Execute without parameters
result = executor.execute_block('block-guid')
print(f"Execution queued: {result['executionId']}")
# Execute with parameters
result = executor.execute_block('block-guid', {
'dateFrom': '2024-01-01',
'dateTo': '2024-12-31',
'threshold': 1000
})
print(f"Status: {result['status']}")
```
### C#
```csharp
using System;
using System.Net.Http;
using System.Text;
using System.Text.Json;
using System.Threading.Tasks;
public class ExecuteBlockReturn
{
public Guid BlockId { get; set; }
public Guid ExecutionId { get; set; }
public string Status { get; set; }
public DateTime DateQueued { get; set; }
public DateTime? DateStarted { get; set; }
public DateTime? DateEnded { get; set; }
public object Result { get; set; }
public string ErrorMessage { get; set; }
public string Message { get; set; }
}
public class BlockExecutorClient
{
private readonly HttpClient _httpClient;
private readonly string _baseUrl;
private readonly Guid _tenantId;
private readonly Guid _projectId;
public BlockExecutorClient(string baseUrl, Guid tenantId, Guid projectId, string accessToken)
{
_baseUrl = baseUrl;
_tenantId = tenantId;
_projectId = projectId;
_httpClient = new HttpClient();
_httpClient.DefaultRequestHeaders.Authorization =
new System.Net.Http.Headers.AuthenticationHeaderValue("Bearer", accessToken);
}
public async Task ExecuteBlockAsync(Guid blockId, object parameters = null)
{
var url = $"{_baseUrl}/api/{_tenantId}/{_projectId}/block/{blockId}/execute";
var payload = parameters != null ? new { parameters } : new { };
var content = new StringContent(
JsonSerializer.Serialize(payload),
Encoding.UTF8,
"application/json");
var response = await _httpClient.PostAsync(url, content);
if (response.StatusCode == System.Net.HttpStatusCode.Accepted)
{
var json = await response.Content.ReadAsStringAsync();
return JsonSerializer.Deserialize(json,
new JsonSerializerOptions { PropertyNameCaseInsensitive = true });
}
throw new Exception($"Failed to execute block: {response.StatusCode}");
}
}
// Usage
var executor = new BlockExecutorClient(
"https://your-mindzie-instance.com",
Guid.Parse("12345678-1234-1234-1234-123456789012"),
Guid.Parse("87654321-4321-4321-4321-210987654321"),
"your-access-token");
// Execute block
var result = await executor.ExecuteBlockAsync(
Guid.Parse("block-guid"),
new { dateFrom = "2024-01-01", dateTo = "2024-12-31" });
Console.WriteLine($"Execution queued: {result.ExecutionId}");
```
## Best Practices
- **Check Block Status:** Verify the block is not disabled before executing
- **Use Parameters Wisely:** Pass runtime parameters to customize execution without modifying block configuration
- **Handle Async Nature:** Block execution is asynchronous - use the results endpoint to check completion
- **Monitor Execution:** For long-running blocks, poll the results endpoint to track progress
---
## Results
Section: Block
URL: https://docs.mindziestudio.com/mindzie_api/block/results
Source: /docs-master/mindzieAPI/block/results/page.md
# Block Results
## Retrieve Analysis Results
Access execution history and results from completed block executions. Get processed results from filters, calculations, and alerts.
## Get Block Results
**GET** `/api/{tenantId}/{projectId}/block/{blockId}/results`
Retrieves execution history metadata for a specific block. Results include execution timestamps and status information.
### Path Parameters
| Parameter | Type | Required | Description |
|-----------|------|----------|-------------|
| `tenantId` | GUID | Yes | The tenant identifier |
| `projectId` | GUID | Yes | The project identifier |
| `blockId` | GUID | Yes | The block identifier |
### Response (200 OK)
```json
{
"blockId": "550e8400-e29b-41d4-a716-446655440000",
"message": "Block execution history not yet implemented",
"executions": []
}
```
### Response Codes
- `200 OK` - Request successful
- `401 Unauthorized` - Invalid authentication or insufficient permissions
- `404 Not Found` - Block not found or no access
- `500 Internal Server Error` - Server error occurred
## Get Block Output Data
**GET** `/api/{tenantId}/{projectId}/block/{blockId}/output-data`
Retrieves the transformed dataset produced by the block.
**Important:** This endpoint returns guidance to use the ExecutionController workflow for actual output data retrieval, as block output data is only available through the in-memory project cache.
### Path Parameters
| Parameter | Type | Required | Description |
|-----------|------|----------|-------------|
| `tenantId` | GUID | Yes | The tenant identifier |
| `projectId` | GUID | Yes | The project identifier |
| `blockId` | GUID | Yes | The block identifier |
### Response (501 Not Implemented)
```json
{
"Error": "Block output data retrieval not implemented via database API",
"BlockId": "550e8400-e29b-41d4-a716-446655440000",
"Message": "To retrieve block output data, use the ExecutionController workflow: 1. Load project into cache via ProjectController.LoadProject, 2. Execute notebook via ExecutionController.ExecuteNotebook, 3. Retrieve results via ExecutionController.GetNotebookResults",
"Recommendation": "GET /api/{tenantId}/{projectId}/execution/notebook/{notebookId}/results"
}
```
## Recommended Workflow for Block Output
To retrieve actual block output data, follow this workflow using the Execution API:
1. **Load Project into Cache**
```
GET /api/{tenantId}/{projectId}/project/{projectId}/load
```
2. **Execute Notebook**
```
POST /api/{tenantId}/{projectId}/execution/notebook/{notebookId}
```
3. **Get Notebook Results**
```
GET /api/{tenantId}/{projectId}/execution/notebook/{notebookId}/results
```
See [Execution API](/mindzie_api/execution/overview) for complete documentation.
## Implementation Examples
### cURL
```bash
# Get block results metadata
curl -X GET "https://your-mindzie-instance.com/api/12345678-1234-1234-1234-123456789012/87654321-4321-4321-4321-210987654321/block/550e8400-e29b-41d4-a716-446655440000/results" \
-H "Authorization: Bearer YOUR_ACCESS_TOKEN"
# Attempt to get output data (returns guidance)
curl -X GET "https://your-mindzie-instance.com/api/12345678-1234-1234-1234-123456789012/87654321-4321-4321-4321-210987654321/block/550e8400-e29b-41d4-a716-446655440000/output-data" \
-H "Authorization: Bearer YOUR_ACCESS_TOKEN"
```
### JavaScript/Node.js
```javascript
const TENANT_ID = '12345678-1234-1234-1234-123456789012';
const PROJECT_ID = '87654321-4321-4321-4321-210987654321';
const BASE_URL = 'https://your-mindzie-instance.com';
class BlockResultsClient {
constructor(token) {
this.headers = {
'Authorization': `Bearer ${token}`,
'Content-Type': 'application/json'
};
}
async getBlockResults(blockId) {
const url = `${BASE_URL}/api/${TENANT_ID}/${PROJECT_ID}/block/${blockId}/results`;
const response = await fetch(url, { headers: this.headers });
if (response.ok) {
return await response.json();
}
throw new Error(`Failed to get results: ${response.status}`);
}
async getBlockOutputData(blockId) {
const url = `${BASE_URL}/api/${TENANT_ID}/${PROJECT_ID}/block/${blockId}/output-data`;
const response = await fetch(url, { headers: this.headers });
// Note: This endpoint returns 501 with guidance
return await response.json();
}
}
// Usage
const client = new BlockResultsClient('your-auth-token');
// Get results metadata
const results = await client.getBlockResults('block-guid');
console.log(`Block: ${results.blockId}`);
console.log(`Executions: ${results.executions.length}`);
// Check output data guidance
const outputInfo = await client.getBlockOutputData('block-guid');
console.log(`Recommendation: ${outputInfo.Recommendation}`);
```
### Python
```python
import requests
TENANT_ID = '12345678-1234-1234-1234-123456789012'
PROJECT_ID = '87654321-4321-4321-4321-210987654321'
BASE_URL = 'https://your-mindzie-instance.com'
class BlockResultsClient:
def __init__(self, token):
self.headers = {
'Authorization': f'Bearer {token}',
'Content-Type': 'application/json'
}
def get_block_results(self, block_id):
"""Get block execution results metadata."""
url = f'{BASE_URL}/api/{TENANT_ID}/{PROJECT_ID}/block/{block_id}/results'
response = requests.get(url, headers=self.headers)
if response.ok:
return response.json()
else:
raise Exception(f'Failed to get results: {response.status_code}')
def get_block_output_data(self, block_id):
"""Get block output data guidance."""
url = f'{BASE_URL}/api/{TENANT_ID}/{PROJECT_ID}/block/{block_id}/output-data'
response = requests.get(url, headers=self.headers)
return response.json()
# Usage
client = BlockResultsClient('your-auth-token')
# Get results
results = client.get_block_results('block-guid')
print(f"Block: {results['blockId']}")
# Get output data guidance
output_info = client.get_block_output_data('block-guid')
print(f"Recommendation: {output_info.get('Recommendation', 'N/A')}")
```
### C#
```csharp
using System;
using System.Net.Http;
using System.Text.Json;
using System.Threading.Tasks;
public class BlockResultsClient
{
private readonly HttpClient _httpClient;
private readonly string _baseUrl;
private readonly Guid _tenantId;
private readonly Guid _projectId;
public BlockResultsClient(string baseUrl, Guid tenantId, Guid projectId, string accessToken)
{
_baseUrl = baseUrl;
_tenantId = tenantId;
_projectId = projectId;
_httpClient = new HttpClient();
_httpClient.DefaultRequestHeaders.Authorization =
new System.Net.Http.Headers.AuthenticationHeaderValue("Bearer", accessToken);
}
public async Task GetBlockResultsAsync(Guid blockId)
{
var url = $"{_baseUrl}/api/{_tenantId}/{_projectId}/block/{blockId}/results";
var response = await _httpClient.GetAsync(url);
if (response.IsSuccessStatusCode)
{
var json = await response.Content.ReadAsStringAsync();
return JsonDocument.Parse(json);
}
throw new Exception($"Failed to get results: {response.StatusCode}");
}
public async Task GetBlockOutputDataAsync(Guid blockId)
{
var url = $"{_baseUrl}/api/{_tenantId}/{_projectId}/block/{blockId}/output-data";
var response = await _httpClient.GetAsync(url);
// Returns 501 with guidance
var json = await response.Content.ReadAsStringAsync();
return JsonDocument.Parse(json);
}
}
```
## Important Notes
- **Results Endpoint:** Currently returns execution history metadata. Full execution history retrieval is being developed.
- **Output Data:** Block output data is only available through the in-memory project cache. Use the ExecutionController workflow for actual data retrieval.
- **Best Practice:** For complete block output, load the project, execute the notebook, and retrieve results via the Execution API.
---
## Management
Section: Block
URL: https://docs.mindziestudio.com/mindzie_api/block/management
Source: /docs-master/mindzieAPI/block/management/page.md
# Block Management
## Get, Update, and Delete Analysis Blocks
Manage analysis blocks within notebooks. Blocks are the fundamental analysis units that perform data transformations, calculations, filtering operations, and alerting.
## Connectivity Testing
### Unauthorized Ping
**GET** `/api/{tenantId}/{projectId}/block/unauthorized-ping`
Test endpoint that does not require authentication. Use this to verify the Block API is accessible.
#### Response
```
Ping Successful
```
### Authenticated Ping
**GET** `/api/{tenantId}/{projectId}/block/ping`
Authenticated ping endpoint to verify API access for a specific tenant and project.
#### Response (200 OK)
```
Ping Successful (tenant id: {tenantId})
```
#### Response (401 Unauthorized)
```
{error message describing authorization failure}
```
## Get Block Details
**GET** `/api/{tenantId}/{projectId}/block/{blockId}`
Retrieves comprehensive information about a specific analysis block including its configuration, execution history, and metadata.
### Path Parameters
| Parameter | Type | Required | Description |
|-----------|------|----------|-------------|
| `tenantId` | GUID | Yes | The tenant identifier |
| `projectId` | GUID | Yes | The project identifier |
| `blockId` | GUID | Yes | The block identifier |
### Response (200 OK)
```json
{
"blockId": "550e8400-e29b-41d4-a716-446655440000",
"notebookId": "660e8400-e29b-41d4-a716-446655440000",
"blockType": "Filter",
"blockTitle": "Date Range Filter",
"blockDescription": "Filters data for the last 30 days",
"blockOrder": 0,
"configuration": "{\"filterType\": \"dateRange\", \"startDate\": \"2024-01-01\"}",
"isDisabled": false,
"dateCreated": "2024-01-15T10:30:00Z",
"dateModified": "2024-01-15T14:45:00Z",
"createdBy": "user@example.com",
"modifiedBy": "user@example.com",
"lastExecutionDate": "2024-01-15T14:45:00Z",
"lastExecutionStatus": "Success",
"executionCount": 12
}
```
### Response Fields
| Field | Type | Description |
|-------|------|-------------|
| `blockId` | GUID | Unique identifier for the block |
| `notebookId` | GUID | ID of the notebook containing this block |
| `blockType` | string | Type of block (Filter, Calculator, Alert, etc.) |
| `blockTitle` | string | Display title of the block |
| `blockDescription` | string | Description of the block's purpose |
| `blockOrder` | integer | Order of the block in the notebook (default: 0) |
| `configuration` | string | JSON string containing block settings |
| `isDisabled` | boolean | Whether the block is disabled |
| `dateCreated` | datetime | When the block was created |
| `dateModified` | datetime | When the block was last modified |
| `createdBy` | string | User who created the block |
| `modifiedBy` | string | User who last modified the block |
| `lastExecutionDate` | datetime | When the block was last executed |
| `lastExecutionStatus` | string | Status of last execution |
| `executionCount` | integer | Number of times block has been executed |
### Error Responses
**Not Found (404):**
```json
{
"Error": "Block not found",
"BlockId": "550e8400-e29b-41d4-a716-446655440000"
}
```
## Update Block
**PUT** `/api/{tenantId}/{projectId}/block/{blockId}`
Updates an existing block's metadata. Preserves execution history while updating the specified fields.
### Request Body
```json
{
"blockTitle": "Updated Date Filter",
"blockDescription": "Filters data for custom date range",
"isDisabled": false
}
```
### Request Fields
| Field | Type | Required | Description |
|-------|------|----------|-------------|
| `blockTitle` | string | No | New title for the block |
| `blockDescription` | string | No | New description for the block |
| `isDisabled` | boolean | No | Whether to disable the block |
### Response (200 OK)
Returns the updated block object with the same structure as the GET endpoint.
### Error Responses
**Bad Request (400):**
```
Failed to update block.
```
## Delete Block
**DELETE** `/api/{tenantId}/{projectId}/block/{blockId}`
Permanently removes a block and all its execution history from the notebook. This operation cannot be undone.
### Response Codes
- `204 No Content` - Block deleted successfully
- `400 Bad Request` - Failed to delete block
- `401 Unauthorized` - Not authenticated or lacks access
- `404 Not Found` - Block not found
## Creating Blocks
Block creation is handled through the Notebook API, not the Block API.
**POST** `/api/{tenantId}/{projectId}/notebook/{notebookId}/blocks`
See [Notebook API](/mindzie_api/notebook/overview) for complete block creation documentation.
## Implementation Examples
### cURL
```bash
# Test connectivity (no auth)
curl -X GET "https://your-mindzie-instance.com/api/12345678-1234-1234-1234-123456789012/87654321-4321-4321-4321-210987654321/block/unauthorized-ping"
# Test connectivity (authenticated)
curl -X GET "https://your-mindzie-instance.com/api/12345678-1234-1234-1234-123456789012/87654321-4321-4321-4321-210987654321/block/ping" \
-H "Authorization: Bearer YOUR_ACCESS_TOKEN"
# Get block details
curl -X GET "https://your-mindzie-instance.com/api/12345678-1234-1234-1234-123456789012/87654321-4321-4321-4321-210987654321/block/550e8400-e29b-41d4-a716-446655440000" \
-H "Authorization: Bearer YOUR_ACCESS_TOKEN"
# Update block
curl -X PUT "https://your-mindzie-instance.com/api/12345678-1234-1234-1234-123456789012/87654321-4321-4321-4321-210987654321/block/550e8400-e29b-41d4-a716-446655440000" \
-H "Authorization: Bearer YOUR_ACCESS_TOKEN" \
-H "Content-Type: application/json" \
-d '{"blockTitle": "Updated Filter", "isDisabled": false}'
# Delete block
curl -X DELETE "https://your-mindzie-instance.com/api/12345678-1234-1234-1234-123456789012/87654321-4321-4321-4321-210987654321/block/550e8400-e29b-41d4-a716-446655440000" \
-H "Authorization: Bearer YOUR_ACCESS_TOKEN"
```
### JavaScript/Node.js
```javascript
const TENANT_ID = '12345678-1234-1234-1234-123456789012';
const PROJECT_ID = '87654321-4321-4321-4321-210987654321';
const BASE_URL = 'https://your-mindzie-instance.com';
class BlockManager {
constructor(token) {
this.token = token;
this.headers = {
'Authorization': `Bearer ${token}`,
'Content-Type': 'application/json'
};
}
async getBlock(blockId) {
const url = `${BASE_URL}/api/${TENANT_ID}/${PROJECT_ID}/block/${blockId}`;
const response = await fetch(url, { headers: this.headers });
if (response.ok) {
return await response.json();
} else if (response.status === 404) {
throw new Error('Block not found');
} else {
throw new Error(`Failed to get block: ${response.status}`);
}
}
async updateBlock(blockId, updates) {
const url = `${BASE_URL}/api/${TENANT_ID}/${PROJECT_ID}/block/${blockId}`;
const response = await fetch(url, {
method: 'PUT',
headers: this.headers,
body: JSON.stringify(updates)
});
if (response.ok) {
return await response.json();
} else {
throw new Error(`Failed to update block: ${response.status}`);
}
}
async deleteBlock(blockId) {
const url = `${BASE_URL}/api/${TENANT_ID}/${PROJECT_ID}/block/${blockId}`;
const response = await fetch(url, {
method: 'DELETE',
headers: this.headers
});
return response.status === 204;
}
}
// Usage
const manager = new BlockManager('your-auth-token');
// Get block details
const block = await manager.getBlock('block-guid');
console.log(`Block: ${block.blockTitle} (${block.blockType})`);
// Update block
const updated = await manager.updateBlock('block-guid', {
blockTitle: 'Updated Title',
isDisabled: false
});
// Delete block
const deleted = await manager.deleteBlock('block-guid');
```
### Python
```python
import requests
TENANT_ID = '12345678-1234-1234-1234-123456789012'
PROJECT_ID = '87654321-4321-4321-4321-210987654321'
BASE_URL = 'https://your-mindzie-instance.com'
class BlockManager:
def __init__(self, token):
self.headers = {
'Authorization': f'Bearer {token}',
'Content-Type': 'application/json'
}
def get_block(self, block_id):
"""Get block details."""
url = f'{BASE_URL}/api/{TENANT_ID}/{PROJECT_ID}/block/{block_id}'
response = requests.get(url, headers=self.headers)
if response.ok:
return response.json()
elif response.status_code == 404:
raise Exception('Block not found')
else:
raise Exception(f'Failed to get block: {response.status_code}')
def update_block(self, block_id, title=None, description=None, disabled=None):
"""Update block metadata."""
url = f'{BASE_URL}/api/{TENANT_ID}/{PROJECT_ID}/block/{block_id}'
payload = {}
if title is not None:
payload['blockTitle'] = title
if description is not None:
payload['blockDescription'] = description
if disabled is not None:
payload['isDisabled'] = disabled
response = requests.put(url, json=payload, headers=self.headers)
if response.ok:
return response.json()
else:
raise Exception(f'Failed to update block: {response.status_code}')
def delete_block(self, block_id):
"""Delete a block."""
url = f'{BASE_URL}/api/{TENANT_ID}/{PROJECT_ID}/block/{block_id}'
response = requests.delete(url, headers=self.headers)
return response.status_code == 204
# Usage
manager = BlockManager('your-auth-token')
# Get block
block = manager.get_block('block-guid')
print(f"Block: {block['blockTitle']} ({block['blockType']})")
print(f"Execution count: {block['executionCount']}")
# Update block
updated = manager.update_block('block-guid', title='New Title', disabled=False)
print(f"Updated: {updated['blockTitle']}")
# Delete block
if manager.delete_block('block-guid'):
print('Block deleted successfully')
```
### C#
```csharp
using System;
using System.Net.Http;
using System.Text;
using System.Text.Json;
using System.Threading.Tasks;
public class BlockReturn
{
public Guid BlockId { get; set; }
public Guid NotebookId { get; set; }
public string BlockType { get; set; }
public string BlockTitle { get; set; }
public string BlockDescription { get; set; }
public int BlockOrder { get; set; }
public string Configuration { get; set; }
public bool IsDisabled { get; set; }
public DateTime DateCreated { get; set; }
public DateTime DateModified { get; set; }
public string CreatedBy { get; set; }
public string ModifiedBy { get; set; }
public DateTime? LastExecutionDate { get; set; }
public string LastExecutionStatus { get; set; }
public int ExecutionCount { get; set; }
}
public class BlockApiClient
{
private readonly HttpClient _httpClient;
private readonly string _baseUrl;
private readonly Guid _tenantId;
private readonly Guid _projectId;
public BlockApiClient(string baseUrl, Guid tenantId, Guid projectId, string accessToken)
{
_baseUrl = baseUrl;
_tenantId = tenantId;
_projectId = projectId;
_httpClient = new HttpClient();
_httpClient.DefaultRequestHeaders.Authorization =
new System.Net.Http.Headers.AuthenticationHeaderValue("Bearer", accessToken);
}
public async Task GetBlockAsync(Guid blockId)
{
var url = $"{_baseUrl}/api/{_tenantId}/{_projectId}/block/{blockId}";
var response = await _httpClient.GetAsync(url);
if (response.IsSuccessStatusCode)
{
var json = await response.Content.ReadAsStringAsync();
return JsonSerializer.Deserialize(json,
new JsonSerializerOptions { PropertyNameCaseInsensitive = true });
}
throw new Exception($"Failed to get block: {response.StatusCode}");
}
public async Task UpdateBlockAsync(Guid blockId, string title, string description, bool? isDisabled)
{
var url = $"{_baseUrl}/api/{_tenantId}/{_projectId}/block/{blockId}";
var payload = new
{
blockTitle = title,
blockDescription = description,
isDisabled = isDisabled
};
var content = new StringContent(
JsonSerializer.Serialize(payload),
Encoding.UTF8,
"application/json");
var response = await _httpClient.PutAsync(url, content);
if (response.IsSuccessStatusCode)
{
var json = await response.Content.ReadAsStringAsync();
return JsonSerializer.Deserialize(json,
new JsonSerializerOptions { PropertyNameCaseInsensitive = true });
}
throw new Exception($"Failed to update block: {response.StatusCode}");
}
public async Task DeleteBlockAsync(Guid blockId)
{
var url = $"{_baseUrl}/api/{_tenantId}/{_projectId}/block/{blockId}";
var response = await _httpClient.DeleteAsync(url);
return response.StatusCode == System.Net.HttpStatusCode.NoContent;
}
}
```
---
## Overview
Section: Quick Start
URL: https://docs.mindziestudio.com/mindzie_api/quick-start/overview
Source: /docs-master/mindzieAPI/quick-start/overview/page.md
# Quick Start Guide
**Get Up and Running in Minutes**
Follow this step-by-step guide to make your first successful API calls to mindzieStudio and start integrating process mining capabilities into your applications.
## Prerequisites
- **API Credentials:** Access token, tenant ID, and project ID
- **Base URL:** Your mindzie instance API endpoint
- **HTTPS Access:** Secure connection to your mindzie instance
- **Development Environment:** Your preferred programming language and HTTP client
**Don't have credentials?** Check the [Authentication Guide](/mindzie_api/authentication) to learn how to obtain your API access credentials.
## Step 1: Test Basic Connectivity
Start by testing basic connectivity to ensure your mindzie instance is accessible:
```bash
curl -X GET "https://your-mindzie-instance.com/api/Action/ping"
```
**Expected Response:**
```json
{
"status": "ok",
"timestamp": "2024-01-15T10:30:00Z",
"version": "1.0.0"
}
```
## Step 2: Verify Authentication
Test your authentication credentials with the authenticated ping endpoint:
```bash
curl -X GET "https://your-mindzie-instance.com/api/Action/ping/authenticated" \
-H "Authorization: Bearer YOUR_ACCESS_TOKEN" \
-H "X-Tenant-Id: YOUR_TENANT_GUID" \
-H "X-Project-Id: YOUR_PROJECT_GUID" \
-H "Content-Type: application/json"
```
**Expected Response:**
```json
{
"status": "authenticated",
"timestamp": "2024-01-15T10:30:00Z",
"tenantId": "12345678-1234-1234-1234-123456789012",
"projectId": "87654321-4321-4321-4321-210987654321",
"userId": "user@company.com",
"permissions": ["read", "write", "admin"]
}
```
## Step 3: Your First API Call
Let's make a practical API call to retrieve action history:
```bash
curl -X GET "https://your-mindzie-instance.com/api/Action/history?limit=5" \
-H "Authorization: Bearer YOUR_ACCESS_TOKEN" \
-H "X-Tenant-Id: YOUR_TENANT_GUID" \
-H "X-Project-Id: YOUR_PROJECT_GUID" \
-H "Content-Type: application/json"
```
**Example Response:**
```json
{
"actions": [
{
"actionId": "87654321-4321-4321-4321-210987654321",
"actionType": "analyze",
"status": "completed",
"startTime": "2024-01-15T10:30:00Z",
"endTime": "2024-01-15T10:32:15Z",
"duration": 135,
"userId": "user@company.com"
}
],
"pagination": {
"currentPage": 1,
"totalPages": 1,
"totalItems": 1,
"itemsPerPage": 5
}
}
```
## Language-Specific Examples
### JavaScript
Use fetch API or axios for modern web applications and Node.js backends.
### Python
Use requests library for data science workflows and backend automation.
### C#/.NET
Use HttpClient for enterprise applications and microservices.
## JavaScript Example
Complete example using modern JavaScript and fetch API:
```javascript
// Configuration
const API_CONFIG = {
baseURL: 'https://your-mindzie-instance.com/api',
token: 'YOUR_ACCESS_TOKEN',
tenantId: 'YOUR_TENANT_GUID',
projectId: 'YOUR_PROJECT_GUID'
};
// Helper function for API requests
async function callMindzieAPI(endpoint, options = {}) {
const url = `${API_CONFIG.baseURL}${endpoint}`;
const defaultHeaders = {
'Authorization': `Bearer ${API_CONFIG.token}`,
'X-Tenant-Id': API_CONFIG.tenantId,
'X-Project-Id': API_CONFIG.projectId,
'Content-Type': 'application/json'
};
try {
const response = await fetch(url, {
...options,
headers: { ...defaultHeaders, ...options.headers }
});
if (!response.ok) {
throw new Error(`HTTP ${response.status}: ${response.statusText}`);
}
return await response.json();
} catch (error) {
console.error('API call failed:', error);
throw error;
}
}
// Example usage
async function quickStartExample() {
try {
// 1. Test connectivity
console.log('Testing connectivity...');
const pingResult = await callMindzieAPI('/Action/ping');
console.log('Ping successful:', pingResult);
// 2. Test authentication
console.log('Testing authentication...');
const authResult = await callMindzieAPI('/Action/ping/authenticated');
console.log('Authentication successful:', authResult);
// 3. Get action history
console.log('Fetching action history...');
const history = await callMindzieAPI('/Action/history?limit=5');
console.log('Action history:', history);
console.log('Quick start completed successfully!');
return history;
} catch (error) {
console.error('Quick start failed:', error);
throw error;
}
}
// Run the example
quickStartExample();
```
## Python Example
Complete example using Python requests library:
```python
import requests
import json
from typing import Dict, Any
class MindzieQuickStart:
def __init__(self, base_url: str, token: str, tenant_id: str, project_id: str):
self.base_url = base_url.rstrip('/')
self.headers = {
'Authorization': f'Bearer {token}',
'X-Tenant-Id': tenant_id,
'X-Project-Id': project_id,
'Content-Type': 'application/json'
}
def call_api(self, endpoint: str, method: str = 'GET', **kwargs) -> Dict[str, Any]:
"""Make an API call to mindzie"""
url = f"{self.base_url}{endpoint}"
try:
response = requests.request(
method=method,
url=url,
headers=self.headers,
**kwargs
)
response.raise_for_status()
return response.json()
except requests.exceptions.RequestException as e:
print(f"API call failed: {e}")
raise
def run_quick_start(self):
"""Execute the quick start sequence"""
print("Starting mindzie API Quick Start...")
try:
# 1. Test connectivity
print("1. Testing connectivity...")
ping_result = requests.get(f"{self.base_url}/api/Action/ping")
ping_result.raise_for_status()
print(f" Connectivity OK: {ping_result.json()}")
# 2. Test authentication
print("2. Testing authentication...")
auth_result = self.call_api('/api/Action/ping/authenticated')
print(f" Authentication OK: {auth_result['status']}")
# 3. Get action history
print("3. Fetching action history...")
history = self.call_api('/api/Action/history?limit=5')
print(f" Retrieved {len(history['actions'])} actions")
print("Quick start completed successfully!")
return history
except Exception as e:
print(f"Quick start failed: {e}")
raise
# Usage example
if __name__ == "__main__":
# Configure your credentials
quick_start = MindzieQuickStart(
base_url='https://your-mindzie-instance.com/api',
token='YOUR_ACCESS_TOKEN',
tenant_id='YOUR_TENANT_GUID',
project_id='YOUR_PROJECT_GUID'
)
# Run the quick start
result = quick_start.run_quick_start()
print(f"Final result: {json.dumps(result, indent=2)}")
```
## C#/.NET Example
Complete example using C# HttpClient:
```csharp
using System;
using System.Net.Http;
using System.Text.Json;
using System.Threading.Tasks;
public class MindzieQuickStart
{
private readonly HttpClient _httpClient;
private readonly string _baseUrl;
public MindzieQuickStart(string baseUrl, string token, string tenantId, string projectId)
{
_baseUrl = baseUrl.TrimEnd('/');
_httpClient = new HttpClient();
_httpClient.DefaultRequestHeaders.Add("Authorization", $"Bearer {token}");
_httpClient.DefaultRequestHeaders.Add("X-Tenant-Id", tenantId);
_httpClient.DefaultRequestHeaders.Add("X-Project-Id", projectId);
}
public async Task CallApiAsync(string endpoint)
{
try
{
var response = await _httpClient.GetAsync($"{_baseUrl}{endpoint}");
response.EnsureSuccessStatusCode();
var content = await response.Content.ReadAsStringAsync();
return JsonSerializer.Deserialize(content, new JsonSerializerOptions
{
PropertyNameCaseInsensitive = true
});
}
catch (HttpRequestException ex)
{
Console.WriteLine($"API call failed: {ex.Message}");
throw;
}
}
public async Task RunQuickStartAsync()
{
Console.WriteLine("Starting mindzie API Quick Start...");
try
{
// 1. Test connectivity
Console.WriteLine("1. Testing connectivity...");
using var pingClient = new HttpClient();
var pingResponse = await pingClient.GetAsync($"{_baseUrl}/api/Action/ping");
pingResponse.EnsureSuccessStatusCode();
Console.WriteLine(" Connectivity OK");
// 2. Test authentication
Console.WriteLine("2. Testing authentication...");
var authResult = await CallApiAsync("/api/Action/ping/authenticated");
Console.WriteLine($" Authentication OK: {authResult.Status}");
// 3. Get action history
Console.WriteLine("3. Fetching action history...");
var history = await CallApiAsync("/api/Action/history?limit=5");
Console.WriteLine($" Retrieved {history.Actions.Length} actions");
Console.WriteLine("Quick start completed successfully!");
}
catch (Exception ex)
{
Console.WriteLine($"Quick start failed: {ex.Message}");
throw;
}
}
public void Dispose()
{
_httpClient?.Dispose();
}
}
// Data models
public class AuthResponse
{
public string Status { get; set; }
public string TenantId { get; set; }
public string ProjectId { get; set; }
public string UserId { get; set; }
}
public class ActionHistoryResponse
{
public ActionItem[] Actions { get; set; }
public PaginationInfo Pagination { get; set; }
}
public class ActionItem
{
public string ActionId { get; set; }
public string ActionType { get; set; }
public string Status { get; set; }
public DateTime StartTime { get; set; }
public DateTime? EndTime { get; set; }
}
public class PaginationInfo
{
public int CurrentPage { get; set; }
public int TotalPages { get; set; }
public int TotalItems { get; set; }
}
// Usage
class Program
{
static async Task Main(string[] args)
{
var quickStart = new MindzieQuickStart(
"https://your-mindzie-instance.com/api",
"YOUR_ACCESS_TOKEN",
"YOUR_TENANT_GUID",
"YOUR_PROJECT_GUID"
);
try
{
await quickStart.RunQuickStartAsync();
}
finally
{
quickStart.Dispose();
}
}
}
```
## Common Issues & Solutions
### Authentication Failures
- **401 Unauthorized:** Verify your access token is correct and not expired
- **403 Forbidden:** Check tenant/project IDs and user permissions
- **400 Bad Request:** Ensure all required headers are included
### Connection Issues
- **Network timeouts:** Check firewall settings and network connectivity
- **SSL/TLS errors:** Verify certificate validity and HTTPS configuration
- **DNS resolution:** Confirm the mindzie instance URL is correct
### Rate Limiting
- **429 Too Many Requests:** Implement exponential backoff retry logic
- **Monitor rate limits:** Check response headers for rate limit information
- **Optimize requests:** Use pagination and filtering to reduce API calls
## Next Steps
**Congratulations!** You've successfully completed the mindzieAPI quick start. Next, explore the [Actions API](/mindzie_api/action) or [Blocks API](/mindzie_api/block) to start building powerful integrations.
---
## Overview
Section: Dashboard
URL: https://docs.mindziestudio.com/mindzie_api/dashboard/overview
Source: /docs-master/mindzieAPI/dashboard/overview/page.md
# Dashboards
## Dashboard Management API
Retrieve dashboards, access panel configurations, and generate shareable URLs for process mining insights and visualization management.
## Features
### Dashboard Retrieval
List and retrieve dashboards with comprehensive metadata and panel counts.
[View Dashboards](/mindzie_api/dashboard/management)
### Panel Information
Access dashboard panel configurations including layout and visualization settings.
[View Panels](/mindzie_api/dashboard/panels)
### Sharing & URLs
Generate shareable links and embed URLs for dashboard access.
[Share Dashboards](/mindzie_api/dashboard/sharing)
## Available Endpoints
### Connectivity Testing
- **GET** `/api/{tenantId}/{projectId}/dashboard/unauthorized-ping` - Public connectivity test (no auth required)
- **GET** `/api/{tenantId}/{projectId}/dashboard/ping` - Authenticated connectivity test
### Dashboard Operations
Core operations for accessing dashboard resources.
- **GET** `/api/{tenantId}/{projectId}/dashboard` - List all dashboards in a project
- **GET** `/api/{tenantId}/{projectId}/dashboard/{dashboardId}` - Get specific dashboard details
### Panel Operations
Access visualization panels within dashboards.
- **GET** `/api/{tenantId}/{projectId}/dashboard/{dashboardId}/panels` - Get all panels in a dashboard
### URL Operations
Generate shareable URLs and embed codes.
- **GET** `/api/{tenantId}/{projectId}/dashboard/{dashboardId}/url` - Get shareable dashboard URLs
## Creating Dashboards
Dashboards are created within investigations through the mindzieStudio UI. Dashboard creation requires investigation context and notebook relationships that are managed through the application:
1. Create an investigation via the Investigation API or UI
2. Add dashboard blocks to notebooks within that investigation
3. Dashboards become accessible via this API
## Dashboard Components
mindzieStudio dashboards provide powerful visualization capabilities:
### Process Mining Visualizations
Charts and graphs for process analysis and discovery.
- Process maps and flowcharts
- Performance metrics charts
- Timeline visualizations
### KPI Dashboards
Key performance indicators and business metrics.
- Real-time KPI widgets
- Trend analysis charts
- Comparison dashboards
### Interactive Panels
Configurable panels with drag-and-drop positioning.
- Flexible layout management
- Responsive panel sizing
- Custom panel configurations
## Common Use Cases
- **Executive Dashboards:** Access high-level KPI dashboards for management reporting
- **Operational Monitoring:** View real-time dashboards for process monitoring
- **Embedded Insights:** Integrate dashboard panels into external applications
- **Stakeholder Sharing:** Generate shareable URLs for collaborative analysis
## Authentication
All Dashboard API endpoints (except `unauthorized-ping`) require valid authentication with appropriate permissions for the target project and tenant.
## Get Started
Begin with [Dashboard Management](/mindzie_api/dashboard/management) to learn how to list and retrieve dashboards, then explore [Sharing](/mindzie_api/dashboard/sharing) for URL generation.
---
## Management
Section: Dashboard
URL: https://docs.mindziestudio.com/mindzie_api/dashboard/management
Source: /docs-master/mindzieAPI/dashboard/management/page.md
# Dashboard Management
## List and Retrieve Dashboards
Access dashboards that contain visualization panels for process mining insights, KPIs, and analytics. Dashboards are containers for displaying your analytical results in an organized, shareable format.
## Connectivity Testing
### Unauthorized Ping
**GET** `/api/{tenantId}/{projectId}/dashboard/unauthorized-ping`
Test endpoint that does not require authentication. Use this to verify the Dashboard API is accessible.
#### Response
```
Ping Successful
```
### Authenticated Ping
**GET** `/api/{tenantId}/{projectId}/dashboard/ping`
Authenticated ping endpoint to verify API access for a specific tenant and project.
#### Response (200 OK)
```
Ping Successful (tenant id: {tenantId})
```
#### Response (401 Unauthorized)
```
{error message describing authorization failure}
```
## List All Dashboards
**GET** `/api/{tenantId}/{projectId}/dashboard`
Retrieves a paginated list of all dashboards within the specified project. Each dashboard includes metadata, panel count, and a shareable URL.
### Path Parameters
| Parameter | Type | Required | Description |
|-----------|------|----------|-------------|
| `tenantId` | GUID | Yes | The tenant identifier |
| `projectId` | GUID | Yes | The project identifier |
### Query Parameters
| Parameter | Type | Default | Description |
|-----------|------|---------|-------------|
| `page` | integer | 1 | Page number for pagination |
| `pageSize` | integer | 50 | Number of items per page (max recommended: 100) |
### Response (200 OK)
```json
{
"dashboards": [
{
"dashboardId": "880e8400-e29b-41d4-a716-446655440000",
"projectId": "660e8400-e29b-41d4-a716-446655440000",
"name": "Process Overview Dashboard",
"description": "Main dashboard showing key process metrics",
"panelCount": 8,
"url": "https://your-instance.com/dashboard/880e8400-e29b-41d4-a716-446655440000",
"dateCreated": "2024-01-15T10:30:00Z",
"dateModified": "2024-01-20T14:45:00Z",
"createdBy": "user@example.com",
"modifiedBy": "user@example.com"
}
],
"totalCount": 25,
"page": 1,
"pageSize": 50
}
```
### Response Fields
| Field | Type | Description |
|-------|------|-------------|
| `dashboards` | array | List of dashboard objects |
| `totalCount` | integer | Total number of dashboards |
| `page` | integer | Current page number |
| `pageSize` | integer | Items per page |
### Dashboard Object Fields
| Field | Type | Description |
|-------|------|-------------|
| `dashboardId` | GUID | Unique identifier for the dashboard |
| `projectId` | GUID | Project this dashboard belongs to |
| `name` | string | Display name of the dashboard |
| `description` | string | Description of the dashboard |
| `panelCount` | integer | Number of panels in the dashboard |
| `url` | string | Shareable URL for the dashboard |
| `dateCreated` | datetime | When the dashboard was created |
| `dateModified` | datetime | When the dashboard was last modified |
| `createdBy` | string | User who created the dashboard |
| `modifiedBy` | string | User who last modified the dashboard |
## Get Dashboard Details
**GET** `/api/{tenantId}/{projectId}/dashboard/{dashboardId}`
Retrieves comprehensive information about a specific dashboard including metadata, panel count, and shareable URL.
### Path Parameters
| Parameter | Type | Required | Description |
|-----------|------|----------|-------------|
| `tenantId` | GUID | Yes | The tenant identifier |
| `projectId` | GUID | Yes | The project identifier |
| `dashboardId` | GUID | Yes | The dashboard identifier |
### Response (200 OK)
```json
{
"dashboardId": "880e8400-e29b-41d4-a716-446655440000",
"projectId": "660e8400-e29b-41d4-a716-446655440000",
"name": "Process Overview Dashboard",
"description": "Main dashboard showing key process metrics and performance indicators",
"panelCount": 8,
"url": "https://your-instance.com/dashboard/880e8400-e29b-41d4-a716-446655440000",
"dateCreated": "2024-01-15T10:30:00Z",
"dateModified": "2024-01-20T14:45:00Z",
"createdBy": "user@example.com",
"modifiedBy": "user@example.com"
}
```
### Error Responses
**Not Found (404):**
```json
{
"Error": "Dashboard not found",
"DashboardId": "880e8400-e29b-41d4-a716-446655440000"
}
```
## Creating Dashboards
Dashboard creation is managed through the mindzieStudio UI as it requires investigation context and notebook relationships. See [Dashboard Overview](/mindzie_api/dashboard/overview) for details.
## Implementation Examples
### cURL
```bash
# Test connectivity (no auth)
curl -X GET "https://your-mindzie-instance.com/api/12345678-1234-1234-1234-123456789012/87654321-4321-4321-4321-210987654321/dashboard/unauthorized-ping"
# Test connectivity (authenticated)
curl -X GET "https://your-mindzie-instance.com/api/12345678-1234-1234-1234-123456789012/87654321-4321-4321-4321-210987654321/dashboard/ping" \
-H "Authorization: Bearer YOUR_ACCESS_TOKEN"
# List all dashboards
curl -X GET "https://your-mindzie-instance.com/api/12345678-1234-1234-1234-123456789012/87654321-4321-4321-4321-210987654321/dashboard?page=1&pageSize=50" \
-H "Authorization: Bearer YOUR_ACCESS_TOKEN"
# Get specific dashboard
curl -X GET "https://your-mindzie-instance.com/api/12345678-1234-1234-1234-123456789012/87654321-4321-4321-4321-210987654321/dashboard/880e8400-e29b-41d4-a716-446655440000" \
-H "Authorization: Bearer YOUR_ACCESS_TOKEN"
```
### JavaScript/Node.js
```javascript
const TENANT_ID = '12345678-1234-1234-1234-123456789012';
const PROJECT_ID = '87654321-4321-4321-4321-210987654321';
const BASE_URL = 'https://your-mindzie-instance.com';
class DashboardManager {
constructor(token) {
this.headers = {
'Authorization': `Bearer ${token}`,
'Content-Type': 'application/json'
};
}
async getAllDashboards(page = 1, pageSize = 50) {
const url = `${BASE_URL}/api/${TENANT_ID}/${PROJECT_ID}/dashboard?page=${page}&pageSize=${pageSize}`;
const response = await fetch(url, { headers: this.headers });
return await response.json();
}
async getDashboard(dashboardId) {
const url = `${BASE_URL}/api/${TENANT_ID}/${PROJECT_ID}/dashboard/${dashboardId}`;
const response = await fetch(url, { headers: this.headers });
if (response.ok) {
return await response.json();
} else if (response.status === 404) {
throw new Error('Dashboard not found');
} else {
throw new Error(`Failed to get dashboard: ${response.status}`);
}
}
async listAllDashboards() {
const allDashboards = [];
let page = 1;
while (true) {
const result = await this.getAllDashboards(page);
allDashboards.push(...result.dashboards);
if (allDashboards.length >= result.totalCount) {
break;
}
page++;
}
return allDashboards;
}
}
// Usage
const manager = new DashboardManager('your-auth-token');
// Get all dashboards
const result = await manager.getAllDashboards();
console.log(`Found ${result.totalCount} dashboards`);
result.dashboards.forEach(d => {
console.log(`- ${d.name}: ${d.panelCount} panels`);
console.log(` URL: ${d.url}`);
});
```
### Python
```python
import requests
TENANT_ID = '12345678-1234-1234-1234-123456789012'
PROJECT_ID = '87654321-4321-4321-4321-210987654321'
BASE_URL = 'https://your-mindzie-instance.com'
class DashboardManager:
def __init__(self, token):
self.headers = {
'Authorization': f'Bearer {token}',
'Content-Type': 'application/json'
}
def get_all_dashboards(self, page=1, page_size=50):
"""Get paginated list of dashboards."""
url = f'{BASE_URL}/api/{TENANT_ID}/{PROJECT_ID}/dashboard'
params = {'page': page, 'pageSize': page_size}
response = requests.get(url, headers=self.headers, params=params)
return response.json()
def get_dashboard(self, dashboard_id):
"""Get dashboard details."""
url = f'{BASE_URL}/api/{TENANT_ID}/{PROJECT_ID}/dashboard/{dashboard_id}'
response = requests.get(url, headers=self.headers)
if response.ok:
return response.json()
elif response.status_code == 404:
raise Exception('Dashboard not found')
else:
raise Exception(f'Failed to get dashboard: {response.status_code}')
def list_all_dashboards(self):
"""Get all dashboards (handling pagination)."""
all_dashboards = []
page = 1
while True:
result = self.get_all_dashboards(page=page)
all_dashboards.extend(result['dashboards'])
if len(all_dashboards) >= result['totalCount']:
break
page += 1
return all_dashboards
# Usage
manager = DashboardManager('your-auth-token')
# Get all dashboards
dashboards = manager.get_all_dashboards()
print(f"Total dashboards: {dashboards['totalCount']}")
for dashboard in dashboards['dashboards']:
print(f"\nDashboard: {dashboard['name']}")
print(f" Panels: {dashboard['panelCount']}")
print(f" URL: {dashboard['url']}")
```
### C#
```csharp
using System;
using System.Collections.Generic;
using System.Net.Http;
using System.Text.Json;
using System.Threading.Tasks;
public class DashboardListReturn
{
public List Dashboards { get; set; }
public int TotalCount { get; set; }
public int Page { get; set; }
public int PageSize { get; set; }
}
public class DashboardReturn
{
public Guid DashboardId { get; set; }
public Guid ProjectId { get; set; }
public string Name { get; set; }
public string Description { get; set; }
public int PanelCount { get; set; }
public string Url { get; set; }
public DateTime DateCreated { get; set; }
public DateTime DateModified { get; set; }
public string CreatedBy { get; set; }
public string ModifiedBy { get; set; }
}
public class DashboardApiClient
{
private readonly HttpClient _httpClient;
private readonly string _baseUrl;
private readonly Guid _tenantId;
private readonly Guid _projectId;
public DashboardApiClient(string baseUrl, Guid tenantId, Guid projectId, string accessToken)
{
_baseUrl = baseUrl;
_tenantId = tenantId;
_projectId = projectId;
_httpClient = new HttpClient();
_httpClient.DefaultRequestHeaders.Authorization =
new System.Net.Http.Headers.AuthenticationHeaderValue("Bearer", accessToken);
}
public async Task GetAllDashboardsAsync(int page = 1, int pageSize = 50)
{
var url = $"{_baseUrl}/api/{_tenantId}/{_projectId}/dashboard?page={page}&pageSize={pageSize}";
var response = await _httpClient.GetAsync(url);
if (response.IsSuccessStatusCode)
{
var json = await response.Content.ReadAsStringAsync();
return JsonSerializer.Deserialize(json,
new JsonSerializerOptions { PropertyNameCaseInsensitive = true });
}
throw new Exception($"Failed to get dashboards: {response.StatusCode}");
}
public async Task GetDashboardAsync(Guid dashboardId)
{
var url = $"{_baseUrl}/api/{_tenantId}/{_projectId}/dashboard/{dashboardId}";
var response = await _httpClient.GetAsync(url);
if (response.IsSuccessStatusCode)
{
var json = await response.Content.ReadAsStringAsync();
return JsonSerializer.Deserialize(json,
new JsonSerializerOptions { PropertyNameCaseInsensitive = true });
}
else if (response.StatusCode == System.Net.HttpStatusCode.NotFound)
{
throw new Exception($"Dashboard {dashboardId} not found");
}
throw new Exception($"Failed to get dashboard: {response.StatusCode}");
}
}
```
---
## Panels
Section: Dashboard
URL: https://docs.mindziestudio.com/mindzie_api/dashboard/panels
Source: /docs-master/mindzieAPI/dashboard/panels/page.md
# Panel Information
## Access Dashboard Panel Configurations
View and create visualization panels in dashboards including their layout, positioning, and configuration settings.
## Get Dashboard Panels
**GET** `/api/{tenantId}/{projectId}/dashboard/{dashboardId}/panels`
Retrieves all visualization panels configured in a dashboard, including panel types, positions, dimensions, and configuration settings.
### Path Parameters
| Parameter | Type | Required | Description |
|-----------|------|----------|-------------|
| `tenantId` | GUID | Yes | The tenant identifier |
| `projectId` | GUID | Yes | The project identifier |
| `dashboardId` | GUID | Yes | The dashboard identifier |
### Response (200 OK)
```json
{
"dashboardId": "880e8400-e29b-41d4-a716-446655440000",
"panels": [
{
"panelId": "990e8400-e29b-41d4-a716-446655440000",
"name": "Process Flow Chart",
"panelType": "DashboardPanelProcessMap",
"position": "Row: 1, Col: 1",
"width": 6,
"height": 4,
"configuration": "{\"dataSource\": \"MainProcess\", \"visualization\": \"flow\"}"
},
{
"panelId": "aa0e8400-e29b-41d4-a716-446655440000",
"name": "KPI Summary",
"panelType": "DashboardPanelSingleValue",
"position": "Row: 1, Col: 7",
"width": 3,
"height": 2,
"configuration": "{\"metric\": \"avgCycleTime\", \"format\": \"duration\"}"
}
]
}
```
### Response Fields
| Field | Type | Description |
|-------|------|-------------|
| `dashboardId` | GUID | The dashboard containing these panels |
| `panels` | array | List of panel objects |
### Panel Object Fields
| Field | Type | Description |
|-------|------|-------------|
| `panelId` | GUID | Unique identifier for the panel |
| `name` | string | Display title of the panel |
| `panelType` | string | Type of visualization (see Panel Types section) |
| `position` | string | Grid position as "Row: X, Col: Y" |
| `width` | integer | Panel width in grid units |
| `height` | integer | Panel height in grid units |
| `configuration` | string | JSON string containing panel-specific settings |
### Error Responses
**Not Found (404):**
```json
{
"Error": "Dashboard not found",
"DashboardId": "880e8400-e29b-41d4-a716-446655440000"
}
```
## Create Dashboard Panel
**POST** `/api/{tenantId}/{projectId}/dashboard/{dashboardId}/panel`
Creates a new visualization panel in a dashboard. The API automatically creates the appropriate selector block based on the panel type and settings provided.
### Path Parameters
| Parameter | Type | Required | Description |
|-----------|------|----------|-------------|
| `tenantId` | GUID | Yes | The tenant identifier |
| `projectId` | GUID | Yes | The project identifier |
| `dashboardId` | GUID | Yes | The dashboard identifier |
### Request Body
```json
{
"title": "string (required)",
"description": "string (optional)",
"panelType": "string (required)",
"blockId": "GUID (required for data panels)",
"row": "integer (required, 0-based)",
"column": "integer (required, 0-based)",
"width": "integer (required, 1-12)",
"height": "integer (required, 1-20)",
"settings": "string (optional, JSON for selector configuration)"
}
```
### Request Body Fields
| Field | Type | Required | Description |
|-------|------|----------|-------------|
| `title` | string | Yes | Display title of the panel |
| `description` | string | No | Optional description |
| `panelType` | string | Yes | Panel type class name (see Panel Types section) |
| `blockId` | GUID | Yes* | Calculator block ID to display (*not required for DashboardPanelDashboardNote) |
| `row` | integer | Yes | Row position (0-based) |
| `column` | integer | Yes | Column position (0-based) |
| `width` | integer | Yes | Panel width in grid units (1-12) |
| `height` | integer | Yes | Panel height in grid units (1-20) |
| `settings` | string | No | JSON string with selector configuration |
### Response (201 Created)
```json
{
"panelId": "5b54172c-b15c-4dd9-bab6-6cfceb7389df",
"title": "My KPI Panel",
"dashboardPanelClassName": "DashboardPanelSingleValue",
"row": 0,
"column": 0,
"width": 2,
"height": 1,
"blockId": "db0dd1b9-63b5-4754-92b1-2764f4a3fb68"
}
```
**Note:** The `blockId` in the response is the SELECTOR block ID, not the original calculator block ID. The API automatically creates a selector block that wraps the calculator.
### Error Responses
**Bad Request (400) - Missing Block:**
```json
{
"Error": "VALIDATION_ERROR",
"Message": "BlockId is required for panel type 'DashboardPanelSingleValue'"
}
```
**Bad Request (400) - Invalid Panel Type:**
```json
{
"Error": "VALIDATION_ERROR",
"Message": "Invalid panel type 'InvalidType'. Valid types: DashboardPanelSingleValue, DashboardPanelCalculator, ..."
}
```
**Bad Request (400) - Block Not Found:**
```json
{
"Error": "VALIDATION_ERROR",
"Message": "Block 'guid' does not exist"
}
```
## Panel Types
mindzieStudio dashboards support the following panel types:
| Panel Type Class | Selector Created | Description |
|------------------|------------------|-------------|
| `DashboardPanelCalculator` | SelectorFullCalculator | Full calculator output (process maps, trends, charts) |
| `DashboardPanelSingleValue` | SelectorSingleValueFromLabel | Single value / KPI card |
| `DashboardPanelHorizontalBarChart` | SelectorMultiColumns | Horizontal bar chart, ranked lists |
| `DashboardPanelDataTable` | SelectorFullCalculator | Data table display |
| `DashboardPanelProcessMap` | SelectorFullCalculator | Process map visualization |
| `DashboardPanelDashboardNote` | (none) | Text/note panel (no blockId required) |
| `DashboardPanelRecommendationSentence` | (none) | AI recommendation display |
## Panel Settings by Type
### DashboardPanelSingleValue (KPI Cards)
When `panelType` is `DashboardPanelSingleValue`, the settings configure how to extract a single value from a calculator's output:
```json
{
"tableIndex": 0,
"labelColumnName": "Name",
"labelName": "Total Case Count",
"valueColumnName": "Value",
"formatText": "N0"
}
```
| Setting | Type | Description |
|---------|------|-------------|
| `tableIndex` | integer | Which output table to use (usually 0) |
| `labelColumnName` | string | Column containing labels (usually "Name") |
| `labelName` | string | The label to find (e.g., "Total Case Count") |
| `valueColumnName` | string | Column containing the value (usually "Value") |
| `formatText` | string | .NET format string (N0, F2, P0, etc.) |
**Best used with:** CalculatorDataInformation, CalculatorOverview
### DashboardPanelHorizontalBarChart (Bar Charts)
When `panelType` is `DashboardPanelHorizontalBarChart`, include `columnNames` in settings to trigger SelectorMultiColumns:
```json
{
"tableIndex": 0,
"columnNames": ["ActivityName", "Count"],
"sortColumnName": "Count",
"sortAscending": false,
"maxRows": 10
}
```
| Setting | Type | Description |
|---------|------|-------------|
| `tableIndex` | integer | Which output table to use |
| `columnNames` | array | Columns to include in chart (MUST match calculator output) |
| `sortColumnName` | string | Column to sort by |
| `sortAscending` | boolean | Sort direction |
| `maxRows` | integer | Maximum rows to display |
**IMPORTANT:** Column names must exactly match the calculator's output columns. For example, `CalculatorActivityFrequency` uses the dataset's activity column name (e.g., "ActivityName"), not a generic "Activity".
**Best used with:** CalculatorActivityFrequency, CalculatorResourceFrequency
### DashboardPanelCalculator (Full Visualizations)
For full calculator output (process maps, trends), no special settings are required:
```json
{}
```
Or omit the settings parameter entirely.
## Panel Architecture
Dashboard panels don't connect directly to calculator blocks. Instead, they use a three-layer architecture:
```
Panel.InputBlockId -> Selector Block -> Calculator Block (via parent_id)
```
**Why Selectors?** Selector blocks define HOW to display calculator output:
- **SelectorFullCalculator**: Display entire output with visualization settings
- **SelectorSingleValueFromLabel**: Extract one value by label lookup
- **SelectorMultiColumns**: Extract specific columns with sorting/limiting
The API automatically creates the appropriate selector block when you create a panel pointing to a calculator.
## Panel Layout System
Dashboard panels use a grid-based layout system:
- **Grid Units:** 12-column grid system
- **Position:** Row and column coordinates (0-based)
- **Size:** Width (1-12 columns), Height (1-20 rows)
- **Responsive:** Automatic scaling on different screen sizes
## Implementation Examples
### Get Dashboard Panels
#### cURL
```bash
curl -X GET "https://your-mindzie-instance.com/api/12345678-1234-1234-1234-123456789012/87654321-4321-4321-4321-210987654321/dashboard/880e8400-e29b-41d4-a716-446655440000/panels" \
-H "Authorization: Bearer YOUR_ACCESS_TOKEN"
```
### Create KPI Panel (Single Value)
```bash
curl -X POST "https://your-mindzie-instance.com/api/{tenantId}/{projectId}/dashboard/{dashboardId}/panel" \
-H "Authorization: Bearer YOUR_API_KEY" \
-H "Content-Type: application/json" \
-d '{
"title": "Total Cases",
"panelType": "DashboardPanelSingleValue",
"blockId": "calculator-data-information-guid",
"row": 0,
"column": 0,
"width": 2,
"height": 1,
"settings": "{\"tableIndex\":0,\"labelColumnName\":\"Name\",\"labelName\":\"Total Case Count\",\"valueColumnName\":\"Value\",\"formatText\":\"N0\"}"
}'
```
### Create Horizontal Bar Chart
```bash
curl -X POST "https://your-mindzie-instance.com/api/{tenantId}/{projectId}/dashboard/{dashboardId}/panel" \
-H "Authorization: Bearer YOUR_API_KEY" \
-H "Content-Type: application/json" \
-d '{
"title": "Activity Distribution",
"panelType": "DashboardPanelHorizontalBarChart",
"blockId": "calculator-activity-frequency-guid",
"row": 1,
"column": 0,
"width": 6,
"height": 3,
"settings": "{\"tableIndex\":0,\"columnNames\":[\"ActivityName\",\"Count\"],\"sortColumnName\":\"Count\",\"sortAscending\":false,\"maxRows\":10}"
}'
```
### Create Full Calculator Panel
```bash
curl -X POST "https://your-mindzie-instance.com/api/{tenantId}/{projectId}/dashboard/{dashboardId}/panel" \
-H "Authorization: Bearer YOUR_API_KEY" \
-H "Content-Type: application/json" \
-d '{
"title": "Case Count",
"panelType": "DashboardPanelCalculator",
"blockId": "calculator-case-count-guid",
"row": 0,
"column": 2,
"width": 2,
"height": 1
}'
```
### JavaScript/Node.js
```javascript
const TENANT_ID = '12345678-1234-1234-1234-123456789012';
const PROJECT_ID = '87654321-4321-4321-4321-210987654321';
const BASE_URL = 'https://your-mindzie-instance.com';
async function getDashboardPanels(dashboardId, token) {
const url = `${BASE_URL}/api/${TENANT_ID}/${PROJECT_ID}/dashboard/${dashboardId}/panels`;
const response = await fetch(url, {
headers: {
'Authorization': `Bearer ${token}`,
'Content-Type': 'application/json'
}
});
if (response.ok) {
return await response.json();
} else if (response.status === 404) {
throw new Error('Dashboard not found');
} else {
throw new Error(`Failed to get panels: ${response.status}`);
}
}
async function createDashboardPanel(dashboardId, panelData, token) {
const url = `${BASE_URL}/api/${TENANT_ID}/${PROJECT_ID}/dashboard/${dashboardId}/panel`;
const response = await fetch(url, {
method: 'POST',
headers: {
'Authorization': `Bearer ${token}`,
'Content-Type': 'application/json'
},
body: JSON.stringify(panelData)
});
if (response.ok) {
return await response.json();
} else {
const error = await response.json();
throw new Error(error.Message || `Failed to create panel: ${response.status}`);
}
}
// Usage - Get panels
const panels = await getDashboardPanels('dashboard-guid', 'your-auth-token');
console.log(`Dashboard: ${panels.dashboardId}`);
console.log(`Panels: ${panels.panels.length}`);
// Usage - Create KPI panel
const newPanel = await createDashboardPanel('dashboard-guid', {
title: 'Total Cases',
panelType: 'DashboardPanelSingleValue',
blockId: 'calculator-data-information-guid',
row: 0,
column: 0,
width: 2,
height: 1,
settings: JSON.stringify({
tableIndex: 0,
labelColumnName: 'Name',
labelName: 'Total Case Count',
valueColumnName: 'Value',
formatText: 'N0'
})
}, 'your-auth-token');
console.log(`Created panel: ${newPanel.panelId}`);
```
### Python
```python
import requests
import json
TENANT_ID = '12345678-1234-1234-1234-123456789012'
PROJECT_ID = '87654321-4321-4321-4321-210987654321'
BASE_URL = 'https://your-mindzie-instance.com'
def get_dashboard_panels(dashboard_id, token):
"""Get all panels in a dashboard."""
url = f'{BASE_URL}/api/{TENANT_ID}/{PROJECT_ID}/dashboard/{dashboard_id}/panels'
headers = {
'Authorization': f'Bearer {token}',
'Content-Type': 'application/json'
}
response = requests.get(url, headers=headers)
if response.ok:
return response.json()
elif response.status_code == 404:
raise Exception('Dashboard not found')
else:
raise Exception(f'Failed to get panels: {response.status_code}')
def create_dashboard_panel(dashboard_id, panel_data, token):
"""Create a new panel in a dashboard."""
url = f'{BASE_URL}/api/{TENANT_ID}/{PROJECT_ID}/dashboard/{dashboard_id}/panel'
headers = {
'Authorization': f'Bearer {token}',
'Content-Type': 'application/json'
}
response = requests.post(url, headers=headers, json=panel_data)
if response.ok:
return response.json()
else:
error = response.json()
raise Exception(error.get('Message', f'Failed to create panel: {response.status_code}'))
# Usage - Get panels
panels = get_dashboard_panels('dashboard-guid', 'your-auth-token')
print(f"Dashboard: {panels['dashboardId']}")
print(f"Panel count: {len(panels['panels'])}")
# Usage - Create KPI panel
settings = {
'tableIndex': 0,
'labelColumnName': 'Name',
'labelName': 'Total Case Count',
'valueColumnName': 'Value',
'formatText': 'N0'
}
new_panel = create_dashboard_panel('dashboard-guid', {
'title': 'Total Cases',
'panelType': 'DashboardPanelSingleValue',
'blockId': 'calculator-data-information-guid',
'row': 0,
'column': 0,
'width': 2,
'height': 1,
'settings': json.dumps(settings)
}, 'your-auth-token')
print(f"Created panel: {new_panel['panelId']}")
```
### C#
```csharp
using System;
using System.Collections.Generic;
using System.Net.Http;
using System.Text;
using System.Text.Json;
using System.Threading.Tasks;
public class DashboardPanelsResponse
{
public Guid DashboardId { get; set; }
public List Panels { get; set; }
}
public class PanelInfo
{
public Guid PanelId { get; set; }
public string Name { get; set; }
public string PanelType { get; set; }
public string Position { get; set; }
public int Width { get; set; }
public int Height { get; set; }
public string Configuration { get; set; }
}
public class CreatePanelRequest
{
public string Title { get; set; }
public string Description { get; set; }
public string PanelType { get; set; }
public Guid BlockId { get; set; }
public int Row { get; set; }
public int Column { get; set; }
public int Width { get; set; }
public int Height { get; set; }
public string Settings { get; set; }
}
public class CreatePanelResponse
{
public Guid PanelId { get; set; }
public string Title { get; set; }
public string DashboardPanelClassName { get; set; }
public int Row { get; set; }
public int Column { get; set; }
public int Width { get; set; }
public int Height { get; set; }
public Guid BlockId { get; set; }
}
public class DashboardPanelClient
{
private readonly HttpClient _httpClient;
private readonly string _baseUrl;
private readonly Guid _tenantId;
private readonly Guid _projectId;
private readonly JsonSerializerOptions _jsonOptions;
public DashboardPanelClient(string baseUrl, Guid tenantId, Guid projectId, string accessToken)
{
_baseUrl = baseUrl;
_tenantId = tenantId;
_projectId = projectId;
_httpClient = new HttpClient();
_httpClient.DefaultRequestHeaders.Authorization =
new System.Net.Http.Headers.AuthenticationHeaderValue("Bearer", accessToken);
_jsonOptions = new JsonSerializerOptions { PropertyNameCaseInsensitive = true };
}
public async Task GetDashboardPanelsAsync(Guid dashboardId)
{
var url = $"{_baseUrl}/api/{_tenantId}/{_projectId}/dashboard/{dashboardId}/panels";
var response = await _httpClient.GetAsync(url);
if (response.IsSuccessStatusCode)
{
var json = await response.Content.ReadAsStringAsync();
return JsonSerializer.Deserialize(json, _jsonOptions);
}
else if (response.StatusCode == System.Net.HttpStatusCode.NotFound)
{
throw new Exception($"Dashboard {dashboardId} not found");
}
throw new Exception($"Failed to get panels: {response.StatusCode}");
}
public async Task CreatePanelAsync(Guid dashboardId, CreatePanelRequest request)
{
var url = $"{_baseUrl}/api/{_tenantId}/{_projectId}/dashboard/{dashboardId}/panel";
var json = JsonSerializer.Serialize(request, _jsonOptions);
var content = new StringContent(json, Encoding.UTF8, "application/json");
var response = await _httpClient.PostAsync(url, content);
if (response.IsSuccessStatusCode)
{
var responseJson = await response.Content.ReadAsStringAsync();
return JsonSerializer.Deserialize(responseJson, _jsonOptions);
}
var errorJson = await response.Content.ReadAsStringAsync();
throw new Exception($"Failed to create panel: {errorJson}");
}
}
// Usage
var client = new DashboardPanelClient(
"https://your-mindzie-instance.com",
Guid.Parse("12345678-1234-1234-1234-123456789012"),
Guid.Parse("87654321-4321-4321-4321-210987654321"),
"your-access-token");
// Get panels
var panels = await client.GetDashboardPanelsAsync(Guid.Parse("dashboard-guid"));
Console.WriteLine($"Dashboard: {panels.DashboardId}");
foreach (var panel in panels.Panels)
{
Console.WriteLine($"- {panel.Name} ({panel.PanelType})");
}
// Create KPI panel
var newPanel = await client.CreatePanelAsync(Guid.Parse("dashboard-guid"), new CreatePanelRequest
{
Title = "Total Cases",
PanelType = "DashboardPanelSingleValue",
BlockId = Guid.Parse("calculator-data-information-guid"),
Row = 0,
Column = 0,
Width = 2,
Height = 1,
Settings = JsonSerializer.Serialize(new
{
tableIndex = 0,
labelColumnName = "Name",
labelName = "Total Case Count",
valueColumnName = "Value",
formatText = "N0"
})
});
Console.WriteLine($"Created panel: {newPanel.PanelId}");
```
## Important Notes
### API Capabilities
- **Read Access:** Use GET endpoint to retrieve panel configurations
- **Create Access:** Use POST endpoint to create new panels with automatic selector block creation
- **Modify Access:** Panel modification is currently done through the mindzieStudio UI
- **Delete Access:** Panel deletion is currently done through the mindzieStudio UI
### Configuration Parsing
The `configuration` field contains a JSON string that must be parsed to access settings.
### Layout System
Panel positions use a row/column grid system with flexible sizing. Row and column values are 0-based when creating panels.
---
## Sharing
Section: Dashboard
URL: https://docs.mindziestudio.com/mindzie_api/dashboard/sharing
Source: /docs-master/mindzieAPI/dashboard/sharing/page.md
# Sharing & URLs
## Generate Shareable Dashboard URLs
Generate shareable links and embed URLs for dashboard access. Share dashboards with stakeholders or embed them in external applications.
## Get Dashboard URLs
**GET** `/api/{tenantId}/{projectId}/dashboard/{dashboardId}/url`
Generates shareable URLs for a dashboard, including standard view URLs and embed URLs for iframe integration.
### Path Parameters
| Parameter | Type | Required | Description |
|-----------|------|----------|-------------|
| `tenantId` | GUID | Yes | The tenant identifier |
| `projectId` | GUID | Yes | The project identifier |
| `dashboardId` | GUID | Yes | The dashboard identifier |
### Response (200 OK)
```json
{
"dashboardId": "880e8400-e29b-41d4-a716-446655440000",
"url": "https://your-instance.com/dashboard/880e8400-e29b-41d4-a716-446655440000",
"embedUrl": "https://your-instance.com/embed/dashboard/880e8400-e29b-41d4-a716-446655440000"
}
```
### Response Fields
| Field | Type | Description |
|-------|------|-------------|
| `dashboardId` | GUID | The dashboard identifier |
| `url` | string | Standard dashboard URL (requires authentication) |
| `embedUrl` | string | Embed URL for iframe integration |
### Error Responses
**Not Found (404):**
```json
{
"Error": "Dashboard not found",
"DashboardId": "880e8400-e29b-41d4-a716-446655440000"
}
```
## Dashboard Embedding
mindzieStudio dashboards can be embedded in external applications using iframe technology.
### Basic Embedding
```html
```
### Responsive Embedding
```html
```
## URL Types
### Standard URL
The standard dashboard URL requires user authentication:
- Users must log in to mindzieStudio to view the dashboard
- Provides full dashboard interactivity
- Suitable for internal team sharing
### Embed URL
The embed URL is designed for iframe integration:
- Simplified interface optimized for embedding
- May require additional authentication configuration
- Suitable for portals and external applications
## Implementation Examples
### cURL
```bash
# Get dashboard URLs
curl -X GET "https://your-mindzie-instance.com/api/12345678-1234-1234-1234-123456789012/87654321-4321-4321-4321-210987654321/dashboard/880e8400-e29b-41d4-a716-446655440000/url" \
-H "Authorization: Bearer YOUR_ACCESS_TOKEN"
```
### JavaScript/Node.js
```javascript
const TENANT_ID = '12345678-1234-1234-1234-123456789012';
const PROJECT_ID = '87654321-4321-4321-4321-210987654321';
const BASE_URL = 'https://your-mindzie-instance.com';
async function getDashboardUrls(dashboardId, token) {
const url = `${BASE_URL}/api/${TENANT_ID}/${PROJECT_ID}/dashboard/${dashboardId}/url`;
const response = await fetch(url, {
headers: {
'Authorization': `Bearer ${token}`,
'Content-Type': 'application/json'
}
});
if (response.ok) {
return await response.json();
} else if (response.status === 404) {
throw new Error('Dashboard not found');
} else {
throw new Error(`Failed to get URLs: ${response.status}`);
}
}
// Generate embed code
function generateEmbedCode(embedUrl, width = '100%', height = 600) {
return ``;
}
// Usage
const urls = await getDashboardUrls('dashboard-guid', 'your-auth-token');
console.log(`Dashboard URL: ${urls.url}`);
console.log(`Embed URL: ${urls.embedUrl}`);
console.log('\nEmbed code:');
console.log(generateEmbedCode(urls.embedUrl));
```
### Python
```python
import requests
TENANT_ID = '12345678-1234-1234-1234-123456789012'
PROJECT_ID = '87654321-4321-4321-4321-210987654321'
BASE_URL = 'https://your-mindzie-instance.com'
def get_dashboard_urls(dashboard_id, token):
"""Get shareable URLs for a dashboard."""
url = f'{BASE_URL}/api/{TENANT_ID}/{PROJECT_ID}/dashboard/{dashboard_id}/url'
headers = {
'Authorization': f'Bearer {token}',
'Content-Type': 'application/json'
}
response = requests.get(url, headers=headers)
if response.ok:
return response.json()
elif response.status_code == 404:
raise Exception('Dashboard not found')
else:
raise Exception(f'Failed to get URLs: {response.status_code}')
def generate_embed_code(embed_url, width='100%', height=600):
"""Generate HTML embed code for a dashboard."""
return f''''''
# Usage
urls = get_dashboard_urls('dashboard-guid', 'your-auth-token')
print(f"Dashboard URL: {urls['url']}")
print(f"Embed URL: {urls['embedUrl']}")
print('\nEmbed code:')
print(generate_embed_code(urls['embedUrl']))
```
### C#
```csharp
using System;
using System.Net.Http;
using System.Text.Json;
using System.Threading.Tasks;
public class DashboardUrlResponse
{
public Guid DashboardId { get; set; }
public string Url { get; set; }
public string EmbedUrl { get; set; }
}
public class DashboardSharingClient
{
private readonly HttpClient _httpClient;
private readonly string _baseUrl;
private readonly Guid _tenantId;
private readonly Guid _projectId;
public DashboardSharingClient(string baseUrl, Guid tenantId, Guid projectId, string accessToken)
{
_baseUrl = baseUrl;
_tenantId = tenantId;
_projectId = projectId;
_httpClient = new HttpClient();
_httpClient.DefaultRequestHeaders.Authorization =
new System.Net.Http.Headers.AuthenticationHeaderValue("Bearer", accessToken);
}
public async Task GetDashboardUrlsAsync(Guid dashboardId)
{
var url = $"{_baseUrl}/api/{_tenantId}/{_projectId}/dashboard/{dashboardId}/url";
var response = await _httpClient.GetAsync(url);
if (response.IsSuccessStatusCode)
{
var json = await response.Content.ReadAsStringAsync();
return JsonSerializer.Deserialize(json,
new JsonSerializerOptions { PropertyNameCaseInsensitive = true });
}
else if (response.StatusCode == System.Net.HttpStatusCode.NotFound)
{
throw new Exception($"Dashboard {dashboardId} not found");
}
throw new Exception($"Failed to get URLs: {response.StatusCode}");
}
public string GenerateEmbedCode(string embedUrl, string width = "100%", int height = 600)
{
return $@"";
}
}
// Usage
var client = new DashboardSharingClient(
"https://your-mindzie-instance.com",
Guid.Parse("12345678-1234-1234-1234-123456789012"),
Guid.Parse("87654321-4321-4321-4321-210987654321"),
"your-access-token");
var urls = await client.GetDashboardUrlsAsync(Guid.Parse("dashboard-guid"));
Console.WriteLine($"Dashboard URL: {urls.Url}");
Console.WriteLine($"Embed URL: {urls.EmbedUrl}");
Console.WriteLine("\nEmbed code:");
Console.WriteLine(client.GenerateEmbedCode(urls.EmbedUrl));
```
## Best Practices
- **Authentication:** Standard URLs require user authentication. Plan your sharing strategy accordingly.
- **Embedding:** Use embed URLs when integrating dashboards into external applications or portals.
- **Responsive Design:** Use responsive iframe techniques for mobile-friendly embedding.
- **Security:** Consider your organization's security policies when sharing dashboard URLs externally.
## Important Notes
- **Authentication Required:** Both URL types may require authentication depending on your security configuration.
- **Access Control:** Users accessing shared URLs must have appropriate permissions for the tenant and project.
- **Public Sharing:** Extended public sharing features (password protection, expiration, etc.) are managed through the mindzieStudio UI.
---
## Overview
Section: Response Formats
URL: https://docs.mindziestudio.com/mindzie_api/response-formats/overview
Source: /docs-master/mindzieAPI/response-formats/overview/page.md
# Response Formats
**Understanding API Response Structures**
Learn about mindzieAPI response formats, status codes, error handling patterns, and data structures to build robust integrations.
## Standard Response Format
All mindzieAPI responses follow consistent JSON formatting with predictable structures:
### Successful Response
```json
{
"data": {
// Primary response data
},
"metadata": {
"timestamp": "2024-01-15T10:30:00Z",
"requestId": "req_12345",
"version": "1.0.0"
},
"pagination": {
// Present for paginated responses
"currentPage": 1,
"totalPages": 5,
"totalItems": 100,
"itemsPerPage": 20,
"hasNext": true,
"hasPrevious": false
}
}
```
### Error Response
```json
{
"error": {
"code": "validation_failed",
"message": "Request validation failed",
"details": {
"field": "datasetId",
"reason": "Invalid GUID format"
},
"timestamp": "2024-01-15T10:30:00Z",
"requestId": "req_12345"
}
}
```
## Response Types
### Success Responses
HTTP 2xx status codes with structured JSON data and metadata.
### Error Responses
HTTP 4xx/5xx status codes with detailed error information.
### Pagination
Consistent pagination format for large dataset responses.
## HTTP Status Codes
### Success Codes (2xx)
| Code | Status | Description | Usage |
|------|--------|-------------|-------|
| `200` | OK | Request successful, data returned | GET requests, successful operations |
| `201` | Created | Resource successfully created | POST requests creating new resources |
| `202` | Accepted | Request accepted for async processing | Long-running operations, queued tasks |
| `204` | No Content | Request successful, no data returned | DELETE requests, updates without return data |
### Client Error Codes (4xx)
| Code | Status | Description | Common Causes |
|------|--------|-------------|---------------|
| `400` | Bad Request | Invalid request format or parameters | Missing headers, invalid JSON, malformed data |
| `401` | Unauthorized | Authentication required or failed | Missing/invalid token, expired credentials |
| `403` | Forbidden | Valid auth but insufficient permissions | Limited user access, wrong tenant/project |
| `404` | Not Found | Requested resource doesn't exist | Invalid endpoint, non-existent resource ID |
| `422` | Unprocessable Entity | Valid format but business logic validation failed | Invalid business rules, constraint violations |
| `429` | Too Many Requests | Rate limit exceeded | Too many API calls in time window |
### Server Error Codes (5xx)
| Code | Status | Description | Action |
|------|--------|-------------|--------|
| `500` | Internal Server Error | Unexpected server error | Retry with exponential backoff |
| `502` | Bad Gateway | Upstream service error | Check service status, retry later |
| `503` | Service Unavailable | Service temporarily unavailable | Retry after delay, check maintenance |
| `504` | Gateway Timeout | Request timeout | Increase timeout, optimize request |
## Common Response Patterns
### Single Resource Response
```json
{
"actionId": "87654321-4321-4321-4321-210987654321",
"actionType": "analyze",
"status": "completed",
"startTime": "2024-01-15T10:30:00Z",
"endTime": "2024-01-15T10:32:15Z",
"duration": 135,
"result": {
"outputId": "98765432-8765-4321-4321-987654321098",
"recordsProcessed": 10000
}
}
```
### Collection Response with Pagination
```json
{
"actions": [
{
"actionId": "87654321-4321-4321-4321-210987654321",
"actionType": "analyze",
"status": "completed"
},
{
"actionId": "11111111-2222-3333-4444-555555555555",
"actionType": "export",
"status": "processing"
}
],
"pagination": {
"currentPage": 1,
"totalPages": 5,
"totalItems": 100,
"itemsPerPage": 20,
"hasNext": true,
"hasPrevious": false,
"links": {
"first": "/api/Action/history?page=1&limit=20",
"next": "/api/Action/history?page=2&limit=20",
"last": "/api/Action/history?page=5&limit=20"
}
}
}
```
### Async Operation Response
```json
{
"operationId": "op_12345678-1234-1234-1234-123456789012",
"status": "processing",
"progress": {
"percentage": 45,
"currentStep": "data_analysis",
"totalSteps": 5,
"estimatedCompletion": "2024-01-15T10:35:00Z"
},
"trackingUrl": "/api/Execution/status/op_12345678-1234-1234-1234-123456789012",
"message": "Processing dataset analysis..."
}
```
## Error Response Details
### Validation Error
```json
{
"error": {
"code": "validation_failed",
"message": "Request validation failed",
"details": {
"errors": [
{
"field": "datasetId",
"code": "invalid_format",
"message": "Must be a valid GUID"
},
{
"field": "parameters.timeout",
"code": "out_of_range",
"message": "Must be between 1 and 3600 seconds"
}
]
},
"timestamp": "2024-01-15T10:30:00Z",
"requestId": "req_12345"
}
}
```
### Authentication Error
```json
{
"error": {
"code": "invalid_token",
"message": "The provided access token is invalid or expired",
"details": {
"tokenType": "bearer",
"expiresAt": "2024-01-15T09:00:00Z",
"suggestion": "Please refresh your access token"
},
"timestamp": "2024-01-15T10:30:00Z",
"requestId": "req_12345"
}
}
```
### Rate Limiting Error
```json
{
"error": {
"code": "rate_limit_exceeded",
"message": "Rate limit exceeded for this endpoint",
"details": {
"limit": 100,
"remaining": 0,
"resetTime": "2024-01-15T11:00:00Z",
"retryAfter": 1800
},
"timestamp": "2024-01-15T10:30:00Z",
"requestId": "req_12345"
}
}
```
## Response Headers
### Standard Headers
| Header | Description | Example |
|--------|-------------|---------|
| `Content-Type` | Response format | application/json; charset=utf-8 |
| `X-Request-Id` | Unique request identifier | req_12345678 |
| `X-Response-Time` | Server processing time | 145ms |
| `X-API-Version` | API version used | 1.0.0 |
### Rate Limiting Headers
| Header | Description | Example |
|--------|-------------|---------|
| `X-RateLimit-Limit` | Maximum requests per window | 100 |
| `X-RateLimit-Remaining` | Remaining requests in window | 95 |
| `X-RateLimit-Reset` | Window reset timestamp | 1642251600 |
| `Retry-After` | Seconds to wait before retry | 3600 |
## Best Practices for Error Handling
### JavaScript Example
```javascript
async function handleAPIResponse(response) {
// Check if response is ok
if (!response.ok) {
const errorData = await response.json();
switch (response.status) {
case 400:
throw new ValidationError(errorData.error.message, errorData.error.details);
case 401:
throw new AuthenticationError('Authentication failed');
case 403:
throw new AuthorizationError('Insufficient permissions');
case 404:
throw new NotFoundError('Resource not found');
case 429:
const retryAfter = response.headers.get('Retry-After');
throw new RateLimitError(`Rate limited. Retry after ${retryAfter} seconds`);
case 500:
case 502:
case 503:
case 504:
throw new ServerError('Server error occurred. Please retry.');
default:
throw new APIError(`Unexpected error: ${response.status}`);
}
}
return await response.json();
}
// Usage with retry logic
async function apiCallWithRetry(url, options, maxRetries = 3) {
for (let attempt = 1; attempt <= maxRetries; attempt++) {
try {
const response = await fetch(url, options);
return await handleAPIResponse(response);
} catch (error) {
if (error instanceof RateLimitError) {
const retryAfter = parseInt(error.retryAfter) || Math.pow(2, attempt);
await new Promise(resolve => setTimeout(resolve, retryAfter * 1000));
continue;
}
if (error instanceof ServerError && attempt < maxRetries) {
const delay = Math.pow(2, attempt) * 1000; // Exponential backoff
await new Promise(resolve => setTimeout(resolve, delay));
continue;
}
throw error;
}
}
}
```
### Python Example
```python
import requests
import time
from typing import Dict, Any
class APIError(Exception):
def __init__(self, message: str, status_code: int = None, details: Dict = None):
super().__init__(message)
self.status_code = status_code
self.details = details
def handle_api_response(response: requests.Response) -> Dict[str, Any]:
"""Handle API response with proper error handling"""
if response.ok:
return response.json()
try:
error_data = response.json()
except ValueError:
error_data = {"error": {"message": response.text}}
error_info = error_data.get("error", {})
message = error_info.get("message", f"HTTP {response.status_code}")
details = error_info.get("details", {})
if response.status_code == 429:
retry_after = response.headers.get('Retry-After', '60')
raise APIError(f"Rate limited. Retry after {retry_after} seconds",
response.status_code, details)
elif response.status_code >= 500:
raise APIError(f"Server error: {message}", response.status_code, details)
elif response.status_code >= 400:
raise APIError(f"Client error: {message}", response.status_code, details)
raise APIError(f"Unexpected error: {message}", response.status_code, details)
def api_call_with_retry(url: str, method: str = 'GET', max_retries: int = 3, **kwargs) -> Dict[str, Any]:
"""Make API call with automatic retry logic"""
for attempt in range(1, max_retries + 1):
try:
response = requests.request(method, url, **kwargs)
return handle_api_response(response)
except APIError as e:
if e.status_code == 429:
retry_after = int(e.details.get('retryAfter', 60))
time.sleep(retry_after)
continue
elif e.status_code >= 500 and attempt < max_retries:
delay = 2 ** attempt # Exponential backoff
time.sleep(delay)
continue
raise
raise APIError(f"Max retries ({max_retries}) exceeded")
```
## API Data Transfer Objects (DTOs)
Below are the key DTOs used across the mindzieAPI endpoints.
### Tenant DTOs
#### TenantListItemDto
```json
{
"tenantId": "12345678-1234-1234-1234-123456789012",
"name": "acme-corp",
"displayName": "Acme Corporation",
"description": "Main tenant",
"caseCount": 50000,
"maxUserCount": 100,
"maxAnalystCount": 20,
"analystCount": 12,
"userCount": 45,
"preRelease": false,
"isAcademic": false,
"autoload": true,
"dateCreated": "2024-01-15T10:30:00Z",
"isDisabled": false
}
```
#### TenantDetailDto
```json
{
"tenantId": "12345678-1234-1234-1234-123456789012",
"name": "acme-corp",
"displayName": "Acme Corporation",
"description": "Main tenant",
"isAcademic": false,
"preRelease": false,
"maxUserCount": 100,
"maxAnalystCount": 20,
"maxCases": 100000,
"dateCreated": "2024-01-15T10:30:00Z",
"isDisabled": false
}
```
#### TenantUpdatedDto
```json
{
"tenantId": "12345678-1234-1234-1234-123456789012",
"name": "acme-corp",
"displayName": "Acme Corporation Updated",
"message": "Tenant 'acme-corp' updated successfully",
"isDisabled": false
}
```
### User DTOs
#### UserListItemDto
```json
{
"userId": "a1b2c3d4-e5f6-7890-abcd-ef1234567890",
"email": "john.smith@example.com",
"displayName": "John Smith",
"firstName": "John",
"lastName": "Smith",
"roleName": "Analyst",
"disabled": false,
"isServiceAccount": false,
"homeTenantId": null,
"homeTenantName": null,
"lastLogin": "2024-01-15T10:30:00Z",
"tenantCount": 2,
"tenantNames": "acme-corp, globex-inc",
"dateCreated": "2024-01-01T00:00:00Z"
}
```
#### UserCreatedDto
```json
{
"userId": "a1b2c3d4-e5f6-7890-abcd-ef1234567890",
"email": "john.smith@example.com",
"displayName": "John Smith",
"message": "User created successfully"
}
```
### Project DTOs
#### ProjectReturn
```json
{
"projectId": "87654321-4321-4321-4321-210987654321",
"tenantId": "12345678-1234-1234-1234-123456789012",
"projectName": "Purchase Order Analysis",
"projectDescription": "Process mining analysis of P2P workflow",
"dateCreated": "2024-01-15T10:30:00Z",
"dateModified": "2024-01-20T14:45:00Z",
"createdBy": "user-guid",
"modifiedBy": "user-guid",
"isActive": true,
"datasetCount": 3,
"investigationCount": 5,
"dashboardCount": 2,
"userCount": 8
}
```
#### ProjectSummaryReturn
```json
{
"projectId": "87654321-4321-4321-4321-210987654321",
"projectName": "Purchase Order Analysis",
"projectDescription": "Process mining analysis",
"dateCreated": "2024-01-15T10:30:00Z",
"dateModified": "2024-01-20T14:45:00Z",
"statistics": {
"totalDatasets": 3,
"totalInvestigations": 5,
"totalDashboards": 2,
"totalNotebooks": 12,
"totalUsers": 8
}
}
```
#### ProjectUserReturn
```json
{
"permissionId": "11111111-1111-1111-1111-111111111111",
"userId": "a1b2c3d4-e5f6-7890-abcd-ef1234567890",
"email": "john.smith@example.com",
"displayName": "John Smith",
"isOwner": true,
"dateAssigned": "2024-01-15T10:30:00Z"
}
```
#### ProjectThumbnailReturn
```json
{
"projectId": "87654321-4321-4321-4321-210987654321",
"hasThumbnail": true,
"base64Image": "data:image/jpeg;base64,/9j/4AAQ..."
}
```
#### ProjectImportReturn
```json
{
"success": true,
"projectId": "99999999-9999-9999-9999-999999999999",
"projectName": "Imported Project",
"datasetsImported": 2,
"investigationsImported": 3,
"dashboardsImported": 1,
"errorMessage": null,
"message": "Project imported successfully"
}
```
### Investigation DTOs
#### InvestigationReturn
```json
{
"investigationId": "11111111-2222-3333-4444-555555555555",
"projectId": "87654321-4321-4321-4321-210987654321",
"investigationName": "Order Analysis",
"investigationDescription": "Process mining analysis of order workflow",
"datasetId": "12345678-1234-1234-1234-123456789012",
"dateCreated": "2024-01-15T10:30:00Z",
"dateModified": "2024-01-20T14:45:00Z",
"createdBy": "a1b2c3d4-e5f6-7890-abcd-ef1234567890",
"modifiedBy": "a1b2c3d4-e5f6-7890-abcd-ef1234567890",
"investigationOrder": 1.0,
"isUsedForOperationCenter": false,
"investigationFolderId": null,
"notebookCount": 3
}
```
#### InvestigationListReturn
```json
{
"investigations": [
{
"investigationId": "11111111-2222-3333-4444-555555555555",
"projectId": "87654321-4321-4321-4321-210987654321",
"investigationName": "Order Analysis",
"datasetId": "12345678-1234-1234-1234-123456789012",
"notebookCount": 3
}
],
"totalCount": 5,
"page": 1,
"pageSize": 50
}
```
#### CreateInvestigationRequest
```json
{
"investigationName": "Order Analysis",
"investigationDescription": "Process mining analysis",
"datasetId": "12345678-1234-1234-1234-123456789012",
"isUsedForOperationCenter": false
}
```
#### UpdateInvestigationRequest
```json
{
"investigationName": "Updated Analysis Name",
"investigationDescription": "Updated description",
"isUsedForOperationCenter": true
}
```
### Notebook DTOs
#### NotebookReturn
```json
{
"notebookId": "aaaaaaaa-bbbb-cccc-dddd-eeeeeeeeeeee",
"investigationId": "11111111-2222-3333-4444-555555555555",
"name": "Main",
"description": "Primary analysis notebook",
"dateCreated": "2024-01-15T10:30:00Z",
"dateModified": "2024-01-20T14:45:00Z",
"createdBy": "a1b2c3d4-e5f6-7890-abcd-ef1234567890",
"modifiedBy": "a1b2c3d4-e5f6-7890-abcd-ef1234567890",
"notebookType": 0,
"notebookOrder": 1.0,
"lastExecutionDuration": 2.5,
"blockCount": 12
}
```
#### NotebookListReturn
```json
{
"notebooks": [
{
"notebookId": "aaaaaaaa-bbbb-cccc-dddd-eeeeeeeeeeee",
"investigationId": "11111111-2222-3333-4444-555555555555",
"name": "Main",
"notebookOrder": 1.0,
"blockCount": 12
}
],
"totalCount": 3
}
```
## Next Steps
Now that you understand response formats, explore specific API sections like [Actions](/mindzie_api/action), [Blocks](/mindzie_api/block), or [Datasets](/mindzie_api/dataset) to see these patterns in action.
---
## Overview
Section: Dataset
URL: https://docs.mindziestudio.com/mindzie_api/dataset/overview
Source: /docs-master/mindzieAPI/dataset/overview/page.md
# Datasets
## Data Management API
Upload, manage, and update datasets with support for multiple file formats including CSV, ZIP packages, and binary formats.
## Features
### Dataset Creation
Create new datasets from CSV, ZIP packages, or binary files.
[Create Datasets](/mindzie_api/dataset/creation)
### Data Import
Import data with column mapping for process mining analysis.
[Import Data](/mindzie_api/dataset/import)
### Dataset Updates
Update existing datasets with new data while preserving configurations.
[Update Datasets](/mindzie_api/dataset/updates)
### File Formats
Supported file formats and data structures.
[View Formats](/mindzie_api/dataset/formats)
## Available Endpoints
### Connectivity Testing
- **GET** `/api/{tenantId}/{projectId}/dataset/unauthorized-ping` - Public connectivity test (no auth required)
- **GET** `/api/{tenantId}/{projectId}/dataset/ping` - Authenticated connectivity test
### Dataset Operations
- **GET** `/api/{tenantId}/{projectId}/dataset` - List all datasets in a project
### Dataset Creation
- **POST** `/api/{tenantId}/{projectId}/dataset/csv` - Create dataset from CSV file
- **POST** `/api/{tenantId}/{projectId}/dataset/package` - Create dataset from ZIP package
- **POST** `/api/{tenantId}/{projectId}/dataset/binary` - Create dataset from binary file
### Dataset Updates
- **PUT** `/api/{tenantId}/{projectId}/dataset/{datasetId}/csv` - Update dataset from CSV
- **PUT** `/api/{tenantId}/{projectId}/dataset/{datasetId}/package` - Update dataset from ZIP package
- **PUT** `/api/{tenantId}/{projectId}/dataset/{datasetId}/binary` - Update dataset from binary file
## Supported File Formats
mindzieStudio supports multiple data formats for process mining:
### CSV Files
Comma-separated values with flexible column mapping.
- Event logs with case ID, activity, timestamp
- Custom culture settings for date/number parsing
- UTF-8 encoding support
### ZIP Packages
Compressed packages containing multiple related files.
- Complex datasets with multiple tables
- Metadata and configuration files
- mindzie dataset packaging standards
### Binary Files
Native binary format for efficient data transfer.
- Pre-processed event log data
- Optimized for large datasets
- Column mappings required
## Dataset Structure
Understanding the expected data structure for process mining analysis:
### Required Columns
| Column | Description |
|--------|-------------|
| Case ID | Unique identifier for each process instance |
| Activity | Name of the activity or event |
| Timestamp | When the activity occurred |
### Optional Columns
| Column | Description |
|--------|-------------|
| Resource | User or system that performed the activity |
| Start Time | Activity start time (for duration calculations) |
| Expected Order | Sequence ordering column |
### Response Structure
```json
{
"datasetId": "550e8400-e29b-41d4-a716-446655440000",
"datasetName": "Purchase Order Process",
"datasetDescription": "Event log from SAP procurement",
"projectId": "660e8400-e29b-41d4-a716-446655440000",
"caseIdColumnName": "CaseID",
"activityColumnName": "Activity",
"timeColumnName": "Timestamp",
"resourceColumnName": "Resource",
"beginTimeColumnName": "StartTime",
"useDateOnlySorting": false,
"useOnlyEventColumns": false,
"dateCreated": "2024-01-15T10:30:00Z",
"dateModified": "2024-01-15T14:45:00Z",
"createdBy": "user@example.com",
"modifiedBy": "user@example.com"
}
```
## Upload Response Structure
Dataset creation and update endpoints return import statistics:
```json
{
"datasetId": "550e8400-e29b-41d4-a716-446655440000",
"caseCount": 5200,
"eventCount": 150000,
"invalidValueCount": 12,
"skippedRowsCount": 3,
"errors": [],
"rowIssues": [],
"statusCode": 200
}
```
## Common Use Cases
- **Event Log Import:** Upload process event data from ERP, CRM, or BPM systems
- **Data Refresh:** Update existing datasets with new data while preserving analysis configurations
- **Multi-Format Support:** Import data from CSV exports or proprietary binary formats
- **Batch Processing:** Upload large datasets up to 1GB with progress tracking
## File Size Limits
All upload endpoints support files up to **1GB** in size. For larger datasets, consider:
- Breaking data into multiple uploads
- Using the binary format for efficiency
- Contacting support for enterprise data solutions
## Authentication
All Dataset API endpoints (except `unauthorized-ping`) require valid authentication with appropriate permissions for the target project and tenant.
## Getting Started
Begin with [Dataset Creation](/mindzie_api/dataset/creation) to learn how to create datasets, then explore [Data Import](/mindzie_api/dataset/import) for column mapping details.
---
## Creation
Section: Dataset
URL: https://docs.mindziestudio.com/mindzie_api/dataset/creation
Source: /docs-master/mindzieAPI/dataset/creation/page.md
# Dataset Creation
## Create New Datasets
Create datasets from CSV files, ZIP packages, or binary files. Each format requires specific column mappings for process mining analysis.
## Connectivity Testing
### Unauthorized Ping
**GET** `/api/{tenantId}/{projectId}/dataset/unauthorized-ping`
Test endpoint that does not require authentication.
#### Response
```
Ping Successful
```
### Authenticated Ping
**GET** `/api/{tenantId}/{projectId}/dataset/ping`
Authenticated ping endpoint to verify API access.
#### Response (200 OK)
```
Ping Successful (tenant id: {tenantId})
```
## List All Datasets
**GET** `/api/{tenantId}/{projectId}/dataset`
Retrieves all datasets within the specified project.
### Response (200 OK)
```json
{
"datasets": [
{
"datasetId": "550e8400-e29b-41d4-a716-446655440000",
"datasetName": "Purchase Order Process",
"datasetDescription": "Event log from SAP",
"projectId": "660e8400-e29b-41d4-a716-446655440000",
"caseIdColumnName": "CaseID",
"activityColumnName": "Activity",
"timeColumnName": "Timestamp",
"resourceColumnName": "Resource",
"beginTimeColumnName": null,
"expectedOrderColumnName": null,
"useDateOnlySorting": false,
"useOnlyEventColumns": false,
"dateCreated": "2024-01-15T10:30:00Z",
"dateModified": "2024-01-15T14:45:00Z",
"createdBy": "user@example.com",
"modifiedBy": "user@example.com"
}
]
}
```
## Create Dataset from CSV
**POST** `/api/{tenantId}/{projectId}/dataset/csv`
Creates a new dataset from a CSV file upload with column mappings.
### Request (multipart/form-data)
| Field | Type | Required | Description |
|-------|------|----------|-------------|
| `file` | file | Yes | CSV file to upload (max 1GB) |
| `datasetName` | string | Yes | Name for the new dataset |
| `caseIdColumn` | string | Yes | Column name containing case IDs |
| `activityNameColumn` | string | Yes | Column name containing activity names |
| `activityTimeColumn` | string | Yes | Column name containing timestamps |
| `resourceColumn` | string | No | Column name containing resource/performer |
| `startTimeColumn` | string | No | Column name for activity start times |
| `cultureInfo` | string | No | Culture for parsing (default: "en-US") |
### Response (200 OK)
```json
{
"datasetId": "550e8400-e29b-41d4-a716-446655440000",
"caseCount": 5200,
"eventCount": 150000,
"invalidValueCount": 0,
"skippedRowsCount": 0,
"errors": [],
"rowIssues": [],
"statusCode": 200
}
```
### Error Response (422 Unprocessable Entity)
```json
{
"errors": ["Column 'CaseID' not found in CSV file"],
"statusCode": 422
}
```
## Create Dataset from ZIP Package
**POST** `/api/{tenantId}/{projectId}/dataset/package`
Creates a new dataset from a ZIP package containing data files.
### Request (multipart/form-data)
| Field | Type | Required | Description |
|-------|------|----------|-------------|
| `file` | file | Yes | ZIP package file (max 1GB) |
| `datasetName` | string | Yes | Name for the new dataset |
| `cultureInfo` | string | No | Culture for parsing (default: "en-US") |
### Response (200 OK)
```json
{
"datasetId": "550e8400-e29b-41d4-a716-446655440000",
"caseCount": 5200,
"eventCount": 150000,
"invalidValueCount": 0,
"skippedRowsCount": 0,
"errors": [],
"rowIssues": [],
"statusCode": 200
}
```
## Create Dataset from Binary
**POST** `/api/{tenantId}/{projectId}/dataset/binary`
Creates a new dataset from a binary format file with column mappings.
### Request (multipart/form-data)
| Field | Type | Required | Description |
|-------|------|----------|-------------|
| `file` | file | Yes | Binary file to upload (max 1GB) |
| `datasetName` | string | Yes | Name for the new dataset |
| `caseIdColumn` | string | Yes | Column name containing case IDs |
| `activityNameColumn` | string | Yes | Column name containing activity names |
| `activityTimeColumn` | string | Yes | Column name containing timestamps |
| `resourceColumn` | string | No | Column name containing resource/performer |
| `startTimeColumn` | string | No | Column name for activity start times |
### Response (200 OK)
Same structure as CSV creation response.
## Implementation Examples
### cURL - CSV Upload
```bash
curl -X POST "https://your-mindzie-instance.com/api/12345678-1234-1234-1234-123456789012/87654321-4321-4321-4321-210987654321/dataset/csv" \
-H "Authorization: Bearer YOUR_ACCESS_TOKEN" \
-F "file=@event_log.csv" \
-F "datasetName=Purchase Orders" \
-F "caseIdColumn=CaseID" \
-F "activityNameColumn=Activity" \
-F "activityTimeColumn=Timestamp" \
-F "resourceColumn=User" \
-F "cultureInfo=en-US"
```
### cURL - ZIP Package Upload
```bash
curl -X POST "https://your-mindzie-instance.com/api/12345678-1234-1234-1234-123456789012/87654321-4321-4321-4321-210987654321/dataset/package" \
-H "Authorization: Bearer YOUR_ACCESS_TOKEN" \
-F "file=@data_package.zip" \
-F "datasetName=SAP Export" \
-F "cultureInfo=en-US"
```
### Python
```python
import requests
TENANT_ID = '12345678-1234-1234-1234-123456789012'
PROJECT_ID = '87654321-4321-4321-4321-210987654321'
BASE_URL = 'https://your-mindzie-instance.com'
class DatasetUploader:
def __init__(self, token):
self.headers = {'Authorization': f'Bearer {token}'}
def create_from_csv(self, file_path, dataset_name, case_id_col, activity_col, time_col,
resource_col=None, start_time_col=None, culture='en-US'):
"""Create dataset from CSV file."""
url = f'{BASE_URL}/api/{TENANT_ID}/{PROJECT_ID}/dataset/csv'
with open(file_path, 'rb') as f:
files = {'file': (file_path, f, 'text/csv')}
data = {
'datasetName': dataset_name,
'caseIdColumn': case_id_col,
'activityNameColumn': activity_col,
'activityTimeColumn': time_col,
'cultureInfo': culture
}
if resource_col:
data['resourceColumn'] = resource_col
if start_time_col:
data['startTimeColumn'] = start_time_col
response = requests.post(url, headers=self.headers, files=files, data=data)
if response.ok:
return response.json()
else:
raise Exception(f'Upload failed: {response.text}')
def create_from_package(self, file_path, dataset_name, culture='en-US'):
"""Create dataset from ZIP package."""
url = f'{BASE_URL}/api/{TENANT_ID}/{PROJECT_ID}/dataset/package'
with open(file_path, 'rb') as f:
files = {'file': (file_path, f, 'application/zip')}
data = {
'datasetName': dataset_name,
'cultureInfo': culture
}
response = requests.post(url, headers=self.headers, files=files, data=data)
if response.ok:
return response.json()
else:
raise Exception(f'Upload failed: {response.text}')
def list_datasets(self):
"""List all datasets in the project."""
url = f'{BASE_URL}/api/{TENANT_ID}/{PROJECT_ID}/dataset'
response = requests.get(url, headers=self.headers)
return response.json()
# Usage
uploader = DatasetUploader('your-auth-token')
# Create from CSV
result = uploader.create_from_csv(
'event_log.csv',
'Purchase Order Process',
'CaseID',
'Activity',
'Timestamp',
resource_col='User'
)
print(f"Created dataset: {result['datasetId']}")
print(f"Cases: {result['caseCount']}, Events: {result['eventCount']}")
# List all datasets
datasets = uploader.list_datasets()
for ds in datasets['datasets']:
print(f"- {ds['datasetName']} ({ds['datasetId']})")
```
### JavaScript/Node.js
```javascript
const TENANT_ID = '12345678-1234-1234-1234-123456789012';
const PROJECT_ID = '87654321-4321-4321-4321-210987654321';
const BASE_URL = 'https://your-mindzie-instance.com';
class DatasetUploader {
constructor(token) {
this.token = token;
}
async createFromCsv(file, datasetName, caseIdCol, activityCol, timeCol, options = {}) {
const url = `${BASE_URL}/api/${TENANT_ID}/${PROJECT_ID}/dataset/csv`;
const formData = new FormData();
formData.append('file', file);
formData.append('datasetName', datasetName);
formData.append('caseIdColumn', caseIdCol);
formData.append('activityNameColumn', activityCol);
formData.append('activityTimeColumn', timeCol);
formData.append('cultureInfo', options.culture || 'en-US');
if (options.resourceColumn) {
formData.append('resourceColumn', options.resourceColumn);
}
if (options.startTimeColumn) {
formData.append('startTimeColumn', options.startTimeColumn);
}
const response = await fetch(url, {
method: 'POST',
headers: { 'Authorization': `Bearer ${this.token}` },
body: formData
});
if (response.ok) {
return await response.json();
} else {
throw new Error(`Upload failed: ${await response.text()}`);
}
}
async listDatasets() {
const url = `${BASE_URL}/api/${TENANT_ID}/${PROJECT_ID}/dataset`;
const response = await fetch(url, {
headers: { 'Authorization': `Bearer ${this.token}` }
});
return await response.json();
}
}
// Usage (browser)
const uploader = new DatasetUploader('your-auth-token');
const fileInput = document.getElementById('csvFile');
fileInput.addEventListener('change', async (e) => {
const file = e.target.files[0];
const result = await uploader.createFromCsv(
file,
'My Dataset',
'CaseID',
'Activity',
'Timestamp',
{ resourceColumn: 'User' }
);
console.log(`Created: ${result.datasetId}`);
console.log(`Cases: ${result.caseCount}, Events: ${result.eventCount}`);
});
```
## Response Fields
| Field | Type | Description |
|-------|------|-------------|
| `datasetId` | GUID | ID of the created dataset |
| `caseCount` | integer | Number of unique cases imported |
| `eventCount` | integer | Total number of events imported |
| `invalidValueCount` | integer | Number of invalid values encountered |
| `skippedRowsCount` | integer | Number of rows skipped due to errors |
| `errors` | array | List of error messages |
| `rowIssues` | array | Detailed information about row-level issues |
| `statusCode` | integer | HTTP status code |
## Best Practices
- **Validate Column Names:** Ensure column names match exactly (case-sensitive)
- **Check Culture Settings:** Use appropriate culture for date/number formats
- **Handle Large Files:** Monitor upload progress for files approaching 1GB
- **Review Row Issues:** Check `rowIssues` array for data quality problems
- **Unique Dataset Names:** Dataset names must be unique within a project
---
## Formats
Section: Dataset
URL: https://docs.mindziestudio.com/mindzie_api/dataset/formats
Source: /docs-master/mindzieAPI/dataset/formats/page.md
# File Formats
**Supported Data Formats**
Learn about supported file formats, data structures, and column mapping requirements for process mining datasets.
## CSV (Comma-Separated Values)
The most commonly used format for process mining data with flexible parsing options.
### Format Specifications
| Option | Description | Default | Example |
|--------|-------------|---------|---------|
| `delimiter` | Field separator character | comma (,) | semicolon (;), tab (\t) |
| `encoding` | Character encoding | UTF-8 | ISO-8859-1, Windows-1252 |
| `hasHeader` | First row contains column names | true | true, false |
| `quoteChar` | Text qualifier character | double quote (") | single quote (') |
### Sample CSV Structure
```csv
CaseID,Activity,Timestamp,Resource,Amount
PO-001,Create Order,2024-01-15T09:00:00Z,buyer.smith,1500.00
PO-001,Approve Order,2024-01-15T10:30:00Z,manager.jones,1500.00
PO-001,Send to Supplier,2024-01-15T11:00:00Z,system.auto,1500.00
PO-002,Create Order,2024-01-15T09:15:00Z,buyer.brown,2750.50
```
### Column Mapping Configuration
```json
{
"mapping": [
{
"sourceColumn": "CaseID",
"targetColumn": "CaseID",
"dataType": "string",
"role": "case_id"
},
{
"sourceColumn": "Activity",
"targetColumn": "Activity",
"dataType": "string",
"role": "activity"
},
{
"sourceColumn": "Timestamp",
"targetColumn": "Timestamp",
"dataType": "datetime",
"role": "timestamp",
"format": "ISO8601"
}
],
"options": {
"hasHeader": true,
"delimiter": ",",
"encoding": "UTF-8"
}
}
```
## Excel Files (.xlsx, .xls)
Microsoft Excel workbooks with support for multiple worksheets and advanced formatting.
### Supported Features
#### File Types
- .xlsx (Excel 2007+)
- .xls (Excel 97-2003)
- .xlsm (Macro-enabled)
#### Worksheet Handling
- Multiple worksheet support
- Specific sheet selection
- Range-based import
#### Data Recognition
- Automatic date/time detection
- Numeric format preservation
- Text formatting cleanup
### Excel Import Configuration
```json
{
"worksheetName": "ProcessEvents",
"range": "A1:E1000",
"hasHeader": true,
"startRow": 1,
"mapping": [
{
"sourceColumn": "Order ID",
"targetColumn": "CaseID",
"dataType": "string"
},
{
"sourceColumn": "Event Date",
"targetColumn": "Timestamp",
"dataType": "datetime",
"format": "MM/dd/yyyy HH:mm:ss"
}
]
}
```
## XES (eXtensible Event Stream)
IEEE standard format for process mining with full support for event attributes and extensions.
### XES Specification Support
| Element | Support Level | Description |
|---------|---------------|-------------|
| Log | Full | Log-level attributes and metadata |
| Trace | Full | Case-level attributes and events |
| Event | Full | Activity-level data and attributes |
| Extensions | Partial | Standard extensions (concept, time, lifecycle) |
### Sample XES Structure
```xml
```
## JSON (JavaScript Object Notation)
Structured JSON format for complex event data with nested attributes and flexible schema.
### JSON Schema Options
#### Array of Events
Simple flat structure with event objects.
```json
[
{
"caseId": "PO-001",
"activity": "Create Order",
"timestamp": "2024-01-15T09:00:00Z",
"resource": "buyer.smith"
}
]
```
#### Nested Structure
Hierarchical data with case and event nesting.
```json
{
"cases": [
{
"caseId": "PO-001",
"events": [
{
"activity": "Create Order",
"timestamp": "2024-01-15T09:00:00Z"
}
]
}
]
}
```
### JSON Mapping Configuration
```json
{
"schema": "flat",
"mapping": [
{
"jsonPath": "$.caseId",
"targetColumn": "CaseID",
"dataType": "string"
},
{
"jsonPath": "$.activity",
"targetColumn": "Activity",
"dataType": "string"
},
{
"jsonPath": "$.timestamp",
"targetColumn": "Timestamp",
"dataType": "datetime"
}
]
}
```
## Data Type Requirements
Understanding data types and validation rules for proper dataset structure:
### String Fields
Text data with length and character validation.
- UTF-8 encoding required
- Maximum length: 1000 characters
- Special character handling
- Null value support
### DateTime Fields
Timestamp data with timezone support.
- ISO 8601 format preferred
- Custom format support
- Timezone conversion
- Precision to milliseconds
### Numeric Fields
Integer and decimal number handling.
- 64-bit integer support
- Double precision decimals
- Scientific notation
- Currency formatting
### Boolean Fields
True/false value interpretation.
- true/false (case insensitive)
- 1/0 numeric values
- yes/no text values
- Null handling options
## Format Validation and Errors
Common validation rules and error handling for different file formats:
### Required Columns
Every process mining dataset must include these essential columns:
- **Case ID:** Unique identifier for each process instance
- **Activity:** Name or description of the process step
- **Timestamp:** When the activity occurred (with timezone)
### Common Validation Errors
| Error Type | Description | Resolution |
|------------|-------------|------------|
| Missing Required Column | CaseID, Activity, or Timestamp not found | Add missing column or update mapping |
| Invalid Date Format | Timestamp not in recognized format | Specify custom date format pattern |
| Empty Case ID | Null or empty values in Case ID column | Clean data or use row filtering |
| Duplicate Headers | Multiple columns with same name | Rename columns or use column indices |
## Best Practices
- **Data Quality:** Validate data before import using built-in validation options
- **Performance:** Use streaming uploads for files larger than 100MB
- **Encoding:** Always specify UTF-8 encoding for international character support
- **Timestamps:** Include timezone information in all timestamp data
- **Testing:** Use small sample files to test column mappings before full import
- **Documentation:** Document custom formats and mappings for future reference
---
## Import
Section: Dataset
URL: https://docs.mindziestudio.com/mindzie_api/dataset/import
Source: /docs-master/mindzieAPI/dataset/import/page.md
# Data Import
**Import Data from Multiple Sources**
Import data from CSV, Excel, JSON, and other formats. Handle large datasets with streaming uploads.
## Upload Data File
**POST** `/api/{tenantId}/{projectId}/dataset/{datasetId}/import`
Upload and import data from various file formats including CSV, Excel, and XES. Supports large file uploads with chunked transfer.
### Parameters
| Parameter | Type | Location | Description |
|-----------|------|----------|-------------|
| `tenantId` | GUID | Path | The tenant identifier |
| `projectId` | GUID | Path | The project identifier |
| `datasetId` | GUID | Path | The dataset identifier |
| `file` | File | Form Data | Data file to upload |
| `columnMapping` | JSON | Form Data | Column mapping configuration |
### Column Mapping Configuration
```json
{
"mapping": [
{
"sourceColumn": "Case_ID",
"targetColumn": "CaseID",
"dataType": "string"
},
{
"sourceColumn": "Event_Name",
"targetColumn": "Activity",
"dataType": "string"
},
{
"sourceColumn": "Event_Time",
"targetColumn": "Timestamp",
"dataType": "datetime",
"format": "yyyy-MM-dd HH:mm:ss"
}
],
"options": {
"hasHeader": true,
"delimiter": ",",
"encoding": "UTF-8",
"skipRows": 0
}
}
```
### Response
```json
{
"importId": "import-550e8400-e29b-41d4-a716-446655440000",
"datasetId": "550e8400-e29b-41d4-a716-446655440000",
"status": "Processing",
"fileName": "process_events.csv",
"fileSize": 15728640,
"rowsProcessed": 0,
"rowsTotal": 50000,
"errors": [],
"warnings": [],
"startTime": "2024-01-15T10:30:00Z"
}
```
## Import CSV with Mapping
**POST** `/api/{tenantId}/{projectId}/dataset/{datasetId}/import/csv`
Import CSV data with advanced column mapping, data transformation, and validation options.
### Request Body
```json
{
"fileUrl": "https://your-storage.com/data/events.csv",
"mapping": [
{
"sourceColumn": "order_id",
"targetColumn": "CaseID",
"dataType": "string",
"required": true
},
{
"sourceColumn": "step_name",
"targetColumn": "Activity",
"dataType": "string",
"required": true
},
{
"sourceColumn": "timestamp",
"targetColumn": "Timestamp",
"dataType": "datetime",
"format": "ISO8601",
"required": true
},
{
"sourceColumn": "user_name",
"targetColumn": "Resource",
"dataType": "string",
"required": false
}
],
"options": {
"hasHeader": true,
"delimiter": ",",
"encoding": "UTF-8",
"skipRows": 1,
"validateData": true,
"replaceExisting": false
},
"transformations": [
{
"column": "Activity",
"type": "replace",
"find": "ORDER_",
"replace": "Order "
}
]
}
```
### Response
Returns the same import status object as the file upload endpoint.
## Get Import Status
**GET** `/api/{tenantId}/{projectId}/dataset/{datasetId}/import/{importId}/status`
Monitor the progress and status of a data import operation including validation results and error details.
### Response
```json
{
"importId": "import-550e8400-e29b-41d4-a716-446655440000",
"datasetId": "550e8400-e29b-41d4-a716-446655440000",
"status": "Completed",
"fileName": "process_events.csv",
"fileSize": 15728640,
"rowsProcessed": 49876,
"rowsTotal": 50000,
"rowsSkipped": 124,
"startTime": "2024-01-15T10:30:00Z",
"endTime": "2024-01-15T10:45:23Z",
"duration": "00:15:23",
"errors": [
{
"row": 1532,
"column": "Timestamp",
"error": "Invalid date format",
"value": "2024-13-01 25:00:00"
}
],
"warnings": [
{
"row": 2847,
"column": "Resource",
"warning": "Empty value for optional field",
"value": ""
}
],
"statistics": {
"uniqueCases": 1247,
"uniqueActivities": 12,
"dateRange": {
"earliest": "2024-01-01T08:00:00Z",
"latest": "2024-01-31T17:30:00Z"
}
}
}
```
## Supported File Formats
mindzieStudio supports multiple data formats for seamless process mining data import:
### CSV Files
Comma-separated values with flexible parsing options.
- Custom delimiters (comma, semicolon, tab)
- UTF-8, ISO-8859-1 encoding support
- Header row detection
- Quote character handling
### Excel Files
Microsoft Excel workbooks (.xlsx, .xls).
- Multiple worksheet support
- Cell formatting preservation
- Date/time recognition
- Large file streaming
### XES Format
IEEE XES standard for process mining.
- Full XES specification support
- Event attributes and extensions
- Lifecycle information
- Process mining tool compatibility
### JSON Files
Structured JSON data for complex events.
- Nested object support
- Array handling
- Custom schema mapping
- Streaming JSON processing
## JavaScript Example: File Upload with Progress
```javascript
class DataImporter {
constructor(baseUrl, tenantId, projectId, token) {
this.baseUrl = baseUrl;
this.tenantId = tenantId;
this.projectId = projectId;
this.headers = {
'Authorization': `Bearer ${token}`
};
}
async uploadFile(datasetId, file, columnMapping) {
const formData = new FormData();
formData.append('file', file);
formData.append('columnMapping', JSON.stringify(columnMapping));
const url = `${this.baseUrl}/api/${this.tenantId}/${this.projectId}/dataset/${datasetId}/import`;
const response = await fetch(url, {
method: 'POST',
headers: this.headers,
body: formData
});
return await response.json();
}
async importCsv(datasetId, csvConfig) {
const url = `${this.baseUrl}/api/${this.tenantId}/${this.projectId}/dataset/${datasetId}/import/csv`;
const response = await fetch(url, {
method: 'POST',
headers: {
...this.headers,
'Content-Type': 'application/json'
},
body: JSON.stringify(csvConfig)
});
return await response.json();
}
async getImportStatus(datasetId, importId) {
const url = `${this.baseUrl}/api/${this.tenantId}/${this.projectId}/dataset/${datasetId}/import/${importId}/status`;
const response = await fetch(url, {
headers: this.headers
});
return await response.json();
}
async monitorImport(datasetId, importId, callback) {
const checkStatus = async () => {
try {
const status = await this.getImportStatus(datasetId, importId);
callback(status);
if (status.status === 'Processing') {
setTimeout(checkStatus, 2000); // Check every 2 seconds
}
} catch (error) {
callback({ error: error.message });
}
};
checkStatus();
}
buildStandardMapping() {
return {
mapping: [
{
sourceColumn: 'case_id',
targetColumn: 'CaseID',
dataType: 'string'
},
{
sourceColumn: 'activity',
targetColumn: 'Activity',
dataType: 'string'
},
{
sourceColumn: 'timestamp',
targetColumn: 'Timestamp',
dataType: 'datetime',
format: 'ISO8601'
}
],
options: {
hasHeader: true,
delimiter: ',',
encoding: 'UTF-8',
validateData: true
}
};
}
}
// Usage example
const importer = new DataImporter(
'https://your-mindzie-instance.com',
'tenant-guid',
'project-guid',
'your-token'
);
// Handle file upload with progress monitoring
document.getElementById('fileInput').addEventListener('change', async (e) => {
const file = e.target.files[0];
if (!file) return;
const mapping = importer.buildStandardMapping();
try {
const result = await importer.uploadFile('dataset-guid', file, mapping);
console.log('Upload started:', result.importId);
// Monitor progress
importer.monitorImport('dataset-guid', result.importId, (status) => {
if (status.error) {
console.error('Import failed:', status.error);
} else {
const progress = (status.rowsProcessed / status.rowsTotal) * 100;
console.log(`Progress: ${progress.toFixed(1)}% (${status.rowsProcessed}/${status.rowsTotal})`);
if (status.status === 'Completed') {
console.log('Import completed successfully!');
console.log(`Processed ${status.rowsProcessed} rows with ${status.errors.length} errors`);
}
}
});
} catch (error) {
console.error('Upload failed:', error);
}
});
```
---
## Updates
Section: Dataset
URL: https://docs.mindziestudio.com/mindzie_api/dataset/updates
Source: /docs-master/mindzieAPI/dataset/updates/page.md
# Dataset Updates
## Update Existing Datasets
Update existing datasets with new data from CSV files, ZIP packages, or binary files. Updates preserve the dataset ID and associated configurations.
## Update Dataset from CSV
**PUT** `/api/{tenantId}/{projectId}/dataset/{datasetId}/csv`
Replaces the data in an existing dataset with new data from a CSV file. The system automatically detects column mappings from the dataset configuration.
### Path Parameters
| Parameter | Type | Required | Description |
|-----------|------|----------|-------------|
| `tenantId` | GUID | Yes | The tenant identifier |
| `projectId` | GUID | Yes | The project identifier |
| `datasetId` | GUID | Yes | The dataset identifier to update |
### Request (multipart/form-data)
| Field | Type | Required | Description |
|-------|------|----------|-------------|
| `file` | file | Yes | CSV file with new data (max 1GB) |
| `cultureInfo` | string | No | Culture for parsing (default: "en-US") |
### Response (200 OK)
```json
{
"datasetId": "550e8400-e29b-41d4-a716-446655440000",
"caseCount": 5500,
"eventCount": 165000,
"invalidValueCount": 0,
"skippedRowsCount": 0,
"errors": [],
"rowIssues": [],
"statusCode": 200
}
```
### Error Responses
**Bad Request (400):**
```
dataset with id '{datasetId}' not found
```
```
can't update '{datasetName}' because it's not an original dataset
```
## Update Dataset from ZIP Package
**PUT** `/api/{tenantId}/{projectId}/dataset/{datasetId}/package`
Replaces the data in an existing dataset with new data from a ZIP package.
### Request (multipart/form-data)
| Field | Type | Required | Description |
|-------|------|----------|-------------|
| `file` | file | Yes | ZIP package file with new data (max 1GB) |
| `cultureInfo` | string | No | Culture for parsing (default: "en-US") |
### Response (200 OK)
Same structure as CSV update response.
### Error Response (422 Unprocessable Entity)
```json
{
"errors": ["Invalid package structure"],
"rowIssues": [
{
"rowIndex": 15,
"columnName": "Timestamp",
"errorType": "ParseError",
"outcome": "Skipped",
"message": "Unable to parse date value"
}
],
"statusCode": 422
}
```
## Update Dataset from Binary
**PUT** `/api/{tenantId}/{projectId}/dataset/{datasetId}/binary`
Replaces the data in an existing dataset with new data from a binary format file.
### Request (multipart/form-data)
| Field | Type | Required | Description |
|-------|------|----------|-------------|
| `file` | file | Yes | Binary file with new data (max 1GB) |
### Response (200 OK)
Same structure as CSV update response.
## Update Restrictions
- **Original Datasets Only:** Only original datasets can be updated. Datasets derived from filters or other transformations cannot be updated directly.
- **Preserve Configuration:** Updates preserve the dataset ID and all associated configurations (notebooks, blocks, etc.)
- **Column Consistency:** The new data should have the same column structure as the original dataset
## Implementation Examples
### cURL - Update from CSV
```bash
curl -X PUT "https://your-mindzie-instance.com/api/12345678-1234-1234-1234-123456789012/87654321-4321-4321-4321-210987654321/dataset/550e8400-e29b-41d4-a716-446655440000/csv" \
-H "Authorization: Bearer YOUR_ACCESS_TOKEN" \
-F "file=@updated_event_log.csv" \
-F "cultureInfo=en-US"
```
### cURL - Update from ZIP Package
```bash
curl -X PUT "https://your-mindzie-instance.com/api/12345678-1234-1234-1234-123456789012/87654321-4321-4321-4321-210987654321/dataset/550e8400-e29b-41d4-a716-446655440000/package" \
-H "Authorization: Bearer YOUR_ACCESS_TOKEN" \
-F "file=@updated_data_package.zip" \
-F "cultureInfo=en-US"
```
### Python
```python
import requests
TENANT_ID = '12345678-1234-1234-1234-123456789012'
PROJECT_ID = '87654321-4321-4321-4321-210987654321'
BASE_URL = 'https://your-mindzie-instance.com'
class DatasetUpdater:
def __init__(self, token):
self.headers = {'Authorization': f'Bearer {token}'}
def update_from_csv(self, dataset_id, file_path, culture='en-US'):
"""Update dataset from CSV file."""
url = f'{BASE_URL}/api/{TENANT_ID}/{PROJECT_ID}/dataset/{dataset_id}/csv'
with open(file_path, 'rb') as f:
files = {'file': (file_path, f, 'text/csv')}
data = {'cultureInfo': culture}
response = requests.put(url, headers=self.headers, files=files, data=data)
if response.ok:
return response.json()
else:
raise Exception(f'Update failed: {response.text}')
def update_from_package(self, dataset_id, file_path, culture='en-US'):
"""Update dataset from ZIP package."""
url = f'{BASE_URL}/api/{TENANT_ID}/{PROJECT_ID}/dataset/{dataset_id}/package'
with open(file_path, 'rb') as f:
files = {'file': (file_path, f, 'application/zip')}
data = {'cultureInfo': culture}
response = requests.put(url, headers=self.headers, files=files, data=data)
if response.ok:
return response.json()
elif response.status_code == 422:
result = response.json()
print(f"Validation errors: {result['errors']}")
for issue in result.get('rowIssues', []):
print(f" Row {issue['rowIndex']}: {issue['message']}")
raise Exception('Data validation failed')
else:
raise Exception(f'Update failed: {response.text}')
def update_from_binary(self, dataset_id, file_path):
"""Update dataset from binary file."""
url = f'{BASE_URL}/api/{TENANT_ID}/{PROJECT_ID}/dataset/{dataset_id}/binary'
with open(file_path, 'rb') as f:
files = {'file': (file_path, f, 'application/octet-stream')}
response = requests.put(url, headers=self.headers, files=files)
if response.ok:
return response.json()
else:
raise Exception(f'Update failed: {response.text}')
# Usage
updater = DatasetUpdater('your-auth-token')
# Update from CSV
result = updater.update_from_csv(
'550e8400-e29b-41d4-a716-446655440000',
'updated_event_log.csv'
)
print(f"Updated dataset: {result['datasetId']}")
print(f"New case count: {result['caseCount']}")
print(f"New event count: {result['eventCount']}")
# Check for issues
if result['skippedRowsCount'] > 0:
print(f"Warning: {result['skippedRowsCount']} rows were skipped")
if result['invalidValueCount'] > 0:
print(f"Warning: {result['invalidValueCount']} invalid values found")
```
### JavaScript/Node.js
```javascript
const TENANT_ID = '12345678-1234-1234-1234-123456789012';
const PROJECT_ID = '87654321-4321-4321-4321-210987654321';
const BASE_URL = 'https://your-mindzie-instance.com';
class DatasetUpdater {
constructor(token) {
this.token = token;
}
async updateFromCsv(datasetId, file, culture = 'en-US') {
const url = `${BASE_URL}/api/${TENANT_ID}/${PROJECT_ID}/dataset/${datasetId}/csv`;
const formData = new FormData();
formData.append('file', file);
formData.append('cultureInfo', culture);
const response = await fetch(url, {
method: 'PUT',
headers: { 'Authorization': `Bearer ${this.token}` },
body: formData
});
if (response.ok) {
return await response.json();
} else if (response.status === 422) {
const result = await response.json();
throw new Error(`Validation failed: ${result.errors.join(', ')}`);
} else {
throw new Error(`Update failed: ${await response.text()}`);
}
}
async updateFromPackage(datasetId, file, culture = 'en-US') {
const url = `${BASE_URL}/api/${TENANT_ID}/${PROJECT_ID}/dataset/${datasetId}/package`;
const formData = new FormData();
formData.append('file', file);
formData.append('cultureInfo', culture);
const response = await fetch(url, {
method: 'PUT',
headers: { 'Authorization': `Bearer ${this.token}` },
body: formData
});
if (response.ok) {
return await response.json();
} else {
const error = await response.json();
throw new Error(`Update failed: ${error.errors?.join(', ') || response.statusText}`);
}
}
}
// Usage (browser)
const updater = new DatasetUpdater('your-auth-token');
const fileInput = document.getElementById('updateFile');
fileInput.addEventListener('change', async (e) => {
const file = e.target.files[0];
const datasetId = '550e8400-e29b-41d4-a716-446655440000';
try {
const result = await updater.updateFromCsv(datasetId, file);
console.log(`Updated: ${result.datasetId}`);
console.log(`New cases: ${result.caseCount}`);
console.log(`New events: ${result.eventCount}`);
if (result.skippedRowsCount > 0) {
console.warn(`Skipped ${result.skippedRowsCount} rows`);
}
} catch (error) {
console.error('Update failed:', error.message);
}
});
```
## Response Fields
| Field | Type | Description |
|-------|------|-------------|
| `datasetId` | GUID | ID of the updated dataset |
| `caseCount` | integer | Number of unique cases in updated data |
| `eventCount` | integer | Total number of events in updated data |
| `invalidValueCount` | integer | Number of invalid values encountered |
| `skippedRowsCount` | integer | Number of rows skipped due to errors |
| `errors` | array | List of error messages |
| `rowIssues` | array | Detailed information about row-level issues |
| `statusCode` | integer | HTTP status code |
## Row Issue Structure
```json
{
"rowIndex": 15,
"columnName": "Timestamp",
"errorType": "ParseError",
"outcome": "Skipped",
"message": "Unable to parse date value '2024-13-45'"
}
```
| Field | Description |
|-------|-------------|
| `rowIndex` | Row number with the issue |
| `columnName` | Column containing the problematic value |
| `errorType` | Type of error (ParseError, ValidationError, etc.) |
| `outcome` | What happened (Skipped, DefaultValue, etc.) |
| `message` | Human-readable error description |
## Best Practices
- **Backup First:** Consider exporting current data before updates
- **Verify Structure:** Ensure new data has the same column structure
- **Check Results:** Review `rowIssues` and `skippedRowsCount` after updates
- **Test First:** Test updates on a non-production dataset first
- **Culture Settings:** Use the correct culture for date and number formats
---
## Overview
Section: Enrichment
URL: https://docs.mindziestudio.com/mindzie_api/enrichment/overview
Source: /docs-master/mindzieAPI/enrichment/overview/page.md
# Enrichments
**Data Enrichment API**
Enhance your datasets with AI-powered enrichments, custom pipelines, and integrated Python notebooks for advanced analytics.
## Features
### Enrichment Pipelines
Build and manage data enrichment pipelines.
[View Pipelines](/mindzie_api/enrichment/pipelines)
### Pipeline Execution
Execute enrichment pipelines on your datasets.
[Execute Pipelines](/mindzie_api/enrichment/execution)
### Python Notebooks
Use Jupyter notebooks for custom enrichments.
[View Notebooks](/mindzie_api/enrichment/notebooks)
## Available Endpoints
### Enrichment Management
Core operations for managing enrichment pipelines and configurations.
| Method | Endpoint | Description |
|--------|----------|-------------|
| GET | `/api/{tenantId}/{projectId}/enrichments` | List all enrichment pipelines |
| POST | `/api/{tenantId}/{projectId}/enrichment` | Create new enrichment pipeline |
| GET | `/api/{tenantId}/{projectId}/enrichment/{enrichmentId}` | Get enrichment details |
| PUT | `/api/{tenantId}/{projectId}/enrichment/{enrichmentId}` | Update enrichment configuration |
| DELETE | `/api/{tenantId}/{projectId}/enrichment/{enrichmentId}` | Delete enrichment pipeline |
### Pipeline Execution
Execute enrichment pipelines and monitor processing status.
| Method | Endpoint | Description |
|--------|----------|-------------|
| POST | `/api/{tenantId}/{projectId}/enrichment/{enrichmentId}/execute` | Execute enrichment pipeline |
| GET | `/api/{tenantId}/{projectId}/enrichment/{enrichmentId}/status` | Get execution status |
| GET | `/api/{tenantId}/{projectId}/enrichment/{enrichmentId}/results` | Get enrichment results |
### Notebook Integration
Manage Python notebooks for custom enrichment logic.
| Method | Endpoint | Description |
|--------|----------|-------------|
| GET | `/api/{tenantId}/{projectId}/enrichment/notebooks` | List available notebooks |
| POST | `/api/{tenantId}/{projectId}/enrichment/notebook/execute` | Execute notebook enrichment |
## Enrichment Types
mindzieStudio supports various types of data enrichment for enhanced process mining analysis:
### AI-Powered Enrichments
Leverage artificial intelligence for intelligent data enhancement.
- Activity classification
- Anomaly detection
- Pattern recognition
- Predictive insights
### Statistical Enrichments
Add calculated metrics and statistical insights.
- Duration calculations
- Frequency analysis
- Performance indicators
- Trend analysis
### Business Rules
Apply custom business logic and validation rules.
- Compliance checking
- Business rule validation
- Data quality assessment
- Custom transformations
### External Integration
Enrich data with external system information.
- ERP data lookup
- CRM integration
- Third-party APIs
- Master data enrichment
## Pipeline Configuration
Understanding enrichment pipeline structure and configuration options:
### Basic Pipeline Structure
```json
{
"enrichmentId": "enrich-550e8400-e29b-41d4-a716-446655440000",
"name": "Process Performance Enrichment",
"description": "Calculate KPIs and performance metrics",
"type": "statistical",
"inputDataset": "dataset-660e8400-e29b-41d4-a716-446655440000",
"steps": [
{
"stepId": "step-001",
"type": "duration_calculation",
"config": {
"fromActivity": "Order Created",
"toActivity": "Order Completed",
"outputColumn": "TotalDuration"
}
},
{
"stepId": "step-002",
"type": "frequency_analysis",
"config": {
"groupBy": "Activity",
"outputColumn": "ActivityFrequency"
}
}
],
"schedule": {
"enabled": true,
"frequency": "daily",
"time": "02:00"
}
}
```
## Common Use Cases
- **Process Intelligence:** Add AI-powered insights and pattern recognition to event logs
- **Performance Analysis:** Calculate KPIs, durations, and performance metrics automatically
- **Data Quality:** Validate and clean process data using business rules
- **Compliance Monitoring:** Check adherence to business rules and regulations
- **Predictive Analytics:** Generate predictions for process outcomes and bottlenecks
- **External Context:** Enrich process data with information from other business systems
> **Note:** All Enrichment API endpoints require valid authentication with appropriate permissions for the target project and tenant.
> **Get Started:** Begin with [Pipeline Management](/mindzie_api/enrichment/pipelines) to create enrichment pipelines, then explore [Pipeline Execution](/mindzie_api/enrichment/execution) for running enrichments on your datasets.
---
## Pipelines
Section: Enrichment
URL: https://docs.mindziestudio.com/mindzie_api/enrichment/pipelines
Source: /docs-master/mindzieAPI/enrichment/pipelines/page.md
# Enrichment Pipelines
**Build Data Enrichment Workflows**
Create and manage enrichment pipelines to transform and enhance your process mining datasets.
## Get Pipeline Details
**GET** `/api/{tenantId}/{projectId}/enrichment/pipeline/{pipelineId}`
Retrieves comprehensive information about a specific enrichment pipeline including its stages, configuration, and execution metadata.
### Parameters
| Parameter | Type | Location | Description |
|-----------|------|----------|-------------|
| `tenantId` | GUID | Path | The tenant identifier |
| `projectId` | GUID | Path | The project identifier |
| `pipelineId` | GUID | Path | The pipeline identifier |
### Response
```json
{
"pipelineId": "770e8400-e29b-41d4-a716-446655440000",
"projectId": "660e8400-e29b-41d4-a716-446655440000",
"pipelineName": "Process Mining Data Enrichment",
"pipelineDescription": "Enriches event logs with additional attributes and calculations",
"status": "Active",
"stages": [
{
"stageId": "stage-001",
"stageName": "Data Validation",
"stageType": "Validation",
"order": 1,
"configuration": {
"validateCaseId": true,
"validateTimestamps": true,
"requireActivityNames": true
}
},
{
"stageId": "stage-002",
"stageName": "Time Enrichment",
"stageType": "TimeCalculation",
"order": 2,
"configuration": {
"addDayOfWeek": true,
"addBusinessHours": true,
"timezoneId": "UTC"
}
}
],
"triggers": {
"automatic": true,
"schedule": "0 2 * * *",
"onDataUpdate": true
},
"dateCreated": "2024-01-15T10:30:00Z",
"dateModified": "2024-01-20T14:45:00Z",
"createdBy": "user123",
"lastExecutionDate": "2024-01-20T02:00:00Z",
"lastExecutionStatus": "Success",
"executionCount": 45
}
```
## List All Pipelines
**GET** `/api/{tenantId}/{projectId}/enrichment/pipelines`
Retrieves a list of all enrichment pipelines in the project with basic metadata and status information.
### Query Parameters
| Parameter | Type | Description |
|-----------|------|-------------|
| `status` | string | Filter by pipeline status: Active, Inactive, Failed |
| `page` | integer | Page number for pagination (default: 1) |
| `pageSize` | integer | Number of items per page (default: 20, max: 100) |
### Response
```json
{
"pipelines": [
{
"pipelineId": "770e8400-e29b-41d4-a716-446655440000",
"pipelineName": "Process Mining Data Enrichment",
"status": "Active",
"stageCount": 5,
"lastExecutionDate": "2024-01-20T02:00:00Z",
"lastExecutionStatus": "Success",
"dateCreated": "2024-01-15T10:30:00Z"
}
],
"totalCount": 12,
"page": 1,
"pageSize": 20,
"hasNextPage": false
}
```
## Create New Pipeline
**POST** `/api/{tenantId}/{projectId}/enrichment/pipeline`
Creates a new enrichment pipeline with specified stages and configuration. The pipeline can be configured to run automatically or manually.
### Request Body
```json
{
"pipelineName": "Customer Journey Enrichment",
"pipelineDescription": "Enriches customer journey data with demographics and behavior patterns",
"stages": [
{
"stageName": "Customer Data Lookup",
"stageType": "DataLookup",
"order": 1,
"configuration": {
"lookupTable": "customer_demographics",
"joinKey": "customerId",
"selectFields": ["age", "segment", "region"]
}
},
{
"stageName": "Journey Metrics",
"stageType": "Calculation",
"order": 2,
"configuration": {
"calculations": [
{
"fieldName": "journeyDuration",
"formula": "LAST_TIMESTAMP - FIRST_TIMESTAMP",
"groupBy": "caseId"
},
{
"fieldName": "touchpointCount",
"formula": "COUNT(*)",
"groupBy": "caseId"
}
]
}
}
],
"triggers": {
"automatic": false,
"schedule": null,
"onDataUpdate": true
}
}
```
### Response
Returns `201 Created` with the complete pipeline object including generated IDs and timestamps.
## Update Pipeline
**PUT** `/api/{tenantId}/{projectId}/enrichment/pipeline/{pipelineId}`
Updates an existing pipeline's configuration, stages, or triggers. Changes take effect on the next execution.
### Request Body
```json
{
"pipelineName": "Updated Customer Journey Enrichment",
"pipelineDescription": "Enhanced customer journey data enrichment with ML insights",
"status": "Active",
"triggers": {
"automatic": true,
"schedule": "0 3 * * *",
"onDataUpdate": true
}
}
```
### Response
Returns the updated pipeline object with the same structure as the GET endpoint.
## Delete Pipeline
**DELETE** `/api/{tenantId}/{projectId}/enrichment/pipeline/{pipelineId}`
Permanently removes a pipeline and all its execution history. This operation cannot be undone and will stop any currently running executions.
### Response Codes
- `204 No Content` - Pipeline deleted successfully
- `404 Not Found` - Pipeline not found or access denied
- `409 Conflict` - Pipeline is currently executing and cannot be deleted
## Add Stage to Pipeline
**POST** `/api/{tenantId}/{projectId}/enrichment/pipeline/{pipelineId}/stage`
Adds a new processing stage to an existing pipeline. The stage will be inserted at the specified order position.
### Request Body
```json
{
"stageName": "Process Performance Metrics",
"stageType": "PerformanceCalculation",
"order": 3,
"configuration": {
"metrics": [
{
"name": "cycleTime",
"calculation": "CASE_DURATION",
"unit": "hours"
},
{
"name": "waitTime",
"calculation": "ACTIVITY_WAITING_TIME",
"unit": "hours"
}
],
"aggregations": ["AVG", "MAX", "MIN", "P95"]
}
}
```
### Response
Returns `201 Created` with the complete stage object including generated stage ID.
## Remove Stage from Pipeline
**DELETE** `/api/{tenantId}/{projectId}/enrichment/pipeline/{pipelineId}/stage/{stageId}`
Removes a specific stage from the pipeline. Subsequent stages will be reordered automatically.
### Response Codes
- `204 No Content` - Stage removed successfully
- `404 Not Found` - Stage not found in pipeline
- `409 Conflict` - Cannot remove stage while pipeline is executing
## Example: Complete Pipeline Workflow
This example demonstrates creating and managing an enrichment pipeline:
```javascript
// 1. Create a new enrichment pipeline
const createPipeline = async () => {
const response = await fetch('/api/{tenantId}/{projectId}/enrichment/pipeline', {
method: 'POST',
headers: {
'Content-Type': 'application/json',
'Authorization': `Bearer ${token}`
},
body: JSON.stringify({
pipelineName: 'Order Processing Enrichment',
pipelineDescription: 'Enriches order data with fulfillment metrics',
stages: [
{
stageName: 'Order Validation',
stageType: 'Validation',
order: 1,
configuration: {
validateOrderId: true,
validateCustomerId: true,
validateAmounts: true
}
},
{
stageName: 'Fulfillment Time Calculation',
stageType: 'TimeCalculation',
order: 2,
configuration: {
startActivity: 'Order Received',
endActivity: 'Order Shipped',
outputField: 'fulfillmentTime'
}
}
],
triggers: {
automatic: true,
onDataUpdate: true
}
})
});
return await response.json();
};
// 2. Add a new stage to existing pipeline
const addStage = async (pipelineId) => {
const response = await fetch(`/api/{tenantId}/{projectId}/enrichment/pipeline/${pipelineId}/stage`, {
method: 'POST',
headers: {
'Content-Type': 'application/json',
'Authorization': `Bearer ${token}`
},
body: JSON.stringify({
stageName: 'Customer Segmentation',
stageType: 'Classification',
order: 3,
configuration: {
segmentationRules: [
{
segment: 'VIP',
condition: 'orderValue > 1000'
},
{
segment: 'Regular',
condition: 'orderValue <= 1000'
}
]
}
})
});
return await response.json();
};
// 3. Get pipeline status
const getPipelineStatus = async (pipelineId) => {
const response = await fetch(`/api/{tenantId}/{projectId}/enrichment/pipeline/${pipelineId}`, {
headers: {
'Authorization': `Bearer ${token}`
}
});
return await response.json();
};
```
## Python Example
```python
import requests
import json
from datetime import datetime
class EnrichmentPipelineManager:
def __init__(self, base_url, tenant_id, project_id, token):
self.base_url = base_url
self.tenant_id = tenant_id
self.project_id = project_id
self.headers = {
'Authorization': f'Bearer {token}',
'Content-Type': 'application/json'
}
def create_pipeline(self, name, description, stages, triggers=None):
"""Create a new enrichment pipeline"""
url = f"{self.base_url}/api/{self.tenant_id}/{self.project_id}/enrichment/pipeline"
payload = {
'pipelineName': name,
'pipelineDescription': description,
'stages': stages,
'triggers': triggers or {'automatic': False, 'onDataUpdate': True}
}
response = requests.post(url, json=payload, headers=self.headers)
return response.json()
def get_pipeline(self, pipeline_id):
"""Get pipeline details"""
url = f"{self.base_url}/api/{self.tenant_id}/{self.project_id}/enrichment/pipeline/{pipeline_id}"
response = requests.get(url, headers=self.headers)
return response.json()
def list_pipelines(self, status=None, page=1, page_size=20):
"""List all pipelines with optional filtering"""
url = f"{self.base_url}/api/{self.tenant_id}/{self.project_id}/enrichment/pipelines"
params = {'page': page, 'pageSize': page_size}
if status:
params['status'] = status
response = requests.get(url, params=params, headers=self.headers)
return response.json()
def add_stage(self, pipeline_id, stage_name, stage_type, order, configuration):
"""Add a new stage to an existing pipeline"""
url = f"{self.base_url}/api/{self.tenant_id}/{self.project_id}/enrichment/pipeline/{pipeline_id}/stage"
payload = {
'stageName': stage_name,
'stageType': stage_type,
'order': order,
'configuration': configuration
}
response = requests.post(url, json=payload, headers=self.headers)
return response.json()
def update_pipeline(self, pipeline_id, name=None, description=None, status=None, triggers=None):
"""Update pipeline configuration"""
url = f"{self.base_url}/api/{self.tenant_id}/{self.project_id}/enrichment/pipeline/{pipeline_id}"
payload = {}
if name:
payload['pipelineName'] = name
if description:
payload['pipelineDescription'] = description
if status:
payload['status'] = status
if triggers:
payload['triggers'] = triggers
response = requests.put(url, json=payload, headers=self.headers)
return response.json()
def delete_pipeline(self, pipeline_id):
"""Delete a pipeline"""
url = f"{self.base_url}/api/{self.tenant_id}/{self.project_id}/enrichment/pipeline/{pipeline_id}"
response = requests.delete(url, headers=self.headers)
return response.status_code == 204
# Usage example
manager = EnrichmentPipelineManager(
'https://your-mindzie-instance.com',
'tenant-guid',
'project-guid',
'your-auth-token'
)
# Create a comprehensive enrichment pipeline
stages = [
{
'stageName': 'Data Quality Check',
'stageType': 'Validation',
'order': 1,
'configuration': {
'checkDuplicates': True,
'validateTimestamps': True,
'checkMissingValues': True
}
},
{
'stageName': 'Process Mining Metrics',
'stageType': 'ProcessCalculation',
'order': 2,
'configuration': {
'calculateCycleTime': True,
'calculateWaitingTime': True,
'calculateResourceUtilization': True,
'detectBottlenecks': True
}
},
{
'stageName': 'Anomaly Detection',
'stageType': 'AnomalyDetection',
'order': 3,
'configuration': {
'algorithm': 'isolation_forest',
'threshold': 0.1,
'features': ['duration', 'cost', 'resourceCount']
}
}
]
pipeline = manager.create_pipeline(
'Comprehensive Process Analysis',
'End-to-end process analysis with anomaly detection',
stages,
{'automatic': True, 'schedule': '0 1 * * *', 'onDataUpdate': True}
)
print(f"Created pipeline: {pipeline['pipelineId']}")
# List all active pipelines
active_pipelines = manager.list_pipelines(status='Active')
print(f"Found {active_pipelines['totalCount']} active pipelines")
```
---
## Notebooks
Section: Enrichment
URL: https://docs.mindziestudio.com/mindzie_api/enrichment/notebooks
Source: /docs-master/mindzieAPI/enrichment/notebooks/page.md
# Python Notebooks
**Jupyter Notebook Integration**
Integrate Jupyter notebooks for custom enrichments, data analysis, and machine learning workflows.
## Get Notebook Details
**GET** `/api/{tenantId}/{projectId}/notebook/{notebookId}`
Retrieves comprehensive information about a Jupyter notebook including its cells, execution status, and integration parameters.
### Parameters
| Parameter | Type | Location | Description |
|-----------|------|----------|-------------|
| `tenantId` | GUID | Path | The tenant identifier |
| `projectId` | GUID | Path | The project identifier |
| `notebookId` | GUID | Path | The notebook identifier |
### Response
```json
{
"notebookId": "aa0e8400-e29b-41d4-a716-446655440000",
"projectId": "660e8400-e29b-41d4-a716-446655440000",
"notebookName": "Process Mining Analysis",
"notebookDescription": "Custom analysis for customer journey optimization",
"notebookVersion": "1.3.2",
"kernelType": "python3",
"status": "Ready",
"integration": {
"enrichmentMode": true,
"datasetBinding": "880e8400-e29b-41d4-a716-446655440000",
"outputFormat": "enriched_dataframe",
"autoExecution": false
},
"cells": [
{
"cellId": "cell-001",
"cellType": "code",
"executionCount": 15,
"hasOutput": true,
"lastExecuted": "2024-01-20T10:30:00Z",
"executionStatus": "Success"
},
{
"cellId": "cell-002",
"cellType": "markdown",
"lastModified": "2024-01-19T14:20:00Z"
}
],
"environment": {
"pythonVersion": "3.9.18",
"packages": ["pandas", "numpy", "scikit-learn", "mindzie-sdk"],
"customLibraries": ["process_mining_utils", "customer_analytics"]
},
"dateCreated": "2024-01-15T10:30:00Z",
"dateModified": "2024-01-20T10:30:00Z",
"createdBy": "user123",
"lastExecutionDate": "2024-01-20T10:30:00Z",
"executionCount": 47
}
```
## List All Notebooks
**GET** `/api/{tenantId}/{projectId}/notebooks`
Retrieves a list of all Jupyter notebooks in the project with basic metadata and execution status.
### Query Parameters
| Parameter | Type | Description |
|-----------|------|-------------|
| `status` | string | Filter by status: Ready, Running, Error, Kernel_Dead |
| `kernelType` | string | Filter by kernel type: python3, r, scala |
| `enrichmentMode` | boolean | Filter notebooks configured for data enrichment |
| `page` | integer | Page number for pagination (default: 1) |
| `pageSize` | integer | Number of items per page (default: 20, max: 100) |
### Response
```json
{
"notebooks": [
{
"notebookId": "aa0e8400-e29b-41d4-a716-446655440000",
"notebookName": "Process Mining Analysis",
"kernelType": "python3",
"status": "Ready",
"enrichmentMode": true,
"cellCount": 12,
"lastExecutionDate": "2024-01-20T10:30:00Z",
"dateCreated": "2024-01-15T10:30:00Z"
}
],
"totalCount": 8,
"page": 1,
"pageSize": 20,
"hasNextPage": false
}
```
## Create New Notebook
**POST** `/api/{tenantId}/{projectId}/notebook`
Creates a new Jupyter notebook with specified configuration and optional template. The notebook is automatically configured for mindzie data integration.
### Request Body
```json
{
"notebookName": "Advanced Customer Analytics",
"notebookDescription": "Machine learning models for customer behavior prediction",
"kernelType": "python3",
"template": "process_mining_starter",
"integration": {
"enrichmentMode": true,
"datasetBinding": "880e8400-e29b-41d4-a716-446655440000",
"outputFormat": "enriched_dataframe",
"autoExecution": false
},
"environment": {
"packages": ["pandas", "numpy", "scikit-learn", "matplotlib", "seaborn"],
"customLibraries": ["process_mining_utils"]
},
"initialCells": [
{
"cellType": "markdown",
"content": "# Customer Analytics Notebook\n\nThis notebook analyzes customer journey data using process mining techniques."
},
{
"cellType": "code",
"content": "import pandas as pd\nimport numpy as np\nfrom mindzie_sdk import ProcessMiningClient\n\n# Initialize mindzie client\nclient = ProcessMiningClient()"
}
]
}
```
### Response
Returns `201 Created` with the complete notebook object including generated notebook ID and initial session information.
## Execute Notebook
**POST** `/api/{tenantId}/{projectId}/notebook/{notebookId}/execute`
Executes all cells in the notebook or specified cell range. Execution runs asynchronously and results are stored for retrieval.
### Request Body
```json
{
"executionMode": "all",
"cellRange": {
"startCell": "cell-001",
"endCell": "cell-010"
},
"parameters": {
"dataset_id": "880e8400-e29b-41d4-a716-446655440000",
"analysis_period": "2024-01",
"include_weekends": false
},
"outputOptions": {
"captureOutputs": true,
"saveIntermediateResults": true,
"generateReport": true
},
"timeout": 1800,
"priority": "Normal"
}
```
### Response
```json
{
"executionId": "bb0e8400-e29b-41d4-a716-446655440000",
"notebookId": "aa0e8400-e29b-41d4-a716-446655440000",
"status": "Running",
"startTime": "2024-01-20T10:30:00Z",
"estimatedDuration": "15-20 minutes",
"currentCell": "cell-003",
"progress": {
"totalCells": 12,
"completedCells": 2,
"currentCellIndex": 3,
"percentComplete": 17
},
"parameters": {
"dataset_id": "880e8400-e29b-41d4-a716-446655440000",
"analysis_period": "2024-01",
"include_weekends": false
}
}
```
## Get Execution Status
**GET** `/api/{tenantId}/{projectId}/notebook/{notebookId}/execution/{executionId}`
Retrieves the current status and progress of a notebook execution, including cell-by-cell execution details and any errors.
### Response
```json
{
"executionId": "bb0e8400-e29b-41d4-a716-446655440000",
"notebookId": "aa0e8400-e29b-41d4-a716-446655440000",
"status": "Completed",
"startTime": "2024-01-20T10:30:00Z",
"endTime": "2024-01-20T10:47:00Z",
"totalDuration": "17 minutes",
"progress": {
"totalCells": 12,
"completedCells": 12,
"successfulCells": 11,
"failedCells": 1,
"percentComplete": 100
},
"cellResults": [
{
"cellId": "cell-001",
"status": "Success",
"executionTime": "0.5 seconds",
"hasOutput": false
},
{
"cellId": "cell-002",
"status": "Success",
"executionTime": "3.2 seconds",
"hasOutput": true,
"outputType": "display_data"
},
{
"cellId": "cell-003",
"status": "Error",
"executionTime": "1.1 seconds",
"errorType": "KeyError",
"errorMessage": "'customer_id' column not found in dataset"
}
],
"outputs": {
"dataFrames": 3,
"plots": 5,
"models": 2,
"enrichedData": {
"recordCount": 15420,
"newColumns": ["customer_segment", "journey_score", "anomaly_flag"]
}
},
"resources": {
"peakMemoryUsage": "2.3 GB",
"cpuTime": "8.5 minutes",
"diskUsage": "450 MB"
}
}
```
## Get Execution Results
**GET** `/api/{tenantId}/{projectId}/notebook/{notebookId}/execution/{executionId}/results`
Retrieves the outputs and results from a completed notebook execution, including generated data, plots, and enriched datasets.
### Query Parameters
| Parameter | Type | Description |
|-----------|------|-------------|
| `outputType` | string | Filter by output type: all, data, plots, models, reports |
| `format` | string | Response format: summary, detailed, download |
| `cellId` | string | Get results from specific cell only |
### Response
```json
{
"executionId": "bb0e8400-e29b-41d4-a716-446655440000",
"status": "Completed",
"outputs": [
{
"cellId": "cell-002",
"outputType": "display_data",
"contentType": "text/html",
"title": "Dataset Overview",
"content": "
Dataset contains 15,420 records...
",
"downloadUrl": "https://api.mindzie.com/downloads/cell-002-bb0e8400.html"
},
{
"cellId": "cell-005",
"outputType": "image/png",
"title": "Customer Journey Flow Chart",
"dimensions": {"width": 800, "height": 600},
"downloadUrl": "https://api.mindzie.com/downloads/cell-005-bb0e8400.png"
},
{
"cellId": "cell-008",
"outputType": "application/json",
"title": "Process Mining Metrics",
"content": {
"avgCycleTime": "4.2 hours",
"bottleneckActivities": ["Review Application", "Manager Approval"],
"processEfficiency": 78.5,
"customerSatisfactionScore": 8.2
},
"downloadUrl": "https://api.mindzie.com/downloads/cell-008-bb0e8400.json"
}
],
"enrichedDatasets": [
{
"name": "customer_journey_enhanced",
"recordCount": 15420,
"newColumns": ["customer_segment", "journey_score", "anomaly_flag"],
"format": "pandas_dataframe",
"downloadUrl": "https://api.mindzie.com/downloads/enriched-bb0e8400.csv"
}
],
"models": [
{
"name": "customer_churn_predictor",
"modelType": "RandomForestClassifier",
"accuracy": 0.87,
"features": ["journey_score", "cycle_time", "touchpoint_count"],
"downloadUrl": "https://api.mindzie.com/downloads/model-bb0e8400.pkl"
}
],
"reports": [
{
"name": "Customer Analytics Summary",
"format": "html",
"downloadUrl": "https://api.mindzie.com/downloads/report-bb0e8400.html"
}
]
}
```
## Update Notebook
**PUT** `/api/{tenantId}/{projectId}/notebook/{notebookId}`
Updates notebook configuration, cells, or integration settings. Changes to cells will trigger a new notebook version.
### Request Body
```json
{
"notebookName": "Advanced Customer Analytics v2",
"notebookDescription": "Enhanced ML models with real-time prediction capabilities",
"integration": {
"enrichmentMode": true,
"datasetBinding": "880e8400-e29b-41d4-a716-446655440000",
"outputFormat": "enriched_dataframe",
"autoExecution": true,
"scheduleExecution": "0 2 * * *"
},
"environment": {
"packages": ["pandas", "numpy", "scikit-learn", "tensorflow", "matplotlib"],
"customLibraries": ["process_mining_utils", "ml_models"]
}
}
```
### Response
Returns the updated notebook object with incremented version number and modification timestamps.
## Delete Notebook
**DELETE** `/api/{tenantId}/{projectId}/notebook/{notebookId}`
Permanently removes a notebook and all its execution history. This operation cannot be undone and will stop any currently running executions.
### Response Codes
- `204 No Content` - Notebook deleted successfully
- `404 Not Found` - Notebook not found or access denied
- `409 Conflict` - Notebook is currently executing and cannot be deleted
## Upload Existing Notebook
**POST** `/api/{tenantId}/{projectId}/notebook/upload`
Uploads an existing Jupyter notebook (.ipynb file) and configures it for mindzie integration. The notebook will be parsed and cells will be validated.
### Request (Multipart Form Data)
```
Content-Type: multipart/form-data
--boundary
Content-Disposition: form-data; name="file"; filename="analysis.ipynb"
Content-Type: application/json
{notebook content}
--boundary
Content-Disposition: form-data; name="notebookName"
Customer Journey Analysis
--boundary
Content-Disposition: form-data; name="enrichmentMode"
true
--boundary
Content-Disposition: form-data; name="datasetBinding"
880e8400-e29b-41d4-a716-446655440000
--boundary--
```
### Response
Returns `201 Created` with the uploaded notebook object including parsing results and any validation warnings.
## Example: Complete Notebook Workflow
This example demonstrates creating, executing, and retrieving results from a Jupyter notebook:
```javascript
// 1. Create a new notebook
const createNotebook = async () => {
const response = await fetch('/api/{tenantId}/{projectId}/notebook', {
method: 'POST',
headers: {
'Content-Type': 'application/json',
'Authorization': `Bearer ${token}`
},
body: JSON.stringify({
notebookName: 'Process Mining Analysis',
notebookDescription: 'Advanced analytics for process optimization',
kernelType: 'python3',
template: 'process_mining_starter',
integration: {
enrichmentMode: true,
datasetBinding: '880e8400-e29b-41d4-a716-446655440000',
outputFormat: 'enriched_dataframe',
autoExecution: false
},
environment: {
packages: ['pandas', 'numpy', 'scikit-learn', 'matplotlib'],
customLibraries: ['process_mining_utils']
},
initialCells: [
{
cellType: 'markdown',
content: '# Process Mining Analysis\n\nAnalyzing process efficiency and bottlenecks.'
},
{
cellType: 'code',
content: 'import pandas as pd\nfrom mindzie_sdk import ProcessMiningClient\n\nclient = ProcessMiningClient()'
}
]
})
});
return await response.json();
};
// 2. Execute the notebook
const executeNotebook = async (notebookId) => {
const response = await fetch(`/api/{tenantId}/{projectId}/notebook/${notebookId}/execute`, {
method: 'POST',
headers: {
'Content-Type': 'application/json',
'Authorization': `Bearer ${token}`
},
body: JSON.stringify({
executionMode: 'all',
parameters: {
dataset_id: '880e8400-e29b-41d4-a716-446655440000',
analysis_period: '2024-01',
include_weekends: false
},
outputOptions: {
captureOutputs: true,
saveIntermediateResults: true,
generateReport: true
},
timeout: 1800,
priority: 'High'
})
});
return await response.json();
};
// 3. Monitor execution progress
const monitorNotebookExecution = async (notebookId, executionId) => {
const checkStatus = async () => {
const response = await fetch(`/api/{tenantId}/{projectId}/notebook/${notebookId}/execution/${executionId}`, {
headers: {
'Authorization': `Bearer ${token}`
}
});
const execution = await response.json();
console.log(`Status: ${execution.status}, Progress: ${execution.progress.percentComplete}%`);
if (execution.status === 'Running') {
setTimeout(() => checkStatus(), 15000);
} else if (execution.status === 'Completed') {
console.log('Notebook execution completed!');
await getNotebookResults(notebookId, executionId);
} else if (execution.status === 'Error') {
console.log('Execution failed:', execution.cellResults.filter(c => c.status === 'Error'));
}
};
await checkStatus();
};
// 4. Get execution results
const getNotebookResults = async (notebookId, executionId) => {
const response = await fetch(`/api/{tenantId}/{projectId}/notebook/${notebookId}/execution/${executionId}/results?format=detailed`, {
headers: {
'Authorization': `Bearer ${token}`
}
});
const results = await response.json();
console.log('Execution Results:', results);
console.log('Enriched Datasets:', results.enrichedDatasets);
console.log('Generated Models:', results.models);
return results;
};
// Execute the workflow
createNotebook()
.then(notebook => {
console.log(`Created notebook: ${notebook.notebookId}`);
return executeNotebook(notebook.notebookId);
})
.then(execution => {
console.log(`Started execution: ${execution.executionId}`);
return monitorNotebookExecution(execution.notebookId, execution.executionId);
})
.catch(error => console.error('Notebook workflow failed:', error));
```
## Python Example
```python
import requests
import time
import json
from pathlib import Path
class NotebookManager:
def __init__(self, base_url, tenant_id, project_id, token):
self.base_url = base_url
self.tenant_id = tenant_id
self.project_id = project_id
self.headers = {
'Authorization': f'Bearer {token}',
'Content-Type': 'application/json'
}
def create_notebook(self, name, description, kernel_type="python3", template=None, integration=None):
"""Create a new Jupyter notebook"""
url = f"{self.base_url}/api/{self.tenant_id}/{self.project_id}/notebook"
payload = {
'notebookName': name,
'notebookDescription': description,
'kernelType': kernel_type,
'template': template,
'integration': integration or {
'enrichmentMode': True,
'outputFormat': 'enriched_dataframe',
'autoExecution': False
}
}
response = requests.post(url, json=payload, headers=self.headers)
return response.json()
def upload_notebook(self, file_path, name, dataset_binding=None):
"""Upload an existing notebook file"""
url = f"{self.base_url}/api/{self.tenant_id}/{self.project_id}/notebook/upload"
with open(file_path, 'rb') as file:
files = {'file': (Path(file_path).name, file, 'application/json')}
data = {
'notebookName': name,
'enrichmentMode': 'true',
'datasetBinding': dataset_binding or ''
}
# Remove Content-Type header for multipart upload
headers = {k: v for k, v in self.headers.items() if k != 'Content-Type'}
response = requests.post(url, files=files, data=data, headers=headers)
return response.json()
def execute_notebook(self, notebook_id, parameters=None, timeout=1800):
"""Execute all cells in a notebook"""
url = f"{self.base_url}/api/{self.tenant_id}/{self.project_id}/notebook/{notebook_id}/execute"
payload = {
'executionMode': 'all',
'parameters': parameters or {},
'outputOptions': {
'captureOutputs': True,
'saveIntermediateResults': True,
'generateReport': True
},
'timeout': timeout,
'priority': 'Normal'
}
response = requests.post(url, json=payload, headers=self.headers)
return response.json()
def get_execution_status(self, notebook_id, execution_id):
"""Get notebook execution status"""
url = f"{self.base_url}/api/{self.tenant_id}/{self.project_id}/notebook/{notebook_id}/execution/{execution_id}"
response = requests.get(url, headers=self.headers)
return response.json()
def wait_for_completion(self, notebook_id, execution_id, poll_interval=15, timeout=3600):
"""Wait for notebook execution to complete"""
start_time = time.time()
while time.time() - start_time < timeout:
status = self.get_execution_status(notebook_id, execution_id)
print(f"Notebook {notebook_id}: {status['status']} ({status['progress']['percentComplete']}%)")
if status['status'] in ['Completed', 'Error', 'Cancelled']:
return status
time.sleep(poll_interval)
raise TimeoutError(f"Notebook execution {execution_id} did not complete within {timeout} seconds")
def get_execution_results(self, notebook_id, execution_id, output_type="all", format_type="detailed"):
"""Get notebook execution results"""
url = f"{self.base_url}/api/{self.tenant_id}/{self.project_id}/notebook/{notebook_id}/execution/{execution_id}/results"
params = {
'outputType': output_type,
'format': format_type
}
response = requests.get(url, params=params, headers=self.headers)
return response.json()
def list_notebooks(self, status=None, enrichment_mode=None, page=1, page_size=20):
"""List all notebooks with optional filtering"""
url = f"{self.base_url}/api/{self.tenant_id}/{self.project_id}/notebooks"
params = {'page': page, 'pageSize': page_size}
if status:
params['status'] = status
if enrichment_mode is not None:
params['enrichmentMode'] = str(enrichment_mode).lower()
response = requests.get(url, params=params, headers=self.headers)
return response.json()
# Usage example
manager = NotebookManager(
'https://your-mindzie-instance.com',
'tenant-guid',
'project-guid',
'your-auth-token'
)
try:
# Create a process mining notebook
notebook = manager.create_notebook(
'Advanced Process Analytics',
'Machine learning-based process analysis with anomaly detection',
'python3',
'process_mining_starter',
{
'enrichmentMode': True,
'datasetBinding': 'dataset-guid',
'outputFormat': 'enriched_dataframe',
'autoExecution': False
}
)
print(f"Created notebook: {notebook['notebookId']}")
# Execute with custom parameters
execution_params = {
'dataset_id': 'dataset-guid',
'analysis_type': 'full_analysis',
'time_window': '30_days',
'ml_models': ['anomaly_detection', 'process_prediction'],
'generate_visualizations': True
}
execution = manager.execute_notebook(
notebook['notebookId'],
execution_params,
timeout=2400 # 40 minutes
)
print(f"Started execution: {execution['executionId']}")
print(f"Estimated duration: {execution['estimatedDuration']}")
# Wait for completion
final_status = manager.wait_for_completion(
notebook['notebookId'],
execution['executionId']
)
if final_status['status'] == 'Completed':
# Get detailed results
results = manager.get_execution_results(
notebook['notebookId'],
execution['executionId'],
'all',
'detailed'
)
print("Notebook execution completed successfully!")
print(f"Generated outputs: {len(results['outputs'])}")
print(f"Enriched datasets: {len(results['enrichedDatasets'])}")
print(f"ML models created: {len(results['models'])}")
# Download enriched data
for dataset in results['enrichedDatasets']:
print(f"Download enriched data: {dataset['downloadUrl']}")
# Download models
for model in results['models']:
print(f"Download model '{model['name']}': {model['downloadUrl']}")
else:
print(f"Notebook execution failed with status: {final_status['status']}")
failed_cells = [cell for cell in final_status['cellResults'] if cell['status'] == 'Error']
for cell in failed_cells:
print(f"Cell {cell['cellId']} failed: {cell['errorMessage']}")
except Exception as e:
print(f"Error in notebook workflow: {e}")
```
---
## Execution
Section: Enrichment
URL: https://docs.mindziestudio.com/mindzie_api/enrichment/execution
Source: /docs-master/mindzieAPI/enrichment/execution/page.md
# Pipeline Execution
**Execute Enrichment Pipelines**
Run enrichment pipelines on datasets, monitor progress, and retrieve enhanced results.
## Execute Pipeline
**POST** `/api/{tenantId}/{projectId}/enrichment/pipeline/{pipelineId}/execute`
Triggers the execution of an enrichment pipeline on a specified dataset. The execution runs asynchronously and returns an execution ID for tracking progress.
### Parameters
| Parameter | Type | Location | Description |
|-----------|------|----------|-------------|
| `tenantId` | GUID | Path | The tenant identifier |
| `projectId` | GUID | Path | The project identifier |
| `pipelineId` | GUID | Path | The pipeline identifier |
### Request Body
```json
{
"datasetId": "880e8400-e29b-41d4-a716-446655440000",
"executionName": "Monthly Process Analysis",
"executionDescription": "Enrichment for monthly performance review",
"parameters": {
"timeRange": {
"startDate": "2024-01-01",
"endDate": "2024-01-31"
},
"filterCriteria": {
"includeWeekends": false,
"minCaseDuration": "1h"
},
"outputOptions": {
"includeRawData": true,
"generateSummary": true,
"exportFormat": "CSV"
}
},
"priority": "Normal",
"notifyOnCompletion": true
}
```
### Response
```json
{
"executionId": "990e8400-e29b-41d4-a716-446655440000",
"pipelineId": "770e8400-e29b-41d4-a716-446655440000",
"datasetId": "880e8400-e29b-41d4-a716-446655440000",
"status": "Queued",
"estimatedDuration": "15-20 minutes",
"executionName": "Monthly Process Analysis",
"dateSubmitted": "2024-01-20T10:30:00Z",
"priority": "Normal",
"stages": [
{
"stageId": "stage-001",
"stageName": "Data Validation",
"status": "Pending",
"estimatedDuration": "2-3 minutes"
},
{
"stageId": "stage-002",
"stageName": "Time Enrichment",
"status": "Pending",
"estimatedDuration": "8-10 minutes"
}
]
}
```
## Get Execution Status
**GET** `/api/{tenantId}/{projectId}/enrichment/execution/{executionId}`
Retrieves the current status and progress information for a pipeline execution, including detailed stage-by-stage progress.
### Response
```json
{
"executionId": "990e8400-e29b-41d4-a716-446655440000",
"pipelineId": "770e8400-e29b-41d4-a716-446655440000",
"datasetId": "880e8400-e29b-41d4-a716-446655440000",
"status": "Running",
"progress": 45,
"currentStage": {
"stageId": "stage-002",
"stageName": "Time Enrichment",
"status": "Running",
"progress": 60,
"startTime": "2024-01-20T10:35:00Z",
"estimatedCompletion": "2024-01-20T10:45:00Z"
},
"executionName": "Monthly Process Analysis",
"dateSubmitted": "2024-01-20T10:30:00Z",
"dateStarted": "2024-01-20T10:32:00Z",
"estimatedCompletion": "2024-01-20T10:50:00Z",
"priority": "Normal",
"stages": [
{
"stageId": "stage-001",
"stageName": "Data Validation",
"status": "Completed",
"progress": 100,
"startTime": "2024-01-20T10:32:00Z",
"endTime": "2024-01-20T10:35:00Z",
"duration": "3 minutes",
"recordsProcessed": 15420,
"validationResults": {
"totalRecords": 15420,
"validRecords": 15418,
"errors": 2,
"warnings": 15
}
},
{
"stageId": "stage-002",
"stageName": "Time Enrichment",
"status": "Running",
"progress": 60,
"startTime": "2024-01-20T10:35:00Z",
"recordsProcessed": 9252,
"totalRecords": 15418
}
],
"metrics": {
"totalRecords": 15420,
"processedRecords": 9252,
"errorCount": 2,
"warningCount": 15
}
}
```
## Get Execution Results
**GET** `/api/{tenantId}/{projectId}/enrichment/execution/{executionId}/results`
Retrieves the final results of a completed pipeline execution, including enriched data, summary statistics, and downloadable outputs.
### Query Parameters
| Parameter | Type | Description |
|-----------|------|-------------|
| `format` | string | Response format: summary, full, download (default: summary) |
| `includeRawData` | boolean | Include original dataset in response (default: false) |
| `limit` | integer | Limit number of records returned (max: 10000) |
### Response
```json
{
"executionId": "990e8400-e29b-41d4-a716-446655440000",
"status": "Completed",
"completionDate": "2024-01-20T10:48:00Z",
"totalDuration": "18 minutes",
"summary": {
"originalRecords": 15420,
"enrichedRecords": 15418,
"newAttributes": 8,
"dataQualityScore": 98.7,
"enrichmentCoverage": 99.9
},
"enrichedAttributes": [
{
"attributeName": "dayOfWeek",
"attributeType": "string",
"coverage": 100,
"uniqueValues": 7,
"description": "Day of the week for each event"
},
{
"attributeName": "businessHours",
"attributeType": "boolean",
"coverage": 100,
"description": "Whether event occurred during business hours"
},
{
"attributeName": "cycleTime",
"attributeType": "duration",
"coverage": 99.8,
"averageValue": "4.2 hours",
"description": "Time from case start to completion"
}
],
"dataQuality": {
"completeness": 99.9,
"accuracy": 98.5,
"consistency": 99.2,
"validity": 97.8,
"issues": [
{
"type": "Missing Timestamp",
"count": 2,
"severity": "High"
},
{
"type": "Invalid Duration",
"count": 15,
"severity": "Medium"
}
]
},
"downloadUrls": {
"enrichedDataset": "https://api.mindzie.com/downloads/enriched-990e8400.csv",
"summary": "https://api.mindzie.com/downloads/summary-990e8400.pdf",
"dataQualityReport": "https://api.mindzie.com/downloads/quality-990e8400.html"
}
}
```
## List Pipeline Executions
**GET** `/api/{tenantId}/{projectId}/enrichment/executions`
Retrieves a list of all pipeline executions with filtering and pagination options. Useful for monitoring execution history and performance.
### Query Parameters
| Parameter | Type | Description |
|-----------|------|-------------|
| `pipelineId` | GUID | Filter by specific pipeline |
| `status` | string | Filter by status: Queued, Running, Completed, Failed, Cancelled |
| `dateFrom` | datetime | Filter executions from this date |
| `dateTo` | datetime | Filter executions to this date |
| `page` | integer | Page number for pagination (default: 1) |
| `pageSize` | integer | Number of items per page (default: 20, max: 100) |
### Response
```json
{
"executions": [
{
"executionId": "990e8400-e29b-41d4-a716-446655440000",
"pipelineId": "770e8400-e29b-41d4-a716-446655440000",
"pipelineName": "Process Mining Data Enrichment",
"executionName": "Monthly Process Analysis",
"status": "Completed",
"dateSubmitted": "2024-01-20T10:30:00Z",
"dateCompleted": "2024-01-20T10:48:00Z",
"duration": "18 minutes",
"recordsProcessed": 15418,
"priority": "Normal",
"submittedBy": "user123"
}
],
"totalCount": 47,
"page": 1,
"pageSize": 20,
"hasNextPage": true
}
```
## Cancel Execution
**DELETE** `/api/{tenantId}/{projectId}/enrichment/execution/{executionId}`
Cancels a running or queued pipeline execution. Completed stages will be preserved, but the execution will stop at the current stage.
### Request Body (Optional)
```json
{
"reason": "User requested cancellation",
"preservePartialResults": true
}
```
### Response Codes
- `200 OK` - Execution cancelled successfully
- `404 Not Found` - Execution not found
- `409 Conflict` - Execution already completed or cannot be cancelled
## Restart Failed Execution
**POST** `/api/{tenantId}/{projectId}/enrichment/execution/{executionId}/restart`
Restarts a failed pipeline execution from the point of failure. Previously completed stages will be skipped unless explicitly requested to re-run.
### Request Body
```json
{
"restartFromStage": "stage-003",
"rerunCompletedStages": false,
"updateParameters": {
"retryFailedRecords": true,
"increaseTimeout": true
}
}
```
### Response
Returns `200 OK` with a new execution object containing updated execution ID and status.
## Example: Complete Execution Workflow
This example demonstrates executing a pipeline and monitoring its progress:
```javascript
// 1. Execute pipeline
const executeEnrichment = async () => {
const response = await fetch('/api/{tenantId}/{projectId}/enrichment/pipeline/{pipelineId}/execute', {
method: 'POST',
headers: {
'Content-Type': 'application/json',
'Authorization': `Bearer ${token}`
},
body: JSON.stringify({
datasetId: '880e8400-e29b-41d4-a716-446655440000',
executionName: 'Customer Journey Analysis',
executionDescription: 'Enriching customer data with journey metrics',
parameters: {
timeRange: {
startDate: '2024-01-01',
endDate: '2024-01-31'
},
outputOptions: {
includeRawData: true,
generateSummary: true,
exportFormat: 'CSV'
}
},
priority: 'High',
notifyOnCompletion: true
})
});
return await response.json();
};
// 2. Monitor execution progress
const monitorExecution = async (executionId) => {
const checkStatus = async () => {
const response = await fetch(`/api/{tenantId}/{projectId}/enrichment/execution/${executionId}`, {
headers: {
'Authorization': `Bearer ${token}`
}
});
const execution = await response.json();
console.log(`Status: ${execution.status}, Progress: ${execution.progress}%`);
if (execution.status === 'Running' || execution.status === 'Queued') {
// Check again in 30 seconds
setTimeout(() => checkStatus(), 30000);
} else if (execution.status === 'Completed') {
console.log('Execution completed successfully!');
await getResults(executionId);
} else if (execution.status === 'Failed') {
console.log('Execution failed:', execution.error);
}
};
await checkStatus();
};
// 3. Get results when completed
const getResults = async (executionId) => {
const response = await fetch(`/api/{tenantId}/{projectId}/enrichment/execution/${executionId}/results?format=summary`, {
headers: {
'Authorization': `Bearer ${token}`
}
});
const results = await response.json();
console.log('Enrichment Summary:', results.summary);
console.log('Download URLs:', results.downloadUrls);
return results;
};
// Execute the workflow
executeEnrichment()
.then(execution => {
console.log(`Started execution: ${execution.executionId}`);
return monitorExecution(execution.executionId);
})
.catch(error => console.error('Execution failed:', error));
```
## Python Example
```python
import requests
import time
import json
from datetime import datetime, timedelta
class PipelineExecutionManager:
def __init__(self, base_url, tenant_id, project_id, token):
self.base_url = base_url
self.tenant_id = tenant_id
self.project_id = project_id
self.headers = {
'Authorization': f'Bearer {token}',
'Content-Type': 'application/json'
}
def execute_pipeline(self, pipeline_id, dataset_id, execution_name, parameters=None, priority="Normal"):
"""Execute an enrichment pipeline"""
url = f"{self.base_url}/api/{self.tenant_id}/{self.project_id}/enrichment/pipeline/{pipeline_id}/execute"
payload = {
'datasetId': dataset_id,
'executionName': execution_name,
'parameters': parameters or {},
'priority': priority,
'notifyOnCompletion': True
}
response = requests.post(url, json=payload, headers=self.headers)
return response.json()
def get_execution_status(self, execution_id):
"""Get current execution status"""
url = f"{self.base_url}/api/{self.tenant_id}/{self.project_id}/enrichment/execution/{execution_id}"
response = requests.get(url, headers=self.headers)
return response.json()
def wait_for_completion(self, execution_id, poll_interval=30, timeout=3600):
"""Wait for execution to complete with periodic status checks"""
start_time = time.time()
while time.time() - start_time < timeout:
status = self.get_execution_status(execution_id)
print(f"Execution {execution_id}: {status['status']} ({status.get('progress', 0)}%)")
if status['status'] in ['Completed', 'Failed', 'Cancelled']:
return status
time.sleep(poll_interval)
raise TimeoutError(f"Execution {execution_id} did not complete within {timeout} seconds")
def get_execution_results(self, execution_id, format_type="summary", include_raw_data=False):
"""Get execution results"""
url = f"{self.base_url}/api/{self.tenant_id}/{self.project_id}/enrichment/execution/{execution_id}/results"
params = {
'format': format_type,
'includeRawData': include_raw_data
}
response = requests.get(url, params=params, headers=self.headers)
return response.json()
def cancel_execution(self, execution_id, reason="User cancellation"):
"""Cancel a running execution"""
url = f"{self.base_url}/api/{self.tenant_id}/{self.project_id}/enrichment/execution/{execution_id}"
payload = {
'reason': reason,
'preservePartialResults': True
}
response = requests.delete(url, json=payload, headers=self.headers)
return response.status_code == 200
def list_executions(self, pipeline_id=None, status=None, date_from=None, date_to=None, page=1, page_size=20):
"""List pipeline executions with filtering"""
url = f"{self.base_url}/api/{self.tenant_id}/{self.project_id}/enrichment/executions"
params = {'page': page, 'pageSize': page_size}
if pipeline_id:
params['pipelineId'] = pipeline_id
if status:
params['status'] = status
if date_from:
params['dateFrom'] = date_from.isoformat()
if date_to:
params['dateTo'] = date_to.isoformat()
response = requests.get(url, params=params, headers=self.headers)
return response.json()
# Usage example
manager = PipelineExecutionManager(
'https://your-mindzie-instance.com',
'tenant-guid',
'project-guid',
'your-auth-token'
)
# Execute pipeline with custom parameters
execution_params = {
'timeRange': {
'startDate': '2024-01-01',
'endDate': '2024-01-31'
},
'filterCriteria': {
'includeWeekends': False,
'minCaseDuration': '1h'
},
'outputOptions': {
'includeRawData': True,
'generateSummary': True,
'exportFormat': 'CSV'
}
}
try:
# Start execution
execution = manager.execute_pipeline(
'pipeline-guid',
'dataset-guid',
'Monthly Process Analysis',
execution_params,
'High'
)
print(f"Started execution: {execution['executionId']}")
print(f"Estimated duration: {execution['estimatedDuration']}")
# Wait for completion
final_status = manager.wait_for_completion(execution['executionId'])
if final_status['status'] == 'Completed':
# Get results
results = manager.get_execution_results(execution['executionId'])
print(f"Enrichment completed successfully!")
print(f"Original records: {results['summary']['originalRecords']}")
print(f"Enriched records: {results['summary']['enrichedRecords']}")
print(f"Data quality score: {results['summary']['dataQualityScore']}")
print(f"Download enriched data: {results['downloadUrls']['enrichedDataset']}")
else:
print(f"Execution failed with status: {final_status['status']}")
except Exception as e:
print(f"Error executing pipeline: {e}")
```
---
## Overview
Section: Execution
URL: https://docs.mindziestudio.com/mindzie_api/execution/overview
Source: /docs-master/mindzieAPI/execution/overview/page.md
# Execution
Job Execution API
Manage and monitor the execution of process mining jobs, handle asynchronous operations, and track job progress in real-time.
## Features
### Job Queue
Manage job queue and priorities.
[View Queue](/mindzie_api/execution/queue)
### Job Tracking
Track job status and progress.
[Track Jobs](/mindzie_api/execution/tracking)
### Async Operations
Handle long-running asynchronous operations.
[Async Operations](/mindzie_api/execution/async)
## Get Job Status
**GET** `/api/{tenantId}/{projectId}/execution/job/{jobId}`
Retrieves the current status and details of any execution job, including progress information, execution metrics, and completion status.
### Parameters
| Parameter | Type | Location | Description |
|-----------|------|----------|-------------|
| `tenantId` | GUID | Path | The tenant identifier |
| `projectId` | GUID | Path | The project identifier |
| `jobId` | GUID | Path | The job identifier |
### Response
```json
{
"jobId": "cc0e8400-e29b-41d4-a716-446655440000",
"projectId": "660e8400-e29b-41d4-a716-446655440000",
"jobType": "ProcessMining",
"jobName": "Customer Journey Analysis",
"jobDescription": "Comprehensive analysis of customer touchpoints and behaviors",
"status": "Running",
"priority": "High",
"progress": {
"percentage": 65,
"currentStage": "Data Processing",
"estimatedCompletion": "2024-01-20T11:15:00Z",
"elapsedTime": "8 minutes 32 seconds"
},
"resource": {
"resourceType": "Pipeline",
"resourceId": "770e8400-e29b-41d4-a716-446655440000",
"resourceName": "Customer Analytics Pipeline"
},
"execution": {
"startTime": "2024-01-20T10:30:00Z",
"submittedBy": "user123",
"executionNode": "worker-node-02",
"memoryUsage": "2.1 GB",
"cpuUsage": "45%",
"diskUsage": "890 MB"
},
"metrics": {
"recordsProcessed": 125430,
"totalRecords": 192850,
"errorCount": 3,
"warningCount": 12,
"averageProcessingRate": "1250 records/second"
},
"dateCreated": "2024-01-20T10:28:00Z",
"lastUpdated": "2024-01-20T10:38:45Z"
}
```
## List All Jobs
**GET** `/api/{tenantId}/{projectId}/execution/jobs`
Retrieves a paginated list of all execution jobs in the project with filtering options for status, job type, and date ranges.
### Query Parameters
| Parameter | Type | Description |
|-----------|------|-------------|
| `status` | string | Filter by status: Queued, Running, Completed, Failed, Cancelled |
| `jobType` | string | Filter by job type: ProcessMining, DataEnrichment, Notebook, Analysis |
| `priority` | string | Filter by priority: Low, Normal, High, Critical |
| `submittedBy` | string | Filter by user who submitted the job |
| `dateFrom` | datetime | Filter jobs from this date |
| `dateTo` | datetime | Filter jobs to this date |
| `page` | integer | Page number for pagination (default: 1) |
| `pageSize` | integer | Number of items per page (default: 20, max: 100) |
### Response
```json
{
"jobs": [
{
"jobId": "cc0e8400-e29b-41d4-a716-446655440000",
"jobType": "ProcessMining",
"jobName": "Customer Journey Analysis",
"status": "Running",
"priority": "High",
"progress": 65,
"startTime": "2024-01-20T10:30:00Z",
"estimatedCompletion": "2024-01-20T11:15:00Z",
"submittedBy": "user123",
"resourceName": "Customer Analytics Pipeline"
},
{
"jobId": "dd0e8400-e29b-41d4-a716-446655440000",
"jobType": "DataEnrichment",
"jobName": "Daily Sales Enrichment",
"status": "Completed",
"priority": "Normal",
"progress": 100,
"startTime": "2024-01-20T09:00:00Z",
"endTime": "2024-01-20T09:23:00Z",
"duration": "23 minutes",
"submittedBy": "system",
"resourceName": "Sales Data Pipeline"
}
],
"summary": {
"totalJobs": 156,
"runningJobs": 3,
"queuedJobs": 7,
"completedJobs": 142,
"failedJobs": 4
},
"page": 1,
"pageSize": 20,
"hasNextPage": true
}
```
## Submit New Job
**POST** `/api/{tenantId}/{projectId}/execution/job`
Submits a new execution job to the system. The job will be queued and processed based on priority and resource availability.
### Request Body
```json
{
"jobName": "Weekly Process Analysis",
"jobDescription": "Automated weekly analysis of process performance",
"jobType": "ProcessMining",
"priority": "Normal",
"resource": {
"resourceType": "Pipeline",
"resourceId": "770e8400-e29b-41d4-a716-446655440000"
},
"parameters": {
"datasetId": "880e8400-e29b-41d4-a716-446655440000",
"analysisType": "comprehensive",
"timeWindow": {
"startDate": "2024-01-01",
"endDate": "2024-01-07"
},
"includeAnomalyDetection": true,
"outputFormat": "detailed_report"
},
"scheduling": {
"executeImmediately": true,
"scheduledTime": null,
"timeoutMinutes": 120
},
"notifications": {
"onCompletion": true,
"onFailure": true,
"emailRecipients": ["analyst@company.com"]
}
}
```
### Response
```json
{
"jobId": "ee0e8400-e29b-41d4-a716-446655440000",
"status": "Queued",
"queuePosition": 3,
"estimatedStartTime": "2024-01-20T10:45:00Z",
"estimatedDuration": "45-60 minutes",
"jobName": "Weekly Process Analysis",
"priority": "Normal",
"dateSubmitted": "2024-01-20T10:30:00Z",
"submittedBy": "user123"
}
```
## Cancel Job
**DELETE** `/api/{tenantId}/{projectId}/execution/job/{jobId}`
Cancels a queued or running job. Completed jobs cannot be cancelled. Running jobs will be stopped gracefully when possible.
### Request Body (Optional)
```json
{
"reason": "User requested cancellation",
"forceTermination": false,
"preservePartialResults": true
}
```
### Response Codes
- `200 OK` - Job cancelled successfully
- `404 Not Found` - Job not found
- `409 Conflict` - Job already completed or cannot be cancelled
## Get Job Results
**GET** `/api/{tenantId}/{projectId}/execution/job/{jobId}/results`
Retrieves the results and outputs from a completed job execution, including generated artifacts, reports, and data files.
### Query Parameters
| Parameter | Type | Description |
|-----------|------|-------------|
| `format` | string | Response format: summary, detailed, download (default: summary) |
| `includeArtifacts` | boolean | Include downloadable artifacts in response (default: true) |
| `outputType` | string | Filter by output type: reports, data, models, visualizations |
### Response
```json
{
"jobId": "cc0e8400-e29b-41d4-a716-446655440000",
"status": "Completed",
"completionTime": "2024-01-20T11:12:00Z",
"totalDuration": "42 minutes",
"success": true,
"summary": {
"recordsProcessed": 192850,
"outputsGenerated": 7,
"dataQualityScore": 94.2,
"processingEfficiency": 87.5
},
"results": {
"primaryOutput": {
"type": "ProcessMiningReport",
"title": "Customer Journey Analysis Report",
"format": "html",
"size": "2.3 MB",
"downloadUrl": "https://api.mindzie.com/downloads/report-cc0e8400.html"
},
"additionalOutputs": [
{
"type": "EnrichedDataset",
"title": "Customer Journey Data Enhanced",
"format": "csv",
"recordCount": 192850,
"size": "45.7 MB",
"downloadUrl": "https://api.mindzie.com/downloads/data-cc0e8400.csv"
},
{
"type": "ProcessMap",
"title": "Customer Journey Process Map",
"format": "svg",
"size": "890 KB",
"downloadUrl": "https://api.mindzie.com/downloads/map-cc0e8400.svg"
},
{
"type": "AnalyticsModel",
"title": "Journey Prediction Model",
"format": "pkl",
"accuracy": 0.89,
"size": "12.4 MB",
"downloadUrl": "https://api.mindzie.com/downloads/model-cc0e8400.pkl"
}
]
},
"executionMetrics": {
"totalCpuTime": "38.5 minutes",
"peakMemoryUsage": "3.2 GB",
"diskIoOperations": 45672,
"networkDataTransfer": "567 MB"
},
"qualityMetrics": {
"dataValidation": {
"totalRecords": 195000,
"validRecords": 192850,
"duplicatesRemoved": 1890,
"invalidRecords": 260
},
"processingErrors": [],
"warnings": [
{
"type": "DataQuality",
"message": "Some timestamps had to be inferred",
"count": 125
}
]
}
}
```
## Retry Failed Job
**POST** `/api/{tenantId}/{projectId}/execution/job/{jobId}/retry`
Retries a failed job execution with optional parameter modifications. The job will be re-queued with the same or updated configuration.
### Request Body
```json
{
"retryReason": "Infrastructure issue resolved",
"modifyParameters": true,
"updatedParameters": {
"timeoutMinutes": 180,
"retryFailedRecords": true,
"increaseMemoryLimit": true
},
"priority": "High",
"immediateExecution": false
}
```
### Response
Returns `200 OK` with a new job object containing updated job ID and retry information.
## Get System Execution Status
**GET** `/api/{tenantId}/execution/system/status`
Retrieves the current system-wide execution status including resource utilization, queue health, and performance metrics.
### Response
```json
{
"systemStatus": "Healthy",
"timestamp": "2024-01-20T10:45:00Z",
"executionNodes": [
{
"nodeId": "worker-node-01",
"status": "Active",
"cpuUsage": 67,
"memoryUsage": 78,
"activeJobs": 2,
"jobCapacity": 4
},
{
"nodeId": "worker-node-02",
"status": "Active",
"cpuUsage": 45,
"memoryUsage": 56,
"activeJobs": 1,
"jobCapacity": 4
}
],
"queueStatistics": {
"totalQueuedJobs": 15,
"highPriorityJobs": 3,
"normalPriorityJobs": 10,
"lowPriorityJobs": 2,
"averageWaitTime": "4.2 minutes",
"estimatedProcessingTime": "23 minutes"
},
"performanceMetrics": {
"jobsCompletedToday": 847,
"averageJobDuration": "18.5 minutes",
"successRate": 97.8,
"throughputPerHour": 35.2
},
"resourceUtilization": {
"totalCpuCapacity": 1600,
"usedCpuCapacity": 896,
"totalMemoryCapacity": "64 GB",
"usedMemoryCapacity": "38.4 GB",
"diskSpaceAvailable": "2.3 TB"
}
}
```
## Example: Complete Job Management Workflow
This example demonstrates submitting a job, monitoring its progress, and retrieving results:
```javascript
// 1. Submit a new job
const submitJob = async () => {
const response = await fetch('/api/{tenantId}/{projectId}/execution/job', {
method: 'POST',
headers: {
'Content-Type': 'application/json',
'Authorization': `Bearer ${token}`
},
body: JSON.stringify({
jobName: 'Customer Behavior Analysis',
jobDescription: 'Weekly analysis of customer interaction patterns',
jobType: 'ProcessMining',
priority: 'High',
resource: {
resourceType: 'Pipeline',
resourceId: '770e8400-e29b-41d4-a716-446655440000'
},
parameters: {
datasetId: '880e8400-e29b-41d4-a716-446655440000',
analysisType: 'comprehensive',
timeWindow: {
startDate: '2024-01-13',
endDate: '2024-01-19'
},
includeAnomalyDetection: true,
outputFormat: 'detailed_report'
},
scheduling: {
executeImmediately: true,
timeoutMinutes: 90
},
notifications: {
onCompletion: true,
onFailure: true,
emailRecipients: ['analyst@company.com']
}
})
});
return await response.json();
};
// 2. Monitor job progress
const monitorJob = async (jobId) => {
const checkStatus = async () => {
const response = await fetch(`/api/{tenantId}/{projectId}/execution/job/${jobId}`, {
headers: {
'Authorization': `Bearer ${token}`
}
});
const job = await response.json();
console.log(`Job ${jobId}: ${job.status} (${job.progress.percentage}%)`);
console.log(`Current stage: ${job.progress.currentStage}`);
console.log(`ETA: ${job.progress.estimatedCompletion}`);
if (job.status === 'Running' || job.status === 'Queued') {
setTimeout(() => checkStatus(), 30000); // Check every 30 seconds
} else if (job.status === 'Completed') {
console.log('Job completed successfully!');
await getJobResults(jobId);
} else if (job.status === 'Failed') {
console.log('Job failed:', job.error);
}
};
await checkStatus();
};
// 3. Get job results
const getJobResults = async (jobId) => {
const response = await fetch(`/api/{tenantId}/{projectId}/execution/job/${jobId}/results?format=detailed&includeArtifacts=true`, {
headers: {
'Authorization': `Bearer ${token}`
}
});
const results = await response.json();
console.log('Job Results:', results.summary);
console.log('Primary Output:', results.results.primaryOutput.downloadUrl);
// Download additional outputs
for (const output of results.results.additionalOutputs) {
console.log(`Download ${output.type}: ${output.downloadUrl}`);
}
return results;
};
// 4. Get system status
const getSystemStatus = async () => {
const response = await fetch('/api/{tenantId}/execution/system/status', {
headers: {
'Authorization': `Bearer ${token}`
}
});
const status = await response.json();
console.log(`System Status: ${status.systemStatus}`);
console.log(`Queue: ${status.queueStatistics.totalQueuedJobs} jobs waiting`);
console.log(`Average wait time: ${status.queueStatistics.averageWaitTime}`);
return status;
};
// Execute the workflow
submitJob()
.then(job => {
console.log(`Submitted job: ${job.jobId}`);
console.log(`Queue position: ${job.queuePosition}`);
console.log(`Estimated start: ${job.estimatedStartTime}`);
return monitorJob(job.jobId);
})
.catch(error => console.error('Job workflow failed:', error));
```
## Python Example
```python
import requests
import time
import json
from datetime import datetime, timedelta
class ExecutionManager:
def __init__(self, base_url, tenant_id, project_id, token):
self.base_url = base_url
self.tenant_id = tenant_id
self.project_id = project_id
self.headers = {
'Authorization': f'Bearer {token}',
'Content-Type': 'application/json'
}
def submit_job(self, job_name, job_type, resource_type, resource_id, parameters=None, priority="Normal"):
"""Submit a new execution job"""
url = f"{self.base_url}/api/{self.tenant_id}/{self.project_id}/execution/job"
payload = {
'jobName': job_name,
'jobType': job_type,
'priority': priority,
'resource': {
'resourceType': resource_type,
'resourceId': resource_id
},
'parameters': parameters or {},
'scheduling': {
'executeImmediately': True,
'timeoutMinutes': 120
},
'notifications': {
'onCompletion': True,
'onFailure': True
}
}
response = requests.post(url, json=payload, headers=self.headers)
return response.json()
def get_job_status(self, job_id):
"""Get current job status"""
url = f"{self.base_url}/api/{self.tenant_id}/{self.project_id}/execution/job/{job_id}"
response = requests.get(url, headers=self.headers)
return response.json()
def list_jobs(self, status=None, job_type=None, date_from=None, date_to=None, page=1, page_size=20):
"""List jobs with optional filtering"""
url = f"{self.base_url}/api/{self.tenant_id}/{self.project_id}/execution/jobs"
params = {'page': page, 'pageSize': page_size}
if status:
params['status'] = status
if job_type:
params['jobType'] = job_type
if date_from:
params['dateFrom'] = date_from.isoformat()
if date_to:
params['dateTo'] = date_to.isoformat()
response = requests.get(url, params=params, headers=self.headers)
return response.json()
def wait_for_completion(self, job_id, poll_interval=30, timeout=3600):
"""Wait for job to complete with periodic status checks"""
start_time = time.time()
while time.time() - start_time < timeout:
job = self.get_job_status(job_id)
print(f"Job {job_id}: {job['status']} ({job['progress']['percentage']}%)")
print(f" Current stage: {job['progress']['currentStage']}")
print(f" Elapsed time: {job['progress']['elapsedTime']}")
if job['status'] in ['Completed', 'Failed', 'Cancelled']:
return job
time.sleep(poll_interval)
raise TimeoutError(f"Job {job_id} did not complete within {timeout} seconds")
def get_job_results(self, job_id, format_type="detailed", include_artifacts=True):
"""Get job execution results"""
url = f"{self.base_url}/api/{self.tenant_id}/{self.project_id}/execution/job/{job_id}/results"
params = {
'format': format_type,
'includeArtifacts': str(include_artifacts).lower()
}
response = requests.get(url, params=params, headers=self.headers)
return response.json()
def cancel_job(self, job_id, reason="User cancellation", force=False):
"""Cancel a running or queued job"""
url = f"{self.base_url}/api/{self.tenant_id}/{self.project_id}/execution/job/{job_id}"
payload = {
'reason': reason,
'forceTermination': force,
'preservePartialResults': True
}
response = requests.delete(url, json=payload, headers=self.headers)
return response.status_code == 200
def retry_job(self, job_id, reason="Retry after failure", priority=None, modify_params=None):
"""Retry a failed job"""
url = f"{self.base_url}/api/{self.tenant_id}/{self.project_id}/execution/job/{job_id}/retry"
payload = {
'retryReason': reason,
'modifyParameters': modify_params is not None,
'immediateExecution': False
}
if priority:
payload['priority'] = priority
if modify_params:
payload['updatedParameters'] = modify_params
response = requests.post(url, json=payload, headers=self.headers)
return response.json()
def get_system_status(self):
"""Get system-wide execution status"""
url = f"{self.base_url}/api/{self.tenant_id}/execution/system/status"
response = requests.get(url, headers=self.headers)
return response.json()
# Usage example
manager = ExecutionManager(
'https://your-mindzie-instance.com',
'tenant-guid',
'project-guid',
'your-auth-token'
)
try:
# Check system status
system_status = manager.get_system_status()
print(f"System Status: {system_status['systemStatus']}")
print(f"Jobs in queue: {system_status['queueStatistics']['totalQueuedJobs']}")
print(f"Average wait time: {system_status['queueStatistics']['averageWaitTime']}")
# Submit a comprehensive process mining job
job_params = {
'datasetId': 'dataset-guid',
'analysisType': 'comprehensive',
'timeWindow': {
'startDate': '2024-01-01',
'endDate': '2024-01-31'
},
'includeAnomalyDetection': True,
'includeProcessVariants': True,
'generateInsights': True,
'outputFormat': 'detailed_report',
'performanceMetrics': ['cycle_time', 'waiting_time', 'resource_utilization'],
'qualityChecks': {
'validateTimestamps': True,
'checkDuplicates': True,
'validateActivities': True
}
}
job = manager.submit_job(
'Monthly Process Analytics',
'ProcessMining',
'Pipeline',
'pipeline-guid',
job_params,
'High'
)
print(f"Submitted job: {job['jobId']}")
print(f"Queue position: {job['queuePosition']}")
print(f"Estimated start: {job['estimatedStartTime']}")
# Wait for completion
final_job = manager.wait_for_completion(job['jobId'])
if final_job['status'] == 'Completed':
# Get detailed results
results = manager.get_job_results(job['jobId'])
print("Job completed successfully!")
print(f"Records processed: {results['summary']['recordsProcessed']:,}")
print(f"Data quality score: {results['summary']['dataQualityScore']}")
print(f"Processing efficiency: {results['summary']['processingEfficiency']}%")
# Download primary report
print(f"Download report: {results['results']['primaryOutput']['downloadUrl']}")
# List all additional outputs
for output in results['results']['additionalOutputs']:
print(f"Download {output['type']}: {output['downloadUrl']}")
else:
print(f"Job failed with status: {final_job['status']}")
if 'error' in final_job:
print(f"Error: {final_job['error']}")
except Exception as e:
print(f"Error in execution workflow: {e}")
```
---
## Async
Section: Execution
URL: https://docs.mindziestudio.com/mindzie_api/execution/async
Source: /docs-master/mindzieAPI/execution/async/page.md
# Async Operations
Long-Running Operations
Handle asynchronous operations with callbacks, webhooks, and real-time status updates.
## Start Async Operation
**POST** `/api/{tenantId}/{projectId}/async/operation`
Initiates a long-running asynchronous operation and returns an operation ID for tracking. Supports callback URLs and webhook notifications.
### Parameters
| Parameter | Type | Location | Description |
|-----------|------|----------|-------------|
| `tenantId` | GUID | Path | The tenant identifier |
| `projectId` | GUID | Path | The project identifier |
### Request Body
```json
{
"operationType": "ProcessMiningAnalysis",
"operationName": "Comprehensive Customer Journey Analysis",
"operationDescription": "Deep analysis of customer interaction patterns with advanced ML algorithms",
"priority": "High",
"parameters": {
"datasetId": "880e8400-e29b-41d4-a716-446655440000",
"analysisType": "comprehensive",
"timeWindow": {
"startDate": "2024-01-01",
"endDate": "2024-01-31"
},
"algorithmSettings": {
"useAdvancedML": true,
"enableAnomalyDetection": true,
"performanceOptimization": "high_accuracy"
},
"outputOptions": {
"generateReports": true,
"createVisualizations": true,
"exportFormats": ["PDF", "CSV", "JSON"]
}
},
"callbacks": {
"onProgress": "https://your-app.com/webhooks/progress",
"onCompletion": "https://your-app.com/webhooks/completion",
"onError": "https://your-app.com/webhooks/error"
},
"notifications": {
"email": ["analyst@company.com", "manager@company.com"],
"slack": {
"channel": "#process-mining",
"mentionUsers": ["@analyst", "@data-team"]
}
},
"timeout": 7200,
"retryPolicy": {
"maxRetries": 3,
"retryDelay": 300,
"backoffMultiplier": 2.0
}
}
```
### Response
```json
{
"operationId": "op-ff0e8400-e29b-41d4-a716-446655440000",
"operationType": "ProcessMiningAnalysis",
"operationName": "Comprehensive Customer Journey Analysis",
"status": "Initiated",
"estimatedDuration": "45-60 minutes",
"estimatedCompletion": "2024-01-20T12:15:00Z",
"trackingUrl": "/api/{tenantId}/{projectId}/async/operation/op-ff0e8400-e29b-41d4-a716-446655440000",
"webhooksRegistered": 3,
"priority": "High",
"dateCreated": "2024-01-20T11:15:00Z",
"timeoutAt": "2024-01-20T13:15:00Z",
"resourcesAllocated": {
"cpuUnits": 4,
"memoryGB": 8,
"estimatedCost": "$2.45"
}
}
```
## Get Operation Status
**GET** `/api/{tenantId}/{projectId}/async/operation/{operationId}`
Retrieves the current status and progress of an asynchronous operation, including detailed execution information and estimated completion times.
### Parameters
| Parameter | Type | Location | Description |
|-----------|------|----------|-------------|
| `operationId` | string | Path | The operation identifier |
### Response
```json
{
"operationId": "op-ff0e8400-e29b-41d4-a716-446655440000",
"operationType": "ProcessMiningAnalysis",
"operationName": "Comprehensive Customer Journey Analysis",
"status": "Running",
"progress": {
"percentage": 67,
"currentPhase": "Machine Learning Analysis",
"phasesCompleted": 2,
"totalPhases": 3,
"startTime": "2024-01-20T11:18:00Z",
"elapsedTime": "23 minutes 15 seconds",
"estimatedRemaining": "15-20 minutes",
"estimatedCompletion": "2024-01-20T12:05:00Z"
},
"execution": {
"executionId": "exec-aa1e8400-e29b-41d4-a716-446655440000",
"workerNode": "async-worker-03",
"resourceUsage": {
"cpuUsage": 78,
"memoryUsage": "6.2 GB",
"diskUsage": "1.3 GB",
"networkIO": "45 MB"
},
"processedRecords": 125430,
"totalRecords": 187250,
"processingRate": "1890 records/minute"
},
"phases": [
{
"phaseName": "Data Loading & Validation",
"status": "Completed",
"startTime": "2024-01-20T11:18:00Z",
"endTime": "2024-01-20T11:25:00Z",
"duration": "7 minutes",
"recordsProcessed": 187250,
"validationResults": {
"validRecords": 187248,
"errorRecords": 2,
"dataQualityScore": 99.9
}
},
{
"phaseName": "Process Discovery",
"status": "Completed",
"startTime": "2024-01-20T11:25:00Z",
"endTime": "2024-01-20T11:38:00Z",
"duration": "13 minutes",
"results": {
"activitiesDiscovered": 52,
"processVariants": 347,
"uniquePaths": 289
}
},
{
"phaseName": "Machine Learning Analysis",
"status": "Running",
"startTime": "2024-01-20T11:38:00Z",
"progress": 72,
"currentActivity": "Training anomaly detection models",
"modelsTraining": 3,
"modelsCompleted": 2
},
{
"phaseName": "Report Generation",
"status": "Pending",
"estimatedStartTime": "2024-01-20T11:55:00Z",
"estimatedDuration": "8-10 minutes"
}
],
"callbacks": {
"progressCallbacksSent": 15,
"lastProgressCallback": "2024-01-20T11:40:00Z",
"callbacksSuccessful": 15,
"callbacksFailed": 0
},
"dateCreated": "2024-01-20T11:15:00Z",
"timeoutAt": "2024-01-20T13:15:00Z",
"priority": "High"
}
```
## List Async Operations
**GET** `/api/{tenantId}/{projectId}/async/operations`
Retrieves a list of asynchronous operations with filtering and pagination options. Useful for monitoring multiple long-running operations.
### Query Parameters
| Parameter | Type | Description |
|-----------|------|-------------|
| `status` | string | Filter by status: Initiated, Running, Completed, Failed, Cancelled, Timeout |
| `operationType` | string | Filter by operation type: ProcessMiningAnalysis, DataEnrichment, ReportGeneration |
| `priority` | string | Filter by priority: Low, Normal, High, Critical |
| `dateFrom` | datetime | Filter operations from this date |
| `dateTo` | datetime | Filter operations to this date |
| `includeDetails` | boolean | Include detailed execution information (default: false) |
| `page` | integer | Page number for pagination (default: 1) |
| `pageSize` | integer | Number of items per page (default: 20, max: 100) |
### Response
```json
{
"operations": [
{
"operationId": "op-ff0e8400-e29b-41d4-a716-446655440000",
"operationType": "ProcessMiningAnalysis",
"operationName": "Comprehensive Customer Journey Analysis",
"status": "Running",
"progress": 67,
"priority": "High",
"startTime": "2024-01-20T11:18:00Z",
"estimatedCompletion": "2024-01-20T12:05:00Z",
"currentPhase": "Machine Learning Analysis",
"resourceUsage": {
"cpuUsage": 78,
"memoryUsage": "6.2 GB"
}
},
{
"operationId": "op-gg1e8400-e29b-41d4-a716-446655440000",
"operationType": "DataEnrichment",
"operationName": "Sales Data Processing",
"status": "Completed",
"progress": 100,
"priority": "Normal",
"startTime": "2024-01-20T10:45:00Z",
"endTime": "2024-01-20T11:10:00Z",
"duration": "25 minutes",
"recordsProcessed": 89420
}
],
"summary": {
"totalOperations": 47,
"running": 3,
"completed": 41,
"failed": 2,
"cancelled": 1
},
"page": 1,
"pageSize": 20,
"hasNextPage": true
}
```
## Cancel Async Operation
**DELETE** `/api/{tenantId}/{projectId}/async/operation/{operationId}`
Cancels a running or pending asynchronous operation. The operation will be stopped gracefully, preserving any completed work.
### Request Body (Optional)
```json
{
"reason": "User requested cancellation due to changed requirements",
"preservePartialResults": true,
"forceTermination": false,
"notifyCallbacks": true
}
```
### Response
```json
{
"operationId": "op-ff0e8400-e29b-41d4-a716-446655440000",
"status": "Cancelled",
"cancellationTime": "2024-01-20T11:42:00Z",
"reason": "User requested cancellation due to changed requirements",
"progressAtCancellation": 67,
"phaseAtCancellation": "Machine Learning Analysis",
"partialResults": {
"available": true,
"completedPhases": 2,
"downloadUrls": [
"https://api.mindzie.com/downloads/partial-results-ff0e8400.zip"
]
},
"resourcesReleased": {
"cpuUnits": 4,
"memoryGB": 8,
"costSaved": "$1.20"
},
"cancelledBy": "user123"
}
```
## Get Operation Results
**GET** `/api/{tenantId}/{projectId}/async/operation/{operationId}/results`
Retrieves the complete results of a finished asynchronous operation, including all generated outputs, reports, and downloadable artifacts.
### Query Parameters
| Parameter | Type | Description |
|-----------|------|-------------|
| `format` | string | Response format: summary, detailed, download (default: summary) |
| `includeArtifacts` | boolean | Include downloadable artifacts in response (default: true) |
| `phase` | string | Get results from specific phase only |
### Response
```json
{
"operationId": "op-ff0e8400-e29b-41d4-a716-446655440000",
"operationType": "ProcessMiningAnalysis",
"operationName": "Comprehensive Customer Journey Analysis",
"status": "Completed",
"completionTime": "2024-01-20T12:03:00Z",
"totalDuration": "45 minutes",
"success": true,
"summary": {
"recordsAnalyzed": 187248,
"processVariants": 347,
"anomaliesDetected": 23,
"modelsGenerated": 3,
"reportsCreated": 5,
"dataQualityScore": 94.7,
"overallConfidenceScore": 91.2
},
"phaseResults": [
{
"phaseName": "Data Loading & Validation",
"status": "Completed",
"results": {
"recordsLoaded": 187250,
"validRecords": 187248,
"dataQualityScore": 99.9,
"validationErrors": [
{
"type": "Missing Timestamp",
"count": 2,
"resolved": true
}
]
}
},
{
"phaseName": "Process Discovery",
"status": "Completed",
"results": {
"processModel": {
"activities": 52,
"transitions": 178,
"variants": 347,
"complexity": "Medium-High"
},
"performanceMetrics": {
"averageCycleTime": "4.2 hours",
"medianCycleTime": "3.1 hours",
"bottleneckActivities": ["Review Application", "Manager Approval"],
"efficiency": 78.3
}
}
},
{
"phaseName": "Machine Learning Analysis",
"status": "Completed",
"results": {
"anomalies": {
"detected": 23,
"highSeverity": 5,
"mediumSeverity": 12,
"lowSeverity": 6,
"falsePositiveRate": 0.03
},
"predictions": {
"cycleTimePrediction": {
"accuracy": 0.89,
"meanAbsoluteError": "0.3 hours"
},
"pathPrediction": {
"accuracy": 0.92,
"confidence": 0.87
}
},
"patterns": {
"frequentPatterns": 15,
"rarePatterns": 8,
"criticalPaths": 3
}
}
}
],
"artifacts": [
{
"name": "Process Mining Analysis Report",
"type": "Report",
"format": "PDF",
"size": "3.2 MB",
"downloadUrl": "https://api.mindzie.com/downloads/report-ff0e8400.pdf",
"description": "Comprehensive analysis report with insights and recommendations"
},
{
"name": "Process Model Visualization",
"type": "Visualization",
"format": "SVG",
"size": "890 KB",
"downloadUrl": "https://api.mindzie.com/downloads/process-map-ff0e8400.svg",
"description": "Interactive process flow diagram"
},
{
"name": "Anomaly Detection Results",
"type": "Dataset",
"format": "CSV",
"size": "1.8 MB",
"downloadUrl": "https://api.mindzie.com/downloads/anomalies-ff0e8400.csv",
"description": "Detailed anomaly analysis with severity scores"
},
{
"name": "Predictive Models",
"type": "Model",
"format": "PKL",
"size": "45.7 MB",
"downloadUrl": "https://api.mindzie.com/downloads/models-ff0e8400.zip",
"description": "Trained ML models for cycle time and path prediction"
}
],
"performance": {
"totalExecutionTime": "45 minutes",
"resourceUtilization": {
"averageCpuUsage": 72,
"peakMemoryUsage": "7.8 GB",
"totalCpuHours": 3.0,
"totalCost": "$2.31"
},
"throughput": "4161 records/minute",
"efficiency": 87.2
},
"recommendations": [
{
"category": "Process Optimization",
"priority": "High",
"recommendation": "Focus on reducing wait times in 'Manager Approval' activity",
"expectedImprovement": "25% reduction in overall cycle time"
},
{
"category": "Data Quality",
"priority": "Medium",
"recommendation": "Implement automated timestamp validation",
"expectedImprovement": "Improved data quality score to 99.5%"
}
]
}
```
## Register Webhook
**POST** `/api/{tenantId}/{projectId}/async/webhooks`
Registers a webhook endpoint to receive real-time notifications about asynchronous operations. Supports multiple event types and custom filtering.
### Request Body
```json
{
"webhookUrl": "https://your-app.com/webhooks/async-operations",
"webhookName": "Main Operations Webhook",
"events": [
"operation.started",
"operation.progress",
"operation.phase.completed",
"operation.completed",
"operation.failed",
"operation.cancelled"
],
"filters": {
"operationTypes": ["ProcessMiningAnalysis", "DataEnrichment"],
"priorities": ["High", "Critical"],
"minProgressIncrement": 10
},
"authentication": {
"type": "hmac-sha256",
"secret": "your-webhook-secret-key"
},
"retryPolicy": {
"maxRetries": 5,
"retryDelay": 60,
"backoffMultiplier": 2.0,
"maxDelay": 3600
},
"headers": {
"X-Source": "mindzie-api",
"X-Environment": "production"
}
}
```
### Response
```json
{
"webhookId": "wh-123e8400-e29b-41d4-a716-446655440000",
"webhookUrl": "https://your-app.com/webhooks/async-operations",
"webhookName": "Main Operations Webhook",
"status": "Active",
"eventsSubscribed": [
"operation.started",
"operation.progress",
"operation.phase.completed",
"operation.completed",
"operation.failed",
"operation.cancelled"
],
"filters": {
"operationTypes": ["ProcessMiningAnalysis", "DataEnrichment"],
"priorities": ["High", "Critical"],
"minProgressIncrement": 10
},
"createdAt": "2024-01-20T11:45:00Z",
"lastDelivery": null,
"deliveryStats": {
"totalDeliveries": 0,
"successfulDeliveries": 0,
"failedDeliveries": 0,
"averageResponseTime": null
}
}
```
## Retry Failed Operation
**POST** `/api/{tenantId}/{projectId}/async/operation/{operationId}/retry`
Retries a failed asynchronous operation with optional parameter modifications. Can resume from the point of failure or restart completely.
### Request Body
```json
{
"retryMode": "resume",
"retryReason": "Infrastructure issue resolved, retrying with increased resources",
"modifyParameters": true,
"updatedParameters": {
"algorithmSettings": {
"useAdvancedML": true,
"enableAnomalyDetection": true,
"performanceOptimization": "high_throughput"
},
"resourceAllocation": {
"cpuUnits": 6,
"memoryGB": 12,
"priority": "Critical"
}
},
"retryPolicy": {
"maxRetries": 2,
"retryDelay": 180,
"backoffMultiplier": 1.5
},
"newTimeout": 10800,
"preserveOriginalResults": true
}
```
### Response
```json
{
"originalOperationId": "op-ff0e8400-e29b-41d4-a716-446655440000",
"newOperationId": "op-retry-ff0e8400-e29b-41d4-a716-446655440000",
"retryMode": "resume",
"retryNumber": 1,
"resumeFromPhase": "Machine Learning Analysis",
"status": "Initiated",
"estimatedDuration": "20-25 minutes",
"estimatedCompletion": "2024-01-20T12:30:00Z",
"preservedResults": {
"phasesPreserved": 2,
"recordsProcessed": 187248,
"progressSaved": 45
},
"resourcesAllocated": {
"cpuUnits": 6,
"memoryGB": 12,
"estimatedCost": "$3.20"
},
"retryAttemptDate": "2024-01-20T12:05:00Z"
}
```
## Submit Batch Operations
**POST** `/api/{tenantId}/{projectId}/async/batch`
Submits multiple asynchronous operations as a batch with dependencies and coordination. Useful for complex workflows requiring multiple interconnected operations.
### Request Body
```json
{
"batchName": "Monthly Process Mining Pipeline",
"batchDescription": "Complete monthly analysis workflow with multiple datasets",
"operations": [
{
"operationName": "Data Preparation",
"operationType": "DataEnrichment",
"priority": "High",
"operationKey": "data-prep",
"parameters": {
"datasetId": "dataset-1",
"cleaningRules": ["remove_duplicates", "fix_timestamps"],
"outputFormat": "processed_csv"
}
},
{
"operationName": "Process Discovery",
"operationType": "ProcessMiningAnalysis",
"priority": "High",
"operationKey": "discovery",
"dependencies": ["data-prep"],
"parameters": {
"algorithm": "alpha_miner_enhanced",
"enableVariantAnalysis": true
}
},
{
"operationName": "Performance Analysis",
"operationType": "ProcessMiningAnalysis",
"priority": "Normal",
"operationKey": "performance",
"dependencies": ["discovery"],
"parameters": {
"enableBottleneckDetection": true,
"generateOptimizationRecommendations": true
}
}
],
"batchCallbacks": {
"onBatchStart": "https://your-app.com/webhooks/batch-start",
"onOperationComplete": "https://your-app.com/webhooks/operation-complete",
"onBatchComplete": "https://your-app.com/webhooks/batch-complete"
},
"failurePolicy": {
"stopOnFirstFailure": false,
"continueIndependentOperations": true,
"retryFailedOperations": true
}
}
```
### Response
```json
{
"batchId": "batch-567e8400-e29b-41d4-a716-446655440000",
"batchName": "Monthly Process Mining Pipeline",
"status": "Initiated",
"operations": [
{
"operationKey": "data-prep",
"operationId": "op-prep-890e8400-e29b-41d4-a716-446655440000",
"status": "Running",
"dependencies": [],
"estimatedDuration": "15 minutes"
},
{
"operationKey": "discovery",
"operationId": "op-disc-901e8400-e29b-41d4-a716-446655440000",
"status": "Pending",
"dependencies": ["data-prep"],
"estimatedStartTime": "2024-01-20T12:20:00Z"
},
{
"operationKey": "performance",
"operationId": "op-perf-012e8400-e29b-41d4-a716-446655440000",
"status": "Pending",
"dependencies": ["discovery"],
"estimatedStartTime": "2024-01-20T12:45:00Z"
}
],
"totalOperations": 3,
"estimatedBatchDuration": "75-90 minutes",
"estimatedBatchCompletion": "2024-01-20T13:45:00Z",
"batchStartTime": "2024-01-20T12:05:00Z",
"trackingUrl": "/api/{tenantId}/{projectId}/async/batch/batch-567e8400-e29b-41d4-a716-446655440000"
}
```
## Example: Complete Async Operation Workflow
This example demonstrates the full lifecycle of asynchronous operations:
```javascript
// 1. Register webhook for real-time notifications
const registerWebhook = async () => {
const response = await fetch('/api/{tenantId}/{projectId}/async/webhooks', {
method: 'POST',
headers: {
'Content-Type': 'application/json',
'Authorization': `Bearer ${token}`
},
body: JSON.stringify({
webhookUrl: 'https://your-app.com/webhooks/async-operations',
webhookName: 'Process Mining Webhook',
events: [
'operation.started',
'operation.progress',
'operation.completed',
'operation.failed'
],
filters: {
operationTypes: ['ProcessMiningAnalysis'],
priorities: ['High', 'Critical'],
minProgressIncrement: 15
},
authentication: {
type: 'hmac-sha256',
secret: 'your-secret-key'
}
})
});
return await response.json();
};
// 2. Start a complex async operation
const startAsyncAnalysis = async () => {
const response = await fetch('/api/{tenantId}/{projectId}/async/operation', {
method: 'POST',
headers: {
'Content-Type': 'application/json',
'Authorization': `Bearer ${token}`
},
body: JSON.stringify({
operationType: 'ProcessMiningAnalysis',
operationName: 'Advanced Customer Journey Analysis',
operationDescription: 'Deep ML-powered analysis with anomaly detection',
priority: 'High',
parameters: {
datasetId: '880e8400-e29b-41d4-a716-446655440000',
analysisType: 'comprehensive',
timeWindow: {
startDate: '2024-01-01',
endDate: '2024-01-31'
},
algorithmSettings: {
useAdvancedML: true,
enableAnomalyDetection: true,
performanceOptimization: 'high_accuracy'
},
outputOptions: {
generateReports: true,
createVisualizations: true,
exportFormats: ['PDF', 'CSV', 'JSON']
}
},
callbacks: {
onProgress: 'https://your-app.com/webhooks/progress',
onCompletion: 'https://your-app.com/webhooks/completion',
onError: 'https://your-app.com/webhooks/error'
},
notifications: {
email: ['analyst@company.com'],
slack: {
channel: '#process-mining',
mentionUsers: ['@analyst']
}
},
timeout: 7200
})
});
return await response.json();
};
// 3. Monitor operation progress
const monitorOperation = async (operationId) => {
const checkStatus = async () => {
const response = await fetch(`/api/{tenantId}/{projectId}/async/operation/${operationId}`, {
headers: {
'Authorization': `Bearer ${token}`
}
});
const operation = await response.json();
console.log(`Operation ${operationId}: ${operation.status} (${operation.progress.percentage}%)`);
console.log(`Current phase: ${operation.progress.currentPhase}`);
console.log(`ETA: ${operation.progress.estimatedCompletion}`);
if (operation.status === 'Running') {
setTimeout(() => checkStatus(), 60000); // Check every minute
} else if (operation.status === 'Completed') {
console.log('Operation completed successfully!');
await getOperationResults(operationId);
} else if (operation.status === 'Failed') {
console.log('Operation failed, attempting retry...');
await retryOperation(operationId);
}
};
await checkStatus();
};
// 4. Get operation results
const getOperationResults = async (operationId) => {
const response = await fetch(`/api/{tenantId}/{projectId}/async/operation/${operationId}/results?format=detailed&includeArtifacts=true`, {
headers: {
'Authorization': `Bearer ${token}`
}
});
const results = await response.json();
console.log('Operation Results:', results.summary);
console.log('Generated Artifacts:');
results.artifacts.forEach(artifact => {
console.log(`- ${artifact.name} (${artifact.format}): ${artifact.downloadUrl}`);
});
return results;
};
// 5. Retry failed operation
const retryOperation = async (operationId) => {
const response = await fetch(`/api/{tenantId}/{projectId}/async/operation/${operationId}/retry`, {
method: 'POST',
headers: {
'Content-Type': 'application/json',
'Authorization': `Bearer ${token}`
},
body: JSON.stringify({
retryMode: 'resume',
retryReason: 'Automatic retry with increased resources',
modifyParameters: true,
updatedParameters: {
resourceAllocation: {
cpuUnits: 6,
memoryGB: 12,
priority: 'Critical'
}
},
newTimeout: 10800
})
});
const retryResult = await response.json();
console.log(`Retry operation started: ${retryResult.newOperationId}`);
// Monitor the retry operation
await monitorOperation(retryResult.newOperationId);
return retryResult;
};
// 6. Submit batch operations
const submitBatchOperations = async () => {
const response = await fetch('/api/{tenantId}/{projectId}/async/batch', {
method: 'POST',
headers: {
'Content-Type': 'application/json',
'Authorization': `Bearer ${token}`
},
body: JSON.stringify({
batchName: 'Complete Process Mining Pipeline',
batchDescription: 'End-to-end analysis with data prep and reporting',
operations: [
{
operationName: 'Data Cleaning',
operationType: 'DataEnrichment',
priority: 'High',
operationKey: 'clean',
parameters: {
datasetId: 'raw-dataset-123',
cleaningRules: ['remove_duplicates', 'fix_timestamps', 'validate_activities']
}
},
{
operationName: 'Process Analysis',
operationType: 'ProcessMiningAnalysis',
priority: 'High',
operationKey: 'analyze',
dependencies: ['clean'],
parameters: {
analysisType: 'comprehensive',
enableML: true,
generateInsights: true
}
},
{
operationName: 'Report Generation',
operationType: 'ReportGeneration',
priority: 'Normal',
operationKey: 'report',
dependencies: ['analyze'],
parameters: {
reportType: 'executive_summary',
includeVisualizations: true,
exportFormats: ['PDF', 'PowerPoint']
}
}
],
failurePolicy: {
stopOnFirstFailure: false,
continueIndependentOperations: true,
retryFailedOperations: true
}
})
});
return await response.json();
};
// Execute complete async workflow
const runAsyncWorkflow = async () => {
try {
console.log('Starting async operation workflow...');
// Register webhook
const webhook = await registerWebhook();
console.log(`Webhook registered: ${webhook.webhookId}`);
// Start operation
const operation = await startAsyncAnalysis();
console.log(`Operation started: ${operation.operationId}`);
console.log(`Estimated completion: ${operation.estimatedCompletion}`);
// Monitor progress
await monitorOperation(operation.operationId);
} catch (error) {
console.error('Async workflow failed:', error);
}
};
// Start the workflow
runAsyncWorkflow();
```
## Python Example
```python
import requests
import time
import json
import hmac
import hashlib
from datetime import datetime, timedelta
class AsyncOperationManager:
def __init__(self, base_url, tenant_id, project_id, token):
self.base_url = base_url
self.tenant_id = tenant_id
self.project_id = project_id
self.headers = {
'Authorization': f'Bearer {token}',
'Content-Type': 'application/json'
}
def start_operation(self, operation_type, name, parameters, priority='Normal', timeout=3600):
"""Start an asynchronous operation"""
url = f"{self.base_url}/api/{self.tenant_id}/{self.project_id}/async/operation"
payload = {
'operationType': operation_type,
'operationName': name,
'priority': priority,
'parameters': parameters,
'timeout': timeout,
'callbacks': {
'onProgress': 'https://your-app.com/webhooks/progress',
'onCompletion': 'https://your-app.com/webhooks/completion',
'onError': 'https://your-app.com/webhooks/error'
}
}
response = requests.post(url, json=payload, headers=self.headers)
return response.json()
def get_operation_status(self, operation_id):
"""Get current operation status"""
url = f"{self.base_url}/api/{self.tenant_id}/{self.project_id}/async/operation/{operation_id}"
response = requests.get(url, headers=self.headers)
return response.json()
def list_operations(self, status=None, operation_type=None, page=1, page_size=20):
"""List async operations with filtering"""
url = f"{self.base_url}/api/{self.tenant_id}/{self.project_id}/async/operations"
params = {'page': page, 'pageSize': page_size}
if status:
params['status'] = status
if operation_type:
params['operationType'] = operation_type
response = requests.get(url, params=params, headers=self.headers)
return response.json()
def cancel_operation(self, operation_id, reason="User cancellation"):
"""Cancel a running operation"""
url = f"{self.base_url}/api/{self.tenant_id}/{self.project_id}/async/operation/{operation_id}"
payload = {
'reason': reason,
'preservePartialResults': True,
'notifyCallbacks': True
}
response = requests.delete(url, json=payload, headers=self.headers)
return response.json()
def get_operation_results(self, operation_id, format_type='detailed', include_artifacts=True):
"""Get operation results"""
url = f"{self.base_url}/api/{self.tenant_id}/{self.project_id}/async/operation/{operation_id}/results"
params = {
'format': format_type,
'includeArtifacts': str(include_artifacts).lower()
}
response = requests.get(url, params=params, headers=self.headers)
return response.json()
def retry_operation(self, operation_id, retry_mode='resume', updated_params=None):
"""Retry a failed operation"""
url = f"{self.base_url}/api/{self.tenant_id}/{self.project_id}/async/operation/{operation_id}/retry"
payload = {
'retryMode': retry_mode,
'retryReason': 'Automatic retry with optimization',
'modifyParameters': updated_params is not None
}
if updated_params:
payload['updatedParameters'] = updated_params
response = requests.post(url, json=payload, headers=self.headers)
return response.json()
def register_webhook(self, webhook_url, events, filters=None):
"""Register webhook for operation notifications"""
url = f"{self.base_url}/api/{self.tenant_id}/{self.project_id}/async/webhooks"
payload = {
'webhookUrl': webhook_url,
'webhookName': 'Python SDK Webhook',
'events': events,
'filters': filters or {},
'authentication': {
'type': 'hmac-sha256',
'secret': 'your-webhook-secret'
}
}
response = requests.post(url, json=payload, headers=self.headers)
return response.json()
def submit_batch_operations(self, batch_name, operations, failure_policy=None):
"""Submit multiple operations as a batch"""
url = f"{self.base_url}/api/{self.tenant_id}/{self.project_id}/async/batch"
payload = {
'batchName': batch_name,
'operations': operations,
'failurePolicy': failure_policy or {
'stopOnFirstFailure': False,
'continueIndependentOperations': True,
'retryFailedOperations': True
}
}
response = requests.post(url, json=payload, headers=self.headers)
return response.json()
def wait_for_completion(self, operation_id, check_interval=60, timeout=7200):
"""Wait for operation to complete with periodic status checks"""
start_time = time.time()
while time.time() - start_time < timeout:
operation = self.get_operation_status(operation_id)
status = operation['status']
progress = operation['progress']['percentage']
print(f"Operation {operation_id}: {status} ({progress}%)")
if operation['progress']['currentPhase']:
print(f" Current phase: {operation['progress']['currentPhase']}")
if status == 'Completed':
print("Operation completed successfully!")
return operation
elif status in ['Failed', 'Cancelled', 'Timeout']:
print(f"Operation ended with status: {status}")
return operation
time.sleep(check_interval)
raise TimeoutError(f"Operation {operation_id} did not complete within {timeout} seconds")
def verify_webhook_signature(self, payload, signature, secret):
"""Verify webhook signature for security"""
expected_signature = hmac.new(
secret.encode('utf-8'),
payload.encode('utf-8'),
hashlib.sha256
).hexdigest()
return hmac.compare_digest(signature, f"sha256={expected_signature}")
# Usage example
manager = AsyncOperationManager(
'https://your-mindzie-instance.com',
'tenant-guid',
'project-guid',
'your-auth-token'
)
try:
# Register webhook for notifications
webhook = manager.register_webhook(
'https://your-app.com/webhooks/async',
['operation.started', 'operation.progress', 'operation.completed', 'operation.failed'],
{'operationTypes': ['ProcessMiningAnalysis'], 'priorities': ['High', 'Critical']}
)
print(f"Webhook registered: {webhook['webhookId']}")
# Start comprehensive process mining operation
operation_params = {
'datasetId': 'dataset-guid',
'analysisType': 'comprehensive',
'timeWindow': {
'startDate': '2024-01-01',
'endDate': '2024-01-31'
},
'algorithmSettings': {
'useAdvancedML': True,
'enableAnomalyDetection': True,
'performanceOptimization': 'high_accuracy'
},
'outputOptions': {
'generateReports': True,
'createVisualizations': True,
'exportFormats': ['PDF', 'CSV', 'JSON']
}
}
operation = manager.start_operation(
'ProcessMiningAnalysis',
'Advanced Customer Journey Analysis',
operation_params,
'High',
7200
)
print(f"Operation started: {operation['operationId']}")
print(f"Estimated duration: {operation['estimatedDuration']}")
print(f"Estimated completion: {operation['estimatedCompletion']}")
# Wait for completion
final_operation = manager.wait_for_completion(operation['operationId'])
if final_operation['status'] == 'Completed':
# Get detailed results
results = manager.get_operation_results(operation['operationId'])
print("Operation completed successfully!")
print(f"Records analyzed: {results['summary']['recordsAnalyzed']:,}")
print(f"Process variants: {results['summary']['processVariants']}")
print(f"Anomalies detected: {results['summary']['anomaliesDetected']}")
print(f"Data quality score: {results['summary']['dataQualityScore']}")
print("\nGenerated artifacts:")
for artifact in results['artifacts']:
print(f"- {artifact['name']} ({artifact['format']}): {artifact['downloadUrl']}")
print("\nRecommendations:")
for rec in results['recommendations']:
print(f"- {rec['category']} ({rec['priority']}): {rec['recommendation']}")
else:
print(f"Operation failed with status: {final_operation['status']}")
# Try to retry if failed
if final_operation['status'] == 'Failed':
print("Attempting to retry operation...")
retry_result = manager.retry_operation(
operation['operationId'],
'resume',
{'resourceAllocation': {'cpuUnits': 6, 'memoryGB': 12}}
)
print(f"Retry operation started: {retry_result['newOperationId']}")
except Exception as e:
print(f"Error in async operation workflow: {e}")
```
---
## Queue
Section: Execution
URL: https://docs.mindziestudio.com/mindzie_api/execution/queue
Source: /docs-master/mindzieAPI/execution/queue/page.md
# Job Queue
Manage Execution Queue
View and manage the job execution queue, set priorities, and control job scheduling.
## Get Queue Status
**GET** `/api/{tenantId}/{projectId}/execution/queue`
Retrieves the current status of the execution queue including queued jobs, their priorities, and estimated processing times.
### Parameters
| Parameter | Type | Location | Description |
|-----------|------|----------|-------------|
| `tenantId` | GUID | Path | The tenant identifier |
| `projectId` | GUID | Path | The project identifier |
### Query Parameters
| Parameter | Type | Description |
|-----------|------|-------------|
| `priority` | string | Filter by priority: Critical, High, Normal, Low |
| `jobType` | string | Filter by job type: ProcessMining, DataEnrichment, Notebook, Analysis |
| `includeEstimates` | boolean | Include detailed timing estimates (default: true) |
### Response
```json
{
"queueStatus": "Active",
"timestamp": "2024-01-20T10:45:00Z",
"summary": {
"totalQueuedJobs": 23,
"criticalPriorityJobs": 2,
"highPriorityJobs": 7,
"normalPriorityJobs": 12,
"lowPriorityJobs": 2,
"averageWaitTime": "8.5 minutes",
"estimatedProcessingTime": "47 minutes"
},
"processingCapacity": {
"activeWorkers": 4,
"totalWorkers": 6,
"currentLoad": 67,
"maxConcurrentJobs": 8,
"currentlyRunning": 3
},
"queuedJobs": [
{
"jobId": "ff0e8400-e29b-41d4-a716-446655440000",
"jobName": "Customer Analytics Pipeline",
"jobType": "ProcessMining",
"priority": "Critical",
"queuePosition": 1,
"estimatedStartTime": "2024-01-20T10:47:00Z",
"estimatedDuration": "12-15 minutes",
"submittedBy": "user456",
"dateSubmitted": "2024-01-20T10:44:00Z",
"resourceRequirements": {
"cpuUnits": 2,
"memoryGB": 4,
"estimatedDiskUsage": "1.2 GB"
}
},
{
"jobId": "00fe8400-e29b-41d4-a716-446655440000",
"jobName": "Daily Sales Analysis",
"jobType": "DataEnrichment",
"priority": "High",
"queuePosition": 2,
"estimatedStartTime": "2024-01-20T11:02:00Z",
"estimatedDuration": "8-10 minutes",
"submittedBy": "system",
"dateSubmitted": "2024-01-20T10:30:00Z",
"resourceRequirements": {
"cpuUnits": 1,
"memoryGB": 2,
"estimatedDiskUsage": "500 MB"
}
}
],
"performanceMetrics": {
"averageJobDuration": "16.3 minutes",
"throughputLastHour": 12,
"queueTrends": {
"currentHourSubmissions": 8,
"peakHourToday": "09:00-10:00",
"averageQueueSize": 15.7
}
}
}
```
## Get Jobs by Priority
**GET** `/api/{tenantId}/{projectId}/execution/queue/priority/{priority}`
Retrieves jobs in the queue filtered by specific priority level with detailed position and timing information.
### Parameters
| Parameter | Type | Location | Description |
|-----------|------|----------|-------------|
| `priority` | string | Path | Priority level: Critical, High, Normal, Low |
### Response
```json
{
"priority": "High",
"jobCount": 7,
"averageWaitTime": "6.2 minutes",
"estimatedProcessingTime": "31 minutes",
"jobs": [
{
"jobId": "00fe8400-e29b-41d4-a716-446655440000",
"jobName": "Daily Sales Analysis",
"jobType": "DataEnrichment",
"queuePosition": 2,
"overallQueuePosition": 3,
"estimatedStartTime": "2024-01-20T11:02:00Z",
"estimatedCompletion": "2024-01-20T11:12:00Z",
"submittedBy": "system",
"dateSubmitted": "2024-01-20T10:30:00Z",
"waitTime": "15 minutes",
"dependencies": [],
"resourceRequirements": {
"cpuUnits": 1,
"memoryGB": 2,
"estimatedDiskUsage": "500 MB"
}
}
]
}
```
## Change Job Priority
**PUT** `/api/{tenantId}/{projectId}/execution/queue/job/{jobId}/priority`
Updates the priority of a queued job, which may change its position in the queue and estimated start time.
### Request Body
```json
{
"newPriority": "Critical",
"reason": "Business critical analysis required urgently",
"notifyUser": true
}
```
### Response
```json
{
"jobId": "00fe8400-e29b-41d4-a716-446655440000",
"previousPriority": "High",
"newPriority": "Critical",
"previousQueuePosition": 3,
"newQueuePosition": 1,
"previousEstimatedStart": "2024-01-20T11:02:00Z",
"newEstimatedStart": "2024-01-20T10:47:00Z",
"timeSaved": "15 minutes",
"updatedBy": "user123",
"updateTime": "2024-01-20T10:46:00Z"
}
```
## Move Job Position
**PUT** `/api/{tenantId}/{projectId}/execution/queue/job/{jobId}/position`
Manually adjusts a job's position within its priority tier. Position changes are limited to the same priority level.
### Request Body
```json
{
"newPosition": 1,
"reason": "Dependencies resolved, can execute earlier",
"respectPriorityBoundaries": true
}
```
### Response
```json
{
"jobId": "00fe8400-e29b-41d4-a716-446655440000",
"priority": "High",
"previousPosition": 3,
"newPosition": 1,
"previousEstimatedStart": "2024-01-20T11:02:00Z",
"newEstimatedStart": "2024-01-20T10:55:00Z",
"affectedJobs": [
{
"jobId": "11fe8400-e29b-41d4-a716-446655440000",
"newPosition": 2,
"newEstimatedStart": "2024-01-20T11:05:00Z"
}
],
"updateTime": "2024-01-20T10:46:00Z"
}
```
## Control Queue Processing
**POST** `/api/{tenantId}/{projectId}/execution/queue/control`
Pauses or resumes queue processing for maintenance or emergency situations. Running jobs continue but no new jobs will start when paused.
### Request Body
```json
{
"action": "pause",
"reason": "System maintenance window",
"duration": 30,
"allowRunningJobsToComplete": true,
"notifyUsers": true,
"scheduledResume": "2024-01-20T12:00:00Z"
}
```
### Response
```json
{
"action": "pause",
"status": "Paused",
"pausedAt": "2024-01-20T10:47:00Z",
"scheduledResume": "2024-01-20T12:00:00Z",
"affectedJobs": 23,
"runningJobsCount": 3,
"estimatedDelayMinutes": 30,
"reason": "System maintenance window",
"pausedBy": "admin123"
}
```
## Get Queue History
**GET** `/api/{tenantId}/{projectId}/execution/queue/history`
Retrieves historical queue performance data and metrics for analysis and optimization purposes.
### Query Parameters
| Parameter | Type | Description |
|-----------|------|-------------|
| `dateFrom` | datetime | Start date for historical data |
| `dateTo` | datetime | End date for historical data |
| `aggregation` | string | Data aggregation level: hour, day, week (default: hour) |
| `metrics` | string | Comma-separated metrics: queue_size, wait_time, throughput, efficiency |
### Response
```json
{
"period": {
"startDate": "2024-01-19T00:00:00Z",
"endDate": "2024-01-20T10:47:00Z",
"aggregation": "hour"
},
"summary": {
"totalJobsProcessed": 847,
"averageQueueSize": 12.3,
"averageWaitTime": "7.8 minutes",
"peakQueueSize": 45,
"peakWaitTime": "23 minutes",
"throughputPerHour": 24.8,
"efficiency": 87.2
},
"hourlyData": [
{
"timestamp": "2024-01-20T09:00:00Z",
"queueSize": {
"average": 18,
"peak": 25,
"minimum": 8
},
"waitTime": {
"average": "9.5 minutes",
"maximum": "18 minutes",
"minimum": "2 minutes"
},
"throughput": {
"jobsCompleted": 28,
"jobsSubmitted": 31,
"efficiency": 89.3
},
"priorityDistribution": {
"critical": 2,
"high": 8,
"normal": 14,
"low": 1
}
}
],
"trends": {
"queueSizeGrowth": -2.3,
"waitTimeImprovement": 5.7,
"throughputIncrease": 12.1,
"efficiencyChange": 3.4
},
"bottlenecks": [
{
"timeframe": "2024-01-20T08:30:00Z - 2024-01-20T09:15:00Z",
"issue": "High memory usage jobs accumulated",
"impact": "15 minute delay",
"resolution": "Additional worker allocated"
}
]
}
```
## Cancel User's Queued Jobs
**DELETE** `/api/{tenantId}/{projectId}/execution/queue/user/{userId}`
Cancels all queued jobs submitted by a specific user. Running jobs by the user will continue to completion.
### Request Body (Optional)
```json
{
"reason": "User account deactivated",
"notifyUser": false,
"cancelJobTypes": ["ProcessMining", "DataEnrichment"],
"excludeJobIds": ["important-job-id-1", "important-job-id-2"]
}
```
### Response
```json
{
"userId": "user123",
"cancelledJobsCount": 5,
"preservedJobsCount": 2,
"cancelledJobs": [
{
"jobId": "job1-guid",
"jobName": "Weekly Analysis",
"priority": "Normal",
"queuePosition": 8
}
],
"preservedJobs": [
{
"jobId": "important-job-id-1",
"jobName": "Critical Business Report",
"reason": "Explicitly excluded"
}
],
"cancelledAt": "2024-01-20T10:47:00Z",
"cancelledBy": "admin123"
}
```
## Get Queue Predictions
**GET** `/api/{tenantId}/{projectId}/execution/queue/predictions`
Provides AI-powered predictions for queue behavior, optimal submission times, and resource allocation recommendations.
### Query Parameters
| Parameter | Type | Description |
|-----------|------|-------------|
| `horizon` | integer | Prediction horizon in hours (1-24, default: 4) |
| `jobType` | string | Predict for specific job type |
| `includeRecommendations` | boolean | Include optimization recommendations (default: true) |
### Response
```json
{
"predictionTime": "2024-01-20T10:47:00Z",
"horizon": 4,
"predictions": {
"queueSizeProjection": [
{
"time": "2024-01-20T11:00:00Z",
"expectedQueueSize": 18,
"confidence": 0.87
},
{
"time": "2024-01-20T12:00:00Z",
"expectedQueueSize": 12,
"confidence": 0.82
}
],
"waitTimeProjection": [
{
"time": "2024-01-20T11:00:00Z",
"averageWaitTime": "6.5 minutes",
"confidence": 0.85
}
],
"resourceUtilization": [
{
"time": "2024-01-20T11:00:00Z",
"cpuUtilization": 78,
"memoryUtilization": 65,
"efficiency": 89.2
}
]
},
"recommendations": {
"optimalSubmissionTimes": [
{
"timeWindow": "2024-01-20T13:00:00Z - 2024-01-20T15:00:00Z",
"expectedWaitTime": "3-5 minutes",
"reason": "Low queue activity period"
}
],
"resourceOptimization": [
{
"recommendation": "Add 1 additional worker node",
"expectedImprovement": "25% reduction in wait times",
"cost": "Low",
"priority": "Medium"
}
],
"jobScheduling": [
{
"jobType": "ProcessMining",
"recommendation": "Schedule during off-peak hours (14:00-16:00)",
"reason": "Memory-intensive jobs perform better with less contention"
}
]
},
"modelInfo": {
"modelVersion": "2.1.3",
"lastTrained": "2024-01-19T02:00:00Z",
"accuracy": 0.84,
"dataPoints": 10080
}
}
```
## Example: Queue Management Workflow
This example demonstrates monitoring and managing the job queue:
```javascript
// 1. Get current queue status
const getQueueStatus = async () => {
const response = await fetch('/api/{tenantId}/{projectId}/execution/queue?includeEstimates=true', {
headers: {
'Authorization': `Bearer ${token}`
}
});
const queue = await response.json();
console.log(`Queue Status: ${queue.queueStatus}`);
console.log(`Total jobs: ${queue.summary.totalQueuedJobs}`);
console.log(`Average wait time: ${queue.summary.averageWaitTime}`);
return queue;
};
// 2. Change job priority if needed
const updateJobPriority = async (jobId, newPriority, reason) => {
const response = await fetch(`/api/{tenantId}/{projectId}/execution/queue/job/${jobId}/priority`, {
method: 'PUT',
headers: {
'Content-Type': 'application/json',
'Authorization': `Bearer ${token}`
},
body: JSON.stringify({
newPriority: newPriority,
reason: reason,
notifyUser: true
})
});
const result = await response.json();
console.log(`Job ${jobId} priority changed from ${result.previousPriority} to ${result.newPriority}`);
console.log(`New position: ${result.newQueuePosition} (was ${result.previousQueuePosition})`);
console.log(`Time saved: ${result.timeSaved}`);
return result;
};
// 3. Get queue predictions for optimization
const getQueuePredictions = async () => {
const response = await fetch('/api/{tenantId}/{projectId}/execution/queue/predictions?horizon=4&includeRecommendations=true', {
headers: {
'Authorization': `Bearer ${token}`
}
});
const predictions = await response.json();
console.log('Queue Predictions:');
predictions.predictions.queueSizeProjection.forEach(prediction => {
console.log(` ${prediction.time}: ${prediction.expectedQueueSize} jobs (${Math.round(prediction.confidence * 100)}% confidence)`);
});
console.log('Recommendations:');
predictions.recommendations.optimalSubmissionTimes.forEach(rec => {
console.log(` Submit during: ${rec.timeWindow} (${rec.expectedWaitTime} wait)`);
});
return predictions;
};
// 4. Monitor queue for specific job
const monitorJobInQueue = async (jobId) => {
const checkQueue = async () => {
const queue = await getQueueStatus();
const job = queue.queuedJobs.find(j => j.jobId === jobId);
if (job) {
console.log(`Job ${jobId} is at position ${job.queuePosition}`);
console.log(`Estimated start: ${job.estimatedStartTime}`);
console.log(`Estimated duration: ${job.estimatedDuration}`);
// Check again in 2 minutes
setTimeout(() => checkQueue(), 120000);
} else {
console.log(`Job ${jobId} is no longer in queue (likely started or cancelled)`);
}
};
await checkQueue();
};
// 5. Emergency queue management
const pauseQueue = async (reason, duration) => {
const response = await fetch('/api/{tenantId}/{projectId}/execution/queue/control', {
method: 'POST',
headers: {
'Content-Type': 'application/json',
'Authorization': `Bearer ${token}`
},
body: JSON.stringify({
action: 'pause',
reason: reason,
duration: duration,
allowRunningJobsToComplete: true,
notifyUsers: true
})
});
const result = await response.json();
console.log(`Queue paused: ${result.status}`);
console.log(`${result.affectedJobs} jobs affected`);
console.log(`Estimated delay: ${result.estimatedDelayMinutes} minutes`);
return result;
};
// Execute queue management workflow
getQueueStatus()
.then(queue => {
console.log('Current queue status retrieved');
// Check if queue is getting long
if (queue.summary.totalQueuedJobs > 30) {
console.log('Queue is getting long, checking predictions...');
return getQueuePredictions();
}
return null;
})
.then(predictions => {
if (predictions) {
console.log('Queue predictions retrieved');
// If predictions show continued growth, consider resource optimization
const futureQueueSize = predictions.predictions.queueSizeProjection[predictions.predictions.queueSizeProjection.length - 1];
if (futureQueueSize.expectedQueueSize > 25) {
console.log('Consider implementing resource optimization recommendations');
predictions.recommendations.resourceOptimization.forEach(rec => {
console.log(`- ${rec.recommendation}: ${rec.expectedImprovement}`);
});
}
}
})
.catch(error => console.error('Queue management failed:', error));
```
## Python Example
```python
import requests
import time
import json
from datetime import datetime, timedelta
class QueueManager:
def __init__(self, base_url, tenant_id, project_id, token):
self.base_url = base_url
self.tenant_id = tenant_id
self.project_id = project_id
self.headers = {
'Authorization': f'Bearer {token}',
'Content-Type': 'application/json'
}
def get_queue_status(self, priority=None, job_type=None, include_estimates=True):
"""Get current queue status"""
url = f"{self.base_url}/api/{self.tenant_id}/{self.project_id}/execution/queue"
params = {'includeEstimates': str(include_estimates).lower()}
if priority:
params['priority'] = priority
if job_type:
params['jobType'] = job_type
response = requests.get(url, params=params, headers=self.headers)
return response.json()
def get_jobs_by_priority(self, priority):
"""Get jobs filtered by priority level"""
url = f"{self.base_url}/api/{self.tenant_id}/{self.project_id}/execution/queue/priority/{priority}"
response = requests.get(url, headers=self.headers)
return response.json()
def change_job_priority(self, job_id, new_priority, reason, notify_user=True):
"""Change priority of a queued job"""
url = f"{self.base_url}/api/{self.tenant_id}/{self.project_id}/execution/queue/job/{job_id}/priority"
payload = {
'newPriority': new_priority,
'reason': reason,
'notifyUser': notify_user
}
response = requests.put(url, json=payload, headers=self.headers)
return response.json()
def move_job_position(self, job_id, new_position, reason):
"""Move job to new position within its priority tier"""
url = f"{self.base_url}/api/{self.tenant_id}/{self.project_id}/execution/queue/job/{job_id}/position"
payload = {
'newPosition': new_position,
'reason': reason,
'respectPriorityBoundaries': True
}
response = requests.put(url, json=payload, headers=self.headers)
return response.json()
def control_queue(self, action, reason, duration=None, scheduled_resume=None):
"""Pause or resume queue processing"""
url = f"{self.base_url}/api/{self.tenant_id}/{self.project_id}/execution/queue/control"
payload = {
'action': action,
'reason': reason,
'allowRunningJobsToComplete': True,
'notifyUsers': True
}
if duration:
payload['duration'] = duration
if scheduled_resume:
payload['scheduledResume'] = scheduled_resume.isoformat()
response = requests.post(url, json=payload, headers=self.headers)
return response.json()
def get_queue_history(self, date_from, date_to, aggregation='hour', metrics=None):
"""Get historical queue performance data"""
url = f"{self.base_url}/api/{self.tenant_id}/{self.project_id}/execution/queue/history"
params = {
'dateFrom': date_from.isoformat(),
'dateTo': date_to.isoformat(),
'aggregation': aggregation
}
if metrics:
params['metrics'] = ','.join(metrics)
response = requests.get(url, params=params, headers=self.headers)
return response.json()
def cancel_user_jobs(self, user_id, reason, job_types=None, exclude_job_ids=None):
"""Cancel all queued jobs for a specific user"""
url = f"{self.base_url}/api/{self.tenant_id}/{self.project_id}/execution/queue/user/{user_id}"
payload = {
'reason': reason,
'notifyUser': False
}
if job_types:
payload['cancelJobTypes'] = job_types
if exclude_job_ids:
payload['excludeJobIds'] = exclude_job_ids
response = requests.delete(url, json=payload, headers=self.headers)
return response.json()
def get_queue_predictions(self, horizon=4, job_type=None, include_recommendations=True):
"""Get AI-powered queue predictions"""
url = f"{self.base_url}/api/{self.tenant_id}/{self.project_id}/execution/queue/predictions"
params = {
'horizon': horizon,
'includeRecommendations': str(include_recommendations).lower()
}
if job_type:
params['jobType'] = job_type
response = requests.get(url, params=params, headers=self.headers)
return response.json()
def monitor_queue_health(self, alert_threshold=30, check_interval=300):
"""Continuously monitor queue health and alert on issues"""
while True:
try:
queue_status = self.get_queue_status()
total_jobs = queue_status['summary']['totalQueuedJobs']
avg_wait = queue_status['summary']['averageWaitTime']
print(f"Queue Health Check: {total_jobs} jobs, avg wait: {avg_wait}")
if total_jobs > alert_threshold:
print(f"ALERT: Queue size ({total_jobs}) exceeds threshold ({alert_threshold})")
# Get predictions to understand if this will improve
predictions = self.get_queue_predictions()
future_size = predictions['predictions']['queueSizeProjection'][-1]['expectedQueueSize']
if future_size > total_jobs:
print("WARNING: Queue expected to grow further")
print("Resource optimization recommendations:")
for rec in predictions['recommendations']['resourceOptimization']:
print(f" - {rec['recommendation']}: {rec['expectedImprovement']}")
time.sleep(check_interval)
except Exception as e:
print(f"Queue monitoring error: {e}")
time.sleep(60)
# Usage example
manager = QueueManager(
'https://your-mindzie-instance.com',
'tenant-guid',
'project-guid',
'your-auth-token'
)
try:
# Get comprehensive queue status
queue_status = manager.get_queue_status(include_estimates=True)
print(f"Queue Status: {queue_status['queueStatus']}")
print(f"Total jobs in queue: {queue_status['summary']['totalQueuedJobs']}")
print(f"Average wait time: {queue_status['summary']['averageWaitTime']}")
print(f"Processing capacity: {queue_status['processingCapacity']['currentLoad']}%")
# Check high priority jobs specifically
high_priority_jobs = manager.get_jobs_by_priority('High')
print(f"High priority jobs: {high_priority_jobs['jobCount']}")
# Get queue predictions for the next 4 hours
predictions = manager.get_queue_predictions(horizon=4)
print("Queue predictions:")
for pred in predictions['predictions']['queueSizeProjection']:
confidence_pct = round(pred['confidence'] * 100)
print(f" {pred['time']}: {pred['expectedQueueSize']} jobs ({confidence_pct}% confidence)")
# Check recommendations
if predictions['recommendations']['optimalSubmissionTimes']:
print("Optimal submission times:")
for rec in predictions['recommendations']['optimalSubmissionTimes']:
print(f" {rec['timeWindow']}: {rec['expectedWaitTime']} wait time")
# Example: Elevate a job priority if needed
if queue_status['summary']['totalQueuedJobs'] > 20:
# Find a normal priority job to elevate
normal_jobs = [job for job in queue_status['queuedJobs'] if job['priority'] == 'Normal']
if normal_jobs:
job_to_elevate = normal_jobs[0]
result = manager.change_job_priority(
job_to_elevate['jobId'],
'High',
'Queue congestion - elevating business critical job'
)
print(f"Elevated job {job_to_elevate['jobName']} to High priority")
print(f"New position: {result['newQueuePosition']} (was {result['previousPosition']})")
# Get queue history for analysis
history = manager.get_queue_history(
datetime.now() - timedelta(hours=24),
datetime.now(),
'hour',
['queue_size', 'wait_time', 'throughput']
)
print(f"24h summary: {history['summary']['totalJobsProcessed']} jobs processed")
print(f"Peak queue size: {history['summary']['peakQueueSize']}")
print(f"Average throughput: {history['summary']['throughputPerHour']} jobs/hour")
# If there are bottlenecks, report them
if history['bottlenecks']:
print("Recent bottlenecks:")
for bottleneck in history['bottlenecks']:
print(f" {bottleneck['timeframe']}: {bottleneck['issue']} (Impact: {bottleneck['impact']})")
except Exception as e:
print(f"Error in queue management: {e}")
```
---
## Tracking
Section: Execution
URL: https://docs.mindziestudio.com/mindzie_api/execution/tracking
Source: /docs-master/mindzieAPI/execution/tracking/page.md
# Job Tracking
Monitor Job Progress
Track job execution status, monitor progress, and retrieve detailed execution logs.
## Get Job Execution Logs
**GET** `/api/{tenantId}/{projectId}/execution/job/{jobId}/logs`
Retrieves detailed execution logs for a specific job, including progress updates, error messages, and performance metrics.
### Parameters
| Parameter | Type | Location | Description |
|-----------|------|----------|-------------|
| `tenantId` | GUID | Path | The tenant identifier |
| `projectId` | GUID | Path | The project identifier |
| `jobId` | GUID | Path | The job identifier |
### Query Parameters
| Parameter | Type | Description |
|-----------|------|-------------|
| `level` | string | Filter by log level: DEBUG, INFO, WARN, ERROR (default: INFO) |
| `fromTime` | datetime | Get logs from this timestamp |
| `toTime` | datetime | Get logs until this timestamp |
| `limit` | integer | Maximum number of log entries (default: 1000, max: 10000) |
| `format` | string | Response format: structured, raw (default: structured) |
### Response
```json
{
"jobId": "cc0e8400-e29b-41d4-a716-446655440000",
"jobName": "Customer Journey Analysis",
"jobStatus": "Running",
"logsSummary": {
"totalEntries": 247,
"debugEntries": 89,
"infoEntries": 145,
"warnEntries": 11,
"errorEntries": 2,
"timeRange": {
"startTime": "2024-01-20T10:30:00Z",
"endTime": "2024-01-20T10:45:00Z"
}
},
"logs": [
{
"timestamp": "2024-01-20T10:30:15Z",
"level": "INFO",
"component": "DataLoader",
"stage": "Initialization",
"message": "Starting data load for dataset 880e8400-e29b-41d4-a716-446655440000",
"details": {
"datasetSize": "45.7 MB",
"expectedRecords": 192850,
"format": "CSV"
}
},
{
"timestamp": "2024-01-20T10:32:45Z",
"level": "INFO",
"component": "ProcessMiner",
"stage": "Data Processing",
"message": "Processing batch 1 of 15",
"details": {
"batchSize": 12856,
"progress": 6.7,
"recordsPerSecond": 1247
}
},
{
"timestamp": "2024-01-20T10:38:22Z",
"level": "WARN",
"component": "DataValidator",
"stage": "Data Processing",
"message": "Found 125 records with missing timestamps",
"details": {
"affectedRecords": 125,
"action": "Timestamp inferred from surrounding events",
"impactOnAnalysis": "Minimal"
}
},
{
"timestamp": "2024-01-20T10:41:10Z",
"level": "ERROR",
"component": "AnalyticsEngine",
"stage": "Analysis",
"message": "Memory limit exceeded during bottleneck analysis",
"details": {
"memoryUsage": "3.8 GB",
"memoryLimit": "4.0 GB",
"action": "Switching to disk-based processing",
"retry": true
}
},
{
"timestamp": "2024-01-20T10:45:33Z",
"level": "INFO",
"component": "ReportGenerator",
"stage": "Output Generation",
"message": "Generating process map visualization",
"details": {
"activitiesCount": 47,
"pathsCount": 156,
"formatRequested": "SVG"
}
}
],
"executionMetrics": {
"currentStage": "Output Generation",
"stageProgress": 78,
"overallProgress": 85,
"processingRate": "1250 records/second",
"memoryUsage": "2.3 GB",
"cpuUsage": 67,
"estimatedCompletion": "2024-01-20T10:52:00Z"
}
}
```
## Track Job Progress
**GET** `/api/{tenantId}/{projectId}/execution/job/{jobId}/progress`
Retrieves real-time progress information for a running job, including stage-by-stage completion and performance metrics.
### Response
```json
{
"jobId": "cc0e8400-e29b-41d4-a716-446655440000",
"jobName": "Customer Journey Analysis",
"status": "Running",
"overallProgress": {
"percentage": 85,
"startTime": "2024-01-20T10:30:00Z",
"elapsedTime": "15 minutes 33 seconds",
"estimatedRemaining": "2 minutes 27 seconds",
"estimatedCompletion": "2024-01-20T10:52:00Z"
},
"stages": [
{
"stageName": "Data Loading",
"stageOrder": 1,
"status": "Completed",
"progress": 100,
"startTime": "2024-01-20T10:30:00Z",
"endTime": "2024-01-20T10:32:15Z",
"duration": "2 minutes 15 seconds",
"recordsProcessed": 192850,
"metrics": {
"throughput": "1427 records/second",
"dataValidated": true,
"errorsFound": 0
}
},
{
"stageName": "Process Discovery",
"stageOrder": 2,
"status": "Completed",
"progress": 100,
"startTime": "2024-01-20T10:32:15Z",
"endTime": "2024-01-20T10:41:30Z",
"duration": "9 minutes 15 seconds",
"recordsProcessed": 192850,
"metrics": {
"activitiesDiscovered": 47,
"variantsFound": 234,
"pathsIdentified": 156
}
},
{
"stageName": "Performance Analysis",
"stageOrder": 3,
"status": "Running",
"progress": 78,
"startTime": "2024-01-20T10:41:30Z",
"estimatedEndTime": "2024-01-20T10:48:00Z",
"recordsProcessed": 150243,
"totalRecords": 192850,
"metrics": {
"bottlenecksIdentified": 8,
"waitTimeCalculated": 150243,
"cycleTimeCalculated": 150243
}
},
{
"stageName": "Report Generation",
"stageOrder": 4,
"status": "Pending",
"progress": 0,
"estimatedStartTime": "2024-01-20T10:48:00Z",
"estimatedEndTime": "2024-01-20T10:52:00Z"
}
],
"currentActivity": {
"component": "PerformanceAnalyzer",
"operation": "Calculating resource utilization metrics",
"details": "Processing activity transitions for efficiency analysis"
},
"resourceUsage": {
"memoryUsage": "2.3 GB",
"memoryLimit": "4.0 GB",
"cpuUsage": 67,
"diskUsage": "890 MB",
"networkIO": "12 MB",
"processingRate": "1250 records/second"
},
"qualityMetrics": {
"dataQualityScore": 94.8,
"validationsPassed": 15,
"validationsFailed": 1,
"warningsGenerated": 11,
"errorsEncountered": 2
}
}
```
## Get Job Execution Timeline
**GET** `/api/{tenantId}/{projectId}/execution/job/{jobId}/timeline`
Retrieves a detailed timeline of job execution events, including stage transitions, resource allocation changes, and significant milestones.
### Query Parameters
| Parameter | Type | Description |
|-----------|------|-------------|
| `includeSubEvents` | boolean | Include detailed sub-events (default: false) |
| `granularity` | string | Timeline granularity: seconds, minutes, major_events (default: minutes) |
### Response
```json
{
"jobId": "cc0e8400-e29b-41d4-a716-446655440000",
"jobName": "Customer Journey Analysis",
"timelineScope": {
"startTime": "2024-01-20T10:30:00Z",
"currentTime": "2024-01-20T10:45:33Z",
"endTime": null,
"granularity": "minutes"
},
"timeline": [
{
"timestamp": "2024-01-20T10:30:00Z",
"eventType": "JobStarted",
"description": "Job execution initiated",
"details": {
"submittedBy": "user123",
"priority": "High",
"estimatedDuration": "20-25 minutes",
"resourcesAllocated": {
"cpuUnits": 2,
"memoryGB": 4,
"workerNode": "worker-node-02"
}
}
},
{
"timestamp": "2024-01-20T10:30:15Z",
"eventType": "StageStarted",
"description": "Data Loading stage initiated",
"details": {
"stageName": "Data Loading",
"expectedDuration": "2-3 minutes",
"datasetSize": "45.7 MB",
"recordCount": 192850
}
},
{
"timestamp": "2024-01-20T10:32:15Z",
"eventType": "StageCompleted",
"description": "Data Loading stage completed successfully",
"details": {
"stageName": "Data Loading",
"actualDuration": "2 minutes 15 seconds",
"recordsLoaded": 192850,
"dataQualityScore": 98.2,
"errorsFound": 0
}
},
{
"timestamp": "2024-01-20T10:32:15Z",
"eventType": "StageStarted",
"description": "Process Discovery stage initiated",
"details": {
"stageName": "Process Discovery",
"expectedDuration": "8-12 minutes",
"algorithm": "Alpha Miner Enhanced"
}
},
{
"timestamp": "2024-01-20T10:35:30Z",
"eventType": "Milestone",
"description": "Process model discovered",
"details": {
"activitiesFound": 47,
"uniqueActivities": 47,
"processComplexity": "Medium"
}
},
{
"timestamp": "2024-01-20T10:38:22Z",
"eventType": "Warning",
"description": "Data quality issue detected",
"details": {
"issue": "Missing timestamps",
"affectedRecords": 125,
"resolution": "Timestamps inferred",
"impact": "Minimal"
}
},
{
"timestamp": "2024-01-20T10:41:10Z",
"eventType": "Error",
"description": "Memory limit approached",
"details": {
"memoryUsage": "3.8 GB",
"memoryLimit": "4.0 GB",
"action": "Switched to disk-based processing",
"performanceImpact": "15% slower processing"
}
},
{
"timestamp": "2024-01-20T10:41:30Z",
"eventType": "StageCompleted",
"description": "Process Discovery stage completed",
"details": {
"stageName": "Process Discovery",
"actualDuration": "9 minutes 15 seconds",
"processVariants": 234,
"pathsDiscovered": 156
}
},
{
"timestamp": "2024-01-20T10:41:30Z",
"eventType": "StageStarted",
"description": "Performance Analysis stage initiated",
"details": {
"stageName": "Performance Analysis",
"expectedDuration": "6-8 minutes",
"analysisTypes": ["Bottleneck", "Resource Utilization", "Cycle Time"]
}
},
{
"timestamp": "2024-01-20T10:45:33Z",
"eventType": "Progress",
"description": "Performance Analysis 78% complete",
"details": {
"stageName": "Performance Analysis",
"progress": 78,
"currentOperation": "Resource utilization analysis",
"recordsProcessed": 150243,
"remainingRecords": 42607
}
}
],
"upcomingEvents": [
{
"estimatedTime": "2024-01-20T10:48:00Z",
"eventType": "StageCompletion",
"description": "Performance Analysis stage completion expected"
},
{
"estimatedTime": "2024-01-20T10:48:00Z",
"eventType": "StageStart",
"description": "Report Generation stage start expected"
},
{
"estimatedTime": "2024-01-20T10:52:00Z",
"eventType": "JobCompletion",
"description": "Job completion expected"
}
]
}
```
## Get Job Performance Metrics
**GET** `/api/{tenantId}/{projectId}/execution/job/{jobId}/metrics`
Retrieves detailed performance metrics for a job execution, including resource utilization, throughput, and efficiency measurements.
### Query Parameters
| Parameter | Type | Description |
|-----------|------|-------------|
| `interval` | string | Metrics collection interval: 1m, 5m, 15m (default: 5m) |
| `metrics` | string | Comma-separated metrics: cpu, memory, disk, network, throughput |
| `includeHistory` | boolean | Include historical metrics data (default: false) |
### Response
```json
{
"jobId": "cc0e8400-e29b-41d4-a716-446655440000",
"metricsCollectionTime": "2024-01-20T10:45:33Z",
"currentMetrics": {
"resourceUtilization": {
"cpu": {
"usage": 67,
"cores": 2,
"efficiency": 89.2
},
"memory": {
"used": "2.3 GB",
"allocated": "4.0 GB",
"peak": "3.8 GB",
"efficiency": 87.5
},
"disk": {
"reads": "450 MB",
"writes": "89 MB",
"iops": 145,
"latency": "12ms"
},
"network": {
"bytesIn": "67 MB",
"bytesOut": "12 MB",
"connections": 8
}
},
"processing": {
"recordsPerSecond": 1250,
"recordsProcessed": 150243,
"totalRecords": 192850,
"processingEfficiency": 78.3,
"errorRate": 0.001,
"retryRate": 0.015
},
"stages": {
"completed": 2,
"running": 1,
"pending": 1,
"averageStageTime": "5.75 minutes",
"stageEfficiency": 91.2
}
},
"historicalMetrics": [
{
"timestamp": "2024-01-20T10:30:00Z",
"cpu": 15,
"memory": 0.8,
"recordsPerSecond": 0,
"stage": "Initialization"
},
{
"timestamp": "2024-01-20T10:35:00Z",
"cpu": 85,
"memory": 1.9,
"recordsPerSecond": 1427,
"stage": "Data Loading"
},
{
"timestamp": "2024-01-20T10:40:00Z",
"cpu": 72,
"memory": 3.2,
"recordsPerSecond": 1156,
"stage": "Process Discovery"
},
{
"timestamp": "2024-01-20T10:45:00Z",
"cpu": 67,
"memory": 2.3,
"recordsPerSecond": 1250,
"stage": "Performance Analysis"
}
],
"performanceTrends": {
"cpuTrend": "Stable",
"memoryTrend": "Declining",
"throughputTrend": "Improving",
"overallEfficiency": "Good",
"predictionAccuracy": 94.2
},
"benchmarks": {
"jobType": "ProcessMining",
"averageJobDuration": "18.5 minutes",
"averageThroughput": "1180 records/second",
"currentPerformanceRank": "85th percentile",
"similarJobsComparison": {
"fasterThan": 85,
"similarTo": 12,
"slowerThan": 3
}
}
}
```
## Track Multiple Jobs
**GET** `/api/{tenantId}/{projectId}/execution/tracking/batch`
Retrieves tracking information for multiple jobs simultaneously, useful for dashboard displays and batch monitoring.
### Query Parameters
| Parameter | Type | Description |
|-----------|------|-------------|
| `jobIds` | string | Comma-separated list of job IDs to track |
| `status` | string | Filter by status: Running, Queued, Completed, Failed |
| `submittedBy` | string | Filter by user who submitted jobs |
| `includeMetrics` | boolean | Include performance metrics for each job (default: false) |
| `refreshInterval` | integer | Auto-refresh interval in seconds for real-time tracking |
### Response
```json
{
"trackingTime": "2024-01-20T10:45:33Z",
"jobCount": 5,
"summary": {
"running": 3,
"queued": 1,
"completed": 1,
"failed": 0
},
"jobs": [
{
"jobId": "cc0e8400-e29b-41d4-a716-446655440000",
"jobName": "Customer Journey Analysis",
"status": "Running",
"progress": 85,
"startTime": "2024-01-20T10:30:00Z",
"estimatedCompletion": "2024-01-20T10:52:00Z",
"currentStage": "Performance Analysis",
"submittedBy": "user123",
"priority": "High",
"resourceUsage": {
"cpu": 67,
"memory": "2.3 GB",
"processingRate": "1250 records/second"
}
},
{
"jobId": "dd0e8400-e29b-41d4-a716-446655440000",
"jobName": "Sales Data Enrichment",
"status": "Running",
"progress": 45,
"startTime": "2024-01-20T10:35:00Z",
"estimatedCompletion": "2024-01-20T11:05:00Z",
"currentStage": "Data Enrichment",
"submittedBy": "system",
"priority": "Normal",
"resourceUsage": {
"cpu": 52,
"memory": "1.8 GB",
"processingRate": "890 records/second"
}
},
{
"jobId": "ee0e8400-e29b-41d4-a716-446655440000",
"jobName": "Weekly Report Generation",
"status": "Queued",
"progress": 0,
"queuePosition": 2,
"estimatedStartTime": "2024-01-20T10:55:00Z",
"estimatedCompletion": "2024-01-20T11:20:00Z",
"submittedBy": "user456",
"priority": "Normal"
}
],
"systemHealth": {
"overallLoad": 73,
"queueHealth": "Good",
"resourceAvailability": "Medium",
"estimatedCapacity": "6 additional jobs"
}
}
```
## Subscribe to Job Events
**POST** `/api/{tenantId}/{projectId}/execution/job/{jobId}/subscribe`
Establishes a real-time subscription to job events for live tracking. Supports WebSocket connections and webhook notifications.
### Request Body
```json
{
"subscriptionType": "webhook",
"webhookUrl": "https://your-app.com/webhooks/job-events",
"events": [
"stageStarted",
"stageCompleted",
"progressUpdate",
"error",
"warning",
"jobCompleted"
],
"filters": {
"minProgressIncrement": 5,
"includeDebugEvents": false,
"notifyOnErrors": true
},
"authentication": {
"type": "bearer",
"token": "your-webhook-auth-token"
}
}
```
### Response
```json
{
"subscriptionId": "sub-123e8400-e29b-41d4-a716-446655440000",
"jobId": "cc0e8400-e29b-41d4-a716-446655440000",
"subscriptionType": "webhook",
"status": "Active",
"webhookUrl": "https://your-app.com/webhooks/job-events",
"eventsSubscribed": [
"stageStarted",
"stageCompleted",
"progressUpdate",
"error",
"warning",
"jobCompleted"
],
"createdAt": "2024-01-20T10:45:33Z",
"expiresAt": "2024-01-20T18:45:33Z"
}
```
## Get Job Dependencies
**GET** `/api/{tenantId}/{projectId}/execution/job/{jobId}/dependencies`
Retrieves information about job dependencies, including prerequisite jobs, dependent resources, and blocking conditions.
### Response
```json
{
"jobId": "cc0e8400-e29b-41d4-a716-446655440000",
"dependencies": {
"prerequisiteJobs": [
{
"jobId": "aa0e8400-e29b-41d4-a716-446655440000",
"jobName": "Data Preparation",
"status": "Completed",
"completedAt": "2024-01-20T10:25:00Z",
"dependency": "Dataset must be validated before analysis"
}
],
"resourceDependencies": [
{
"resourceType": "Dataset",
"resourceId": "880e8400-e29b-41d4-a716-446655440000",
"resourceName": "Customer Journey Data",
"status": "Available",
"lastModified": "2024-01-20T10:25:00Z"
},
{
"resourceType": "ComputeNode",
"resourceId": "worker-node-02",
"status": "Allocated",
"allocatedAt": "2024-01-20T10:30:00Z"
}
],
"dependentJobs": [
{
"jobId": "ee0e8400-e29b-41d4-a716-446655440000",
"jobName": "Weekly Report Generation",
"status": "Queued",
"waitingFor": "Customer Journey Analysis results"
}
]
},
"blockingConditions": [
{
"condition": "Memory allocation below 2GB",
"status": "Resolved",
"resolvedAt": "2024-01-20T10:30:00Z",
"resolution": "Additional memory allocated"
}
],
"dependencyGraph": {
"nodes": [
{
"id": "aa0e8400-e29b-41d4-a716-446655440000",
"type": "PrerequisiteJob",
"status": "Completed"
},
{
"id": "cc0e8400-e29b-41d4-a716-446655440000",
"type": "CurrentJob",
"status": "Running"
},
{
"id": "ee0e8400-e29b-41d4-a716-446655440000",
"type": "DependentJob",
"status": "Queued"
}
],
"edges": [
{
"from": "aa0e8400-e29b-41d4-a716-446655440000",
"to": "cc0e8400-e29b-41d4-a716-446655440000",
"type": "prerequisite"
},
{
"from": "cc0e8400-e29b-41d4-a716-446655440000",
"to": "ee0e8400-e29b-41d4-a716-446655440000",
"type": "dependency"
}
]
}
}
```
## Example: Complete Job Tracking Workflow
This example demonstrates comprehensive job tracking and monitoring:
```javascript
// 1. Start tracking a job
const trackJob = async (jobId) => {
// Get initial job status
const progress = await getJobProgress(jobId);
console.log(`Tracking job: ${progress.jobName}`);
console.log(`Current progress: ${progress.overallProgress.percentage}%`);
// Subscribe to real-time events
await subscribeToJobEvents(jobId);
return progress;
};
// 2. Get detailed job progress
const getJobProgress = async (jobId) => {
const response = await fetch(`/api/{tenantId}/{projectId}/execution/job/${jobId}/progress`, {
headers: {
'Authorization': `Bearer ${token}`
}
});
return await response.json();
};
// 3. Subscribe to real-time job events
const subscribeToJobEvents = async (jobId) => {
const response = await fetch(`/api/{tenantId}/{projectId}/execution/job/${jobId}/subscribe`, {
method: 'POST',
headers: {
'Content-Type': 'application/json',
'Authorization': `Bearer ${token}`
},
body: JSON.stringify({
subscriptionType: 'webhook',
webhookUrl: 'https://your-app.com/webhooks/job-events',
events: [
'stageStarted',
'stageCompleted',
'progressUpdate',
'error',
'warning',
'jobCompleted'
],
filters: {
minProgressIncrement: 10,
includeDebugEvents: false,
notifyOnErrors: true
}
})
});
const subscription = await response.json();
console.log(`Subscribed to job events: ${subscription.subscriptionId}`);
return subscription;
};
// 4. Get job performance metrics
const getJobMetrics = async (jobId) => {
const response = await fetch(`/api/{tenantId}/{projectId}/execution/job/${jobId}/metrics?interval=5m&includeHistory=true`, {
headers: {
'Authorization': `Bearer ${token}`
}
});
const metrics = await response.json();
console.log('Performance Metrics:');
console.log(` CPU Usage: ${metrics.currentMetrics.resourceUtilization.cpu.usage}%`);
console.log(` Memory Usage: ${metrics.currentMetrics.resourceUtilization.memory.used}`);
console.log(` Processing Rate: ${metrics.currentMetrics.processing.recordsPerSecond} records/sec`);
return metrics;
};
// 5. Get job execution logs
const getJobLogs = async (jobId, level = 'INFO') => {
const response = await fetch(`/api/{tenantId}/{projectId}/execution/job/${jobId}/logs?level=${level}&limit=100`, {
headers: {
'Authorization': `Bearer ${token}`
}
});
const logs = await response.json();
console.log(`Retrieved ${logs.logs.length} log entries`);
// Display recent important logs
logs.logs.filter(log => log.level !== 'DEBUG').forEach(log => {
console.log(`[${log.timestamp}] ${log.level}: ${log.message}`);
});
return logs;
};
// 6. Track multiple jobs in a dashboard
const trackMultipleJobs = async (jobIds) => {
const response = await fetch(`/api/{tenantId}/{projectId}/execution/tracking/batch?jobIds=${jobIds.join(',')}&includeMetrics=true`, {
headers: {
'Authorization': `Bearer ${token}`
}
});
const tracking = await response.json();
console.log(`Tracking ${tracking.jobCount} jobs:`);
tracking.jobs.forEach(job => {
console.log(` ${job.jobName}: ${job.status} (${job.progress}%)`);
});
return tracking;
};
// 7. Monitor job timeline
const getJobTimeline = async (jobId) => {
const response = await fetch(`/api/{tenantId}/{projectId}/execution/job/${jobId}/timeline?includeSubEvents=true&granularity=minutes`, {
headers: {
'Authorization': `Bearer ${token}`
}
});
const timeline = await response.json();
console.log('Job Timeline:');
timeline.timeline.forEach(event => {
console.log(`[${event.timestamp}] ${event.eventType}: ${event.description}`);
});
return timeline;
};
// Execute comprehensive tracking workflow
const runTrackingWorkflow = async (jobId) => {
try {
console.log('Starting comprehensive job tracking...');
// Track job progress
const progress = await trackJob(jobId);
// Get performance metrics
const metrics = await getJobMetrics(jobId);
// Get execution logs
const logs = await getJobLogs(jobId, 'WARN');
// Get timeline
const timeline = await getJobTimeline(jobId);
// Monitor until completion
const monitoring = setInterval(async () => {
const currentProgress = await getJobProgress(jobId);
if (currentProgress.status === 'Completed') {
console.log('Job completed successfully!');
clearInterval(monitoring);
// Get final metrics
const finalMetrics = await getJobMetrics(jobId);
console.log(`Final efficiency: ${finalMetrics.performanceTrends.overallEfficiency}`);
} else if (currentProgress.status === 'Failed') {
console.log('Job failed!');
clearInterval(monitoring);
// Get error logs
const errorLogs = await getJobLogs(jobId, 'ERROR');
console.log('Error details:', errorLogs.logs);
} else {
console.log(`Progress update: ${currentProgress.overallProgress.percentage}%`);
}
}, 30000); // Check every 30 seconds
} catch (error) {
console.error('Tracking workflow failed:', error);
}
};
// Start tracking
runTrackingWorkflow('cc0e8400-e29b-41d4-a716-446655440000');
```
## Python Example
```python
import requests
import time
import json
from datetime import datetime, timedelta
class JobTracker:
def __init__(self, base_url, tenant_id, project_id, token):
self.base_url = base_url
self.tenant_id = tenant_id
self.project_id = project_id
self.headers = {
'Authorization': f'Bearer {token}',
'Content-Type': 'application/json'
}
def get_job_progress(self, job_id):
"""Get current job progress"""
url = f"{self.base_url}/api/{self.tenant_id}/{self.project_id}/execution/job/{job_id}/progress"
response = requests.get(url, headers=self.headers)
return response.json()
def get_job_logs(self, job_id, level='INFO', limit=1000):
"""Get job execution logs"""
url = f"{self.base_url}/api/{self.tenant_id}/{self.project_id}/execution/job/{job_id}/logs"
params = {'level': level, 'limit': limit}
response = requests.get(url, params=params, headers=self.headers)
return response.json()
def get_job_metrics(self, job_id, interval='5m', include_history=False):
"""Get job performance metrics"""
url = f"{self.base_url}/api/{self.tenant_id}/{self.project_id}/execution/job/{job_id}/metrics"
params = {
'interval': interval,
'includeHistory': str(include_history).lower()
}
response = requests.get(url, params=params, headers=self.headers)
return response.json()
def get_job_timeline(self, job_id, include_sub_events=False, granularity='minutes'):
"""Get job execution timeline"""
url = f"{self.base_url}/api/{self.tenant_id}/{self.project_id}/execution/job/{job_id}/timeline"
params = {
'includeSubEvents': str(include_sub_events).lower(),
'granularity': granularity
}
response = requests.get(url, params=params, headers=self.headers)
return response.json()
def track_multiple_jobs(self, job_ids, include_metrics=False):
"""Track multiple jobs simultaneously"""
url = f"{self.base_url}/api/{self.tenant_id}/{self.project_id}/execution/tracking/batch"
params = {
'jobIds': ','.join(job_ids),
'includeMetrics': str(include_metrics).lower()
}
response = requests.get(url, params=params, headers=self.headers)
return response.json()
def subscribe_to_job_events(self, job_id, webhook_url, events=None):
"""Subscribe to real-time job events"""
url = f"{self.base_url}/api/{self.tenant_id}/{self.project_id}/execution/job/{job_id}/subscribe"
payload = {
'subscriptionType': 'webhook',
'webhookUrl': webhook_url,
'events': events or [
'stageStarted', 'stageCompleted', 'progressUpdate',
'error', 'warning', 'jobCompleted'
],
'filters': {
'minProgressIncrement': 10,
'includeDebugEvents': False,
'notifyOnErrors': True
}
}
response = requests.post(url, json=payload, headers=self.headers)
return response.json()
def get_job_dependencies(self, job_id):
"""Get job dependencies and blocking conditions"""
url = f"{self.base_url}/api/{self.tenant_id}/{self.project_id}/execution/job/{job_id}/dependencies"
response = requests.get(url, headers=self.headers)
return response.json()
def monitor_job_until_completion(self, job_id, check_interval=30, timeout=3600):
"""Monitor job until completion with detailed tracking"""
start_time = time.time()
print(f"Starting monitoring for job {job_id}")
# Get initial state
progress = self.get_job_progress(job_id)
print(f"Job: {progress['jobName']}")
print(f"Initial progress: {progress['overallProgress']['percentage']}%")
while time.time() - start_time < timeout:
try:
# Get current progress
progress = self.get_job_progress(job_id)
status = progress['status']
percentage = progress['overallProgress']['percentage']
print(f"Progress: {percentage}% - Status: {status}")
if status == 'Completed':
print("Job completed successfully!")
# Get final metrics
metrics = self.get_job_metrics(job_id, include_history=True)
print(f"Final efficiency: {metrics['performanceTrends']['overallEfficiency']}")
print(f"Total duration: {progress['overallProgress']['elapsedTime']}")
return progress
elif status == 'Failed':
print("Job failed!")
# Get error logs
logs = self.get_job_logs(job_id, level='ERROR')
print("Error logs:")
for log in logs['logs']:
print(f" [{log['timestamp']}] {log['message']}")
return progress
elif status == 'Running':
# Get performance metrics
metrics = self.get_job_metrics(job_id)
cpu_usage = metrics['currentMetrics']['resourceUtilization']['cpu']['usage']
memory_used = metrics['currentMetrics']['resourceUtilization']['memory']['used']
processing_rate = metrics['currentMetrics']['processing']['recordsPerSecond']
print(f" CPU: {cpu_usage}%, Memory: {memory_used}, Rate: {processing_rate} rec/sec")
# Check for warnings or errors
recent_logs = self.get_job_logs(job_id, level='WARN')
recent_warnings = [log for log in recent_logs['logs']
if (datetime.fromisoformat(log['timestamp'].replace('Z', '+00:00'))
> datetime.now().replace(tzinfo=None) - timedelta(minutes=1))]
if recent_warnings:
for warning in recent_warnings:
print(f" WARNING: {warning['message']}")
time.sleep(check_interval)
except Exception as e:
print(f"Monitoring error: {e}")
time.sleep(60)
raise TimeoutError(f"Job {job_id} monitoring timed out after {timeout} seconds")
def create_tracking_dashboard(self, job_ids):
"""Create a simple tracking dashboard for multiple jobs"""
print("Job Tracking Dashboard")
print("=" * 50)
while True:
try:
tracking = self.track_multiple_jobs(job_ids, include_metrics=True)
print(f"\nUpdate: {tracking['trackingTime']}")
print(f"System Load: {tracking['systemHealth']['overallLoad']}%")
print(f"Queue Health: {tracking['systemHealth']['queueHealth']}")
print()
for job in tracking['jobs']:
status_icon = "Done" if job['status'] == 'Completed' else "Running" if job['status'] == 'Running' else "Waiting"
print(f"{status_icon} {job['jobName']}: {job['progress']}% ({job['status']})")
if job['status'] == 'Running' and 'resourceUsage' in job:
print(f" CPU: {job['resourceUsage']['cpu']}%, Memory: {job['resourceUsage']['memory']}")
print(f" Rate: {job['resourceUsage']['processingRate']}")
if job['status'] == 'Queued':
print(f" Queue position: {job.get('queuePosition', 'Unknown')}")
print(f" Estimated start: {job.get('estimatedStartTime', 'Unknown')}")
print("\n" + "=" * 50)
# Check if all jobs are completed
active_jobs = [job for job in tracking['jobs'] if job['status'] in ['Running', 'Queued']]
if not active_jobs:
print("All jobs completed!")
break
time.sleep(30)
except KeyboardInterrupt:
print("\nDashboard stopped by user")
break
except Exception as e:
print(f"Dashboard error: {e}")
time.sleep(60)
# Usage example
tracker = JobTracker(
'https://your-mindzie-instance.com',
'tenant-guid',
'project-guid',
'your-auth-token'
)
try:
# Monitor a single job with comprehensive tracking
job_id = 'cc0e8400-e29b-41d4-a716-446655440000'
# Get initial job state
progress = tracker.get_job_progress(job_id)
print(f"Tracking job: {progress['jobName']}")
print(f"Status: {progress['status']}")
print(f"Progress: {progress['overallProgress']['percentage']}%")
# Get job dependencies
dependencies = tracker.get_job_dependencies(job_id)
if dependencies['dependencies']['prerequisiteJobs']:
print("Prerequisites:")
for prereq in dependencies['dependencies']['prerequisiteJobs']:
print(f" - {prereq['jobName']}: {prereq['status']}")
# Monitor until completion
final_status = tracker.monitor_job_until_completion(job_id)
# Get final timeline
timeline = tracker.get_job_timeline(job_id, include_sub_events=True)
print("\nExecution Timeline:")
for event in timeline['timeline'][-5:]: # Last 5 events
print(f" [{event['timestamp']}] {event['eventType']}: {event['description']}")
except Exception as e:
print(f"Error in job tracking: {e}")
```
---
## Overview
Section: Investigations
URL: https://docs.mindziestudio.com/mindzie_api/investigation/overview
Source: /docs-master/mindzieAPI/investigation/overview/page.md
# Investigation API
Manage investigations within mindzieStudio projects. Investigations are the primary containers for process mining analysis, linking datasets to notebooks that define analytical workflows.
## Features
### Investigation Management
Create, retrieve, update, and delete investigations. List all investigations in a project with pagination support.
[View Management API](/mindzie_api/investigation/management)
### Notebook Access
Retrieve notebooks within an investigation, including the main notebook that is automatically created with each investigation.
[View Notebooks API](/mindzie_api/investigation/notebooks)
---
## Available Endpoints
### Connectivity Testing
| Method | Endpoint | Description |
|--------|----------|-------------|
| GET | `/api/{tenantId}/{projectId}/investigation/unauthorized-ping` | Public connectivity test |
| GET | `/api/{tenantId}/{projectId}/investigation/ping` | Authenticated connectivity test |
### Investigation CRUD
| Method | Endpoint | Description |
|--------|----------|-------------|
| GET | `/api/{tenantId}/{projectId}/investigation` | List all investigations |
| GET | `/api/{tenantId}/{projectId}/investigation/{investigationId}` | Get investigation details |
| POST | `/api/{tenantId}/{projectId}/investigation` | Create an investigation |
| PUT | `/api/{tenantId}/{projectId}/investigation/{investigationId}` | Update an investigation |
| DELETE | `/api/{tenantId}/{projectId}/investigation/{investigationId}` | Delete an investigation |
### Notebook Access
| Method | Endpoint | Description |
|--------|----------|-------------|
| GET | `/api/{tenantId}/{projectId}/investigation/{investigationId}/notebooks` | List all notebooks |
| GET | `/api/{tenantId}/{projectId}/investigation/{investigationId}/main-notebook` | Get main notebook |
---
## Authentication
All Investigation API endpoints require a valid Tenant API key. Include the API key in the Authorization header.
See [Authentication](/mindzie_api/authentication) for details on API key types and usage.
---
## Quick Start
```bash
# List all investigations in a project
curl -X GET "https://your-mindzie-instance.com/api/{tenantId}/{projectId}/investigation" \
-H "Authorization: Bearer YOUR_API_KEY"
# Create a new investigation
curl -X POST "https://your-mindzie-instance.com/api/{tenantId}/{projectId}/investigation" \
-H "Authorization: Bearer YOUR_API_KEY" \
-H "Content-Type: application/json" \
-d '{"investigationName": "Order Analysis", "datasetId": "your-dataset-guid"}'
```
---
## Important Notes
- **Dataset Required**: Every investigation must be linked to an existing dataset
- **Main Notebook**: A main notebook is automatically created when an investigation is created
- **Cache Required**: Load the project into cache before accessing notebooks via the notebooks endpoint
- **CASCADE Delete**: Deleting an investigation permanently removes all its notebooks and analysis history
- **Operation Center**: Set `isUsedForOperationCenter` to true for investigations used in real-time monitoring
---
## Management
Section: Investigations
URL: https://docs.mindziestudio.com/mindzie_api/investigation/management
Source: /docs-master/mindzieAPI/investigation/management/page.md
# Investigation Management
Manage investigations within mindzieStudio projects. Create, retrieve, update, and delete investigations that contain notebooks and define process mining analysis workflows.
## Connectivity Testing
### Unauthorized Ping
**GET** `/api/{tenantId}/{projectId}/investigation/unauthorized-ping`
Test endpoint that does not require authentication. Use this to verify network connectivity.
#### Response
```
Ping Successful
```
### Authenticated Ping
**GET** `/api/{tenantId}/{projectId}/investigation/ping`
Authenticated ping endpoint to verify API access for a specific tenant and project.
#### Response (200 OK)
```
Ping Successful (tenant id: {tenantId})
```
---
## List All Investigations
**GET** `/api/{tenantId}/{projectId}/investigation`
Retrieves a paginated list of all investigations within the specified project.
### Path Parameters
| Parameter | Type | Required | Description |
|-----------|------|----------|-------------|
| `tenantId` | GUID | Yes | The tenant identifier |
| `projectId` | GUID | Yes | The project identifier |
### Query Parameters
| Parameter | Type | Default | Description |
|-----------|------|---------|-------------|
| `page` | integer | 1 | Page number for pagination |
| `pageSize` | integer | 50 | Number of items per page (max recommended: 100) |
### Response (200 OK)
```json
{
"investigations": [
{
"investigationId": "11111111-2222-3333-4444-555555555555",
"projectId": "87654321-4321-4321-4321-210987654321",
"investigationName": "Order Analysis",
"investigationDescription": "Process mining analysis of order workflow",
"datasetId": "12345678-1234-1234-1234-123456789012",
"dateCreated": "2024-01-15T10:30:00Z",
"dateModified": "2024-01-20T14:45:00Z",
"createdBy": "a1b2c3d4-e5f6-7890-abcd-ef1234567890",
"modifiedBy": "a1b2c3d4-e5f6-7890-abcd-ef1234567890",
"investigationOrder": 1.0,
"isUsedForOperationCenter": false,
"investigationFolderId": null,
"notebookCount": 3
}
],
"totalCount": 5,
"page": 1,
"pageSize": 50
}
```
### Investigation Object Fields
| Field | Type | Description |
|-------|------|-------------|
| `investigationId` | GUID | Unique identifier for the investigation |
| `projectId` | GUID | Project this investigation belongs to |
| `investigationName` | string | Display name of the investigation |
| `investigationDescription` | string | Description of the investigation |
| `datasetId` | GUID | The dataset this investigation analyzes |
| `dateCreated` | datetime | When the investigation was created |
| `dateModified` | datetime | When the investigation was last modified |
| `createdBy` | GUID | User who created the investigation |
| `modifiedBy` | GUID | User who last modified the investigation |
| `investigationOrder` | decimal | Display order within the project |
| `isUsedForOperationCenter` | boolean | Whether used for real-time monitoring |
| `investigationFolderId` | GUID | Optional folder for organization |
| `notebookCount` | integer | Number of notebooks in the investigation |
---
## Get Investigation Details
**GET** `/api/{tenantId}/{projectId}/investigation/{investigationId}`
Retrieves detailed information for a specific investigation.
### Path Parameters
| Parameter | Type | Required | Description |
|-----------|------|----------|-------------|
| `tenantId` | GUID | Yes | The tenant identifier |
| `projectId` | GUID | Yes | The project identifier |
| `investigationId` | GUID | Yes | The investigation identifier |
### Response (200 OK)
Same structure as the investigation object in the list response.
### Error Responses
**Not Found (404):**
```json
{
"error": "Investigation not found",
"investigationId": "11111111-2222-3333-4444-555555555555"
}
```
---
## Create Investigation
**POST** `/api/{tenantId}/{projectId}/investigation`
Creates a new investigation linked to an existing dataset. A main notebook is automatically created.
### Path Parameters
| Parameter | Type | Required | Description |
|-----------|------|----------|-------------|
| `tenantId` | GUID | Yes | The tenant identifier |
| `projectId` | GUID | Yes | The project identifier |
### Request Body
```json
{
"investigationName": "Order Analysis",
"investigationDescription": "Process mining analysis of order workflow",
"datasetId": "12345678-1234-1234-1234-123456789012",
"isUsedForOperationCenter": false
}
```
### Request Fields
| Field | Type | Required | Description |
|-------|------|----------|-------------|
| `investigationName` | string | Yes | Investigation name |
| `investigationDescription` | string | No | Description of the investigation |
| `datasetId` | GUID | Yes | The dataset to analyze |
| `isUsedForOperationCenter` | boolean | No | Enable for real-time monitoring (default: false) |
### Response (201 Created)
Returns the created investigation object (same structure as Get Investigation).
### Error Responses
**Bad Request (400):**
```json
{
"error": "Dataset not found with ID '12345678-1234-1234-1234-123456789012'"
}
```
---
## Update Investigation
**PUT** `/api/{tenantId}/{projectId}/investigation/{investigationId}`
Updates an existing investigation's properties. All fields are optional.
### Path Parameters
| Parameter | Type | Required | Description |
|-----------|------|----------|-------------|
| `tenantId` | GUID | Yes | The tenant identifier |
| `projectId` | GUID | Yes | The project identifier |
| `investigationId` | GUID | Yes | The investigation identifier |
### Request Body
```json
{
"investigationName": "Updated Analysis Name",
"investigationDescription": "Updated description",
"isUsedForOperationCenter": true
}
```
### Request Fields
| Field | Type | Required | Description |
|-------|------|----------|-------------|
| `investigationName` | string | No | New investigation name |
| `investigationDescription` | string | No | New description |
| `isUsedForOperationCenter` | boolean | No | Enable/disable operation center |
### Response (200 OK)
Returns the updated investigation object.
### Error Responses
**Not Found (404):**
```json
{
"error": "Investigation not found",
"investigationId": "11111111-2222-3333-4444-555555555555"
}
```
---
## Delete Investigation
**DELETE** `/api/{tenantId}/{projectId}/investigation/{investigationId}`
Permanently deletes an investigation and ALL associated notebooks.
**WARNING: This is a DESTRUCTIVE operation that CANNOT be undone.**
### Cascade Delete Includes
- All notebooks in the investigation
- All block configurations
- All execution history
- All analysis results
### Path Parameters
| Parameter | Type | Required | Description |
|-----------|------|----------|-------------|
| `tenantId` | GUID | Yes | The tenant identifier |
| `projectId` | GUID | Yes | The project identifier |
| `investigationId` | GUID | Yes | The investigation identifier |
### Response (204 No Content)
No response body on successful deletion.
### Error Responses
**Not Found (404):**
```json
{
"error": "Investigation not found",
"investigationId": "11111111-2222-3333-4444-555555555555"
}
```
---
## Implementation Examples
### cURL
```bash
# List all investigations
curl -X GET "https://your-mindzie-instance.com/api/12345678-1234-1234-1234-123456789012/87654321-4321-4321-4321-210987654321/investigation" \
-H "Authorization: Bearer YOUR_ACCESS_TOKEN"
# Get investigation details
curl -X GET "https://your-mindzie-instance.com/api/12345678-1234-1234-1234-123456789012/87654321-4321-4321-4321-210987654321/investigation/11111111-2222-3333-4444-555555555555" \
-H "Authorization: Bearer YOUR_ACCESS_TOKEN"
# Create a new investigation
curl -X POST "https://your-mindzie-instance.com/api/12345678-1234-1234-1234-123456789012/87654321-4321-4321-4321-210987654321/investigation" \
-H "Authorization: Bearer YOUR_ACCESS_TOKEN" \
-H "Content-Type: application/json" \
-d '{
"investigationName": "Q4 Analysis",
"investigationDescription": "Quarterly order analysis",
"datasetId": "aaaaaaaa-bbbb-cccc-dddd-eeeeeeeeeeee"
}'
# Update an investigation
curl -X PUT "https://your-mindzie-instance.com/api/12345678-1234-1234-1234-123456789012/87654321-4321-4321-4321-210987654321/investigation/11111111-2222-3333-4444-555555555555" \
-H "Authorization: Bearer YOUR_ACCESS_TOKEN" \
-H "Content-Type: application/json" \
-d '{
"investigationName": "Q4 Analysis - Final",
"investigationDescription": "Updated description"
}'
# Delete an investigation (CAUTION: Irreversible!)
curl -X DELETE "https://your-mindzie-instance.com/api/12345678-1234-1234-1234-123456789012/87654321-4321-4321-4321-210987654321/investigation/11111111-2222-3333-4444-555555555555" \
-H "Authorization: Bearer YOUR_ACCESS_TOKEN"
```
### Python
```python
import requests
TENANT_ID = '12345678-1234-1234-1234-123456789012'
PROJECT_ID = '87654321-4321-4321-4321-210987654321'
BASE_URL = 'https://your-mindzie-instance.com'
class InvestigationManager:
def __init__(self, token):
self.headers = {
'Authorization': f'Bearer {token}',
'Content-Type': 'application/json'
}
def list_investigations(self, page=1, page_size=50):
"""List all investigations in the project."""
url = f'{BASE_URL}/api/{TENANT_ID}/{PROJECT_ID}/investigation'
params = {'page': page, 'pageSize': page_size}
response = requests.get(url, headers=self.headers, params=params)
response.raise_for_status()
return response.json()
def get_investigation(self, investigation_id):
"""Get investigation details."""
url = f'{BASE_URL}/api/{TENANT_ID}/{PROJECT_ID}/investigation/{investigation_id}'
response = requests.get(url, headers=self.headers)
response.raise_for_status()
return response.json()
def create_investigation(self, name, dataset_id, description='', is_operation_center=False):
"""Create a new investigation."""
url = f'{BASE_URL}/api/{TENANT_ID}/{PROJECT_ID}/investigation'
payload = {
'investigationName': name,
'investigationDescription': description,
'datasetId': dataset_id,
'isUsedForOperationCenter': is_operation_center
}
response = requests.post(url, json=payload, headers=self.headers)
response.raise_for_status()
return response.json()
def update_investigation(self, investigation_id, name=None, description=None, is_operation_center=None):
"""Update an existing investigation."""
url = f'{BASE_URL}/api/{TENANT_ID}/{PROJECT_ID}/investigation/{investigation_id}'
payload = {}
if name:
payload['investigationName'] = name
if description is not None:
payload['investigationDescription'] = description
if is_operation_center is not None:
payload['isUsedForOperationCenter'] = is_operation_center
response = requests.put(url, json=payload, headers=self.headers)
response.raise_for_status()
return response.json()
def delete_investigation(self, investigation_id):
"""Delete an investigation (CAUTION: Irreversible!)."""
url = f'{BASE_URL}/api/{TENANT_ID}/{PROJECT_ID}/investigation/{investigation_id}'
response = requests.delete(url, headers=self.headers)
response.raise_for_status()
return None # 204 No Content
# Usage
manager = InvestigationManager('your-auth-token')
# List all investigations
result = manager.list_investigations()
print(f"Total investigations: {result['totalCount']}")
for inv in result['investigations']:
print(f"- {inv['investigationName']}: {inv['notebookCount']} notebooks")
# Create a new investigation
new_inv = manager.create_investigation(
name='API Test Investigation',
dataset_id='aaaaaaaa-bbbb-cccc-dddd-eeeeeeeeeeee',
description='Created via API'
)
print(f"Created: {new_inv['investigationId']}")
```
### JavaScript/Node.js
```javascript
const TENANT_ID = '12345678-1234-1234-1234-123456789012';
const PROJECT_ID = '87654321-4321-4321-4321-210987654321';
const BASE_URL = 'https://your-mindzie-instance.com';
class InvestigationManager {
constructor(token) {
this.headers = {
'Authorization': `Bearer ${token}`,
'Content-Type': 'application/json'
};
}
async listInvestigations(page = 1, pageSize = 50) {
const url = `${BASE_URL}/api/${TENANT_ID}/${PROJECT_ID}/investigation?page=${page}&pageSize=${pageSize}`;
const response = await fetch(url, { headers: this.headers });
if (!response.ok) throw new Error(`Failed: ${response.status}`);
return await response.json();
}
async getInvestigation(investigationId) {
const url = `${BASE_URL}/api/${TENANT_ID}/${PROJECT_ID}/investigation/${investigationId}`;
const response = await fetch(url, { headers: this.headers });
if (!response.ok) throw new Error(`Failed: ${response.status}`);
return await response.json();
}
async createInvestigation(name, datasetId, description = '', isOperationCenter = false) {
const url = `${BASE_URL}/api/${TENANT_ID}/${PROJECT_ID}/investigation`;
const response = await fetch(url, {
method: 'POST',
headers: this.headers,
body: JSON.stringify({
investigationName: name,
investigationDescription: description,
datasetId: datasetId,
isUsedForOperationCenter: isOperationCenter
})
});
if (!response.ok) throw new Error(`Failed: ${response.status}`);
return await response.json();
}
async updateInvestigation(investigationId, updates) {
const url = `${BASE_URL}/api/${TENANT_ID}/${PROJECT_ID}/investigation/${investigationId}`;
const response = await fetch(url, {
method: 'PUT',
headers: this.headers,
body: JSON.stringify(updates)
});
if (!response.ok) throw new Error(`Failed: ${response.status}`);
return await response.json();
}
async deleteInvestigation(investigationId) {
const url = `${BASE_URL}/api/${TENANT_ID}/${PROJECT_ID}/investigation/${investigationId}`;
const response = await fetch(url, {
method: 'DELETE',
headers: this.headers
});
if (!response.ok) throw new Error(`Failed: ${response.status}`);
return null; // 204 No Content
}
}
// Usage
const manager = new InvestigationManager('your-auth-token');
const investigations = await manager.listInvestigations();
console.log(`Found ${investigations.totalCount} investigations`);
investigations.investigations.forEach(inv => {
console.log(`- ${inv.investigationName}: ${inv.notebookCount} notebooks`);
});
// Create a new investigation
const newInv = await manager.createInvestigation(
'API Test Investigation',
'aaaaaaaa-bbbb-cccc-dddd-eeeeeeeeeeee',
'Created via API'
);
console.log(`Created: ${newInv.investigationId}`);
```
---
## Notebooks
Section: Investigations
URL: https://docs.mindziestudio.com/mindzie_api/investigation/notebooks
Source: /docs-master/mindzieAPI/investigation/notebooks/page.md
# Investigation Notebooks
Access notebooks within an investigation. Notebooks contain the analysis blocks that define process mining workflows.
## Prerequisites
Before accessing notebooks via this API, you must load the project into cache using the Project API.
```bash
# Load project into cache first
curl -X GET "https://your-mindzie-instance.com/api/{tenantId}/project/{projectId}/load" \
-H "Authorization: Bearer YOUR_API_KEY"
```
See [Project Cache API](/mindzie_api/project/cache) for details.
---
## List Investigation Notebooks
**GET** `/api/{tenantId}/{projectId}/investigation/{investigationId}/notebooks`
Retrieves all notebooks within an investigation from the project cache.
### Path Parameters
| Parameter | Type | Required | Description |
|-----------|------|----------|-------------|
| `tenantId` | GUID | Yes | The tenant identifier |
| `projectId` | GUID | Yes | The project identifier |
| `investigationId` | GUID | Yes | The investigation identifier |
### Response (200 OK)
```json
{
"notebooks": [
{
"notebookId": "aaaaaaaa-bbbb-cccc-dddd-eeeeeeeeeeee",
"investigationId": "11111111-2222-3333-4444-555555555555",
"name": "Main",
"description": "",
"dateCreated": "2024-01-15T10:30:00Z",
"dateModified": "2024-01-20T14:45:00Z",
"createdBy": null,
"modifiedBy": null,
"notebookType": null,
"notebookOrder": 1.0,
"lastExecutionDuration": 0,
"blockCount": 12
},
{
"notebookId": "bbbbbbbb-cccc-dddd-eeee-ffffffffffff",
"investigationId": "11111111-2222-3333-4444-555555555555",
"name": "Variant Analysis",
"description": "",
"dateCreated": "2024-01-16T09:00:00Z",
"dateModified": "2024-01-18T11:30:00Z",
"createdBy": null,
"modifiedBy": null,
"notebookType": null,
"notebookOrder": 2.0,
"lastExecutionDuration": 0,
"blockCount": 8
}
],
"totalCount": 2
}
```
### Notebook Object Fields
| Field | Type | Description |
|-------|------|-------------|
| `notebookId` | GUID | Unique identifier for the notebook |
| `investigationId` | GUID | Investigation this notebook belongs to |
| `name` | string | Display name of the notebook |
| `description` | string | Description of the notebook |
| `dateCreated` | datetime | When the notebook was created |
| `dateModified` | datetime | When the notebook was last modified |
| `createdBy` | GUID | User who created the notebook |
| `modifiedBy` | GUID | User who last modified the notebook |
| `notebookType` | integer | Type of notebook (0 = standard) |
| `notebookOrder` | decimal | Display order within the investigation |
| `lastExecutionDuration` | double | Last execution time in seconds |
| `blockCount` | integer | Number of blocks in the notebook |
### Error Responses
**Not Found (404) - Project not cached:**
```json
"Project not found in cache. Please load the project first using the ProjectController.LoadProject endpoint."
```
**Not Found (404) - Investigation not found:**
```json
{
"error": "Investigation not found",
"investigationId": "11111111-2222-3333-4444-555555555555"
}
```
---
## Get Main Notebook
**GET** `/api/{tenantId}/{projectId}/investigation/{investigationId}/main-notebook`
Retrieves the main notebook for an investigation. The main notebook is automatically created when an investigation is created and typically contains the core filtering and analysis workflow.
### Path Parameters
| Parameter | Type | Required | Description |
|-----------|------|----------|-------------|
| `tenantId` | GUID | Yes | The tenant identifier |
| `projectId` | GUID | Yes | The project identifier |
| `investigationId` | GUID | Yes | The investigation identifier |
### Response (200 OK)
```json
{
"notebookId": "aaaaaaaa-bbbb-cccc-dddd-eeeeeeeeeeee",
"investigationId": "11111111-2222-3333-4444-555555555555",
"name": "Main",
"description": "Primary analysis notebook",
"dateCreated": "2024-01-15T10:30:00Z",
"dateModified": "2024-01-20T14:45:00Z",
"createdBy": "a1b2c3d4-e5f6-7890-abcd-ef1234567890",
"modifiedBy": "a1b2c3d4-e5f6-7890-abcd-ef1234567890",
"notebookType": 0,
"notebookOrder": 1.0,
"lastExecutionDuration": 2.5,
"blockCount": 12
}
```
### Error Responses
**Not Found (404) - Investigation not found:**
```json
{
"error": "Investigation not found",
"investigationId": "11111111-2222-3333-4444-555555555555"
}
```
**Not Found (404) - Main notebook not found:**
```json
{
"error": "Main notebook not found for investigation",
"investigationId": "11111111-2222-3333-4444-555555555555"
}
```
---
## Implementation Examples
### cURL
```bash
# Step 1: Load project into cache first
curl -X GET "https://your-mindzie-instance.com/api/12345678-1234-1234-1234-123456789012/project/87654321-4321-4321-4321-210987654321/load" \
-H "Authorization: Bearer YOUR_ACCESS_TOKEN"
# Step 2: List all notebooks in an investigation
curl -X GET "https://your-mindzie-instance.com/api/12345678-1234-1234-1234-123456789012/87654321-4321-4321-4321-210987654321/investigation/11111111-2222-3333-4444-555555555555/notebooks" \
-H "Authorization: Bearer YOUR_ACCESS_TOKEN"
# Get the main notebook directly
curl -X GET "https://your-mindzie-instance.com/api/12345678-1234-1234-1234-123456789012/87654321-4321-4321-4321-210987654321/investigation/11111111-2222-3333-4444-555555555555/main-notebook" \
-H "Authorization: Bearer YOUR_ACCESS_TOKEN"
```
### Python
```python
import requests
TENANT_ID = '12345678-1234-1234-1234-123456789012'
PROJECT_ID = '87654321-4321-4321-4321-210987654321'
BASE_URL = 'https://your-mindzie-instance.com'
class NotebookAccessor:
def __init__(self, token):
self.headers = {
'Authorization': f'Bearer {token}',
'Content-Type': 'application/json'
}
def load_project(self):
"""Load project into cache before accessing notebooks."""
url = f'{BASE_URL}/api/{TENANT_ID}/project/{PROJECT_ID}/load'
response = requests.get(url, headers=self.headers)
response.raise_for_status()
return response.json()
def list_notebooks(self, investigation_id):
"""List all notebooks in an investigation."""
url = f'{BASE_URL}/api/{TENANT_ID}/{PROJECT_ID}/investigation/{investigation_id}/notebooks'
response = requests.get(url, headers=self.headers)
response.raise_for_status()
return response.json()
def get_main_notebook(self, investigation_id):
"""Get the main notebook for an investigation."""
url = f'{BASE_URL}/api/{TENANT_ID}/{PROJECT_ID}/investigation/{investigation_id}/main-notebook'
response = requests.get(url, headers=self.headers)
response.raise_for_status()
return response.json()
# Usage
accessor = NotebookAccessor('your-auth-token')
investigation_id = '11111111-2222-3333-4444-555555555555'
# Step 1: Load project into cache
print("Loading project into cache...")
load_result = accessor.load_project()
print(f"Project loaded: {load_result['projectName']}")
# Step 2: List notebooks
notebooks = accessor.list_notebooks(investigation_id)
print(f"\nFound {notebooks['totalCount']} notebooks:")
for nb in notebooks['notebooks']:
print(f" - {nb['name']}: {nb['blockCount']} blocks")
# Get main notebook
main = accessor.get_main_notebook(investigation_id)
print(f"\nMain notebook: {main['name']} ({main['blockCount']} blocks)")
```
### JavaScript/Node.js
```javascript
const TENANT_ID = '12345678-1234-1234-1234-123456789012';
const PROJECT_ID = '87654321-4321-4321-4321-210987654321';
const BASE_URL = 'https://your-mindzie-instance.com';
class NotebookAccessor {
constructor(token) {
this.headers = {
'Authorization': `Bearer ${token}`,
'Content-Type': 'application/json'
};
}
async loadProject() {
const url = `${BASE_URL}/api/${TENANT_ID}/project/${PROJECT_ID}/load`;
const response = await fetch(url, { headers: this.headers });
if (!response.ok) throw new Error(`Failed: ${response.status}`);
return await response.json();
}
async listNotebooks(investigationId) {
const url = `${BASE_URL}/api/${TENANT_ID}/${PROJECT_ID}/investigation/${investigationId}/notebooks`;
const response = await fetch(url, { headers: this.headers });
if (!response.ok) throw new Error(`Failed: ${response.status}`);
return await response.json();
}
async getMainNotebook(investigationId) {
const url = `${BASE_URL}/api/${TENANT_ID}/${PROJECT_ID}/investigation/${investigationId}/main-notebook`;
const response = await fetch(url, { headers: this.headers });
if (!response.ok) throw new Error(`Failed: ${response.status}`);
return await response.json();
}
}
// Usage
const accessor = new NotebookAccessor('your-auth-token');
const investigationId = '11111111-2222-3333-4444-555555555555';
// Step 1: Load project
console.log('Loading project into cache...');
const loadResult = await accessor.loadProject();
console.log(`Project loaded: ${loadResult.projectName}`);
// Step 2: List notebooks
const notebooks = await accessor.listNotebooks(investigationId);
console.log(`\nFound ${notebooks.totalCount} notebooks:`);
notebooks.notebooks.forEach(nb => {
console.log(` - ${nb.name}: ${nb.blockCount} blocks`);
});
// Get main notebook
const main = await accessor.getMainNotebook(investigationId);
console.log(`\nMain notebook: ${main.name} (${main.blockCount} blocks)`);
```
---
## Best Practices
1. **Always Load Project First**: Before accessing notebooks, ensure the project is loaded into cache
2. **Cache Duration**: Projects remain in cache for 30 minutes after last access
3. **Touch Session**: API calls automatically extend cache lifetime
4. **Use Main Notebook**: For basic analysis, the main notebook contains the primary workflow
5. **Notebook Order**: Notebooks are ordered by `notebookOrder` for consistent display
---
## Overview
Section: Project
URL: https://docs.mindziestudio.com/mindzie_api/project/overview
Source: /docs-master/mindzieAPI/project/overview/page.md
# Project API
Manage projects within mindzieStudio tenants. Projects are the top-level containers for datasets, investigations, dashboards, and analysis workflows.
## Features
### Project Management
Create, retrieve, update, and delete projects. List all projects in a tenant with pagination support.
[View Management API](/mindzie_api/project/management)
### Cache Operations
Load projects into memory for fast access during API operations. Essential for executing notebooks and blocks efficiently.
[View Cache API](/mindzie_api/project/cache)
### User Permissions
Manage user access to projects. Add users, update permission levels (owner vs member), and remove access.
[View Users API](/mindzie_api/project/users)
### Import & Export
Export projects as portable .mpz files for backup or transfer. Import projects from .mpz files. Manage project thumbnails.
[View Import & Export API](/mindzie_api/project/import-export)
---
## Available Endpoints
### Connectivity Testing
| Method | Endpoint | Description |
|--------|----------|-------------|
| GET | `/api/{tenantId}/project/unauthorized-ping` | Public connectivity test |
| GET | `/api/{tenantId}/project/ping` | Authenticated connectivity test |
### Project CRUD
| Method | Endpoint | Description |
|--------|----------|-------------|
| GET | `/api/{tenantId}/project` | List all projects |
| GET | `/api/{tenantId}/project/{projectId}` | Get project details |
| POST | `/api/{tenantId}/project` | Create a project |
| PUT | `/api/{tenantId}/project/{projectId}` | Update a project |
| DELETE | `/api/{tenantId}/project/{projectId}` | Delete a project |
| GET | `/api/{tenantId}/project/{projectId}/summary` | Get project statistics |
### Cache Management
| Method | Endpoint | Description |
|--------|----------|-------------|
| GET | `/api/{tenantId}/project/{projectId}/load` | Load project into cache |
| DELETE | `/api/{tenantId}/project/{projectId}/unload` | Unload project from cache |
### User Permissions
| Method | Endpoint | Description |
|--------|----------|-------------|
| GET | `/api/{tenantId}/project/{projectId}/users` | List project users |
| POST | `/api/{tenantId}/project/{projectId}/users/{userId}` | Add user to project |
| PUT | `/api/{tenantId}/project/{projectId}/users/{userId}` | Update user permission |
| DELETE | `/api/{tenantId}/project/{projectId}/users/{userId}` | Remove user |
### Import/Export
| Method | Endpoint | Description |
|--------|----------|-------------|
| GET | `/api/{tenantId}/project/{projectId}/download` | Export as .mpz |
| POST | `/api/{tenantId}/project/import` | Import from .mpz |
### Thumbnails
| Method | Endpoint | Description |
|--------|----------|-------------|
| GET | `/api/{tenantId}/project/{projectId}/thumbnail` | Get thumbnail |
| POST | `/api/{tenantId}/project/{projectId}/thumbnail` | Update thumbnail |
| DELETE | `/api/{tenantId}/project/{projectId}/thumbnail` | Remove thumbnail |
---
## Authentication
All Project API endpoints require a valid API key. Use tenant-scoped API keys for project operations.
See [Authentication](/mindzie_api/authentication) for details on API key types and usage.
---
## Quick Start
```bash
# List all projects in a tenant
curl -X GET "https://your-mindzie-instance.com/api/{tenantId}/project" \
-H "Authorization: Bearer YOUR_API_KEY"
# Load a project into cache before executing notebooks
curl -X GET "https://your-mindzie-instance.com/api/{tenantId}/project/{projectId}/load" \
-H "Authorization: Bearer YOUR_API_KEY"
```
---
## Important Notes
- **CASCADE Delete**: Deleting a project permanently removes all datasets, investigations, dashboards, and files
- **Cache Required**: Load projects into cache before executing notebooks or blocks
- **Cache Duration**: Projects remain cached for 30 minutes after last access
- **Export Before Delete**: Always export projects before deletion as a backup
---
## Management
Section: Project
URL: https://docs.mindziestudio.com/mindzie_api/project/management
Source: /docs-master/mindzieAPI/project/management/page.md
# Project Management
Manage projects within mindzieStudio tenants. Create, retrieve, update, and delete projects that contain datasets, investigations, dashboards, and analysis workflows.
## Connectivity Testing
### Unauthorized Ping
**GET** `/api/{tenantId}/project/unauthorized-ping`
Test endpoint that does not require authentication. Use this to verify network connectivity.
#### Response
```
Ping Successful
```
### Authenticated Ping
**GET** `/api/{tenantId}/project/ping`
Authenticated ping endpoint to verify API access for a specific tenant.
#### Response (200 OK)
```
Ping Successful (tenant id: {tenantId})
```
---
## List All Projects
**GET** `/api/{tenantId}/project`
Retrieves a paginated list of all projects the authenticated user has access to within the specified tenant.
### Path Parameters
| Parameter | Type | Required | Description |
|-----------|------|----------|-------------|
| `tenantId` | GUID | Yes | The tenant identifier |
### Query Parameters
| Parameter | Type | Default | Description |
|-----------|------|---------|-------------|
| `page` | integer | 1 | Page number for pagination |
| `pageSize` | integer | 50 | Number of items per page (max recommended: 100) |
### Response (200 OK)
```json
{
"projects": [
{
"projectId": "87654321-4321-4321-4321-210987654321",
"tenantId": "12345678-1234-1234-1234-123456789012",
"projectName": "Purchase Order Analysis",
"projectDescription": "Process mining analysis of P2P workflow",
"dateCreated": "2024-01-15T10:30:00Z",
"dateModified": "2024-01-20T14:45:00Z",
"createdBy": "user@example.com",
"modifiedBy": "user@example.com",
"isActive": true,
"datasetCount": 3,
"investigationCount": 5,
"dashboardCount": 2,
"userCount": 8
}
],
"totalCount": 15,
"page": 1,
"pageSize": 50
}
```
### Project Object Fields
| Field | Type | Description |
|-------|------|-------------|
| `projectId` | GUID | Unique identifier for the project |
| `tenantId` | GUID | Tenant this project belongs to |
| `projectName` | string | Display name of the project |
| `projectDescription` | string | Description of the project |
| `dateCreated` | datetime | When the project was created |
| `dateModified` | datetime | When the project was last modified |
| `createdBy` | string | User who created the project |
| `modifiedBy` | string | User who last modified the project |
| `isActive` | boolean | Whether the project is active |
| `datasetCount` | integer | Number of datasets in the project |
| `investigationCount` | integer | Number of investigations |
| `dashboardCount` | integer | Number of dashboards |
| `userCount` | integer | Number of users with access |
---
## Get Project Details
**GET** `/api/{tenantId}/project/{projectId}`
Retrieves detailed information for a specific project.
### Path Parameters
| Parameter | Type | Required | Description |
|-----------|------|----------|-------------|
| `tenantId` | GUID | Yes | The tenant identifier |
| `projectId` | GUID | Yes | The project identifier |
### Response (200 OK)
Same structure as the project object in the list response.
### Error Responses
**Not Found (404):**
```json
{
"error": "Project not found with ID '{projectId}'. The project may have been deleted or the ID is incorrect.",
"projectId": "87654321-4321-4321-4321-210987654321"
}
```
---
## Get Project Summary
**GET** `/api/{tenantId}/project/{projectId}/summary`
Retrieves aggregated statistics and key metrics for the project.
### Response (200 OK)
```json
{
"projectId": "87654321-4321-4321-4321-210987654321",
"projectName": "Purchase Order Analysis",
"projectDescription": "Process mining analysis of P2P workflow",
"dateCreated": "2024-01-15T10:30:00Z",
"dateModified": "2024-01-20T14:45:00Z",
"statistics": {
"totalDatasets": 3,
"totalInvestigations": 5,
"totalDashboards": 2,
"totalNotebooks": 12,
"totalUsers": 8
}
}
```
---
## Create Project
**POST** `/api/{tenantId}/project`
Creates a new project in the specified tenant.
### Request Body
```json
{
"projectName": "New Analysis Project",
"projectDescription": "Process mining analysis for procurement workflow"
}
```
### Request Fields
| Field | Type | Required | Description |
|-------|------|----------|-------------|
| `projectName` | string | Yes | Project name (max 255 characters) |
| `projectDescription` | string | No | Description (max 1000 characters) |
### Response (201 Created)
Returns the created project object (same structure as Get Project).
### Error Responses
**Bad Request (400):**
```json
{
"error": "Validation failed",
"validationErrors": ["Project name is required"]
}
```
---
## Update Project
**PUT** `/api/{tenantId}/project/{projectId}`
Updates an existing project's properties.
### Path Parameters
| Parameter | Type | Description |
|-----------|------|-------------|
| `tenantId` | GUID | The tenant identifier |
| `projectId` | GUID | The project identifier |
### Request Body
```json
{
"projectName": "Updated Project Name",
"projectDescription": "Updated description",
"isActive": true
}
```
### Request Fields
| Field | Type | Required | Description |
|-------|------|----------|-------------|
| `projectName` | string | Yes | New project name |
| `projectDescription` | string | No | New description |
| `isActive` | boolean | No | Enable/disable project |
### Response (200 OK)
Returns the updated project object.
---
## Delete Project
**DELETE** `/api/{tenantId}/project/{projectId}`
Permanently deletes a project and ALL associated data.
**WARNING: This is a DESTRUCTIVE operation that CANNOT be undone.**
### Cascade Delete Includes
- All datasets in the project
- All investigations and notebooks
- All dashboards
- All user permissions
- All blob storage files (event logs, attachments)
### Path Parameters
| Parameter | Type | Description |
|-----------|------|-------------|
| `tenantId` | GUID | The tenant identifier |
| `projectId` | GUID | The project identifier |
### Response (200 OK)
```json
{
"message": "Project deleted successfully",
"projectId": "87654321-4321-4321-4321-210987654321"
}
```
---
## Implementation Examples
### cURL
```bash
# List all projects
curl -X GET "https://your-mindzie-instance.com/api/12345678-1234-1234-1234-123456789012/project" \
-H "Authorization: Bearer YOUR_ACCESS_TOKEN"
# Get project details
curl -X GET "https://your-mindzie-instance.com/api/12345678-1234-1234-1234-123456789012/project/87654321-4321-4321-4321-210987654321" \
-H "Authorization: Bearer YOUR_ACCESS_TOKEN"
# Create a new project
curl -X POST "https://your-mindzie-instance.com/api/12345678-1234-1234-1234-123456789012/project" \
-H "Authorization: Bearer YOUR_ACCESS_TOKEN" \
-H "Content-Type: application/json" \
-d '{
"projectName": "Q4 Analysis",
"projectDescription": "Quarterly procurement analysis"
}'
# Update a project
curl -X PUT "https://your-mindzie-instance.com/api/12345678-1234-1234-1234-123456789012/project/87654321-4321-4321-4321-210987654321" \
-H "Authorization: Bearer YOUR_ACCESS_TOKEN" \
-H "Content-Type: application/json" \
-d '{
"projectName": "Q4 Analysis - Final",
"projectDescription": "Updated description"
}'
# Delete a project (CAUTION: Irreversible!)
curl -X DELETE "https://your-mindzie-instance.com/api/12345678-1234-1234-1234-123456789012/project/87654321-4321-4321-4321-210987654321" \
-H "Authorization: Bearer YOUR_ACCESS_TOKEN"
```
### Python
```python
import requests
TENANT_ID = '12345678-1234-1234-1234-123456789012'
BASE_URL = 'https://your-mindzie-instance.com'
class ProjectManager:
def __init__(self, token):
self.headers = {
'Authorization': f'Bearer {token}',
'Content-Type': 'application/json'
}
def list_projects(self, page=1, page_size=50):
"""List all projects in the tenant."""
url = f'{BASE_URL}/api/{TENANT_ID}/project'
params = {'page': page, 'pageSize': page_size}
response = requests.get(url, headers=self.headers, params=params)
response.raise_for_status()
return response.json()
def get_project(self, project_id):
"""Get project details."""
url = f'{BASE_URL}/api/{TENANT_ID}/project/{project_id}'
response = requests.get(url, headers=self.headers)
response.raise_for_status()
return response.json()
def create_project(self, name, description=''):
"""Create a new project."""
url = f'{BASE_URL}/api/{TENANT_ID}/project'
payload = {
'projectName': name,
'projectDescription': description
}
response = requests.post(url, json=payload, headers=self.headers)
response.raise_for_status()
return response.json()
def update_project(self, project_id, name=None, description=None, is_active=None):
"""Update an existing project."""
url = f'{BASE_URL}/api/{TENANT_ID}/project/{project_id}'
payload = {}
if name:
payload['projectName'] = name
if description is not None:
payload['projectDescription'] = description
if is_active is not None:
payload['isActive'] = is_active
response = requests.put(url, json=payload, headers=self.headers)
response.raise_for_status()
return response.json()
def delete_project(self, project_id):
"""Delete a project (CAUTION: Irreversible!)."""
url = f'{BASE_URL}/api/{TENANT_ID}/project/{project_id}'
response = requests.delete(url, headers=self.headers)
response.raise_for_status()
return response.json()
# Usage
manager = ProjectManager('your-auth-token')
# List all projects
result = manager.list_projects()
print(f"Total projects: {result['totalCount']}")
for project in result['projects']:
print(f"- {project['projectName']}: {project['datasetCount']} datasets")
# Create a new project
new_project = manager.create_project(
name='API Test Project',
description='Created via API'
)
print(f"Created: {new_project['projectId']}")
```
### JavaScript/Node.js
```javascript
const TENANT_ID = '12345678-1234-1234-1234-123456789012';
const BASE_URL = 'https://your-mindzie-instance.com';
class ProjectManager {
constructor(token) {
this.headers = {
'Authorization': `Bearer ${token}`,
'Content-Type': 'application/json'
};
}
async listProjects(page = 1, pageSize = 50) {
const url = `${BASE_URL}/api/${TENANT_ID}/project?page=${page}&pageSize=${pageSize}`;
const response = await fetch(url, { headers: this.headers });
if (!response.ok) throw new Error(`Failed: ${response.status}`);
return await response.json();
}
async getProject(projectId) {
const url = `${BASE_URL}/api/${TENANT_ID}/project/${projectId}`;
const response = await fetch(url, { headers: this.headers });
if (!response.ok) throw new Error(`Failed: ${response.status}`);
return await response.json();
}
async createProject(name, description = '') {
const url = `${BASE_URL}/api/${TENANT_ID}/project`;
const response = await fetch(url, {
method: 'POST',
headers: this.headers,
body: JSON.stringify({ projectName: name, projectDescription: description })
});
if (!response.ok) throw new Error(`Failed: ${response.status}`);
return await response.json();
}
async deleteProject(projectId) {
const url = `${BASE_URL}/api/${TENANT_ID}/project/${projectId}`;
const response = await fetch(url, {
method: 'DELETE',
headers: this.headers
});
if (!response.ok) throw new Error(`Failed: ${response.status}`);
return await response.json();
}
}
// Usage
const manager = new ProjectManager('your-auth-token');
const projects = await manager.listProjects();
console.log(`Found ${projects.totalCount} projects`);
```
---
## Cache
Section: Project
URL: https://docs.mindziestudio.com/mindzie_api/project/cache
Source: /docs-master/mindzieAPI/project/cache/page.md
# Project Cache
The Project Cache API manages in-memory project loading for API operations. Understanding when projects need to be loaded is essential for efficient API usage.
## Key Concepts
### Unified Cache Architecture
The API and UI share the same in-memory cache. When you load a project via the API, it's the same cache the UI uses. This means:
- **Shared State**: API operations see the same data as UI users
- **Shared Results**: Execution results are visible to both API and UI
- **No Divergence**: Impossible for API and UI to have different views of a project
### Operation Categories
API operations fall into three categories with different caching requirements:
| Category | Description | Project Load Required? | Examples |
|----------|-------------|------------------------|----------|
| **Direct DB** | Read-only operations | No | GET endpoints, tenant/user management |
| **Auto-Load** | Modification operations | **No** (auto-loads) | POST/PUT/DELETE on investigations, notebooks, blocks |
| **Requires Load** | Execution operations | **Yes** | Execute notebook, get execution results |
### Auto-Load Pattern (Simplified Workflow)
For most CRUD operations, **you don't need to explicitly load the project**. The API automatically loads the project when needed:
```python
# OLD workflow (no longer needed for CRUD):
# manager.load_project(project_id) # Not required!
# NEW workflow - just call the operation directly:
response = requests.put(
f"{BASE_URL}/api/{TENANT_ID}/{PROJECT_ID}/notebook/{notebook_id}",
json={"Name": "Updated Name"},
headers=headers
)
# Project loads automatically if needed
```
### When Explicit Load IS Required
Explicit project loading is still required for **execution operations**:
- `POST /execution/notebook/{notebookId}` - Execute notebook
- `GET /execution/notebook/{notebookId}/results` - Get execution results
- `GET /execution/status/{notebookId}` - Check execution status
---
## Load Project into Cache
**GET** `/api/{tenantId}/project/{projectId}/load`
Loads a project into the shared cache. Use this before executing notebooks.
### Path Parameters
| Parameter | Type | Required | Description |
|-----------|------|----------|-------------|
| `tenantId` | GUID | Yes | The tenant identifier |
| `projectId` | GUID | Yes | The project identifier |
### Response (200 OK)
```json
{
"projectId": "87654321-4321-4321-4321-210987654321",
"projectName": "Purchase Order Analysis",
"tenantName": "acme-corp",
"investigationCount": 5,
"notebookCount": 12,
"datasetCount": 3,
"loadedFromCache": false,
"message": "Project loaded from database"
}
```
### Response Fields
| Field | Type | Description |
|-------|------|-------------|
| `projectId` | GUID | Project identifier |
| `projectName` | string | Name of the project |
| `tenantName` | string | Name of the tenant |
| `investigationCount` | integer | Number of investigations |
| `notebookCount` | integer | Number of notebooks |
| `datasetCount` | integer | Number of datasets |
| `loadedFromCache` | boolean | True if already in cache, false if loaded from database |
| `message` | string | Human-readable status message |
### Cache Behavior
| Scenario | Response | Performance |
|----------|----------|-------------|
| First call (cache miss) | `loadedFromCache: false` | ~1000ms (database query) |
| Subsequent calls (cache hit) | `loadedFromCache: true` | ~75ms (13x faster) |
| After 30 min inactivity | Cache expires | Next call reloads |
### Cache Properties
- **Duration**: 30 minutes after last access
- **Auto-refresh**: Any API call to the project resets the 30-minute timer
- **Shared**: Same cache used by UI and API
- **Memory Management**: Automatic cleanup at 90% memory pressure
---
## Unload Project from Cache
**DELETE** `/api/{tenantId}/project/{projectId}/unload`
Removes a project from the cache, freeing memory.
### Path Parameters
| Parameter | Type | Required | Description |
|-----------|------|----------|-------------|
| `tenantId` | GUID | Yes | The tenant identifier |
| `projectId` | GUID | Yes | The project identifier |
### Response (200 OK)
```json
{
"projectId": "87654321-4321-4321-4321-210987654321",
"wasInCache": true,
"message": "Project unloaded from cache successfully"
}
```
---
## Workflow Examples
### Workflow A: CRUD Operations (Auto-Load)
For creating, updating, or deleting investigations, notebooks, or blocks:
```python
import requests
headers = {"Authorization": f"Bearer {API_KEY}"}
# Just call the operation directly - no load needed!
response = requests.post(
f"{BASE_URL}/api/{TENANT_ID}/{PROJECT_ID}/investigation",
json={"name": "New Investigation", "description": "Created via API"},
headers=headers
)
# Project auto-loads if needed
```
### Workflow B: Notebook Execution (Requires Load)
For executing notebooks and retrieving results:
```python
import requests
import time
headers = {"Authorization": f"Bearer {API_KEY}"}
# Step 1: Load project (REQUIRED for execution)
response = requests.get(
f"{BASE_URL}/api/{TENANT_ID}/project/{PROJECT_ID}/load",
headers=headers
)
print(f"Project loaded: {response.json()['projectName']}")
# Step 2: Execute notebook
response = requests.post(
f"{BASE_URL}/api/{TENANT_ID}/{PROJECT_ID}/execution/notebook/{NOTEBOOK_ID}",
headers=headers
)
print(f"Execution queued: {response.json()['status']}")
# Step 3: Poll for completion
while True:
response = requests.get(
f"{BASE_URL}/api/{TENANT_ID}/{PROJECT_ID}/execution/status/{NOTEBOOK_ID}",
headers=headers
)
status = response.json()
print(f"Status: {status['status']} ({status['progress']}%)")
if status['status'] == 'Completed':
break
time.sleep(2)
# Step 4: Get results
response = requests.get(
f"{BASE_URL}/api/{TENANT_ID}/{PROJECT_ID}/execution/notebook/{NOTEBOOK_ID}/results",
headers=headers
)
results = response.json()
# Step 5: Unload project (optional cleanup)
requests.delete(
f"{BASE_URL}/api/{TENANT_ID}/project/{PROJECT_ID}/unload",
headers=headers
)
```
---
## Implementation Examples
### cURL
```bash
# Load project into cache
curl -X GET "https://your-mindzie-instance.com/api/12345678-1234-1234-1234-123456789012/project/87654321-4321-4321-4321-210987654321/load" \
-H "Authorization: Bearer YOUR_API_KEY"
# Unload project from cache
curl -X DELETE "https://your-mindzie-instance.com/api/12345678-1234-1234-1234-123456789012/project/87654321-4321-4321-4321-210987654321/unload" \
-H "Authorization: Bearer YOUR_API_KEY"
```
### Python
```python
import requests
TENANT_ID = '12345678-1234-1234-1234-123456789012'
BASE_URL = 'https://your-mindzie-instance.com'
class ProjectCacheManager:
def __init__(self, token):
self.headers = {
'Authorization': f'Bearer {token}',
'Content-Type': 'application/json'
}
self.loaded_projects = set()
def load_project(self, project_id):
"""Load project into cache (required for execution operations)."""
url = f'{BASE_URL}/api/{TENANT_ID}/project/{project_id}/load'
response = requests.get(url, headers=self.headers)
response.raise_for_status()
result = response.json()
self.loaded_projects.add(project_id)
status = "from cache" if result['loadedFromCache'] else "from database"
print(f"Project '{result['projectName']}' loaded {status}")
return result
def unload_project(self, project_id):
"""Unload project from cache."""
url = f'{BASE_URL}/api/{TENANT_ID}/project/{project_id}/unload'
response = requests.delete(url, headers=self.headers)
response.raise_for_status()
self.loaded_projects.discard(project_id)
return response.json()
def __enter__(self):
return self
def __exit__(self, exc_type, exc_val, exc_tb):
for project_id in list(self.loaded_projects):
self.unload_project(project_id)
# Usage with context manager
with ProjectCacheManager('your-api-key') as cache:
result = cache.load_project('87654321-4321-4321-4321-210987654321')
# Execute notebooks here...
# Projects automatically unloaded when exiting
```
### JavaScript/Node.js
```javascript
const TENANT_ID = '12345678-1234-1234-1234-123456789012';
const BASE_URL = 'https://your-mindzie-instance.com';
class ProjectCacheManager {
constructor(token) {
this.headers = {
'Authorization': `Bearer ${token}`,
'Content-Type': 'application/json'
};
this.loadedProjects = new Set();
}
async loadProject(projectId) {
const url = `${BASE_URL}/api/${TENANT_ID}/project/${projectId}/load`;
const response = await fetch(url, { headers: this.headers });
if (!response.ok) throw new Error(`Failed: ${response.status}`);
const result = await response.json();
this.loadedProjects.add(projectId);
console.log(`Loaded: ${result.projectName} (from cache: ${result.loadedFromCache})`);
return result;
}
async unloadProject(projectId) {
const url = `${BASE_URL}/api/${TENANT_ID}/project/${projectId}/unload`;
const response = await fetch(url, {
method: 'DELETE',
headers: this.headers
});
this.loadedProjects.delete(projectId);
return response.json();
}
async unloadAll() {
await Promise.all(
Array.from(this.loadedProjects).map(id => this.unloadProject(id))
);
}
}
// Usage
const cache = new ProjectCacheManager('your-api-key');
try {
await cache.loadProject('87654321-4321-4321-4321-210987654321');
// Execute notebooks here...
} finally {
await cache.unloadAll();
}
```
---
## Best Practices
1. **CRUD Operations**: Don't explicitly load - let auto-load handle it
2. **Execution Operations**: Always load the project first
3. **Long-Running Clients**: Unload projects when done to free memory
4. **Context Managers**: Use `with` statements (Python) or try/finally for cleanup
5. **Memory Awareness**: The cache auto-cleans at 90% memory pressure, but explicit unloading is better
6. **Shared Cache**: Remember that UI users see the same project state as your API operations
---
## Users
Section: Project
URL: https://docs.mindziestudio.com/mindzie_api/project/users
Source: /docs-master/mindzieAPI/project/users/page.md
# Project Users
Manage user access and permissions for projects. Add users to projects, update their permission levels, and remove access when needed.
## Permission Levels
| Level | Description |
|-------|-------------|
| **Owner** (`isOwner: true`) | Full control - can modify project settings, manage users, delete project |
| **Member** (`isOwner: false`) | Can view and work with project content, cannot manage users or delete |
---
## List Project Users
**GET** `/api/{tenantId}/project/{projectId}/users`
Retrieves all users with access to the project.
### Path Parameters
| Parameter | Type | Required | Description |
|-----------|------|----------|-------------|
| `tenantId` | GUID | Yes | The tenant identifier |
| `projectId` | GUID | Yes | The project identifier |
### Response (200 OK)
```json
{
"users": [
{
"permissionId": "11111111-1111-1111-1111-111111111111",
"userId": "a1b2c3d4-e5f6-7890-abcd-ef1234567890",
"email": "john.smith@example.com",
"displayName": "John Smith",
"isOwner": true,
"dateAssigned": "2024-01-15T10:30:00Z"
},
{
"permissionId": "22222222-2222-2222-2222-222222222222",
"userId": "b2c3d4e5-f6a7-8901-bcde-f23456789012",
"email": "jane.doe@example.com",
"displayName": "Jane Doe",
"isOwner": false,
"dateAssigned": "2024-01-20T14:00:00Z"
}
],
"totalCount": 2
}
```
### User Permission Fields
| Field | Type | Description |
|-------|------|-------------|
| `permissionId` | GUID | Unique permission record ID |
| `userId` | GUID | User identifier |
| `email` | string | User's email address |
| `displayName` | string | User's display name |
| `isOwner` | boolean | Whether user is a project owner |
| `dateAssigned` | datetime | When access was granted |
---
## Add User to Project
**POST** `/api/{tenantId}/project/{projectId}/users/{userId}`
Adds a user to the project with specified permissions.
### Path Parameters
| Parameter | Type | Required | Description |
|-----------|------|----------|-------------|
| `tenantId` | GUID | Yes | The tenant identifier |
| `projectId` | GUID | Yes | The project identifier |
| `userId` | GUID | Yes | The user to add |
### Request Body (Optional)
```json
{
"isOwner": false
}
```
### Request Fields
| Field | Type | Default | Description |
|-------|------|---------|-------------|
| `isOwner` | boolean | false | Grant owner permissions |
### Response (201 Created)
```json
{
"message": "User added to project successfully"
}
```
### Error Responses
**Conflict (409):**
```json
{
"error": "User is already a member of this project"
}
```
**Not Found (404):**
```json
{
"error": "User not found with ID '{userId}'"
}
```
---
## Update User Permission
**PUT** `/api/{tenantId}/project/{projectId}/users/{userId}`
Updates a user's permission level on the project.
### Path Parameters
| Parameter | Type | Required | Description |
|-----------|------|----------|-------------|
| `tenantId` | GUID | Yes | The tenant identifier |
| `projectId` | GUID | Yes | The project identifier |
| `userId` | GUID | Yes | The user to update |
### Request Body
```json
{
"isOwner": true
}
```
### Response (200 OK)
```json
{
"message": "User permission updated successfully"
}
```
---
## Remove User from Project
**DELETE** `/api/{tenantId}/project/{projectId}/users/{userId}`
Removes a user's access to the project.
### Path Parameters
| Parameter | Type | Required | Description |
|-----------|------|----------|-------------|
| `tenantId` | GUID | Yes | The tenant identifier |
| `projectId` | GUID | Yes | The project identifier |
| `userId` | GUID | Yes | The user to remove |
### Response (200 OK)
```json
{
"message": "User removed from project successfully"
}
```
### Error Responses
**Not Found (404):**
```json
{
"error": "User is not a member of this project"
}
```
---
## Implementation Examples
### cURL
```bash
# List project users
curl -X GET "https://your-mindzie-instance.com/api/12345678-1234-1234-1234-123456789012/project/87654321-4321-4321-4321-210987654321/users" \
-H "Authorization: Bearer YOUR_ACCESS_TOKEN"
# Add user to project (as member)
curl -X POST "https://your-mindzie-instance.com/api/12345678-1234-1234-1234-123456789012/project/87654321-4321-4321-4321-210987654321/users/a1b2c3d4-e5f6-7890-abcd-ef1234567890" \
-H "Authorization: Bearer YOUR_ACCESS_TOKEN" \
-H "Content-Type: application/json" \
-d '{"isOwner": false}'
# Add user as owner
curl -X POST "https://your-mindzie-instance.com/api/12345678-1234-1234-1234-123456789012/project/87654321-4321-4321-4321-210987654321/users/a1b2c3d4-e5f6-7890-abcd-ef1234567890" \
-H "Authorization: Bearer YOUR_ACCESS_TOKEN" \
-H "Content-Type: application/json" \
-d '{"isOwner": true}'
# Promote user to owner
curl -X PUT "https://your-mindzie-instance.com/api/12345678-1234-1234-1234-123456789012/project/87654321-4321-4321-4321-210987654321/users/a1b2c3d4-e5f6-7890-abcd-ef1234567890" \
-H "Authorization: Bearer YOUR_ACCESS_TOKEN" \
-H "Content-Type: application/json" \
-d '{"isOwner": true}'
# Remove user from project
curl -X DELETE "https://your-mindzie-instance.com/api/12345678-1234-1234-1234-123456789012/project/87654321-4321-4321-4321-210987654321/users/a1b2c3d4-e5f6-7890-abcd-ef1234567890" \
-H "Authorization: Bearer YOUR_ACCESS_TOKEN"
```
### Python
```python
import requests
TENANT_ID = '12345678-1234-1234-1234-123456789012'
BASE_URL = 'https://your-mindzie-instance.com'
class ProjectUserManager:
def __init__(self, token):
self.headers = {
'Authorization': f'Bearer {token}',
'Content-Type': 'application/json'
}
def list_users(self, project_id):
"""List all users with access to the project."""
url = f'{BASE_URL}/api/{TENANT_ID}/project/{project_id}/users'
response = requests.get(url, headers=self.headers)
response.raise_for_status()
return response.json()
def add_user(self, project_id, user_id, is_owner=False):
"""Add a user to the project."""
url = f'{BASE_URL}/api/{TENANT_ID}/project/{project_id}/users/{user_id}'
payload = {'isOwner': is_owner}
response = requests.post(url, json=payload, headers=self.headers)
response.raise_for_status()
return response.json()
def update_permission(self, project_id, user_id, is_owner):
"""Update a user's permission level."""
url = f'{BASE_URL}/api/{TENANT_ID}/project/{project_id}/users/{user_id}'
payload = {'isOwner': is_owner}
response = requests.put(url, json=payload, headers=self.headers)
response.raise_for_status()
return response.json()
def remove_user(self, project_id, user_id):
"""Remove a user from the project."""
url = f'{BASE_URL}/api/{TENANT_ID}/project/{project_id}/users/{user_id}'
response = requests.delete(url, headers=self.headers)
response.raise_for_status()
return response.json()
# Usage
manager = ProjectUserManager('your-auth-token')
project_id = '87654321-4321-4321-4321-210987654321'
# List current users
result = manager.list_users(project_id)
print(f"Project has {result['totalCount']} users:")
for user in result['users']:
role = 'Owner' if user['isOwner'] else 'Member'
print(f" - {user['displayName']} ({user['email']}) - {role}")
# Add a new user as member
new_user_id = 'a1b2c3d4-e5f6-7890-abcd-ef1234567890'
manager.add_user(project_id, new_user_id, is_owner=False)
print(f"Added user {new_user_id} as member")
# Promote user to owner
manager.update_permission(project_id, new_user_id, is_owner=True)
print(f"Promoted user {new_user_id} to owner")
# Remove user
manager.remove_user(project_id, new_user_id)
print(f"Removed user {new_user_id}")
```
### JavaScript/Node.js
```javascript
const TENANT_ID = '12345678-1234-1234-1234-123456789012';
const BASE_URL = 'https://your-mindzie-instance.com';
class ProjectUserManager {
constructor(token) {
this.headers = {
'Authorization': `Bearer ${token}`,
'Content-Type': 'application/json'
};
}
async listUsers(projectId) {
const url = `${BASE_URL}/api/${TENANT_ID}/project/${projectId}/users`;
const response = await fetch(url, { headers: this.headers });
if (!response.ok) throw new Error(`Failed: ${response.status}`);
return await response.json();
}
async addUser(projectId, userId, isOwner = false) {
const url = `${BASE_URL}/api/${TENANT_ID}/project/${projectId}/users/${userId}`;
const response = await fetch(url, {
method: 'POST',
headers: this.headers,
body: JSON.stringify({ isOwner })
});
if (!response.ok) throw new Error(`Failed: ${response.status}`);
return await response.json();
}
async updatePermission(projectId, userId, isOwner) {
const url = `${BASE_URL}/api/${TENANT_ID}/project/${projectId}/users/${userId}`;
const response = await fetch(url, {
method: 'PUT',
headers: this.headers,
body: JSON.stringify({ isOwner })
});
if (!response.ok) throw new Error(`Failed: ${response.status}`);
return await response.json();
}
async removeUser(projectId, userId) {
const url = `${BASE_URL}/api/${TENANT_ID}/project/${projectId}/users/${userId}`;
const response = await fetch(url, {
method: 'DELETE',
headers: this.headers
});
if (!response.ok) throw new Error(`Failed: ${response.status}`);
return await response.json();
}
}
// Usage
const manager = new ProjectUserManager('your-auth-token');
const projectId = '87654321-4321-4321-4321-210987654321';
// List users
const users = await manager.listUsers(projectId);
console.log(`Project has ${users.totalCount} users`);
users.users.forEach(user => {
const role = user.isOwner ? 'Owner' : 'Member';
console.log(` - ${user.displayName} (${role})`);
});
// Add user as member, then promote to owner
await manager.addUser(projectId, 'user-id-here', false);
await manager.updatePermission(projectId, 'user-id-here', true);
```
---
## Best Practices
1. **Limit Owners**: Only grant owner access to users who need to manage the project
2. **Audit Access**: Regularly review project users and remove unnecessary access
3. **Use Members for Analysts**: Regular analysts should be members, not owners
4. **Document Changes**: Log permission changes for audit purposes
---
## Import & Export
Section: Project
URL: https://docs.mindziestudio.com/mindzie_api/project/import-export
Source: /docs-master/mindzieAPI/project/import-export/page.md
# Import & Export
Export projects as portable .mpz files for backup or transfer, and import them into other tenants. Also manage project thumbnail images.
## Project Packages (.mpz)
The `.mpz` format is a mindzie Package Zip containing:
- Project settings and metadata
- All datasets and their configurations
- Investigations and notebooks
- Dashboards and panels
- Blob storage files (event logs, attachments)
---
## Export Project
**GET** `/api/{tenantId}/project/{projectId}/download`
Exports the project as a .mpz (mindzie Package Zip) file.
### Path Parameters
| Parameter | Type | Required | Description |
|-----------|------|----------|-------------|
| `tenantId` | GUID | Yes | The tenant identifier |
| `projectId` | GUID | Yes | The project to export |
### Response
Returns a binary file download with:
- **Content-Type**: `application/octet-stream`
- **Filename**: `{projectName}.mpz`
### Use Cases
- **Backup**: Create regular backups of important projects
- **Migration**: Move projects between tenants or instances
- **Templates**: Export a configured project as a template for new analyses
---
## Import Project
**POST** `/api/{tenantId}/project/import`
Imports a project from a .mpz file.
### Path Parameters
| Parameter | Type | Required | Description |
|-----------|------|----------|-------------|
| `tenantId` | GUID | Yes | The target tenant |
### Request
- **Content-Type**: `multipart/form-data`
- **File parameter**: `file` (the .mpz file)
### Constraints
| Constraint | Value |
|------------|-------|
| Maximum file size | 1 GB |
| File extension | Must be `.mpz` |
| File format | Must be a valid mindzie project export |
### Response (200 OK)
```json
{
"success": true,
"projectId": "99999999-9999-9999-9999-999999999999",
"projectName": "Imported Project",
"datasetsImported": 2,
"investigationsImported": 3,
"dashboardsImported": 1,
"message": "Project imported successfully"
}
```
### Response Fields
| Field | Type | Description |
|-------|------|-------------|
| `success` | boolean | Whether import succeeded |
| `projectId` | GUID | ID of the newly created project |
| `projectName` | string | Name of the imported project |
| `datasetsImported` | integer | Number of datasets imported |
| `investigationsImported` | integer | Number of investigations imported |
| `dashboardsImported` | integer | Number of dashboards imported |
| `message` | string | Human-readable status |
### Error Responses
**Bad Request (400):**
```json
{
"success": false,
"errorMessage": "Invalid file format. Expected .mpz file."
}
```
---
## Thumbnail Management
Project thumbnails are displayed in the project list and provide visual identification.
### Get Thumbnail
**GET** `/api/{tenantId}/project/{projectId}/thumbnail`
Retrieves the project's thumbnail image.
### Response (200 OK)
```json
{
"projectId": "87654321-4321-4321-4321-210987654321",
"hasThumbnail": true,
"base64Image": "data:image/jpeg;base64,/9j/4AAQSkZJRgABAQAAAQABAAD..."
}
```
### Response Fields
| Field | Type | Description |
|-------|------|-------------|
| `projectId` | GUID | Project identifier |
| `hasThumbnail` | boolean | Whether a thumbnail exists |
| `base64Image` | string | Base64-encoded image with data URI prefix |
### Update Thumbnail
**POST** `/api/{tenantId}/project/{projectId}/thumbnail`
Updates the project's thumbnail image.
### Request Body
```json
{
"base64Image": "data:image/jpeg;base64,/9j/4AAQSkZJRgABAQAAAQABAAD..."
}
```
**Note:** The base64 string should include the data URI prefix (e.g., `data:image/jpeg;base64,` or `data:image/png;base64,`).
### Response (200 OK)
```json
{
"message": "Thumbnail updated successfully"
}
```
### Remove Thumbnail
**DELETE** `/api/{tenantId}/project/{projectId}/thumbnail`
Removes the project's thumbnail image.
### Response (200 OK)
```json
{
"message": "Thumbnail removed successfully"
}
```
---
## Implementation Examples
### cURL
```bash
# Export project to file
curl -X GET "https://your-mindzie-instance.com/api/12345678-1234-1234-1234-123456789012/project/87654321-4321-4321-4321-210987654321/download" \
-H "Authorization: Bearer YOUR_ACCESS_TOKEN" \
--output project_backup.mpz
# Import project from file
curl -X POST "https://your-mindzie-instance.com/api/12345678-1234-1234-1234-123456789012/project/import" \
-H "Authorization: Bearer YOUR_ACCESS_TOKEN" \
-F "file=@project_backup.mpz"
# Get thumbnail
curl -X GET "https://your-mindzie-instance.com/api/12345678-1234-1234-1234-123456789012/project/87654321-4321-4321-4321-210987654321/thumbnail" \
-H "Authorization: Bearer YOUR_ACCESS_TOKEN"
# Update thumbnail (from base64 file)
curl -X POST "https://your-mindzie-instance.com/api/12345678-1234-1234-1234-123456789012/project/87654321-4321-4321-4321-210987654321/thumbnail" \
-H "Authorization: Bearer YOUR_ACCESS_TOKEN" \
-H "Content-Type: application/json" \
-d '{"base64Image": "data:image/png;base64,iVBORw0KGgoAAAANSUhEUg..."}'
# Remove thumbnail
curl -X DELETE "https://your-mindzie-instance.com/api/12345678-1234-1234-1234-123456789012/project/87654321-4321-4321-4321-210987654321/thumbnail" \
-H "Authorization: Bearer YOUR_ACCESS_TOKEN"
```
### Python
```python
import requests
import base64
from pathlib import Path
TENANT_ID = '12345678-1234-1234-1234-123456789012'
BASE_URL = 'https://your-mindzie-instance.com'
class ProjectExportManager:
def __init__(self, token):
self.headers = {
'Authorization': f'Bearer {token}'
}
def export_project(self, project_id, output_path):
"""Export project to .mpz file."""
url = f'{BASE_URL}/api/{TENANT_ID}/project/{project_id}/download'
response = requests.get(url, headers=self.headers, stream=True)
response.raise_for_status()
with open(output_path, 'wb') as f:
for chunk in response.iter_content(chunk_size=8192):
f.write(chunk)
print(f"Exported to {output_path}")
return output_path
def import_project(self, file_path):
"""Import project from .mpz file."""
url = f'{BASE_URL}/api/{TENANT_ID}/project/import'
with open(file_path, 'rb') as f:
files = {'file': (Path(file_path).name, f, 'application/octet-stream')}
response = requests.post(url, headers=self.headers, files=files)
response.raise_for_status()
result = response.json()
print(f"Imported: {result['projectName']}")
print(f" Datasets: {result['datasetsImported']}")
print(f" Investigations: {result['investigationsImported']}")
print(f" Dashboards: {result['dashboardsImported']}")
return result
def get_thumbnail(self, project_id):
"""Get project thumbnail as base64."""
url = f'{BASE_URL}/api/{TENANT_ID}/project/{project_id}/thumbnail'
response = requests.get(url, headers=self.headers)
response.raise_for_status()
return response.json()
def set_thumbnail(self, project_id, image_path):
"""Set project thumbnail from image file."""
url = f'{BASE_URL}/api/{TENANT_ID}/project/{project_id}/thumbnail'
# Read and encode image
with open(image_path, 'rb') as f:
image_data = f.read()
# Determine MIME type
ext = Path(image_path).suffix.lower()
mime_type = 'image/jpeg' if ext in ['.jpg', '.jpeg'] else 'image/png'
# Create base64 data URI
base64_data = base64.b64encode(image_data).decode('utf-8')
data_uri = f'data:{mime_type};base64,{base64_data}'
headers = {**self.headers, 'Content-Type': 'application/json'}
response = requests.post(url, json={'base64Image': data_uri}, headers=headers)
response.raise_for_status()
print(f"Thumbnail updated for project {project_id}")
return response.json()
def remove_thumbnail(self, project_id):
"""Remove project thumbnail."""
url = f'{BASE_URL}/api/{TENANT_ID}/project/{project_id}/thumbnail'
response = requests.delete(url, headers=self.headers)
response.raise_for_status()
return response.json()
# Usage
manager = ProjectExportManager('your-auth-token')
project_id = '87654321-4321-4321-4321-210987654321'
# Export project for backup
manager.export_project(project_id, 'my_project_backup.mpz')
# Import into same or different tenant
result = manager.import_project('my_project_backup.mpz')
new_project_id = result['projectId']
# Set a thumbnail
manager.set_thumbnail(project_id, 'project_thumbnail.png')
# Get thumbnail
thumbnail = manager.get_thumbnail(project_id)
if thumbnail['hasThumbnail']:
print("Thumbnail exists")
```
### JavaScript/Node.js
```javascript
const fs = require('fs');
const path = require('path');
const FormData = require('form-data');
const TENANT_ID = '12345678-1234-1234-1234-123456789012';
const BASE_URL = 'https://your-mindzie-instance.com';
class ProjectExportManager {
constructor(token) {
this.headers = {
'Authorization': `Bearer ${token}`
};
}
async exportProject(projectId, outputPath) {
const url = `${BASE_URL}/api/${TENANT_ID}/project/${projectId}/download`;
const response = await fetch(url, { headers: this.headers });
if (!response.ok) {
throw new Error(`Export failed: ${response.status}`);
}
const buffer = await response.arrayBuffer();
fs.writeFileSync(outputPath, Buffer.from(buffer));
console.log(`Exported to ${outputPath}`);
}
async importProject(filePath) {
const url = `${BASE_URL}/api/${TENANT_ID}/project/import`;
const formData = new FormData();
formData.append('file', fs.createReadStream(filePath));
const response = await fetch(url, {
method: 'POST',
headers: {
...this.headers,
...formData.getHeaders()
},
body: formData
});
if (!response.ok) {
throw new Error(`Import failed: ${response.status}`);
}
const result = await response.json();
console.log(`Imported: ${result.projectName}`);
return result;
}
async setThumbnail(projectId, imagePath) {
const url = `${BASE_URL}/api/${TENANT_ID}/project/${projectId}/thumbnail`;
// Read and encode image
const imageBuffer = fs.readFileSync(imagePath);
const ext = path.extname(imagePath).toLowerCase();
const mimeType = ext === '.png' ? 'image/png' : 'image/jpeg';
const base64Data = imageBuffer.toString('base64');
const dataUri = `data:${mimeType};base64,${base64Data}`;
const response = await fetch(url, {
method: 'POST',
headers: {
...this.headers,
'Content-Type': 'application/json'
},
body: JSON.stringify({ base64Image: dataUri })
});
if (!response.ok) {
throw new Error(`Thumbnail update failed: ${response.status}`);
}
return await response.json();
}
}
// Usage
const manager = new ProjectExportManager('your-auth-token');
// Export and import
await manager.exportProject('project-id', 'backup.mpz');
const imported = await manager.importProject('backup.mpz');
// Set thumbnail
await manager.setThumbnail('project-id', 'thumbnail.png');
```
---
## Best Practices
1. **Regular Backups**: Schedule regular exports of important projects
2. **Version Naming**: Include dates in export filenames (e.g., `project_2024-01-15.mpz`)
3. **Test Imports**: Test imports in a non-production tenant before production
4. **Thumbnail Size**: Keep thumbnails under 100KB for fast loading
5. **Thumbnail Format**: Use JPEG for photos, PNG for graphics with transparency
---
## URL Generation
Section: Navigation
URL: https://docs.mindziestudio.com/mindzie_api/navigation/url-generation
Source: /docs-master/mindzieAPI/navigation/url-generation/page.md
# URL Generation
## Generate Entity URLs
**GET** `/api/{tenantId}/url/generate`
Generate direct URLs to mindzieStudio pages and entities. This API creates properly formatted URLs for navigating to projects, dashboards, investigations, notebooks, blocks, and other entities.
## Authentication
Requires Bearer token authentication:
```http
Authorization: Bearer {api_key}
```
## Request
```http
GET /api/{tenantId}/url/generate?type={urlType}&entityId={id}&parentId={parentId}
Authorization: Bearer {token}
```
### Path Parameters
| Parameter | Type | Required | Description |
|-----------|------|----------|-------------|
| `tenantId` | GUID | Yes | The tenant identifier |
### Query Parameters
| Parameter | Type | Required | Description |
|-----------|------|----------|-------------|
| `type` | String | Yes | The URL type to generate (see URL Types below) |
| `entityId` | GUID | Conditional | Entity ID for entity-specific pages |
| `parentId` | GUID | Conditional | Parent ID (projectId or notebookId depending on type) |
| `baseUrl` | String | No | Override base URL (defaults to request origin) |
## URL Types
### List Pages
These URL types return direct URLs to list/index pages:
| Type | parentId Required | Generated URL Pattern |
|------|-------------------|----------------------|
| `projects` | No | `/projects?tenantId={tenantId}` |
| `apps` | No | `/apps?tenantId={tenantId}` |
| `investigations` | Yes (projectId) | `/investigations?projectId={parentId}` |
| `dashboards-list` | Yes (projectId) | `/dashboards?projectId={parentId}` |
| `datasets` | Yes (projectId) | `/manage-datasets?projectId={parentId}` |
| `actions` | Yes (projectId) | `/actions?projectId={parentId}` |
| `bpmn` | Yes (projectId) | `/bpmn-editor?projectId={parentId}` |
### Entity Pages
These URL types return `/navigate` URLs that route to specific entities:
| Type | entityId | parentId | Description |
|------|----------|----------|-------------|
| `dashboard` | dashboardId | - | Single dashboard view |
| `analysis` | notebookId | - | Notebook/analysis page |
| `block` | blockId | notebookId | Specific block on a notebook page |
| `enrichment` | enrichmentNotebookId | projectId (optional) | Enrichment notebook |
## Response
### Response Structure
```json
{
"url": "https://your-instance.mindziestudio.com/projects?tenantId=...",
"entityType": "projects",
"entityId": null,
"tenantId": "660e8400-e29b-41d4-a716-446655440000"
}
```
### Response Fields
| Field | Type | Description |
|-------|------|-------------|
| `url` | String | The fully qualified URL to the requested page or entity |
| `entityType` | String | The type of URL generated (matches the `type` parameter) |
| `entityId` | GUID or null | The entity ID if an entity-specific URL was generated |
| `tenantId` | GUID | The tenant ID used in the request |
## Examples
### List Pages
#### Get Projects List URL
```bash
curl -H "Authorization: Bearer {api_key}" \
"https://host/api/{tenantId}/url/generate?type=projects"
```
Response:
```json
{
"url": "https://host/projects?tenantId=660e8400-e29b-41d4-a716-446655440000",
"entityType": "projects",
"entityId": null,
"tenantId": "660e8400-e29b-41d4-a716-446655440000"
}
```
#### Get Investigations for a Project
```bash
curl -H "Authorization: Bearer {api_key}" \
"https://host/api/{tenantId}/url/generate?type=investigations&parentId={projectId}"
```
Response:
```json
{
"url": "https://host/investigations?projectId=770e8400-e29b-41d4-a716-446655440001",
"entityType": "investigations",
"entityId": null,
"tenantId": "660e8400-e29b-41d4-a716-446655440000"
}
```
#### Get Dashboards List for a Project
```bash
curl -H "Authorization: Bearer {api_key}" \
"https://host/api/{tenantId}/url/generate?type=dashboards-list&parentId={projectId}"
```
### Entity Pages
#### Direct Link to a Dashboard
```bash
curl -H "Authorization: Bearer {api_key}" \
"https://host/api/{tenantId}/url/generate?type=dashboard&entityId={dashboardId}"
```
Response:
```json
{
"url": "https://host/navigate?type=dashboard&id=880e8400-e29b-41d4-a716-446655440002",
"entityType": "dashboard",
"entityId": "880e8400-e29b-41d4-a716-446655440002",
"tenantId": "660e8400-e29b-41d4-a716-446655440000"
}
```
#### Direct Link to a Notebook/Analysis
```bash
curl -H "Authorization: Bearer {api_key}" \
"https://host/api/{tenantId}/url/generate?type=analysis&entityId={notebookId}"
```
#### Direct Link to a Specific Block
```bash
curl -H "Authorization: Bearer {api_key}" \
"https://host/api/{tenantId}/url/generate?type=block&entityId={blockId}&parentId={notebookId}"
```
Response:
```json
{
"url": "https://host/navigate?type=block&id=990e8400-e29b-41d4-a716-446655440003¬ebookId=aa0e8400-e29b-41d4-a716-446655440004",
"entityType": "block",
"entityId": "990e8400-e29b-41d4-a716-446655440003",
"tenantId": "660e8400-e29b-41d4-a716-446655440000"
}
```
## JavaScript Example
```javascript
class UrlGenerator {
constructor(baseUrl, tenantId, token) {
this.baseUrl = baseUrl;
this.tenantId = tenantId;
this.headers = {
'Authorization': `Bearer ${token}`,
'Content-Type': 'application/json'
};
}
async generateUrl(type, options = {}) {
const params = new URLSearchParams({ type });
if (options.entityId) {
params.append('entityId', options.entityId);
}
if (options.parentId) {
params.append('parentId', options.parentId);
}
if (options.baseUrl) {
params.append('baseUrl', options.baseUrl);
}
const response = await fetch(
`${this.baseUrl}/api/${this.tenantId}/url/generate?${params}`,
{ headers: this.headers }
);
if (!response.ok) {
throw new Error(`Failed to generate URL: ${response.status}`);
}
return response.json();
}
// Convenience methods
async getProjectsUrl() {
return this.generateUrl('projects');
}
async getInvestigationsUrl(projectId) {
return this.generateUrl('investigations', { parentId: projectId });
}
async getDashboardUrl(dashboardId) {
return this.generateUrl('dashboard', { entityId: dashboardId });
}
async getBlockUrl(blockId, notebookId) {
return this.generateUrl('block', {
entityId: blockId,
parentId: notebookId
});
}
}
// Usage
const urlGen = new UrlGenerator(
'https://your-instance.mindziestudio.com',
'tenant-guid',
'your-api-token'
);
// Get URL to projects list
const projectsUrl = await urlGen.getProjectsUrl();
console.log('Projects URL:', projectsUrl.url);
// Get URL to a specific dashboard
const dashboardUrl = await urlGen.getDashboardUrl('dashboard-guid');
console.log('Dashboard URL:', dashboardUrl.url);
// Get URL to a specific block
const blockUrl = await urlGen.getBlockUrl('block-guid', 'notebook-guid');
console.log('Block URL:', blockUrl.url);
```
## Python Example
```python
import requests
from typing import Optional, Dict, Any
class UrlGenerator:
def __init__(self, base_url: str, tenant_id: str, token: str):
self.base_url = base_url
self.tenant_id = tenant_id
self.headers = {
'Authorization': f'Bearer {token}',
'Content-Type': 'application/json'
}
def generate_url(
self,
url_type: str,
entity_id: Optional[str] = None,
parent_id: Optional[str] = None,
base_url_override: Optional[str] = None
) -> Dict[str, Any]:
"""Generate a URL for the specified type and entity"""
params = {'type': url_type}
if entity_id:
params['entityId'] = entity_id
if parent_id:
params['parentId'] = parent_id
if base_url_override:
params['baseUrl'] = base_url_override
url = f"{self.base_url}/api/{self.tenant_id}/url/generate"
response = requests.get(url, params=params, headers=self.headers)
response.raise_for_status()
return response.json()
# Convenience methods for list pages
def get_projects_url(self) -> str:
return self.generate_url('projects')['url']
def get_investigations_url(self, project_id: str) -> str:
return self.generate_url('investigations', parent_id=project_id)['url']
def get_dashboards_list_url(self, project_id: str) -> str:
return self.generate_url('dashboards-list', parent_id=project_id)['url']
def get_datasets_url(self, project_id: str) -> str:
return self.generate_url('datasets', parent_id=project_id)['url']
def get_actions_url(self, project_id: str) -> str:
return self.generate_url('actions', parent_id=project_id)['url']
# Convenience methods for entity pages
def get_dashboard_url(self, dashboard_id: str) -> str:
return self.generate_url('dashboard', entity_id=dashboard_id)['url']
def get_analysis_url(self, notebook_id: str) -> str:
return self.generate_url('analysis', entity_id=notebook_id)['url']
def get_block_url(self, block_id: str, notebook_id: str) -> str:
return self.generate_url('block', entity_id=block_id, parent_id=notebook_id)['url']
def get_enrichment_url(self, enrichment_id: str, project_id: Optional[str] = None) -> str:
return self.generate_url('enrichment', entity_id=enrichment_id, parent_id=project_id)['url']
# Usage
url_gen = UrlGenerator(
'https://your-instance.mindziestudio.com',
'tenant-guid',
'your-api-token'
)
# Get various URLs
projects_url = url_gen.get_projects_url()
print(f"Projects: {projects_url}")
investigations_url = url_gen.get_investigations_url('project-guid')
print(f"Investigations: {investigations_url}")
dashboard_url = url_gen.get_dashboard_url('dashboard-guid')
print(f"Dashboard: {dashboard_url}")
block_url = url_gen.get_block_url('block-guid', 'notebook-guid')
print(f"Block: {block_url}")
```
## MCP Server Integration
AI coding assistants can generate URLs using the MCP server:
```
mindzie_generate_url type="dashboard" entityId="{dashboardId}"
```
See [MCP Server Integration](/mindzie_api/llm-access/mcp-server) for complete documentation.
## Use Cases
### Sharing Links
Generate shareable URLs to specific dashboards, investigations, or analysis blocks.
### Integration Workflows
Create navigation links in external systems that deep-link into mindzieStudio.
### AI Assistant Navigation
Enable AI tools to generate and open specific pages in the application.
### Automated Reporting
Include direct links to relevant dashboards or analyses in automated reports.
## Error Handling
| Status Code | Description |
|-------------|-------------|
| 200 | Success - URL generated |
| 400 | Bad Request - Invalid type or missing required parameters |
| 401 | Unauthorized - Invalid or missing authentication token |
| 404 | Not Found - Entity not found (for entity-specific URLs) |
---
## Overview
Section: Tenant
URL: https://docs.mindziestudio.com/mindzie_api/tenant/overview
Source: /docs-master/mindzieAPI/tenant/overview/page.md
# Tenant API
System-level tenant management operations for mindzieStudio. Create, list, update, and delete tenants across the platform.
**IMPORTANT:** All Tenant API endpoints require a **Global API Key**. Regular tenant-specific API keys cannot access these endpoints.
## Features
### Management
List all tenants, retrieve tenant details, create new tenants, and update tenant settings. Configure user limits, case limits, and tenant properties.
[View Management](/mindzie_api/tenant/management)
### Deletion
Permanently delete tenants with triple verification for safety. Includes best practices for data export and safe deletion workflows.
[View Deletion](/mindzie_api/tenant/deletion)
---
## Available Endpoints
| Method | Endpoint | Description |
|--------|----------|-------------|
| GET | `/api/tenant` | List all tenants |
| GET | `/api/tenant/{tenantId}` | Get tenant by ID |
| POST | `/api/tenant` | Create a tenant |
| PUT | `/api/tenant` | Update a tenant |
| DELETE | `/api/tenant` | Delete a tenant |
---
## Tenant Object Fields
| Field | Type | Description |
|-------|------|-------------|
| `tenantId` | GUID | Unique identifier for the tenant |
| `name` | string | Unique system name (used in URLs) |
| `displayName` | string | Human-readable display name |
| `description` | string | Description of the tenant |
| `caseCount` | integer | Total number of cases |
| `maxUserCount` | integer | Maximum allowed users |
| `maxAnalystCount` | integer | Maximum allowed analysts |
| `userCount` | integer | Current number of users |
| `analystCount` | integer | Current number of analysts |
| `isDisabled` | boolean | Whether the tenant is disabled |
| `isAcademic` | boolean | Whether this is an academic tenant |
| `preRelease` | boolean | Whether tenant has pre-release features |
| `dateCreated` | datetime | When the tenant was created |
---
## Authentication
| Endpoint | API Key Type | Access |
|----------|--------------|--------|
| All `/api/tenant` endpoints | Global API Key | Required |
| | Tenant API Key | 401 Unauthorized |
Global API keys can be created through the admin interface at `/admin/global-api-keys`.
See [Authentication](/mindzie_api/authentication) for details on API key types and usage.
---
## Quick Start
```bash
# List all tenants (Global API key required)
curl -X GET "https://your-mindzie-instance.com/api/tenant" \
-H "Authorization: Bearer YOUR_GLOBAL_API_KEY"
# Get a specific tenant
curl -X GET "https://your-mindzie-instance.com/api/tenant/{tenantId}" \
-H "Authorization: Bearer YOUR_GLOBAL_API_KEY"
```
---
## Important Notes
- **Global API Keys Only**: All tenant endpoints require Global API keys
- **License Limits**: Monitor tenant counts against license limits
- **Destructive Operations**: Tenant deletion is permanent and irreversible
- **Triple Verification**: Delete operations require ID, name, and display name to match exactly
- **Disable vs Delete**: Consider disabling tenants to preserve data while preventing access
---
## Management
Section: Tenant
URL: https://docs.mindziestudio.com/mindzie_api/tenant/management
Source: /docs-master/mindzieAPI/tenant/management/page.md
# Tenant Management
Create, list, retrieve, and update tenants in the mindzieStudio platform.
**IMPORTANT:** All endpoints on this page require a **Global API Key**. Tenant-specific API keys will receive a 401 Unauthorized error.
---
## List All Tenants
**GET** `/api/tenant`
Retrieves a paginated list of all tenants in the system with summary statistics.
### Query Parameters
| Parameter | Type | Default | Description |
|-----------|------|---------|-------------|
| `page` | integer | 1 | Page number for pagination |
| `pageSize` | integer | 50 | Number of items per page (max: 100) |
### Response (200 OK)
```json
{
"tenants": [
{
"tenantId": "12345678-1234-1234-1234-123456789012",
"name": "acme-corp",
"displayName": "Acme Corporation",
"description": "Main tenant for Acme Corporation",
"caseCount": 50000,
"maxUserCount": 100,
"maxAnalystCount": 20,
"analystCount": 12,
"userCount": 45,
"preRelease": false,
"isAcademic": false,
"autoload": true,
"dateCreated": "2024-01-15T10:30:00Z",
"isDisabled": false
}
],
"totalCount": 5,
"page": 1,
"pageSize": 50
}
```
### Tenant Object Fields
| Field | Type | Description |
|-------|------|-------------|
| `tenantId` | GUID | Unique identifier for the tenant |
| `name` | string | Unique system name (used in URLs) |
| `displayName` | string | Human-readable display name |
| `description` | string | Description of the tenant |
| `caseCount` | integer | Total number of cases across all datasets |
| `maxUserCount` | integer | Maximum allowed users |
| `maxAnalystCount` | integer | Maximum allowed analysts |
| `analystCount` | integer | Current number of analysts |
| `userCount` | integer | Current number of users |
| `preRelease` | boolean | Whether tenant has pre-release features |
| `isAcademic` | boolean | Whether this is an academic tenant |
| `autoload` | boolean | Whether to auto-load projects |
| `dateCreated` | datetime | When the tenant was created |
| `isDisabled` | boolean | Whether the tenant is disabled |
### Error Responses
**Unauthorized (401):**
```json
{
"error": "This endpoint requires a Global API key. Tenant-specific API keys cannot list all tenants.",
"hint": "Global API keys can be created at /admin/global-api-keys"
}
```
---
## Get Tenant by ID
**GET** `/api/tenant/{tenantId}`
Retrieves detailed information for a specific tenant by its ID.
### Path Parameters
| Parameter | Type | Required | Description |
|-----------|------|----------|-------------|
| `tenantId` | GUID | Yes | The unique identifier of the tenant |
### Response (200 OK)
```json
{
"tenantId": "12345678-1234-1234-1234-123456789012",
"name": "acme-corp",
"displayName": "Acme Corporation",
"description": "Main tenant for Acme Corporation",
"isAcademic": false,
"preRelease": false,
"maxUserCount": 100,
"maxAnalystCount": 20,
"maxCases": 100000,
"dateCreated": "2024-01-15T10:30:00Z",
"isDisabled": false
}
```
### Error Responses
**Not Found (404):**
```json
{
"error": "Tenant with ID '12345678-1234-1234-1234-123456789012' not found"
}
```
---
## Create Tenant
**POST** `/api/tenant`
Creates a new tenant in the system with all necessary infrastructure.
### Request Body
```json
{
"name": "new-tenant",
"displayName": "New Tenant Corp",
"description": "Description of the new tenant",
"maxUsers": 50,
"maxAnalyst": 10,
"maxCases": 100000,
"timeZone": "America/New_York"
}
```
### Request Fields
| Field | Type | Required | Description |
|-------|------|----------|-------------|
| `name` | string | Yes | Unique system name (3-63 chars, lowercase alphanumeric with hyphens) |
| `displayName` | string | Yes | Human-readable display name |
| `description` | string | No | Description of the tenant |
| `maxUsers` | integer | Yes | Maximum number of users |
| `maxAnalyst` | integer | Yes | Maximum number of analysts |
| `maxCases` | integer | Yes | Maximum number of cases |
| `timeZone` | string | No | Timezone for the tenant |
### Tenant Name Requirements
- 3-63 characters
- Lowercase alphanumeric with hyphens only
- No spaces or special characters
- Must be unique across all tenants
### Response (201 Created)
```json
{
"tenantId": "aabbccdd-1234-1234-1234-123456789012",
"name": "new-tenant",
"displayName": "New Tenant Corp",
"message": "Tenant 'New Tenant Corp' created successfully",
"storageContainerCreated": true
}
```
### Error Responses
**Conflict (409):**
```json
{
"error": "A tenant with name 'new-tenant' already exists"
}
```
**License Limit (429):**
```json
{
"error": "Maximum number of tenants reached. Your license allows 10 tenants.",
"hint": "Upgrade your license to create more tenants"
}
```
**Validation Error (400):**
```json
{
"error": "Validation failed",
"validationErrors": [
"Name must be between 3 and 63 characters",
"Name can only contain lowercase letters, numbers, and hyphens"
]
}
```
---
## Update Tenant
**PUT** `/api/tenant`
Updates an existing tenant's properties. Only provided fields will be updated; null values are ignored.
### Request Body
```json
{
"tenantId": "12345678-1234-1234-1234-123456789012",
"displayName": "Acme Corporation Updated",
"description": "Updated description",
"maxUsers": 100,
"maxAnalyst": 25,
"maxCases": 200000,
"timeZone": "America/New_York",
"isAcademic": false,
"preRelease": true,
"isDisabled": false
}
```
### Request Fields
| Field | Type | Required | Description |
|-------|------|----------|-------------|
| `tenantId` | GUID | Yes | The tenant to update |
| `displayName` | string | No | New display name (null = no change) |
| `description` | string | No | New description (null = no change, "" = clear) |
| `maxUsers` | integer | No | Maximum users (null = no change) |
| `maxAnalyst` | integer | No | Maximum analysts (null = no change) |
| `maxCases` | integer | No | Maximum cases (null = no change, -1 = unlimited) |
| `timeZone` | string | No | TimeZone ID (null = no change) |
| `isAcademic` | boolean | No | Academic flag (null = no change) |
| `preRelease` | boolean | No | Pre-release features (null = no change) |
| `isDisabled` | boolean | No | Disable tenant (null = no change) |
**Note:** The tenant `name` cannot be changed after creation.
### Response (200 OK)
```json
{
"tenantId": "12345678-1234-1234-1234-123456789012",
"name": "acme-corp",
"displayName": "Acme Corporation Updated",
"message": "Tenant 'acme-corp' updated successfully",
"isDisabled": false
}
```
### Error Responses
**Not Found (404):**
```json
{
"error": "Tenant with ID '12345678-1234-1234-1234-123456789012' not found"
}
```
**Validation Error (400):**
```json
{
"error": "Validation failed",
"validationErrors": ["Display name cannot exceed 255 characters"]
}
```
---
## Implementation Examples
### cURL
```bash
# List all tenants
curl -X GET "https://your-mindzie-instance.com/api/tenant?page=1&pageSize=50" \
-H "Authorization: Bearer YOUR_GLOBAL_API_KEY"
# Get specific tenant by ID
curl -X GET "https://your-mindzie-instance.com/api/tenant/12345678-1234-1234-1234-123456789012" \
-H "Authorization: Bearer YOUR_GLOBAL_API_KEY"
# Create tenant
curl -X POST "https://your-mindzie-instance.com/api/tenant" \
-H "Authorization: Bearer YOUR_GLOBAL_API_KEY" \
-H "Content-Type: application/json" \
-d '{
"name": "new-tenant",
"displayName": "New Tenant Corp",
"description": "Test tenant",
"maxUsers": 50,
"maxAnalyst": 10,
"maxCases": 100000
}'
# Update tenant
curl -X PUT "https://your-mindzie-instance.com/api/tenant" \
-H "Authorization: Bearer YOUR_GLOBAL_API_KEY" \
-H "Content-Type: application/json" \
-d '{
"tenantId": "12345678-1234-1234-1234-123456789012",
"displayName": "New Tenant Corp Updated",
"maxUsers": 100,
"isDisabled": false
}'
```
### Python
```python
import requests
BASE_URL = 'https://your-mindzie-instance.com'
class TenantManager:
def __init__(self, global_api_key):
"""Initialize with a GLOBAL API key (not tenant-specific)."""
self.headers = {
'Authorization': f'Bearer {global_api_key}',
'Content-Type': 'application/json'
}
def list_tenants(self, page=1, page_size=50):
"""List all tenants in the system."""
url = f'{BASE_URL}/api/tenant'
params = {'page': page, 'pageSize': page_size}
response = requests.get(url, headers=self.headers, params=params)
response.raise_for_status()
return response.json()
def get_tenant(self, tenant_id):
"""Get a specific tenant by ID."""
url = f'{BASE_URL}/api/tenant/{tenant_id}'
response = requests.get(url, headers=self.headers)
response.raise_for_status()
return response.json()
def create_tenant(self, name, display_name, description='', max_users=50,
max_analyst=10, max_cases=100000, timezone=None):
"""Create a new tenant."""
url = f'{BASE_URL}/api/tenant'
payload = {
'name': name,
'displayName': display_name,
'description': description,
'maxUsers': max_users,
'maxAnalyst': max_analyst,
'maxCases': max_cases
}
if timezone:
payload['timeZone'] = timezone
response = requests.post(url, json=payload, headers=self.headers)
response.raise_for_status()
return response.json()
def update_tenant(self, tenant_id, display_name=None, description=None,
max_users=None, max_analyst=None, is_disabled=None):
"""Update an existing tenant."""
url = f'{BASE_URL}/api/tenant'
payload = {'tenantId': tenant_id}
if display_name is not None:
payload['displayName'] = display_name
if description is not None:
payload['description'] = description
if max_users is not None:
payload['maxUsers'] = max_users
if max_analyst is not None:
payload['maxAnalyst'] = max_analyst
if is_disabled is not None:
payload['isDisabled'] = is_disabled
response = requests.put(url, json=payload, headers=self.headers)
response.raise_for_status()
return response.json()
# Usage
manager = TenantManager('your-global-api-key')
# List all tenants
result = manager.list_tenants()
print(f"Total tenants: {result['totalCount']}")
for tenant in result['tenants']:
print(f"- {tenant['displayName']} ({tenant['name']})")
print(f" Users: {tenant['userCount']}/{tenant['maxUserCount']}")
# Create a new tenant
new_tenant = manager.create_tenant(
name='test-tenant',
display_name='Test Tenant',
description='Created via API',
max_users=25,
max_analyst=5,
max_cases=50000
)
print(f"Created tenant: {new_tenant['tenantId']}")
# Update tenant limits
manager.update_tenant(
tenant_id=new_tenant['tenantId'],
max_users=50,
max_analyst=10
)
print("Tenant limits updated")
```
### JavaScript
```javascript
const BASE_URL = 'https://your-mindzie-instance.com';
class TenantManager {
constructor(globalApiKey) {
this.headers = {
'Authorization': `Bearer ${globalApiKey}`,
'Content-Type': 'application/json'
};
}
async listTenants(page = 1, pageSize = 50) {
const url = `${BASE_URL}/api/tenant?page=${page}&pageSize=${pageSize}`;
const response = await fetch(url, { headers: this.headers });
if (!response.ok) throw new Error(`Failed: ${response.status}`);
return await response.json();
}
async getTenant(tenantId) {
const url = `${BASE_URL}/api/tenant/${tenantId}`;
const response = await fetch(url, { headers: this.headers });
if (!response.ok) throw new Error(`Failed: ${response.status}`);
return await response.json();
}
async createTenant(config) {
const url = `${BASE_URL}/api/tenant`;
const response = await fetch(url, {
method: 'POST',
headers: this.headers,
body: JSON.stringify(config)
});
if (!response.ok) {
const error = await response.json();
throw new Error(error.error || `Failed: ${response.status}`);
}
return await response.json();
}
async updateTenant(tenantId, updates) {
const url = `${BASE_URL}/api/tenant`;
const response = await fetch(url, {
method: 'PUT',
headers: this.headers,
body: JSON.stringify({ tenantId, ...updates })
});
if (!response.ok) throw new Error(`Failed: ${response.status}`);
return await response.json();
}
}
// Usage
const manager = new TenantManager('your-global-api-key');
// List tenants
const tenants = await manager.listTenants();
console.log(`Found ${tenants.totalCount} tenants`);
// Create tenant
const newTenant = await manager.createTenant({
name: 'new-tenant',
displayName: 'New Tenant',
maxUsers: 50,
maxAnalyst: 10,
maxCases: 100000
});
console.log(`Created: ${newTenant.tenantId}`);
// Update tenant
await manager.updateTenant(newTenant.tenantId, {
displayName: 'Updated Tenant Name',
maxUsers: 100
});
```
---
## Best Practices
1. **Global API Keys**: Only use global API keys for tenant management - they have significant system-wide privileges
2. **License Awareness**: Monitor tenant counts against license limits before creating new tenants
3. **Capacity Planning**: Set appropriate user and analyst limits based on expected usage
4. **Naming Conventions**: Use consistent, lowercase naming with hyphens for tenant names
---
## Deletion
Section: Tenant
URL: https://docs.mindziestudio.com/mindzie_api/tenant/deletion
Source: /docs-master/mindzieAPI/tenant/deletion/page.md
# Tenant Deletion
Permanently delete a tenant and all related data. This operation requires triple verification for safety.
**IMPORTANT:** All endpoints on this page require a **Global API Key**. This is a **dangerous operation** that cannot be undone.
---
## Delete Tenant
**DELETE** `/api/tenant`
Permanently deletes a tenant and all related data. Requires triple verification for safety.
### WARNING
This operation is **IRREVERSIBLE**. All tenant data will be permanently deleted including:
- All projects and their datasets
- All investigations, notebooks, and dashboards
- Blob storage container and files
- Database records and settings
- User assignments to the tenant (users themselves are not deleted)
**Always export important data before deleting a tenant.**
---
## Request Body
```json
{
"tenantId": "12345678-1234-1234-1234-123456789012",
"name": "acme-corp",
"displayName": "Acme Corporation"
}
```
### Triple Verification
All three identifiers must match exactly for the deletion to proceed:
| Field | Type | Required | Description |
|-------|------|----------|-------------|
| `tenantId` | GUID | Yes | Tenant ID to delete |
| `name` | string | Yes | Tenant name (must match exactly) |
| `displayName` | string | Yes | Display name (must match exactly) |
This triple verification prevents accidental deletions by requiring you to know and confirm all three identifiers.
---
## Response (200 OK)
```json
{
"message": "Tenant 'Acme Corporation' deleted successfully",
"tenantName": "acme-corp",
"tenantDisplayName": "Acme Corporation",
"storageContainerDeleted": true
}
```
### Response Fields
| Field | Type | Description |
|-------|------|-------------|
| `message` | string | Success confirmation message |
| `tenantName` | string | The deleted tenant's system name |
| `tenantDisplayName` | string | The deleted tenant's display name |
| `storageContainerDeleted` | boolean | Whether the blob storage was deleted |
---
## Error Responses
### Not Found (404)
```json
{
"error": "Tenant not found with ID '12345678-1234-1234-1234-123456789012'"
}
```
### Verification Failed (400)
When the tenant name doesn't match:
```json
{
"error": "Tenant name 'wrong-name' does not match the tenant with ID '12345678-1234-1234-1234-123456789012'. Expected 'acme-corp'.",
"hint": "All three identifiers (ID, name, display name) must match exactly for safety"
}
```
When the display name doesn't match:
```json
{
"error": "Display name 'Wrong Name' does not match the tenant with ID '12345678-1234-1234-1234-123456789012'. Expected 'Acme Corporation'.",
"hint": "All three identifiers (ID, name, display name) must match exactly for safety"
}
```
### Unauthorized (401)
```json
{
"error": "This endpoint requires a Global API key.",
"hint": "Global API keys can be created at /admin/global-api-keys"
}
```
---
## Implementation Examples
### cURL
```bash
# Delete tenant (requires triple verification)
curl -X DELETE "https://your-mindzie-instance.com/api/tenant" \
-H "Authorization: Bearer YOUR_GLOBAL_API_KEY" \
-H "Content-Type: application/json" \
-d '{
"tenantId": "12345678-1234-1234-1234-123456789012",
"name": "test-tenant",
"displayName": "Test Tenant"
}'
```
### Python
```python
import requests
BASE_URL = 'https://your-mindzie-instance.com'
class TenantDeleter:
def __init__(self, global_api_key):
"""Initialize with a GLOBAL API key (not tenant-specific)."""
self.headers = {
'Authorization': f'Bearer {global_api_key}',
'Content-Type': 'application/json'
}
def get_tenant(self, tenant_id):
"""Get tenant details for verification."""
url = f'{BASE_URL}/api/tenant/{tenant_id}'
response = requests.get(url, headers=self.headers)
response.raise_for_status()
return response.json()
def delete_tenant(self, tenant_id, name, display_name, confirm=False):
"""
Delete a tenant with triple verification.
Args:
tenant_id: The tenant GUID
name: The tenant system name (must match exactly)
display_name: The tenant display name (must match exactly)
confirm: Set to True to actually perform deletion
"""
if not confirm:
# Verification mode - check that values match
tenant = self.get_tenant(tenant_id)
errors = []
if tenant['name'] != name:
errors.append(f"Name mismatch: expected '{tenant['name']}', got '{name}'")
if tenant['displayName'] != display_name:
errors.append(f"Display name mismatch: expected '{tenant['displayName']}', got '{display_name}'")
if errors:
raise ValueError("Verification failed:\n" + "\n".join(errors))
print(f"Verification passed for tenant '{display_name}' ({name})")
print(f" - ID: {tenant_id}")
print(f" - Users: {tenant.get('userCount', 'N/A')}")
print(f" - Cases: {tenant.get('caseCount', 'N/A')}")
print("\nCall with confirm=True to proceed with deletion.")
return None
# Perform the deletion
url = f'{BASE_URL}/api/tenant'
payload = {
'tenantId': tenant_id,
'name': name,
'displayName': display_name
}
response = requests.delete(url, json=payload, headers=self.headers)
if response.ok:
return response.json()
elif response.status_code == 404:
raise Exception(f'Tenant not found: {tenant_id}')
elif response.status_code == 400:
error = response.json()
raise Exception(f"Verification failed: {error.get('error', 'Unknown error')}")
else:
raise Exception(f'Failed to delete tenant: {response.text}')
# Usage - Safe deletion workflow
deleter = TenantDeleter('your-global-api-key')
tenant_id = '12345678-1234-1234-1234-123456789012'
tenant_name = 'test-tenant'
display_name = 'Test Tenant'
# Step 1: Verify (no deletion occurs)
try:
deleter.delete_tenant(tenant_id, tenant_name, display_name, confirm=False)
except ValueError as e:
print(f"Verification failed: {e}")
exit(1)
# Step 2: Confirm deletion (uncomment when ready)
# result = deleter.delete_tenant(tenant_id, tenant_name, display_name, confirm=True)
# print(f"Deleted: {result['message']}")
```
### JavaScript
```javascript
const BASE_URL = 'https://your-mindzie-instance.com';
class TenantDeleter {
constructor(globalApiKey) {
this.headers = {
'Authorization': `Bearer ${globalApiKey}`,
'Content-Type': 'application/json'
};
}
async getTenant(tenantId) {
const url = `${BASE_URL}/api/tenant/${tenantId}`;
const response = await fetch(url, { headers: this.headers });
if (!response.ok) throw new Error(`Failed to get tenant: ${response.status}`);
return await response.json();
}
async deleteTenant(tenantId, name, displayName, confirm = false) {
if (!confirm) {
// Verification mode
const tenant = await this.getTenant(tenantId);
const errors = [];
if (tenant.name !== name) {
errors.push(`Name mismatch: expected '${tenant.name}', got '${name}'`);
}
if (tenant.displayName !== displayName) {
errors.push(`Display name mismatch: expected '${tenant.displayName}', got '${displayName}'`);
}
if (errors.length > 0) {
throw new Error('Verification failed:\n' + errors.join('\n'));
}
console.log(`Verification passed for tenant '${displayName}' (${name})`);
console.log(` - ID: ${tenantId}`);
console.log(` - Users: ${tenant.userCount || 'N/A'}`);
console.log('\nCall with confirm=true to proceed with deletion.');
return null;
}
// Perform the deletion
const url = `${BASE_URL}/api/tenant`;
const response = await fetch(url, {
method: 'DELETE',
headers: this.headers,
body: JSON.stringify({ tenantId, name, displayName })
});
if (response.ok) {
return await response.json();
}
const error = await response.json();
throw new Error(error.error || `Delete failed: ${response.status}`);
}
}
// Usage - Safe deletion workflow
const deleter = new TenantDeleter('your-global-api-key');
const tenantId = '12345678-1234-1234-1234-123456789012';
const tenantName = 'test-tenant';
const displayName = 'Test Tenant';
// Step 1: Verify (no deletion occurs)
try {
await deleter.deleteTenant(tenantId, tenantName, displayName, false);
} catch (e) {
console.error(`Verification failed: ${e.message}`);
process.exit(1);
}
// Step 2: Confirm deletion (uncomment when ready)
// const result = await deleter.deleteTenant(tenantId, tenantName, displayName, true);
// console.log(`Deleted: ${result.message}`);
```
---
## Safety Best Practices
### Before Deletion
1. **Export All Data**: Use the Project API to export all projects as .mpz files
2. **Verify Users**: Check which users are assigned and notify them
3. **Document**: Record what is being deleted and why for audit purposes
4. **Double-Check**: Verify the tenant ID, name, and display name are correct
### During Deletion
1. **Use the Verification Pattern**: Call the delete endpoint in verify-only mode first
2. **Check Response**: Verify the response shows the correct tenant information
3. **Confirm Deliberately**: Only pass `confirm=True` after manual verification
### After Deletion
1. **Verify Deletion**: Confirm the tenant no longer appears in the tenant list
2. **Check Users**: Verify affected users can no longer access the deleted tenant
3. **Update Documentation**: Record the deletion in your system documentation
---
## Alternative: Disable Instead of Delete
Consider disabling a tenant instead of deleting it to preserve data while preventing access:
```bash
# Disable tenant (preserves data)
curl -X PUT "https://your-mindzie-instance.com/api/tenant" \
-H "Authorization: Bearer YOUR_GLOBAL_API_KEY" \
-H "Content-Type: application/json" \
-d '{
"tenantId": "12345678-1234-1234-1234-123456789012",
"isDisabled": true
}'
```
Disabled tenants:
- Users cannot log in to the tenant
- All data is preserved
- Can be re-enabled later by setting `isDisabled: false`
- Appear in the tenant list with `isDisabled: true`
This is often a safer choice than permanent deletion.
---
## Overview
Section: User
URL: https://docs.mindziestudio.com/mindzie_api/user/overview
Source: /docs-master/mindzieAPI/user/overview/page.md
# User API
Manage users across the mindzieStudio platform. Create, update, and assign users to tenants with flexible API scopes.
## Features
### Global Operations
System-wide user management with a Global API Key. List all users, create users, update properties, and manage tenant assignments across the entire platform.
[View Global Operations](/mindzie_api/user/global)
### Tenant Operations
Tenant-scoped user management that works with either Global or Tenant API Keys. Manage users within a specific tenant context.
[View Tenant Operations](/mindzie_api/user/tenant-scoped)
### Roles & Permissions
User roles define access levels and capabilities. Understand role hierarchy, service accounts, and best practices for access management.
[View Roles & Permissions](/mindzie_api/user/roles)
---
## API Scopes
The User API has two scopes:
| Scope | Base Path | API Key Required |
|-------|-----------|------------------|
| Global | `/api/user` | Global API Key |
| Tenant-scoped | `/api/tenant/{tenantId}/user` | Global or Tenant API Key |
---
## Available Endpoints
### Global User Endpoints
| Method | Endpoint | Description |
|--------|----------|-------------|
| GET | `/api/user` | List all users |
| POST | `/api/user` | Create a user |
| GET | `/api/user/{userId}` | Get user by ID |
| PUT | `/api/user/{userId}` | Update user |
| GET | `/api/user/by-email/{email}` | Get user by email |
| GET | `/api/user/{userId}/tenants` | Get user's tenants |
### Tenant-Scoped User Endpoints
| Method | Endpoint | Description |
|--------|----------|-------------|
| GET | `/api/tenant/{tenantId}/user` | List tenant users |
| POST | `/api/tenant/{tenantId}/user` | Create user in tenant |
| GET | `/api/tenant/{tenantId}/user/{userId}` | Get user in tenant |
| PUT | `/api/tenant/{tenantId}/user/{userId}` | Update user in tenant |
| GET | `/api/tenant/{tenantId}/user/by-email/{email}` | Get by email in tenant |
| POST | `/api/tenant/{tenantId}/user/{userId}` | Assign user to tenant |
| DELETE | `/api/tenant/{tenantId}/user/{userId}` | Remove from tenant |
---
## User Roles
| Role (display) | API role name | Level | Description |
|---|---|---|---|
| **Server Administrator** | `TenantAdmin` | System | Highest access. Full reach across all tenants and the server. |
| **Administrator** | `Administrator` | Tenant | Full administrative authority within a tenant. |
| **IT Admin** | `ITAdmin` | Tenant | Integrations, connections, and global API keys. |
| **Analyst** | `Analyst` | Project | Create and manage analyses, dashboards, and investigations. |
| **Developer** | `Developer` | Project | Build integrations, manage actions and apps. |
| **User** | `User` | Read-only | View dashboards and analyses; cannot modify content. |
See [Roles & Permissions](/mindzie_api/user/roles) for the full role guide.
---
## Authentication
| Endpoint Scope | API Key Type | Access |
|----------------|--------------|--------|
| Global (`/api/user`) | Global API Key | All tenants |
| Tenant-scoped | Global API Key | All tenants |
| Tenant-scoped | Tenant API Key | Own tenant only |
See [Authentication](/mindzie_api/authentication) for details on API key types and usage.
---
## Quick Start
```bash
# List all users (Global API key required)
curl -X GET "https://your-mindzie-instance.com/api/user" \
-H "Authorization: Bearer YOUR_GLOBAL_API_KEY"
# List users in a tenant (Tenant API key works)
curl -X GET "https://your-mindzie-instance.com/api/tenant/{tenantId}/user" \
-H "Authorization: Bearer YOUR_TENANT_API_KEY"
```
---
## Important Notes
- **Global vs Tenant Keys**: Use tenant-scoped keys for most operations; reserve global keys for system administration
- **User Deactivation**: Use `disabled: true` instead of deleting users to preserve audit trails
- **Service Accounts**: Only Server Administrator (`TenantAdmin`) and Administrator roles can be service accounts
- **Capacity Limits**: Tenants have configurable user and analyst limits
---
## Global Operations
Section: User
URL: https://docs.mindziestudio.com/mindzie_api/user/global
Source: /docs-master/mindzieAPI/user/global/page.md
# Global User Operations
Global user endpoints provide system-wide user management capabilities. These endpoints require a **Global API Key** and can access users across all tenants.
## Authentication
All endpoints on this page require a **Global API Key**. Tenant-scoped API keys will receive a 401 Unauthorized error.
---
## List All Users
**GET** `/api/user`
Retrieves a paginated list of all users across all tenants.
### Query Parameters
| Parameter | Type | Default | Description |
|-----------|------|---------|-------------|
| `page` | integer | 1 | Page number for pagination |
| `pageSize` | integer | 50 | Number of items per page (max: 1000) |
| `includeDisabled` | boolean | false | Include disabled users |
| `role` | string | null | Filter by role name |
| `search` | string | null | Search by email or display name |
### Response (200 OK)
```json
{
"users": [
{
"userId": "a1b2c3d4-e5f6-7890-abcd-ef1234567890",
"email": "john.smith@example.com",
"displayName": "John Smith",
"firstName": "John",
"lastName": "Smith",
"roleName": "Analyst",
"disabled": false,
"isServiceAccount": false,
"homeTenantId": null,
"homeTenantName": null,
"lastLogin": "2024-01-15T10:30:00Z",
"tenantCount": 2,
"tenantNames": "acme-corp, globex-inc",
"dateCreated": "2024-01-01T00:00:00Z"
}
],
"totalCount": 150,
"page": 1,
"pageSize": 50
}
```
### User Object Fields
| Field | Type | Description |
|-------|------|-------------|
| `userId` | GUID | Unique identifier for the user |
| `email` | string | User's email address (unique) |
| `displayName` | string | User's display name |
| `firstName` | string | User's first name |
| `lastName` | string | User's last name |
| `roleName` | string | User's role (Administrator, TenantAdmin, Analyst, etc.) |
| `disabled` | boolean | Whether the user account is disabled |
| `isServiceAccount` | boolean | Whether this is a service account |
| `homeTenantId` | GUID | Home tenant for service accounts |
| `homeTenantName` | string | Home tenant name for service accounts |
| `lastLogin` | datetime | Last login timestamp |
| `tenantCount` | integer | Number of tenants user is assigned to |
| `tenantNames` | string | Comma-separated list of tenant names |
| `dateCreated` | datetime | Account creation date |
### Error Responses
**Unauthorized (401):**
```json
{
"error": "This endpoint requires a Global API key. Tenant-specific API keys cannot list all users.",
"hint": "Use /api/tenant/{tenantId}/user to list users for a specific tenant, or create a Global API key at /admin/global-api-keys"
}
```
---
## Create User
**POST** `/api/user`
Creates a new user in the system. This does NOT assign the user to any tenants.
### Request Body
```json
{
"email": "john.smith@example.com",
"displayName": "John Smith",
"firstName": "John",
"lastName": "Smith",
"roleName": "Analyst"
}
```
### Request Fields
| Field | Type | Required | Description |
|-------|------|----------|-------------|
| `email` | string | Yes | User's email (must be unique) |
| `displayName` | string | Yes | Display name (2-100 characters) |
| `firstName` | string | No | First name (max 50 characters) |
| `lastName` | string | No | Last name (max 50 characters) |
| `roleName` | string | Yes | Role name (see [Roles & Permissions](/mindzie_api/user/roles)) |
### Response (201 Created)
```json
{
"userId": "a1b2c3d4-e5f6-7890-abcd-ef1234567890",
"email": "john.smith@example.com",
"displayName": "John Smith",
"message": "User created successfully"
}
```
### Error Responses
**Conflict (409):**
```json
{
"error": "A user with email 'john.smith@example.com' already exists"
}
```
---
## Get User by ID
**GET** `/api/user/{userId}`
Retrieves detailed information for a specific user.
### Path Parameters
| Parameter | Type | Description |
|-----------|------|-------------|
| `userId` | GUID | The user identifier |
### Response (200 OK)
Returns a full user object with tenant assignments.
### Error Responses
**Not Found (404):**
```json
{
"error": "User not found with ID 'a1b2c3d4-e5f6-7890-abcd-ef1234567890'",
"userId": "a1b2c3d4-e5f6-7890-abcd-ef1234567890"
}
```
---
## Update User
**PUT** `/api/user/{userId}`
Updates user properties. Only provided fields will be updated.
### Path Parameters
| Parameter | Type | Description |
|-----------|------|-------------|
| `userId` | GUID | The user identifier |
### Request Body
```json
{
"displayName": "Jane Smith",
"roleName": "TenantAdmin",
"disabled": false,
"isServiceAccount": true,
"homeTenantId": "12345678-1234-1234-1234-123456789012"
}
```
### Request Fields
| Field | Type | Required | Description |
|-------|------|----------|-------------|
| `displayName` | string | No | New display name |
| `roleName` | string | No | New role name |
| `disabled` | boolean | No | Enable/disable account |
| `isServiceAccount` | boolean | No | Service account flag |
| `homeTenantId` | GUID | Conditional | Required if making service account |
### Service Account Rules
- Only **Administrator** and **TenantAdmin** roles can be service accounts
- When promoting to service account, `homeTenantId` is **required**
- When demoting from service account, `homeTenantId` is automatically cleared
### Response (200 OK)
```json
{
"message": "User updated successfully"
}
```
---
## Get User by Email
**GET** `/api/user/by-email/{email}`
Retrieves a user by their email address.
### Path Parameters
| Parameter | Type | Description |
|-----------|------|-------------|
| `email` | string | The user's email address (URL encoded) |
### Response (200 OK)
Returns a full user object.
---
## Get User's Tenants
**GET** `/api/user/{userId}/tenants`
Retrieves all tenant assignments for a user.
### Path Parameters
| Parameter | Type | Description |
|-----------|------|-------------|
| `userId` | GUID | The user identifier |
### Response (200 OK)
```json
{
"userId": "a1b2c3d4-e5f6-7890-abcd-ef1234567890",
"email": "john.smith@example.com",
"displayName": "John Smith",
"tenants": [
{
"tenantId": "12345678-1234-1234-1234-123456789012",
"tenantName": "acme-corp",
"displayName": "Acme Corporation",
"dateAssigned": "2024-01-15T10:30:00Z"
}
]
}
```
---
## Implementation Examples
### cURL
```bash
# List all users (Global API key required)
curl -X GET "https://your-mindzie-instance.com/api/user?page=1&pageSize=50" \
-H "Authorization: Bearer YOUR_GLOBAL_API_KEY"
# Search for users by name
curl -X GET "https://your-mindzie-instance.com/api/user?search=john" \
-H "Authorization: Bearer YOUR_GLOBAL_API_KEY"
# Filter by role
curl -X GET "https://your-mindzie-instance.com/api/user?role=Analyst" \
-H "Authorization: Bearer YOUR_GLOBAL_API_KEY"
# Create a new user
curl -X POST "https://your-mindzie-instance.com/api/user" \
-H "Authorization: Bearer YOUR_GLOBAL_API_KEY" \
-H "Content-Type: application/json" \
-d '{
"email": "john.smith@example.com",
"displayName": "John Smith",
"roleName": "Analyst"
}'
# Get user by ID
curl -X GET "https://your-mindzie-instance.com/api/user/a1b2c3d4-e5f6-7890-abcd-ef1234567890" \
-H "Authorization: Bearer YOUR_GLOBAL_API_KEY"
# Get user by email
curl -X GET "https://your-mindzie-instance.com/api/user/by-email/john.smith%40example.com" \
-H "Authorization: Bearer YOUR_GLOBAL_API_KEY"
# Get user's tenants
curl -X GET "https://your-mindzie-instance.com/api/user/a1b2c3d4-e5f6-7890-abcd-ef1234567890/tenants" \
-H "Authorization: Bearer YOUR_GLOBAL_API_KEY"
```
### Python
```python
import requests
BASE_URL = 'https://your-mindzie-instance.com'
class GlobalUserManager:
def __init__(self, global_api_key):
"""Initialize with a GLOBAL API key (not tenant-specific)."""
self.headers = {
'Authorization': f'Bearer {global_api_key}',
'Content-Type': 'application/json'
}
def list_users(self, page=1, page_size=50, include_disabled=False,
role=None, search=None):
"""List all users across all tenants."""
url = f'{BASE_URL}/api/user'
params = {
'page': page,
'pageSize': page_size,
'includeDisabled': include_disabled
}
if role:
params['role'] = role
if search:
params['search'] = search
response = requests.get(url, headers=self.headers, params=params)
response.raise_for_status()
return response.json()
def create_user(self, email, display_name, role_name,
first_name=None, last_name=None):
"""Create a new user (not assigned to any tenant)."""
url = f'{BASE_URL}/api/user'
payload = {
'email': email,
'displayName': display_name,
'roleName': role_name
}
if first_name:
payload['firstName'] = first_name
if last_name:
payload['lastName'] = last_name
response = requests.post(url, json=payload, headers=self.headers)
response.raise_for_status()
return response.json()
def get_user(self, user_id):
"""Get user by ID."""
url = f'{BASE_URL}/api/user/{user_id}'
response = requests.get(url, headers=self.headers)
response.raise_for_status()
return response.json()
def get_user_by_email(self, email):
"""Get user by email address."""
from urllib.parse import quote
url = f'{BASE_URL}/api/user/by-email/{quote(email, safe="")}'
response = requests.get(url, headers=self.headers)
response.raise_for_status()
return response.json()
def update_user(self, user_id, display_name=None, role_name=None,
disabled=None, is_service_account=None, home_tenant_id=None):
"""Update user properties."""
url = f'{BASE_URL}/api/user/{user_id}'
payload = {}
if display_name is not None:
payload['displayName'] = display_name
if role_name is not None:
payload['roleName'] = role_name
if disabled is not None:
payload['disabled'] = disabled
if is_service_account is not None:
payload['isServiceAccount'] = is_service_account
if home_tenant_id is not None:
payload['homeTenantId'] = home_tenant_id
response = requests.put(url, json=payload, headers=self.headers)
response.raise_for_status()
return response.json()
def get_user_tenants(self, user_id):
"""Get all tenant assignments for a user."""
url = f'{BASE_URL}/api/user/{user_id}/tenants'
response = requests.get(url, headers=self.headers)
response.raise_for_status()
return response.json()
# Usage
manager = GlobalUserManager('your-global-api-key')
# List all analysts
analysts = manager.list_users(role='Analyst')
print(f"Total analysts: {analysts['totalCount']}")
# Create a new user
new_user = manager.create_user(
email='new.analyst@example.com',
display_name='New Analyst',
role_name='Analyst',
first_name='New',
last_name='Analyst'
)
print(f"Created user: {new_user['userId']}")
# Get user's tenant assignments
user_id = new_user['userId']
tenants = manager.get_user_tenants(user_id)
print(f"User is assigned to {len(tenants['tenants'])} tenants")
```
### JavaScript/Node.js
```javascript
const BASE_URL = 'https://your-mindzie-instance.com';
class GlobalUserManager {
constructor(globalApiKey) {
this.headers = {
'Authorization': `Bearer ${globalApiKey}`,
'Content-Type': 'application/json'
};
}
async listUsers(options = {}) {
const params = new URLSearchParams({
page: options.page || 1,
pageSize: options.pageSize || 50,
includeDisabled: options.includeDisabled || false
});
if (options.role) params.append('role', options.role);
if (options.search) params.append('search', options.search);
const url = `${BASE_URL}/api/user?${params}`;
const response = await fetch(url, { headers: this.headers });
if (!response.ok) throw new Error(`Failed: ${response.status}`);
return await response.json();
}
async createUser(email, displayName, roleName) {
const url = `${BASE_URL}/api/user`;
const response = await fetch(url, {
method: 'POST',
headers: this.headers,
body: JSON.stringify({ email, displayName, roleName })
});
if (!response.ok) throw new Error(`Failed: ${response.status}`);
return await response.json();
}
async getUser(userId) {
const url = `${BASE_URL}/api/user/${userId}`;
const response = await fetch(url, { headers: this.headers });
if (!response.ok) throw new Error(`Failed: ${response.status}`);
return await response.json();
}
async getUserTenants(userId) {
const url = `${BASE_URL}/api/user/${userId}/tenants`;
const response = await fetch(url, { headers: this.headers });
if (!response.ok) throw new Error(`Failed: ${response.status}`);
return await response.json();
}
}
// Usage
const manager = new GlobalUserManager('your-global-api-key');
// List all users
const users = await manager.listUsers();
console.log(`Total users: ${users.totalCount}`);
// Create and check tenant assignments
const newUser = await manager.createUser(
'new@example.com',
'New User',
'Analyst'
);
const tenants = await manager.getUserTenants(newUser.userId);
console.log(`Assigned to ${tenants.tenants.length} tenants`);
```
---
## Tenant Operations
Section: User
URL: https://docs.mindziestudio.com/mindzie_api/user/tenant-scoped
Source: /docs-master/mindzieAPI/user/tenant-scoped/page.md
# Tenant User Operations
Tenant-scoped user endpoints manage users within a specific tenant. These endpoints can be accessed with either a **Global API Key** or a **Tenant API Key**.
## Authentication
| API Key Type | Access |
|--------------|--------|
| Global API Key | Can access any tenant |
| Tenant API Key | Can only access its own tenant |
---
## List Users for Tenant
**GET** `/api/tenant/{tenantId}/user`
Retrieves users assigned to a specific tenant.
### Path Parameters
| Parameter | Type | Required | Description |
|-----------|------|----------|-------------|
| `tenantId` | GUID | Yes | The tenant identifier |
### Query Parameters
| Parameter | Type | Default | Description |
|-----------|------|---------|-------------|
| `page` | integer | 1 | Page number for pagination |
| `pageSize` | integer | 50 | Number of items per page (max: 1000) |
| `includeDisabled` | boolean | false | Include disabled users |
| `role` | string | null | Filter by role name |
| `search` | string | null | Search by email or display name |
### Response (200 OK)
Same structure as the global List All Users, but filtered to the specified tenant.
---
## Create User in Tenant
**POST** `/api/tenant/{tenantId}/user`
Creates a new user AND assigns them to the tenant, or assigns an existing user to the tenant.
**Note:** If a user with the specified email already exists, they will be assigned to the tenant instead of creating a duplicate.
### Path Parameters
| Parameter | Type | Required | Description |
|-----------|------|----------|-------------|
| `tenantId` | GUID | Yes | The tenant identifier |
### Request Body
```json
{
"email": "john.smith@example.com",
"displayName": "John Smith",
"firstName": "John",
"lastName": "Smith",
"roleName": "Analyst"
}
```
### Request Fields
| Field | Type | Required | Description |
|-------|------|----------|-------------|
| `email` | string | Yes | User's email address |
| `displayName` | string | Yes | Display name (2-100 characters) |
| `firstName` | string | No | First name (max 50 characters) |
| `lastName` | string | No | Last name (max 50 characters) |
| `roleName` | string | Yes | Role name (see [Roles & Permissions](/mindzie_api/user/roles)) |
### Capacity Validation
The operation validates tenant capacity limits:
- **MaxUsers** limit is checked for all roles
- **MaxAnalyst** limit is checked for Analyst roles
### Response (201 Created)
```json
{
"userId": "a1b2c3d4-e5f6-7890-abcd-ef1234567890",
"email": "john.smith@example.com",
"displayName": "John Smith",
"message": "User created and assigned to tenant successfully"
}
```
### Error Responses
**Conflict (409):**
```json
{
"error": "User is already assigned to this tenant"
}
```
**Capacity Exceeded (400):**
```json
{
"error": "Cannot add user: tenant has reached its maximum user limit (100)",
"hint": "Increase the tenant's user or analyst limit to add more users"
}
```
---
## Get User in Tenant
**GET** `/api/tenant/{tenantId}/user/{userId}`
Retrieves a specific user within the tenant context.
### Path Parameters
| Parameter | Type | Required | Description |
|-----------|------|----------|-------------|
| `tenantId` | GUID | Yes | The tenant identifier |
| `userId` | GUID | Yes | The user identifier |
### Response (200 OK)
Returns the user object if they are assigned to the tenant.
---
## Get User by Email in Tenant
**GET** `/api/tenant/{tenantId}/user/by-email/{email}`
Retrieves a user by email within the tenant context.
### Path Parameters
| Parameter | Type | Required | Description |
|-----------|------|----------|-------------|
| `tenantId` | GUID | Yes | The tenant identifier |
| `email` | string | Yes | The user's email (URL encoded) |
### Response (200 OK)
Returns the user object if they are assigned to the tenant.
---
## Assign Existing User to Tenant
**POST** `/api/tenant/{tenantId}/user/{userId}`
Assigns an existing user to a tenant.
### Path Parameters
| Parameter | Type | Required | Description |
|-----------|------|----------|-------------|
| `tenantId` | GUID | Yes | The tenant identifier |
| `userId` | GUID | Yes | The user identifier |
### Request Body (Optional)
```json
{
"roleName": "Analyst"
}
```
### Response (200 OK)
```json
{
"message": "User assigned to tenant successfully"
}
```
---
## Update User in Tenant
**PUT** `/api/tenant/{tenantId}/user/{userId}`
Updates a user's properties within the tenant context.
### Path Parameters
| Parameter | Type | Required | Description |
|-----------|------|----------|-------------|
| `tenantId` | GUID | Yes | The tenant identifier |
| `userId` | GUID | Yes | The user identifier |
### Request Body
```json
{
"displayName": "Updated Name",
"roleName": "TenantAdmin"
}
```
### Response (200 OK)
```json
{
"message": "User updated successfully"
}
```
---
## Remove User from Tenant
**DELETE** `/api/tenant/{tenantId}/user/{userId}`
Removes a user's assignment from a tenant. This does NOT delete the user from the system.
### Path Parameters
| Parameter | Type | Required | Description |
|-----------|------|----------|-------------|
| `tenantId` | GUID | Yes | The tenant identifier |
| `userId` | GUID | Yes | The user identifier |
### Response (200 OK)
```json
{
"message": "User removed from tenant successfully"
}
```
### Error Responses
**Not Found (404):**
```json
{
"error": "User is not assigned to this tenant"
}
```
---
## Implementation Examples
### cURL
```bash
# List users for a tenant (Tenant API key works)
curl -X GET "https://your-mindzie-instance.com/api/tenant/12345678-1234-1234-1234-123456789012/user" \
-H "Authorization: Bearer YOUR_TENANT_API_KEY"
# Search users in tenant
curl -X GET "https://your-mindzie-instance.com/api/tenant/12345678-1234-1234-1234-123456789012/user?search=john" \
-H "Authorization: Bearer YOUR_TENANT_API_KEY"
# Create user in tenant (creates user AND assigns)
curl -X POST "https://your-mindzie-instance.com/api/tenant/12345678-1234-1234-1234-123456789012/user" \
-H "Authorization: Bearer YOUR_TENANT_API_KEY" \
-H "Content-Type: application/json" \
-d '{
"email": "new.user@example.com",
"displayName": "New User",
"roleName": "Analyst"
}'
# Assign existing user to tenant
curl -X POST "https://your-mindzie-instance.com/api/tenant/12345678-1234-1234-1234-123456789012/user/a1b2c3d4-e5f6-7890-abcd-ef1234567890" \
-H "Authorization: Bearer YOUR_TENANT_API_KEY" \
-H "Content-Type: application/json" \
-d '{"roleName": "Analyst"}'
# Remove user from tenant
curl -X DELETE "https://your-mindzie-instance.com/api/tenant/12345678-1234-1234-1234-123456789012/user/a1b2c3d4-e5f6-7890-abcd-ef1234567890" \
-H "Authorization: Bearer YOUR_TENANT_API_KEY"
```
### Python
```python
import requests
BASE_URL = 'https://your-mindzie-instance.com'
class TenantUserManager:
def __init__(self, api_key, tenant_id):
"""
Initialize with an API key and tenant ID.
Works with either Global or Tenant API keys.
"""
self.headers = {
'Authorization': f'Bearer {api_key}',
'Content-Type': 'application/json'
}
self.tenant_id = tenant_id
def list_users(self, page=1, page_size=50, role=None, search=None):
"""List users assigned to this tenant."""
url = f'{BASE_URL}/api/tenant/{self.tenant_id}/user'
params = {'page': page, 'pageSize': page_size}
if role:
params['role'] = role
if search:
params['search'] = search
response = requests.get(url, headers=self.headers, params=params)
response.raise_for_status()
return response.json()
def create_user(self, email, display_name, role_name,
first_name=None, last_name=None):
"""Create a user and assign to tenant (or assign existing user)."""
url = f'{BASE_URL}/api/tenant/{self.tenant_id}/user'
payload = {
'email': email,
'displayName': display_name,
'roleName': role_name
}
if first_name:
payload['firstName'] = first_name
if last_name:
payload['lastName'] = last_name
response = requests.post(url, json=payload, headers=self.headers)
response.raise_for_status()
return response.json()
def assign_user(self, user_id, role_name=None):
"""Assign an existing user to this tenant."""
url = f'{BASE_URL}/api/tenant/{self.tenant_id}/user/{user_id}'
payload = {}
if role_name:
payload['roleName'] = role_name
response = requests.post(url, json=payload, headers=self.headers)
response.raise_for_status()
return response.json()
def remove_user(self, user_id):
"""Remove a user from this tenant (does not delete the user)."""
url = f'{BASE_URL}/api/tenant/{self.tenant_id}/user/{user_id}'
response = requests.delete(url, headers=self.headers)
response.raise_for_status()
return response.json()
def get_user(self, user_id):
"""Get a specific user in this tenant."""
url = f'{BASE_URL}/api/tenant/{self.tenant_id}/user/{user_id}'
response = requests.get(url, headers=self.headers)
response.raise_for_status()
return response.json()
# Usage with Tenant API key
tenant_id = '12345678-1234-1234-1234-123456789012'
manager = TenantUserManager('your-tenant-api-key', tenant_id)
# List all analysts in tenant
analysts = manager.list_users(role='Analyst')
print(f"Tenant has {analysts['totalCount']} analysts")
for user in analysts['users']:
print(f" - {user['displayName']} ({user['email']})")
# Add a new analyst
new_user = manager.create_user(
email='new.analyst@example.com',
display_name='New Analyst',
role_name='Analyst'
)
print(f"Added user: {new_user['userId']}")
# Remove user from tenant (user still exists in system)
manager.remove_user(new_user['userId'])
print("User removed from tenant")
```
### JavaScript/Node.js
```javascript
const BASE_URL = 'https://your-mindzie-instance.com';
class TenantUserManager {
constructor(apiKey, tenantId) {
this.headers = {
'Authorization': `Bearer ${apiKey}`,
'Content-Type': 'application/json'
};
this.tenantId = tenantId;
}
async listUsers(options = {}) {
const params = new URLSearchParams({
page: options.page || 1,
pageSize: options.pageSize || 50
});
if (options.role) params.append('role', options.role);
if (options.search) params.append('search', options.search);
const url = `${BASE_URL}/api/tenant/${this.tenantId}/user?${params}`;
const response = await fetch(url, { headers: this.headers });
if (!response.ok) throw new Error(`Failed: ${response.status}`);
return await response.json();
}
async createUser(email, displayName, roleName) {
const url = `${BASE_URL}/api/tenant/${this.tenantId}/user`;
const response = await fetch(url, {
method: 'POST',
headers: this.headers,
body: JSON.stringify({ email, displayName, roleName })
});
if (!response.ok) throw new Error(`Failed: ${response.status}`);
return await response.json();
}
async assignUser(userId, roleName = null) {
const url = `${BASE_URL}/api/tenant/${this.tenantId}/user/${userId}`;
const body = roleName ? { roleName } : {};
const response = await fetch(url, {
method: 'POST',
headers: this.headers,
body: JSON.stringify(body)
});
if (!response.ok) throw new Error(`Failed: ${response.status}`);
return await response.json();
}
async removeUser(userId) {
const url = `${BASE_URL}/api/tenant/${this.tenantId}/user/${userId}`;
const response = await fetch(url, {
method: 'DELETE',
headers: this.headers
});
if (!response.ok) throw new Error(`Failed: ${response.status}`);
return await response.json();
}
}
// Usage
const tenantId = '12345678-1234-1234-1234-123456789012';
const manager = new TenantUserManager('your-tenant-api-key', tenantId);
// List users
const users = await manager.listUsers();
console.log(`Tenant has ${users.totalCount} users`);
// Add new user
const newUser = await manager.createUser(
'new@example.com',
'New User',
'Analyst'
);
console.log(`Added: ${newUser.userId}`);
```
---
## Best Practices
1. **Use Tenant API Keys**: For most operations, tenant-scoped keys are more secure
2. **Check Capacity**: Verify tenant limits before bulk user creation
3. **Remove vs Delete**: Removing from tenant keeps user in system for other tenants
4. **Search Before Create**: Check if user exists before creating to avoid duplicates
---
## Roles & Permissions
Section: User
URL: https://docs.mindziestudio.com/mindzie_api/user/roles
Source: /docs-master/mindzieAPI/user/roles/page.md
# Roles & Permissions
User roles define access levels and capabilities within mindzieStudio. Each user is assigned a single role that determines their permissions across the platform.
When you send a `roleName` value to the API, use the exact strings shown in the **API role name** column below.
## Available Roles
| Role (display) | API role name | Scope | Description |
|---|---|---|---|
| **Server Administrator** | `TenantAdmin` | System | Highest level of access. Full reach across all tenants and the server. |
| **Administrator** | `Administrator` | Tenant | Full administrative authority within a tenant. |
| **IT Admin** | `ITAdmin` | Tenant | Integrations, connections, and global API keys. |
| **Analyst** | `Analyst` | Project | Create and manage analyses, dashboards, and investigations. |
| **Developer** | `Developer` | Project | Build integrations, manage actions and apps, view exception detail. |
| **User** | `User` | Read-only | View dashboards and analyses; cannot modify content. |
> **Note on naming.** The API role name `TenantAdmin` is the highest-privilege role in mindzieStudio — despite the name, it carries server-wide reach (manage all tenants, manage all users, server administration). For clarity this page also refers to it as **Server Administrator**. When assigning the role through the API, send `TenantAdmin`.
---
## Role Details
### Server Administrator (`TenantAdmin`)
The highest privilege level in mindzieStudio.
**Capabilities:**
- Access and manage all tenants and projects
- Create, modify, and delete tenants
- Manage all users across the system
- Open the Server Administration area (server memory, backups, executions)
- Impersonate other roles for support and testing
- Create Global API keys
- All capabilities of every other role
**Use cases:**
- Platform owners
- Trusted operators who maintain the deployment
### Administrator
Full administrative authority within a tenant, without server-wide reach.
**Capabilities:**
- Manage users within the tenant — create, edit, deactivate, reset passwords
- Assign roles within the tenant
- Manage analysis templates
- Manage all projects, dashboards, datasets, investigations, and apps within the tenant
- Create Tenant API keys
- Cannot create or delete tenants
- Cannot access the Server Administration area
**Use cases:**
- Department heads
- Customer admins running their own tenant
### IT Admin (`ITAdmin`)
Technical configuration access focused on integrations and data infrastructure.
**Capabilities:**
- Configure integrations, connections, and data sources
- Manage data and ETL operations
- Create Global API keys
- Limited authoring access — does not build dashboards or analyses
**Use cases:**
- IT staff connecting source systems
- Operators managing credentials and ETL
### Analyst
Standard user role for process mining analysis.
**Capabilities:**
- Create and manage investigations and notebooks
- Upload and configure datasets
- Create dashboards and reports
- Execute notebooks and blocks
- Manage actions and apps
- Export analysis results
**Use cases:**
- Process analysts
- Data scientists
- Business analysts
### Developer
Access to development tools and APIs.
**Capabilities:**
- Use development tools and platform APIs
- Build custom integrations and extensions
- Manage actions and apps
- View exception detail for debugging
- Create and manage analyses and dashboards
**Use cases:**
- Engineers building integrations
- Automation and API consumers
### User
Read-only access for consuming dashboards and analyses.
**Capabilities:**
- View shared dashboards
- View published analyses
- View alerts
- Export visible data
- Cannot modify any content
**Use cases:**
- Executives
- Stakeholders
- External reviewers
---
## Role Hierarchy
```
Server Administrator (TenantAdmin)
|
+-- Administrator
|
+-- Analyst, Developer, IT Admin
|
+-- User
```
`TenantAdmin` carries the broadest reach (all tenants, server administration). `Administrator` has full authority within its tenant. The remaining roles are scoped to project-level or read-only work.
---
## Service Accounts
Service accounts are special user accounts designed for API integrations and automated workflows.
### Requirements
- Only **Server Administrator** (`TenantAdmin`) and **Administrator** roles are eligible
- Service accounts must have a **home tenant** assigned
- Service accounts can authenticate via API without user login
### Configuration
To promote a user to a service account:
```json
{
"isServiceAccount": true,
"homeTenantId": "12345678-1234-1234-1234-123456789012"
}
```
To demote back to regular user:
```json
{
"isServiceAccount": false
}
```
The `homeTenantId` is automatically cleared when demoting.
### Use Cases
- CI/CD pipeline integrations
- Automated data import scripts
- Scheduled report generation
- ETL processes
- Monitoring and alerting systems
---
## Role Assignment
### When Creating Users
Specify the role in the creation request:
```json
{
"email": "john.smith@example.com",
"displayName": "John Smith",
"roleName": "Analyst"
}
```
### When Updating Users
Change the role with an update request:
```json
{
"roleName": "TenantAdmin"
}
```
Send the API role name exactly as listed in the table above (`TenantAdmin`, `Administrator`, `ITAdmin`, `Analyst`, `Developer`, or `User`).
---
## API Key Types and Roles
| API Key Type | Eligible Creator Roles | Access Scope |
|--------------|------------------------|--------------|
| Global API Key | Server Administrator (`TenantAdmin`), IT Admin (`ITAdmin`) | All tenants, all endpoints |
| Tenant API Key | Server Administrator (`TenantAdmin`), Administrator, Developer | Single tenant only |
### Global API Key Endpoints
Only Global API keys can access:
- `/api/user` - Global user management
- `/api/tenant` - Tenant management
- Cross-tenant operations
### Tenant API Key Endpoints
Tenant API keys can access:
- `/api/tenant/{tenantId}/user` - Tenant user management
- `/api/{tenantId}/project` - Project operations
- `/api/{tenantId}/dataset` - Dataset operations
- All other tenant-scoped endpoints
---
## Best Practices
### Least Privilege
Assign the minimum role necessary for each user's job function.
```
Executive viewing dashboards -> User
Analyst running investigations -> Analyst
Team lead managing a tenant -> Administrator
Platform operator managing all tenants -> Server Administrator (TenantAdmin)
```
### Service Account Security
- Create dedicated service accounts for each integration
- Use descriptive display names (e.g., "CI/CD Pipeline Service")
- Regularly rotate API keys
- Monitor service account activity
### Role Transitions
- When promoting users, verify they understand new responsibilities
- When demoting users, ensure they have access to complete their work
- Document role changes for audit purposes
### Disable vs Delete
- Prefer disabling users over deleting to preserve audit trails
- Disabled users cannot log in but their history is preserved
- Delete only when required for data privacy
---
## Implementation Examples
### Python
```python
import requests
BASE_URL = 'https://your-mindzie-instance.com'
class RoleManager:
def __init__(self, global_api_key):
self.headers = {
'Authorization': f'Bearer {global_api_key}',
'Content-Type': 'application/json'
}
def get_users_by_role(self, role_name):
"""Get all users with a specific role."""
url = f'{BASE_URL}/api/user'
params = {'role': role_name, 'pageSize': 1000}
response = requests.get(url, headers=self.headers, params=params)
response.raise_for_status()
return response.json()
def promote_to_service_account(self, user_id, home_tenant_id):
"""Promote a user to service account."""
url = f'{BASE_URL}/api/user/{user_id}'
payload = {
'isServiceAccount': True,
'homeTenantId': home_tenant_id
}
response = requests.put(url, json=payload, headers=self.headers)
response.raise_for_status()
return response.json()
def demote_from_service_account(self, user_id):
"""Demote a service account back to regular user."""
url = f'{BASE_URL}/api/user/{user_id}'
payload = {'isServiceAccount': False}
response = requests.put(url, json=payload, headers=self.headers)
response.raise_for_status()
return response.json()
def change_role(self, user_id, new_role):
"""Change a user's role. Use API role names: TenantAdmin, Administrator, ITAdmin, Analyst, Developer, User."""
url = f'{BASE_URL}/api/user/{user_id}'
payload = {'roleName': new_role}
response = requests.put(url, json=payload, headers=self.headers)
response.raise_for_status()
return response.json()
def disable_user(self, user_id):
"""Disable a user account."""
url = f'{BASE_URL}/api/user/{user_id}'
payload = {'disabled': True}
response = requests.put(url, json=payload, headers=self.headers)
response.raise_for_status()
return response.json()
# Usage
manager = RoleManager('your-global-api-key')
# List all server administrators (TenantAdmin role)
server_admins = manager.get_users_by_role('TenantAdmin')
print(f"System has {server_admins['totalCount']} server administrators")
# Promote user to service account
manager.promote_to_service_account(
user_id='a1b2c3d4-e5f6-7890-abcd-ef1234567890',
home_tenant_id='12345678-1234-1234-1234-123456789012'
)
# Promote an Analyst to Server Administrator
manager.change_role(
user_id='a1b2c3d4-e5f6-7890-abcd-ef1234567890',
new_role='TenantAdmin'
)
# Disable a user instead of deleting
manager.disable_user('departing-user-id')
```
### JavaScript
```javascript
class RoleManager {
constructor(globalApiKey) {
this.headers = {
'Authorization': `Bearer ${globalApiKey}`,
'Content-Type': 'application/json'
};
}
async getUsersByRole(roleName) {
const url = `${BASE_URL}/api/user?role=${roleName}&pageSize=1000`;
const response = await fetch(url, { headers: this.headers });
return await response.json();
}
async promoteToServiceAccount(userId, homeTenantId) {
const url = `${BASE_URL}/api/user/${userId}`;
const response = await fetch(url, {
method: 'PUT',
headers: this.headers,
body: JSON.stringify({
isServiceAccount: true,
homeTenantId
})
});
return await response.json();
}
async changeRole(userId, newRole) {
// Use API role names: TenantAdmin, Administrator, ITAdmin, Analyst, Developer, User
const url = `${BASE_URL}/api/user/${userId}`;
const response = await fetch(url, {
method: 'PUT',
headers: this.headers,
body: JSON.stringify({ roleName: newRole })
});
return await response.json();
}
}
// Usage
const manager = new RoleManager('your-global-api-key');
// Get all analysts
const analysts = await manager.getUsersByRole('Analyst');
console.log(`${analysts.totalCount} analysts in system`);
// Promote to Server Administrator
await manager.changeRole('user-id', 'TenantAdmin');
```
---
## Overview
Section: Templates
URL: https://docs.mindziestudio.com/mindzie_api/template/overview
Source: /docs-master/mindzieAPI/template/overview/page.md
# Template API Overview
Templates are reusable notebook configurations that define analysis workflows. Use the Template API to list, retrieve, create, and manage notebook templates programmatically.
## Key Concepts
### What Are Templates?
Templates are pre-configured notebook definitions containing:
- **Blocks**: Filters, calculators, insights, and other analysis components
- **MCL Text**: The configuration text that defines the notebook structure
- **Metadata**: Name, description, category, and process context
When you create a notebook from a template, all blocks and configurations are automatically applied.
### Template Types
| Type | Scope | Can Create via API? | Can Delete via API? |
|------|-------|---------------------|---------------------|
| **Global** | All tenants | No | No |
| **Tenant-Specific** | Single tenant | Yes | Yes |
Global templates are system-wide and managed through the admin interface. Tenant-specific templates can be created and managed via this API.
### Template Categories
Templates are organized into categories:
| Category | Description |
|----------|-------------|
| `Templates` | Standard analysis templates |
| `Custom` | User-created custom templates |
| `BaseKnowledge` | Foundational knowledge templates |
---
## Authentication
All Template API endpoints require a **Global API Key**. Tenant API keys cannot access template operations.
```bash
curl -H "Authorization: Bearer YOUR_GLOBAL_API_KEY" \
https://your-mindzie-instance.com/api/templates
```
If you use a non-global API key, you'll receive:
```json
{
"error": "This endpoint requires a Global API key.",
"hint": "Global API keys can be created at /admin/global-api-keys"
}
```
---
## API Endpoints
| Method | Endpoint | Description |
|--------|----------|-------------|
| GET | `/api/templates` | List all global templates |
| GET | `/api/templates/tenant/{tenantId}` | List templates for a tenant (global + tenant-specific) |
| GET | `/api/templates/category/{category}` | List templates by category |
| GET | `/api/templates/{templateId}` | Get template details with MCL text |
| GET | `/api/templates/{templateId}/thumbnail` | Get template thumbnail image |
| POST | `/api/templates/tenant/{tenantId}` | Create a tenant-specific template |
| PUT | `/api/templates/{templateId}` | Update a template |
| DELETE | `/api/templates/{templateId}` | Delete a template |
---
## Quick Start
### List All Templates for a Tenant
```bash
curl -X GET "https://your-mindzie-instance.com/api/templates/tenant/12345678-1234-1234-1234-123456789012" \
-H "Authorization: Bearer YOUR_GLOBAL_API_KEY"
```
### Get Template Details
```bash
curl -X GET "https://your-mindzie-instance.com/api/templates/aaaaaaaa-bbbb-cccc-dddd-eeeeeeeeeeee" \
-H "Authorization: Bearer YOUR_GLOBAL_API_KEY"
```
### Create a Notebook from Template
Use the Notebook API to create a notebook from a template:
```bash
curl -X POST "https://your-mindzie-instance.com/api/{tenantId}/{projectId}/notebook/investigation/{investigationId}/from-template" \
-H "Authorization: Bearer YOUR_API_KEY" \
-H "Content-Type: application/json" \
-d '{
"templateId": "aaaaaaaa-bbbb-cccc-dddd-eeeeeeeeeeee",
"name": "My Analysis"
}'
```
---
## Response Structure
### Template List Response
```json
{
"templates": [
{
"templateId": "aaaaaaaa-bbbb-cccc-dddd-eeeeeeeeeeee",
"name": "Process Discovery",
"description": "Standard process discovery workflow",
"category": "Templates",
"processName": "Order to Cash",
"tenantId": null,
"isGlobal": true,
"hasThumbnail": true,
"autoAddedDefaultSortOrder": 100,
"dateModified": "2024-01-15T10:30:00Z"
}
],
"totalCount": 1
}
```
### Template Detail Response
```json
{
"templateId": "aaaaaaaa-bbbb-cccc-dddd-eeeeeeeeeeee",
"name": "Process Discovery",
"description": "Standard process discovery workflow",
"category": "Templates",
"processName": "Order to Cash",
"mclText": "// MCL configuration text here...",
"tenantId": null,
"isGlobal": true,
"hasThumbnail": true,
"autoAddedDefaultSortOrder": 100,
"originatingNotebookId": null,
"dateCreated": "2024-01-01T00:00:00Z",
"dateModified": "2024-01-15T10:30:00Z",
"createdBy": null,
"createdByName": "System",
"modifiedBy": null,
"modifiedByName": "System"
}
```
---
## What's Next?
- [Template Management](/mindzie_api/template/management) - Full CRUD operations for templates
- [Notebook API](/mindzie_api/notebook) - Create notebooks from templates
---
## Management
Section: Templates
URL: https://docs.mindziestudio.com/mindzie_api/template/management
Source: /docs-master/mindzieAPI/template/management/page.md
# Template Management
Full CRUD operations for managing notebook templates. All endpoints require a Global API Key.
---
## List Global Templates
**GET** `/api/templates`
Returns all global templates available across all tenants.
### Response (200 OK)
```json
{
"templates": [
{
"templateId": "aaaaaaaa-bbbb-cccc-dddd-eeeeeeeeeeee",
"name": "Process Discovery",
"description": "Standard process discovery workflow",
"category": "Templates",
"processName": "Order to Cash",
"tenantId": null,
"isGlobal": true,
"hasThumbnail": true,
"autoAddedDefaultSortOrder": 100,
"dateModified": "2024-01-15T10:30:00Z"
}
],
"totalCount": 1
}
```
---
## List Templates for Tenant
**GET** `/api/templates/tenant/{tenantId}`
Returns all templates available to a specific tenant, including both global and tenant-specific templates.
### Path Parameters
| Parameter | Type | Required | Description |
|-----------|------|----------|-------------|
| `tenantId` | GUID | Yes | The tenant identifier |
### Response (200 OK)
```json
{
"templates": [
{
"templateId": "aaaaaaaa-bbbb-cccc-dddd-eeeeeeeeeeee",
"name": "Process Discovery",
"description": "Standard process discovery workflow",
"category": "Templates",
"processName": "Order to Cash",
"tenantId": null,
"isGlobal": true,
"hasThumbnail": true,
"autoAddedDefaultSortOrder": 100,
"dateCreated": "2024-01-01T00:00:00Z",
"dateModified": "2024-01-15T10:30:00Z",
"createdByName": "System",
"modifiedByName": "System"
},
{
"templateId": "bbbbbbbb-cccc-dddd-eeee-ffffffffffff",
"name": "Custom Analysis",
"description": "Tenant-specific custom analysis",
"category": "Custom",
"processName": null,
"tenantId": "12345678-1234-1234-1234-123456789012",
"isGlobal": false,
"hasThumbnail": false,
"autoAddedDefaultSortOrder": 0,
"dateCreated": "2024-02-01T09:00:00Z",
"dateModified": "2024-02-15T14:30:00Z",
"createdByName": "API",
"modifiedByName": "API"
}
],
"totalCount": 2
}
```
---
## List Templates by Category
**GET** `/api/templates/category/{category}`
Returns templates filtered by category.
### Path Parameters
| Parameter | Type | Required | Description |
|-----------|------|----------|-------------|
| `category` | string | Yes | Category name: `Templates`, `Custom`, or `BaseKnowledge` |
### Query Parameters
| Parameter | Type | Required | Description |
|-----------|------|----------|-------------|
| `tenantId` | GUID | No | Filter to specific tenant's templates |
### Example
```bash
# Get all custom templates
curl -X GET "https://your-mindzie-instance.com/api/templates/category/Custom" \
-H "Authorization: Bearer YOUR_GLOBAL_API_KEY"
# Get custom templates for a specific tenant
curl -X GET "https://your-mindzie-instance.com/api/templates/category/Custom?tenantId=12345678-1234-1234-1234-123456789012" \
-H "Authorization: Bearer YOUR_GLOBAL_API_KEY"
```
---
## Get Template Details
**GET** `/api/templates/{templateId}`
Returns full template details including the MCL configuration text.
### Path Parameters
| Parameter | Type | Required | Description |
|-----------|------|----------|-------------|
| `templateId` | GUID | Yes | The template identifier |
### Response (200 OK)
```json
{
"templateId": "aaaaaaaa-bbbb-cccc-dddd-eeeeeeeeeeee",
"name": "Process Discovery",
"description": "Standard process discovery workflow with variant analysis",
"category": "Templates",
"processName": "Order to Cash",
"mclText": "// MCL configuration defining notebook blocks and settings\n{\n \"blocks\": [...],\n \"settings\": {...}\n}",
"tenantId": null,
"isGlobal": true,
"hasThumbnail": true,
"autoAddedDefaultSortOrder": 100,
"originatingNotebookId": null,
"dateCreated": "2024-01-01T00:00:00Z",
"dateModified": "2024-01-15T10:30:00Z",
"createdBy": null,
"createdByName": "System",
"modifiedBy": null,
"modifiedByName": "System"
}
```
### Response Fields
| Field | Type | Description |
|-------|------|-------------|
| `templateId` | GUID | Unique identifier |
| `name` | string | Template name |
| `description` | string | Template description |
| `category` | string | Category (Templates, Custom, BaseKnowledge) |
| `processName` | string | Associated process name |
| `mclText` | string | MCL configuration text |
| `tenantId` | GUID | Tenant ID (null for global templates) |
| `isGlobal` | boolean | True if this is a global template |
| `hasThumbnail` | boolean | True if thumbnail image exists |
| `autoAddedDefaultSortOrder` | integer | Display sort order |
| `originatingNotebookId` | GUID | Source notebook if created from existing notebook |
| `dateCreated` | datetime | Creation timestamp |
| `dateModified` | datetime | Last modification timestamp |
| `createdBy` | GUID | Creator user ID |
| `createdByName` | string | Creator user name |
| `modifiedBy` | GUID | Last modifier user ID |
| `modifiedByName` | string | Last modifier user name |
### Error Responses
**Not Found (404)**
```json
{
"error": "Template with ID 'aaaaaaaa-bbbb-cccc-dddd-eeeeeeeeeeee' not found"
}
```
---
## Get Template Thumbnail
**GET** `/api/templates/{templateId}/thumbnail`
Returns the thumbnail image for a template.
### Path Parameters
| Parameter | Type | Required | Description |
|-----------|------|----------|-------------|
| `templateId` | GUID | Yes | The template identifier |
### Response (200 OK)
Returns JPEG image data with `Content-Type: image/jpeg`.
### Error Responses
**Not Found (404)**
```json
{
"error": "Thumbnail not found for template 'aaaaaaaa-bbbb-cccc-dddd-eeeeeeeeeeee'"
}
```
---
## Create Template
**POST** `/api/templates/tenant/{tenantId}`
Creates a new tenant-specific template. Global templates cannot be created via API.
### Path Parameters
| Parameter | Type | Required | Description |
|-----------|------|----------|-------------|
| `tenantId` | GUID | Yes | The tenant identifier |
### Request Body
```json
{
"name": "Custom Analysis Template",
"description": "Custom analysis workflow for monthly reporting",
"mclText": "// MCL configuration text",
"category": "Custom",
"processName": "Monthly Report",
"isGlobal": false,
"autoAddedDefaultSortOrder": 0
}
```
### Request Fields
| Field | Type | Required | Description |
|-------|------|----------|-------------|
| `name` | string | Yes | Template name (must be unique) |
| `description` | string | No | Template description |
| `mclText` | string | Yes | MCL configuration text |
| `category` | string | No | Category (default: "Custom") |
| `processName` | string | No | Associated process name |
| `isGlobal` | boolean | No | Must be false for API creation |
| `autoAddedDefaultSortOrder` | integer | No | Display sort order |
### Response (201 Created)
```json
{
"templateId": "cccccccc-dddd-eeee-ffff-000000000000",
"name": "Custom Analysis Template",
"description": "Custom analysis workflow for monthly reporting",
"category": "Custom",
"processName": "Monthly Report",
"mclText": "// MCL configuration text",
"tenantId": "12345678-1234-1234-1234-123456789012",
"isGlobal": false,
"hasThumbnail": false,
"autoAddedDefaultSortOrder": 0,
"dateCreated": "2024-03-01T10:00:00Z",
"dateModified": "2024-03-01T10:00:00Z",
"createdByName": "API"
}
```
### Error Responses
**Bad Request (400) - Validation Failed**
```json
{
"error": "Validation failed",
"validationErrors": ["Name is required", "MclText is required"]
}
```
**Conflict (409) - Duplicate Name**
```json
{
"error": "A template with this name already exists"
}
```
---
## Update Template
**PUT** `/api/templates/{templateId}`
Updates an existing tenant-specific template. Global templates cannot be updated via API.
### Path Parameters
| Parameter | Type | Required | Description |
|-----------|------|----------|-------------|
| `templateId` | GUID | Yes | The template identifier |
### Request Body
```json
{
"name": "Updated Template Name",
"description": "Updated description",
"mclText": "// Updated MCL configuration",
"category": "Custom",
"processName": "Updated Process",
"autoAddedDefaultSortOrder": 10
}
```
All fields are optional - only provided fields will be updated.
### Response (200 OK)
Returns the updated template details.
### Error Responses
**Bad Request (400) - Global Template**
```json
{
"error": "Cannot update global templates through the API"
}
```
**Not Found (404)**
```json
{
"error": "Template not found"
}
```
**Conflict (409) - Duplicate Name**
```json
{
"error": "A template with this name already exists"
}
```
---
## Delete Template
**DELETE** `/api/templates/{templateId}`
Deletes a tenant-specific template. Global templates cannot be deleted via API.
### Path Parameters
| Parameter | Type | Required | Description |
|-----------|------|----------|-------------|
| `templateId` | GUID | Yes | The template identifier |
### Response (200 OK)
```json
{
"message": "Template deleted successfully"
}
```
### Error Responses
**Bad Request (400) - Global Template**
```json
{
"error": "Cannot delete global templates"
}
```
**Not Found (404)**
```json
{
"error": "Template not found"
}
```
---
## Implementation Examples
### cURL
```bash
# List all templates for a tenant
curl -X GET "https://your-mindzie-instance.com/api/templates/tenant/12345678-1234-1234-1234-123456789012" \
-H "Authorization: Bearer YOUR_GLOBAL_API_KEY"
# Get template details
curl -X GET "https://your-mindzie-instance.com/api/templates/aaaaaaaa-bbbb-cccc-dddd-eeeeeeeeeeee" \
-H "Authorization: Bearer YOUR_GLOBAL_API_KEY"
# Create a template
curl -X POST "https://your-mindzie-instance.com/api/templates/tenant/12345678-1234-1234-1234-123456789012" \
-H "Authorization: Bearer YOUR_GLOBAL_API_KEY" \
-H "Content-Type: application/json" \
-d '{
"name": "My Custom Template",
"description": "Custom analysis workflow",
"mclText": "// MCL configuration",
"category": "Custom"
}'
# Update a template
curl -X PUT "https://your-mindzie-instance.com/api/templates/cccccccc-dddd-eeee-ffff-000000000000" \
-H "Authorization: Bearer YOUR_GLOBAL_API_KEY" \
-H "Content-Type: application/json" \
-d '{"name": "Updated Name"}'
# Delete a template
curl -X DELETE "https://your-mindzie-instance.com/api/templates/cccccccc-dddd-eeee-ffff-000000000000" \
-H "Authorization: Bearer YOUR_GLOBAL_API_KEY"
```
### Python
```python
import requests
BASE_URL = 'https://your-mindzie-instance.com'
TENANT_ID = '12345678-1234-1234-1234-123456789012'
class TemplateManager:
def __init__(self, global_api_key):
self.headers = {
'Authorization': f'Bearer {global_api_key}',
'Content-Type': 'application/json'
}
def list_templates(self, tenant_id=None):
"""List templates, optionally filtered by tenant."""
if tenant_id:
url = f'{BASE_URL}/api/templates/tenant/{tenant_id}'
else:
url = f'{BASE_URL}/api/templates'
response = requests.get(url, headers=self.headers)
response.raise_for_status()
return response.json()
def get_template(self, template_id):
"""Get template details including MCL text."""
url = f'{BASE_URL}/api/templates/{template_id}'
response = requests.get(url, headers=self.headers)
response.raise_for_status()
return response.json()
def create_template(self, tenant_id, name, mcl_text, description=None, category='Custom'):
"""Create a new tenant-specific template."""
url = f'{BASE_URL}/api/templates/tenant/{tenant_id}'
data = {
'name': name,
'mclText': mcl_text,
'description': description,
'category': category
}
response = requests.post(url, json=data, headers=self.headers)
response.raise_for_status()
return response.json()
def update_template(self, template_id, **kwargs):
"""Update a template. Pass only fields to update."""
url = f'{BASE_URL}/api/templates/{template_id}'
response = requests.put(url, json=kwargs, headers=self.headers)
response.raise_for_status()
return response.json()
def delete_template(self, template_id):
"""Delete a tenant-specific template."""
url = f'{BASE_URL}/api/templates/{template_id}'
response = requests.delete(url, headers=self.headers)
response.raise_for_status()
return response.json()
# Usage
manager = TemplateManager('your-global-api-key')
# List templates
templates = manager.list_templates(TENANT_ID)
print(f"Found {templates['totalCount']} templates")
for t in templates['templates']:
print(f" - {t['name']} ({'Global' if t['isGlobal'] else 'Tenant'})")
# Create a template
new_template = manager.create_template(
tenant_id=TENANT_ID,
name='My Analysis Template',
mcl_text='// MCL configuration here',
description='Custom workflow'
)
print(f"Created template: {new_template['templateId']}")
# Update the template
updated = manager.update_template(
new_template['templateId'],
name='Renamed Template'
)
# Delete the template
manager.delete_template(new_template['templateId'])
print("Template deleted")
```
### JavaScript/Node.js
```javascript
const BASE_URL = 'https://your-mindzie-instance.com';
const TENANT_ID = '12345678-1234-1234-1234-123456789012';
class TemplateManager {
constructor(globalApiKey) {
this.headers = {
'Authorization': `Bearer ${globalApiKey}`,
'Content-Type': 'application/json'
};
}
async listTemplates(tenantId = null) {
const url = tenantId
? `${BASE_URL}/api/templates/tenant/${tenantId}`
: `${BASE_URL}/api/templates`;
const response = await fetch(url, { headers: this.headers });
if (!response.ok) throw new Error(`Failed: ${response.status}`);
return response.json();
}
async getTemplate(templateId) {
const url = `${BASE_URL}/api/templates/${templateId}`;
const response = await fetch(url, { headers: this.headers });
if (!response.ok) throw new Error(`Failed: ${response.status}`);
return response.json();
}
async createTemplate(tenantId, name, mclText, description = null, category = 'Custom') {
const url = `${BASE_URL}/api/templates/tenant/${tenantId}`;
const response = await fetch(url, {
method: 'POST',
headers: this.headers,
body: JSON.stringify({ name, mclText, description, category })
});
if (!response.ok) throw new Error(`Failed: ${response.status}`);
return response.json();
}
async updateTemplate(templateId, updates) {
const url = `${BASE_URL}/api/templates/${templateId}`;
const response = await fetch(url, {
method: 'PUT',
headers: this.headers,
body: JSON.stringify(updates)
});
if (!response.ok) throw new Error(`Failed: ${response.status}`);
return response.json();
}
async deleteTemplate(templateId) {
const url = `${BASE_URL}/api/templates/${templateId}`;
const response = await fetch(url, {
method: 'DELETE',
headers: this.headers
});
if (!response.ok) throw new Error(`Failed: ${response.status}`);
return response.json();
}
}
// Usage
const manager = new TemplateManager('your-global-api-key');
// List templates
const templates = await manager.listTemplates(TENANT_ID);
console.log(`Found ${templates.totalCount} templates`);
// Create a template
const newTemplate = await manager.createTemplate(
TENANT_ID,
'My Analysis Template',
'// MCL configuration',
'Custom workflow'
);
console.log(`Created: ${newTemplate.templateId}`);
// Delete the template
await manager.deleteTemplate(newTemplate.templateId);
```
---
## Best Practices
1. **Use Global API Keys**: Template operations require global API keys
2. **Unique Names**: Template names must be unique within their scope
3. **MCL Text**: Store complete MCL configuration for reproducible notebooks
4. **Categories**: Use standard categories for organization
5. **Thumbnails**: Templates created via API won't have thumbnails automatically
---
## Overview
Section: Notebooks
URL: https://docs.mindziestudio.com/mindzie_api/notebook/overview
Source: /docs-master/mindzieAPI/notebook/overview/page.md
# Notebook API Overview
Notebooks are containers for analysis blocks that define process mining workflows within investigations. Use the Notebook API to create, manage, and execute analysis workflows programmatically.
## Key Concepts
### What Are Notebooks?
Notebooks contain ordered sequences of analysis blocks:
- **Filters**: Narrow down the data to specific cases or events
- **Calculators**: Compute metrics, durations, and derived values
- **Insights**: Generate visualizations and statistical analysis
- **Dashboards**: Create shareable reports
Blocks are executed in order, with each block receiving data from its parent block.
### Notebook Types
| Type | Value | Description |
|------|-------|-------------|
| Standard | 0 | Regular analysis notebook |
| Template | 1 | Template-based notebook |
| BaseKnowledge | 2 | Foundational knowledge notebook |
### Auto-Load Behavior
Notebook CRUD operations **automatically load the project** into the shared cache. You don't need to explicitly call `/project/{id}/load` before creating, updating, or deleting notebooks.
```python
# Just call the operation directly - project loads automatically
response = requests.post(
f"{BASE_URL}/api/{TENANT_ID}/{PROJECT_ID}/notebook/investigation/{investigation_id}",
json={"name": "New Notebook"},
headers=headers
)
```
### Optimistic Locking
Update operations support optional conflict detection using `DateModified`:
```python
# Include DateModified to detect concurrent modifications
response = requests.put(
f"{BASE_URL}/api/{TENANT_ID}/{PROJECT_ID}/notebook/{notebook_id}",
json={
"name": "Updated Name",
"dateModified": "2024-01-15T10:30:00Z" # From your last GET
},
headers=headers
)
# If another user modified the notebook, returns 409 Conflict
```
---
## API Endpoints
### Notebook CRUD
| Method | Endpoint | Description |
|--------|----------|-------------|
| GET | `/api/{tenantId}/{projectId}/notebook/investigation/{investigationId}` | List notebooks in investigation |
| POST | `/api/{tenantId}/{projectId}/notebook/investigation/{investigationId}` | Create notebook |
| POST | `/api/{tenantId}/{projectId}/notebook/investigation/{investigationId}/from-template` | Create from template |
| GET | `/api/{tenantId}/{projectId}/notebook/{notebookId}` | Get notebook details |
| PUT | `/api/{tenantId}/{projectId}/notebook/{notebookId}` | Update notebook |
| DELETE | `/api/{tenantId}/{projectId}/notebook/{notebookId}` | Delete notebook |
| POST | `/api/{tenantId}/{projectId}/notebook/{notebookId}/copy` | Copy notebook |
### Block Operations
| Method | Endpoint | Description |
|--------|----------|-------------|
| GET | `/api/{tenantId}/{projectId}/notebook/{notebookId}/blocks` | List blocks |
| POST | `/api/{tenantId}/{projectId}/notebook/{notebookId}/blocks` | Create block |
| GET | `/api/{tenantId}/{projectId}/notebook/{notebookId}/blocks/order` | Get block order |
| PUT | `/api/{tenantId}/{projectId}/notebook/{notebookId}/blocks/order` | Reorder blocks |
### Utility
| Method | Endpoint | Description |
|--------|----------|-------------|
| GET | `/api/{tenantId}/{projectId}/notebook/{notebookId}/url` | Generate shareable URL |
| GET | `/api/{tenantId}/{projectId}/notebook/ping` | Authenticated connectivity test |
| GET | `/api/{tenantId}/{projectId}/notebook/unauthorized-ping` | Public connectivity test |
---
## Quick Start
### List Notebooks in an Investigation
```bash
curl -X GET "https://your-mindzie-instance.com/api/{tenantId}/{projectId}/notebook/investigation/{investigationId}" \
-H "Authorization: Bearer YOUR_API_KEY"
```
### Create a Notebook
```bash
curl -X POST "https://your-mindzie-instance.com/api/{tenantId}/{projectId}/notebook/investigation/{investigationId}" \
-H "Authorization: Bearer YOUR_API_KEY" \
-H "Content-Type: application/json" \
-d '{"name": "My Analysis", "description": "Process analysis workflow"}'
```
### Create from Template
```bash
curl -X POST "https://your-mindzie-instance.com/api/{tenantId}/{projectId}/notebook/investigation/{investigationId}/from-template" \
-H "Authorization: Bearer YOUR_API_KEY" \
-H "Content-Type: application/json" \
-d '{"templateId": "aaaaaaaa-bbbb-cccc-dddd-eeeeeeeeeeee", "name": "My Analysis"}'
```
---
## Response Structure
### Notebook Response
```json
{
"notebookId": "aaaaaaaa-bbbb-cccc-dddd-eeeeeeeeeeee",
"investigationId": "11111111-2222-3333-4444-555555555555",
"name": "Main Analysis",
"description": "Primary process analysis workflow",
"dateCreated": "2024-01-15T10:30:00Z",
"dateModified": "2024-01-20T14:45:00Z",
"createdBy": "a1b2c3d4-e5f6-7890-abcd-ef1234567890",
"modifiedBy": "a1b2c3d4-e5f6-7890-abcd-ef1234567890",
"notebookType": 0,
"notebookOrder": 1.0,
"lastExecutionDuration": 2.5,
"blockCount": 12
}
```
### Response Fields
| Field | Type | Description |
|-------|------|-------------|
| `notebookId` | GUID | Unique notebook identifier |
| `investigationId` | GUID | Parent investigation ID |
| `name` | string | Notebook name |
| `description` | string | Notebook description |
| `dateCreated` | datetime | Creation timestamp |
| `dateModified` | datetime | Last modification timestamp |
| `createdBy` | GUID | Creator user ID |
| `modifiedBy` | GUID | Last modifier user ID |
| `notebookType` | integer | Type (0=Standard, 1=Template, 2=BaseKnowledge) |
| `notebookOrder` | decimal | Display order within investigation |
| `lastExecutionDuration` | double | Last execution time in seconds |
| `blockCount` | integer | Number of blocks in notebook |
---
## What's Next?
- [Notebook Management](/mindzie_api/notebook/management) - Full CRUD operations
- [Block Operations](/mindzie_api/notebook/blocks) - Create and manage blocks
- [Template API](/mindzie_api/template) - Create notebooks from templates
- [Execution API](/mindzie_api/execution) - Execute notebooks
---
## Management
Section: Notebooks
URL: https://docs.mindziestudio.com/mindzie_api/notebook/management
Source: /docs-master/mindzieAPI/notebook/management/page.md
# Notebook Management
Full CRUD operations for managing notebooks within investigations. All modification operations automatically load the project into the shared cache.
---
## List Notebooks
**GET** `/api/{tenantId}/{projectId}/notebook/investigation/{investigationId}`
Returns all notebooks within an investigation.
### Path Parameters
| Parameter | Type | Required | Description |
|-----------|------|----------|-------------|
| `tenantId` | GUID | Yes | The tenant identifier |
| `projectId` | GUID | Yes | The project identifier |
| `investigationId` | GUID | Yes | The investigation identifier |
### Response (200 OK)
```json
[
{
"notebookId": "aaaaaaaa-bbbb-cccc-dddd-eeeeeeeeeeee",
"investigationId": "11111111-2222-3333-4444-555555555555",
"name": "Main",
"description": "Primary analysis notebook",
"dateCreated": "2024-01-15T10:30:00Z",
"dateModified": "2024-01-20T14:45:00Z",
"createdBy": "a1b2c3d4-e5f6-7890-abcd-ef1234567890",
"modifiedBy": "a1b2c3d4-e5f6-7890-abcd-ef1234567890",
"notebookType": 0,
"notebookOrder": 1.0,
"lastExecutionDuration": 2.5,
"blockCount": 12
},
{
"notebookId": "bbbbbbbb-cccc-dddd-eeee-ffffffffffff",
"investigationId": "11111111-2222-3333-4444-555555555555",
"name": "Variant Analysis",
"description": "Process variant exploration",
"dateCreated": "2024-01-16T09:00:00Z",
"dateModified": "2024-01-18T11:30:00Z",
"createdBy": "a1b2c3d4-e5f6-7890-abcd-ef1234567890",
"modifiedBy": null,
"notebookType": 0,
"notebookOrder": 2.0,
"lastExecutionDuration": 1.2,
"blockCount": 8
}
]
```
### Error Responses
**Not Found (404)**
```json
{
"Error": "Investigation not found",
"InvestigationId": "11111111-2222-3333-4444-555555555555"
}
```
---
## Get Notebook
**GET** `/api/{tenantId}/{projectId}/notebook/{notebookId}`
Returns detailed information for a specific notebook.
### Path Parameters
| Parameter | Type | Required | Description |
|-----------|------|----------|-------------|
| `tenantId` | GUID | Yes | The tenant identifier |
| `projectId` | GUID | Yes | The project identifier |
| `notebookId` | GUID | Yes | The notebook identifier |
### Response (200 OK)
```json
{
"notebookId": "aaaaaaaa-bbbb-cccc-dddd-eeeeeeeeeeee",
"investigationId": "11111111-2222-3333-4444-555555555555",
"name": "Main",
"description": "Primary analysis notebook",
"dateCreated": "2024-01-15T10:30:00Z",
"dateModified": "2024-01-20T14:45:00Z",
"createdBy": "a1b2c3d4-e5f6-7890-abcd-ef1234567890",
"modifiedBy": "a1b2c3d4-e5f6-7890-abcd-ef1234567890",
"notebookType": 0,
"notebookOrder": 1.0,
"lastExecutionDuration": 2.5,
"blockCount": 12
}
```
---
## Create Notebook
**POST** `/api/{tenantId}/{projectId}/notebook/investigation/{investigationId}`
Creates a new empty notebook in the investigation.
### Path Parameters
| Parameter | Type | Required | Description |
|-----------|------|----------|-------------|
| `tenantId` | GUID | Yes | The tenant identifier |
| `projectId` | GUID | Yes | The project identifier |
| `investigationId` | GUID | Yes | The investigation identifier |
### Request Body
```json
{
"name": "Process Analysis",
"description": "Detailed process analysis workflow",
"notebookType": 0
}
```
### Request Fields
| Field | Type | Required | Description |
|-------|------|----------|-------------|
| `name` | string | Yes | Notebook name (unique within investigation) |
| `description` | string | No | Notebook description |
| `notebookType` | integer | No | Type (0=Standard, default) |
### Response (201 Created)
```json
{
"notebookId": "cccccccc-dddd-eeee-ffff-000000000000",
"investigationId": "11111111-2222-3333-4444-555555555555",
"name": "Process Analysis",
"description": "Detailed process analysis workflow",
"dateCreated": "2024-03-01T10:00:00Z",
"dateModified": "2024-03-01T10:00:00Z",
"createdBy": "a1b2c3d4-e5f6-7890-abcd-ef1234567890",
"modifiedBy": null,
"notebookType": 0,
"notebookOrder": 3.0,
"lastExecutionDuration": 0,
"blockCount": 0
}
```
### Error Responses
**Bad Request (400)**
```json
{
"Error": "Failed to create notebook. The name may already exist in this investigation."
}
```
---
## Create from Template
**POST** `/api/{tenantId}/{projectId}/notebook/investigation/{investigationId}/from-template`
Creates a notebook from a pre-defined template, including all blocks and configurations.
### Path Parameters
| Parameter | Type | Required | Description |
|-----------|------|----------|-------------|
| `tenantId` | GUID | Yes | The tenant identifier |
| `projectId` | GUID | Yes | The project identifier |
| `investigationId` | GUID | Yes | The investigation identifier |
### Request Body
```json
{
"templateId": "aaaaaaaa-bbbb-cccc-dddd-eeeeeeeeeeee",
"name": "Process Discovery Analysis",
"description": "Analysis using Process Discovery template"
}
```
### Request Fields
| Field | Type | Required | Description |
|-------|------|----------|-------------|
| `templateId` | GUID | Yes | Template to use |
| `name` | string | No | Override template name |
| `description` | string | No | Override template description |
### Response (201 Created)
Returns the created notebook with blocks from the template.
### Error Responses
**Not Found (404)**
```json
{
"Error": "Template not found"
}
```
---
## Update Notebook
**PUT** `/api/{tenantId}/{projectId}/notebook/{notebookId}`
Updates notebook metadata. Supports optimistic locking via `DateModified`.
### Path Parameters
| Parameter | Type | Required | Description |
|-----------|------|----------|-------------|
| `tenantId` | GUID | Yes | The tenant identifier |
| `projectId` | GUID | Yes | The project identifier |
| `notebookId` | GUID | Yes | The notebook identifier |
### Request Body
```json
{
"name": "Updated Notebook Name",
"description": "Updated description",
"notebookOrder": 2.5,
"dateModified": "2024-01-20T14:45:00Z"
}
```
### Request Fields
| Field | Type | Required | Description |
|-------|------|----------|-------------|
| `name` | string | Yes | Notebook name |
| `description` | string | No | Notebook description |
| `notebookOrder` | decimal | No | Display order |
| `dateModified` | datetime | No | For optimistic locking |
### Response (200 OK)
Returns the updated notebook.
### Optimistic Locking
If `dateModified` is provided and doesn't match the server's current value, returns 409 Conflict:
```json
{
"Error": "CONFLICT",
"Message": "Notebook was modified by another user since you last fetched it",
"YourDateModified": "2024-01-20T14:45:00Z",
"CurrentDateModified": "2024-01-21T09:30:00Z",
"ModifiedBy": "a1b2c3d4-e5f6-7890-abcd-ef1234567890",
"Resolution": "GET /api/{tenantId}/{projectId}/notebook/{notebookId} to fetch current state, then retry"
}
```
---
## Delete Notebook
**DELETE** `/api/{tenantId}/{projectId}/notebook/{notebookId}`
Permanently deletes a notebook and all its blocks.
### Path Parameters
| Parameter | Type | Required | Description |
|-----------|------|----------|-------------|
| `tenantId` | GUID | Yes | The tenant identifier |
| `projectId` | GUID | Yes | The project identifier |
| `notebookId` | GUID | Yes | The notebook identifier |
### Response (200 OK)
```json
{
"Message": "Notebook successfully deleted",
"NotebookId": "aaaaaaaa-bbbb-cccc-dddd-eeeeeeeeeeee"
}
```
---
## Copy Notebook
**POST** `/api/{tenantId}/{projectId}/notebook/{notebookId}/copy`
Creates a complete copy of a notebook including all blocks. Can copy to the same or different investigation.
### Path Parameters
| Parameter | Type | Required | Description |
|-----------|------|----------|-------------|
| `tenantId` | GUID | Yes | The tenant identifier |
| `projectId` | GUID | Yes | The project identifier |
| `notebookId` | GUID | Yes | Source notebook identifier |
### Request Body
```json
{
"name": "Copy of Main Analysis",
"destinationInvestigationId": "22222222-3333-4444-5555-666666666666"
}
```
### Request Fields
| Field | Type | Required | Description |
|-------|------|----------|-------------|
| `name` | string | No | Name for copy (default: "Copy of {original}") |
| `destinationInvestigationId` | GUID | No | Target investigation (default: same investigation) |
### Response (201 Created)
Returns the newly created notebook copy.
---
## Get Shareable URL
**GET** `/api/{tenantId}/{projectId}/notebook/{notebookId}/url`
Generates a shareable URL for direct access to the notebook in the UI.
### Response (200 OK)
```json
{
"notebookId": "aaaaaaaa-bbbb-cccc-dddd-eeeeeeeeeeee",
"url": "https://your-mindzie-instance.com/investigation/12345678/87654321/11111111/notebook/aaaaaaaa-bbbb-cccc-dddd-eeeeeeeeeeee",
"relativePath": "/investigation/12345678/87654321/11111111/notebook/aaaaaaaa-bbbb-cccc-dddd-eeeeeeeeeeee",
"expiresAt": null
}
```
---
## Implementation Examples
### Python
```python
import requests
BASE_URL = 'https://your-mindzie-instance.com'
TENANT_ID = '12345678-1234-1234-1234-123456789012'
PROJECT_ID = '87654321-4321-4321-4321-210987654321'
class NotebookManager:
def __init__(self, api_key):
self.headers = {
'Authorization': f'Bearer {api_key}',
'Content-Type': 'application/json'
}
def list_notebooks(self, investigation_id):
"""List all notebooks in an investigation."""
url = f'{BASE_URL}/api/{TENANT_ID}/{PROJECT_ID}/notebook/investigation/{investigation_id}'
response = requests.get(url, headers=self.headers)
response.raise_for_status()
return response.json()
def get_notebook(self, notebook_id):
"""Get notebook details."""
url = f'{BASE_URL}/api/{TENANT_ID}/{PROJECT_ID}/notebook/{notebook_id}'
response = requests.get(url, headers=self.headers)
response.raise_for_status()
return response.json()
def create_notebook(self, investigation_id, name, description=None):
"""Create a new notebook."""
url = f'{BASE_URL}/api/{TENANT_ID}/{PROJECT_ID}/notebook/investigation/{investigation_id}'
data = {'name': name, 'description': description}
response = requests.post(url, json=data, headers=self.headers)
response.raise_for_status()
return response.json()
def create_from_template(self, investigation_id, template_id, name=None):
"""Create notebook from template."""
url = f'{BASE_URL}/api/{TENANT_ID}/{PROJECT_ID}/notebook/investigation/{investigation_id}/from-template'
data = {'templateId': template_id, 'name': name}
response = requests.post(url, json=data, headers=self.headers)
response.raise_for_status()
return response.json()
def update_notebook(self, notebook_id, name, description=None, date_modified=None):
"""Update notebook with optimistic locking."""
url = f'{BASE_URL}/api/{TENANT_ID}/{PROJECT_ID}/notebook/{notebook_id}'
data = {'name': name, 'description': description}
if date_modified:
data['dateModified'] = date_modified
response = requests.put(url, json=data, headers=self.headers)
if response.status_code == 409:
conflict = response.json()
raise Exception(f"Conflict: {conflict['Message']}")
response.raise_for_status()
return response.json()
def delete_notebook(self, notebook_id):
"""Delete a notebook."""
url = f'{BASE_URL}/api/{TENANT_ID}/{PROJECT_ID}/notebook/{notebook_id}'
response = requests.delete(url, headers=self.headers)
response.raise_for_status()
return response.json()
def copy_notebook(self, notebook_id, name=None, destination_investigation=None):
"""Copy a notebook."""
url = f'{BASE_URL}/api/{TENANT_ID}/{PROJECT_ID}/notebook/{notebook_id}/copy'
data = {'name': name}
if destination_investigation:
data['destinationInvestigationId'] = destination_investigation
response = requests.post(url, json=data, headers=self.headers)
response.raise_for_status()
return response.json()
# Usage
manager = NotebookManager('your-api-key')
investigation_id = '11111111-2222-3333-4444-555555555555'
# List notebooks
notebooks = manager.list_notebooks(investigation_id)
print(f"Found {len(notebooks)} notebooks")
# Create a notebook
notebook = manager.create_notebook(investigation_id, 'New Analysis', 'My workflow')
print(f"Created notebook: {notebook['notebookId']}")
# Copy the notebook
copy = manager.copy_notebook(notebook['notebookId'], 'Copy of New Analysis')
print(f"Created copy: {copy['notebookId']}")
# Update with optimistic locking
try:
updated = manager.update_notebook(
notebook['notebookId'],
'Renamed Analysis',
date_modified=notebook['dateModified']
)
except Exception as e:
print(f"Update failed: {e}")
```
### JavaScript/Node.js
```javascript
const BASE_URL = 'https://your-mindzie-instance.com';
const TENANT_ID = '12345678-1234-1234-1234-123456789012';
const PROJECT_ID = '87654321-4321-4321-4321-210987654321';
class NotebookManager {
constructor(apiKey) {
this.headers = {
'Authorization': `Bearer ${apiKey}`,
'Content-Type': 'application/json'
};
}
async listNotebooks(investigationId) {
const url = `${BASE_URL}/api/${TENANT_ID}/${PROJECT_ID}/notebook/investigation/${investigationId}`;
const response = await fetch(url, { headers: this.headers });
if (!response.ok) throw new Error(`Failed: ${response.status}`);
return response.json();
}
async createNotebook(investigationId, name, description = null) {
const url = `${BASE_URL}/api/${TENANT_ID}/${PROJECT_ID}/notebook/investigation/${investigationId}`;
const response = await fetch(url, {
method: 'POST',
headers: this.headers,
body: JSON.stringify({ name, description })
});
if (!response.ok) throw new Error(`Failed: ${response.status}`);
return response.json();
}
async updateNotebook(notebookId, name, description = null, dateModified = null) {
const url = `${BASE_URL}/api/${TENANT_ID}/${PROJECT_ID}/notebook/${notebookId}`;
const body = { name, description };
if (dateModified) body.dateModified = dateModified;
const response = await fetch(url, {
method: 'PUT',
headers: this.headers,
body: JSON.stringify(body)
});
if (response.status === 409) {
const conflict = await response.json();
throw new Error(`Conflict: ${conflict.Message}`);
}
if (!response.ok) throw new Error(`Failed: ${response.status}`);
return response.json();
}
async deleteNotebook(notebookId) {
const url = `${BASE_URL}/api/${TENANT_ID}/${PROJECT_ID}/notebook/${notebookId}`;
const response = await fetch(url, {
method: 'DELETE',
headers: this.headers
});
if (!response.ok) throw new Error(`Failed: ${response.status}`);
return response.json();
}
async copyNotebook(notebookId, name = null, destinationInvestigationId = null) {
const url = `${BASE_URL}/api/${TENANT_ID}/${PROJECT_ID}/notebook/${notebookId}/copy`;
const body = {};
if (name) body.name = name;
if (destinationInvestigationId) body.destinationInvestigationId = destinationInvestigationId;
const response = await fetch(url, {
method: 'POST',
headers: this.headers,
body: JSON.stringify(body)
});
if (!response.ok) throw new Error(`Failed: ${response.status}`);
return response.json();
}
}
// Usage
const manager = new NotebookManager('your-api-key');
const investigationId = '11111111-2222-3333-4444-555555555555';
// List notebooks
const notebooks = await manager.listNotebooks(investigationId);
console.log(`Found ${notebooks.length} notebooks`);
// Create and copy
const notebook = await manager.createNotebook(investigationId, 'New Analysis');
const copy = await manager.copyNotebook(notebook.notebookId, 'Copy of Analysis');
```
---
## Best Practices
1. **Auto-Load**: Don't explicitly load projects for notebook CRUD - it's automatic
2. **Optimistic Locking**: Include `dateModified` in updates to detect conflicts
3. **Templates**: Use templates for consistent analysis workflows
4. **Naming**: Use descriptive names unique within each investigation
5. **Cleanup**: Delete unused notebooks to keep investigations organized
---
## Blocks
Section: Notebooks
URL: https://docs.mindziestudio.com/mindzie_api/notebook/blocks
Source: /docs-master/mindzieAPI/notebook/blocks/page.md
# Notebook Block Operations
Create and manage analysis blocks within notebooks. Blocks are the building blocks of analysis workflows.
---
## Block Types
| Type | Description |
|------|-------------|
| `Filter` | Narrow down data to specific cases or events |
| `Calculator` | Compute metrics, durations, and derived values |
| `Opportunity` | Identify improvement opportunities |
| `Insight` | Generate visualizations and statistics |
| `Dashboard` | Create shareable report panels |
| `Alert` | Define monitoring alerts |
---
## List Blocks
**GET** `/api/{tenantId}/{projectId}/notebook/{notebookId}/blocks`
Returns all blocks in a notebook in execution order.
### Path Parameters
| Parameter | Type | Required | Description |
|-----------|------|----------|-------------|
| `tenantId` | GUID | Yes | The tenant identifier |
| `projectId` | GUID | Yes | The project identifier |
| `notebookId` | GUID | Yes | The notebook identifier |
### Response (200 OK)
```json
{
"notebookId": "aaaaaaaa-bbbb-cccc-dddd-eeeeeeeeeeee",
"blocks": [
{
"blockId": "11111111-1111-1111-1111-111111111111",
"blockType": "Filter",
"operatorName": "ActivityFilter",
"name": "Select Key Activities",
"description": "Filter to main process activities",
"parentId": null,
"order": 0,
"configuration": "{\"activities\": [\"Create Order\", \"Approve\", \"Ship\"]}",
"dateCreated": "2024-01-15T10:30:00Z",
"createdBy": "a1b2c3d4-e5f6-7890-abcd-ef1234567890",
"dateModified": "2024-01-15T10:30:00Z",
"isActive": true
},
{
"blockId": "22222222-2222-2222-2222-222222222222",
"blockType": "Calculator",
"operatorName": "DurationCalculator",
"name": "Case Duration",
"description": "Calculate total case duration",
"parentId": "11111111-1111-1111-1111-111111111111",
"order": 0,
"configuration": "{\"unit\": \"days\"}",
"dateCreated": "2024-01-15T10:35:00Z",
"createdBy": "a1b2c3d4-e5f6-7890-abcd-ef1234567890",
"dateModified": "2024-01-15T10:35:00Z",
"isActive": true
}
],
"totalCount": 2
}
```
### Block Fields
| Field | Type | Description |
|-------|------|-------------|
| `blockId` | GUID | Unique block identifier |
| `blockType` | string | Type (Filter, Calculator, etc.) |
| `operatorName` | string | Specific operator name |
| `name` | string | Block display name |
| `description` | string | Block description |
| `parentId` | GUID | Parent block ID (data flows from parent) |
| `order` | integer | Execution order hint |
| `configuration` | string | JSON configuration for the operator |
| `dateCreated` | datetime | Creation timestamp |
| `createdBy` | GUID | Creator user ID |
| `dateModified` | datetime | Last modification timestamp |
| `isActive` | boolean | Whether block is enabled |
---
## Create Block
**POST** `/api/{tenantId}/{projectId}/notebook/{notebookId}/blocks`
Creates a new analysis block in the notebook.
### Path Parameters
| Parameter | Type | Required | Description |
|-----------|------|----------|-------------|
| `tenantId` | GUID | Yes | The tenant identifier |
| `projectId` | GUID | Yes | The project identifier |
| `notebookId` | GUID | Yes | The notebook identifier |
### Request Body
```json
{
"blockType": "Filter",
"operatorName": "ActivityFilter",
"name": "Filter by Status",
"description": "Keep only completed orders",
"configuration": "{\"activities\": [\"Complete\", \"Shipped\"]}",
"insertAfterBlockId": "11111111-1111-1111-1111-111111111111"
}
```
### Request Fields
| Field | Type | Required | Description |
|-------|------|----------|-------------|
| `blockType` | string | No | Type (Filter, Calculator, etc.) Default: Filter |
| `operatorName` | string | Yes | Specific operator to use |
| `name` | string | Yes | Block display name |
| `description` | string | No | Block description |
| `configuration` | string | No | JSON configuration for the operator |
| `insertAfterBlockId` | GUID | No | Insert after this block (default: end) |
### Response (201 Created)
```json
{
"blockId": "33333333-3333-3333-3333-333333333333",
"blockType": "Filter",
"operatorName": "ActivityFilter",
"name": "Filter by Status",
"description": "Keep only completed orders",
"parentId": "11111111-1111-1111-1111-111111111111",
"order": 0,
"configuration": "{\"activities\": [\"Complete\", \"Shipped\"]}",
"dateCreated": "2024-03-01T10:00:00Z",
"createdBy": "a1b2c3d4-e5f6-7890-abcd-ef1234567890",
"dateModified": "2024-03-01T10:00:00Z",
"isActive": true
}
```
---
## Get Block Order
**GET** `/api/{tenantId}/{projectId}/notebook/{notebookId}/blocks/order`
Returns the current execution order of blocks.
### Response (200 OK)
```json
{
"notebookId": "aaaaaaaa-bbbb-cccc-dddd-eeeeeeeeeeee",
"blockCount": 3,
"blockOrder": [
{
"blockId": "11111111-1111-1111-1111-111111111111",
"parentId": null,
"position": 1
},
{
"blockId": "22222222-2222-2222-2222-222222222222",
"parentId": "11111111-1111-1111-1111-111111111111",
"position": 2
},
{
"blockId": "33333333-3333-3333-3333-333333333333",
"parentId": "22222222-2222-2222-2222-222222222222",
"position": 3
}
]
}
```
---
## Reorder Blocks
**PUT** `/api/{tenantId}/{projectId}/notebook/{notebookId}/blocks/order`
Changes the execution order of blocks in the notebook.
### Request Body
```json
{
"blockIds": [
"11111111-1111-1111-1111-111111111111",
"33333333-3333-3333-3333-333333333333",
"22222222-2222-2222-2222-222222222222"
]
}
```
### Request Fields
| Field | Type | Required | Description |
|-------|------|----------|-------------|
| `blockIds` | array | Yes | Block IDs in desired execution order |
### Response (200 OK)
Returns the updated block order.
---
## Block Execution Flow
Blocks form a chain where each block receives data from its parent:
```
[Investigation Start]
|
v
[Filter: Activity Filter] -> Filters to specific activities
|
v
[Calculator: Duration] -> Calculates durations for filtered data
|
v
[Insight: Statistics] -> Generates statistics on calculated data
```
When you reorder blocks, the parent chain is updated automatically.
---
## Implementation Examples
### Python
```python
import requests
import json
BASE_URL = 'https://your-mindzie-instance.com'
TENANT_ID = '12345678-1234-1234-1234-123456789012'
PROJECT_ID = '87654321-4321-4321-4321-210987654321'
class BlockManager:
def __init__(self, api_key):
self.headers = {
'Authorization': f'Bearer {api_key}',
'Content-Type': 'application/json'
}
def list_blocks(self, notebook_id):
"""List all blocks in a notebook."""
url = f'{BASE_URL}/api/{TENANT_ID}/{PROJECT_ID}/notebook/{notebook_id}/blocks'
response = requests.get(url, headers=self.headers)
response.raise_for_status()
return response.json()
def create_block(self, notebook_id, block_type, operator_name, name,
description=None, configuration=None, insert_after=None):
"""Create a new block."""
url = f'{BASE_URL}/api/{TENANT_ID}/{PROJECT_ID}/notebook/{notebook_id}/blocks'
data = {
'blockType': block_type,
'operatorName': operator_name,
'name': name,
'description': description,
'configuration': json.dumps(configuration) if configuration else None,
'insertAfterBlockId': insert_after
}
response = requests.post(url, json=data, headers=self.headers)
response.raise_for_status()
return response.json()
def get_block_order(self, notebook_id):
"""Get current block execution order."""
url = f'{BASE_URL}/api/{TENANT_ID}/{PROJECT_ID}/notebook/{notebook_id}/blocks/order'
response = requests.get(url, headers=self.headers)
response.raise_for_status()
return response.json()
def reorder_blocks(self, notebook_id, block_ids):
"""Reorder blocks in notebook."""
url = f'{BASE_URL}/api/{TENANT_ID}/{PROJECT_ID}/notebook/{notebook_id}/blocks/order'
response = requests.put(url, json={'blockIds': block_ids}, headers=self.headers)
response.raise_for_status()
return response.json()
# Usage
manager = BlockManager('your-api-key')
notebook_id = 'aaaaaaaa-bbbb-cccc-dddd-eeeeeeeeeeee'
# List blocks
blocks = manager.list_blocks(notebook_id)
print(f"Found {blocks['totalCount']} blocks")
# Create a filter block
filter_block = manager.create_block(
notebook_id,
block_type='Filter',
operator_name='ActivityFilter',
name='Select Key Activities',
configuration={'activities': ['Create Order', 'Approve', 'Ship']}
)
print(f"Created filter: {filter_block['blockId']}")
# Create a calculator block after the filter
calc_block = manager.create_block(
notebook_id,
block_type='Calculator',
operator_name='DurationCalculator',
name='Case Duration',
configuration={'unit': 'days'},
insert_after=filter_block['blockId']
)
print(f"Created calculator: {calc_block['blockId']}")
# Check execution order
order = manager.get_block_order(notebook_id)
print(f"Block order: {[b['blockId'] for b in order['blockOrder']]}")
```
### JavaScript/Node.js
```javascript
const BASE_URL = 'https://your-mindzie-instance.com';
const TENANT_ID = '12345678-1234-1234-1234-123456789012';
const PROJECT_ID = '87654321-4321-4321-4321-210987654321';
class BlockManager {
constructor(apiKey) {
this.headers = {
'Authorization': `Bearer ${apiKey}`,
'Content-Type': 'application/json'
};
}
async listBlocks(notebookId) {
const url = `${BASE_URL}/api/${TENANT_ID}/${PROJECT_ID}/notebook/${notebookId}/blocks`;
const response = await fetch(url, { headers: this.headers });
if (!response.ok) throw new Error(`Failed: ${response.status}`);
return response.json();
}
async createBlock(notebookId, blockType, operatorName, name, options = {}) {
const url = `${BASE_URL}/api/${TENANT_ID}/${PROJECT_ID}/notebook/${notebookId}/blocks`;
const body = {
blockType,
operatorName,
name,
description: options.description,
configuration: options.configuration ? JSON.stringify(options.configuration) : null,
insertAfterBlockId: options.insertAfter
};
const response = await fetch(url, {
method: 'POST',
headers: this.headers,
body: JSON.stringify(body)
});
if (!response.ok) throw new Error(`Failed: ${response.status}`);
return response.json();
}
async reorderBlocks(notebookId, blockIds) {
const url = `${BASE_URL}/api/${TENANT_ID}/${PROJECT_ID}/notebook/${notebookId}/blocks/order`;
const response = await fetch(url, {
method: 'PUT',
headers: this.headers,
body: JSON.stringify({ blockIds })
});
if (!response.ok) throw new Error(`Failed: ${response.status}`);
return response.json();
}
}
// Usage
const manager = new BlockManager('your-api-key');
const notebookId = 'aaaaaaaa-bbbb-cccc-dddd-eeeeeeeeeeee';
// List blocks
const blocks = await manager.listBlocks(notebookId);
console.log(`Found ${blocks.totalCount} blocks`);
// Create blocks
const filter = await manager.createBlock(notebookId, 'Filter', 'ActivityFilter', 'Key Activities', {
configuration: { activities: ['Create', 'Approve'] }
});
const calc = await manager.createBlock(notebookId, 'Calculator', 'DurationCalculator', 'Duration', {
insertAfter: filter.blockId
});
```
---
## Best Practices
1. **Block Order Matters**: Data flows from parent to child - plan your workflow
2. **Use Templates**: For complex workflows, create from templates
3. **Configuration JSON**: Store operator-specific settings as JSON strings
4. **InsertAfter**: Use `insertAfterBlockId` to control positioning
5. **Execution**: After creating blocks, execute the notebook to see results


